Embed Size (px)
Citation preview
Physical Properties of Shear Oriented Cocoa
Butter
by
Sarah E. Guthrie
A thesis
presented to the University of Waterloo
in fulfillment of the
thesis requirement for the degree of
Doctor of Philosophy
in
Physics
Waterloo, Ontario, Canada, 2008
©Sarah E. Guthrie 2008

ii
I hereby declare that I am the sole author of this thesis. This is a true copy of the thesis,
including any required final revisions, as accepted by my examiners.
I understand that my thesis may be made electronically available to the public.
iii
ABSTRACT
Cocoa butter is a highly complex system of triacyglycerides which has been
shown to crystallize in a markedly different fashion under the application of shear.
A rheometer insert was developed to enable the intact extraction of sheared
samples for study of melting properties, crystal orientation and breaking stress[1].
Samples were created by ramping from 50°C at three different cooling rates (0.5,
1 and 2°C/min) to three different end point temperatures (16, 18 and 20°C), creating nine
different temperature sets. Viscosities of the cocoa butter samples under shear were
recorded during sample creation and large jumps in viscosity were identified as form II
and form V crystallization. Comparison of crystallization times for the nine different
temperature profiles allowed for the conclusion that over a shear range of 90 – 1000 s-1
there was no further appreciable shear acceleration of the form V transformation for the
16 and 18°C temperatures and only a slight increase up to 500 s-1 for the 20°C
temperature.
Sheared samples were also examined with differential scanning calorimetry.
Samples were examined for peak melting temperature on each of day 0, day 1, day 7 and
day 28. Six of the nine different temperature conditions examined yielded a critical shear
rate, above which the melting points of the samples were dramatically different than for
low shear and no shear samples. For the day 0 and day 1 samples, above 500 s-1 the
melting temperatures were ~2°C higher than for 360 s-1 and below. For the day 7 and day
28 samples, above 500 s-1 the peak melting temperatures were ~2°C lower than for the
lower shear and no shear samples.
iv
The orientation of sheared samples was also examined using x-ray diffraction. In
all of the nine temperature sets, orientation was present for shear rates of 360 s-1 and
higher.
Breaking stress measurements were performed on sheared and non-sheared
samples. These tests showed results remarkably similar to those seen in the DSC tests,
with a critical shear rate existing in six of the nine temperature sets, above which an
increase in the breaking strength occurs.
Examination of samples on either side of the critical shear rate with x-ray
diffraction yielded two distinct x-ray patterns leading to speculation that the application
of high shear rates causes a change in the crystallization of cocoa butter leading to
selective crystallization and the formation of a compositionally different form V crystal
with fewer defects than its lower/no shear counterparts.

v
Acknowledgements
The author would like to gratefully acknowledge the following people for their guidance
and assistance.
Stefan Idziak
Alejandro Marangoni
Gianfranco Mazzanti
James Benson
vi
Table of Contents 1.0 Introduction ______________________________________________ 1
1.1 Background ______________________________________________________ 3
1.2 Rheology________________________________________________________ 23
1.2.1 Fluid Mechanics_______________________________________________ 23
1.2.2 Rheometry ___________________________________________________ 29
1.3 Differential Scanning Calorimetry __________________________________ 30
1.4 X-ray Diffraction_________________________________________________ 32
1.5 Mechanical Properties ____________________________________________ 38
1.5.1 Bending _____________________________________________________ 38
1.5.2 Three Point Bending ___________________________________________ 44
1.5.3 Curved Beams ________________________________________________ 45
2.0 Experiment______________________________________________ 48
2.1 Split Rheometer Couette Cell ______________________________________ 48
2.1.1 Split Couette Cell Design: _______________________________________ 48
2.2.2 Split Couette Experiments: ______________________________________ 56
2.2.3 Split Couette Data:_____________________________________________ 57
2.2 Differential Scanning Calorimetry Measurements _____________________ 82
2.2.1 Differential Scanning Calorimetry Data ____________________________ 84
2.3 X-ray Measurements of Sheared Cocoa Butter _______________________ 100
2.3.1 X-ray Diffraction Data_________________________________________ 102
2.3.2 X-Ray structure examination ____________________________________ 105
vii
2.4 Mechanical Testing ______________________________________________ 113
2.4.1 Mechanical Testing Data ______________________________________ 115
3.0 Discussion______________________________________________ 123
4.0 Conclusions ____________________________________________ 134
Appendix 1: _______________________________________________ 136
Appendix 2: _______________________________________________ 139
Appendix 3: _______________________________________________ 144
Appendix 4: _______________________________________________ 146
Appendix 5: _______________________________________________ 200
References ________________________________________________ 209
viii
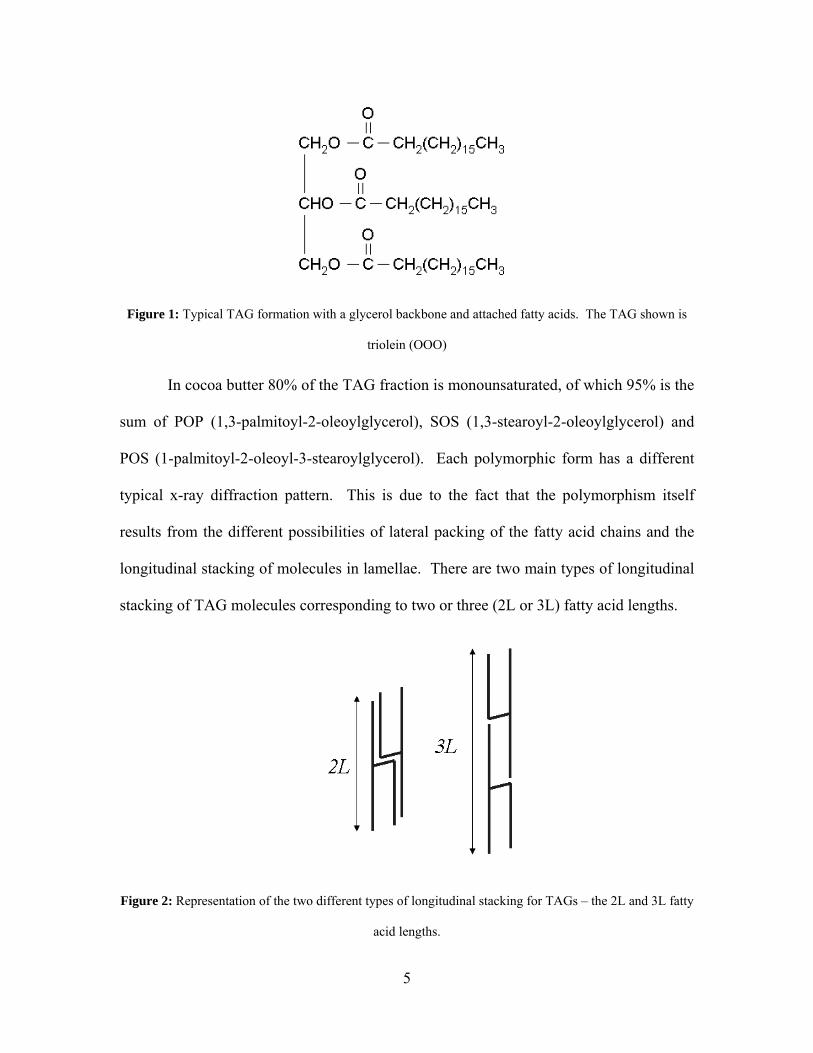
Table of Figures Figure 1: Typical TAG formation with a glycerol backbone and attached fatty acids. The
TAG shown is triolein (OOO)______________________________________________ 5
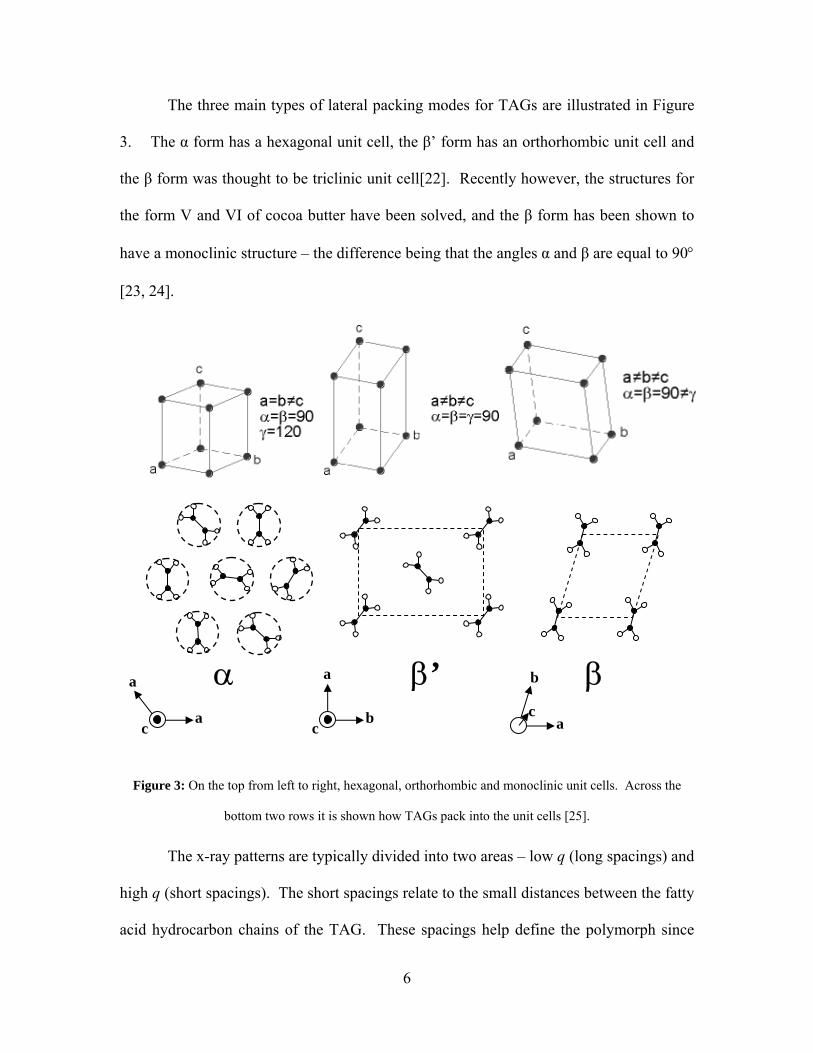
Figure 2: Representation of the two different types of longitudinal stacking for TAGs –
the 2L and 3L fatty acid lengths.____________________________________________ 5
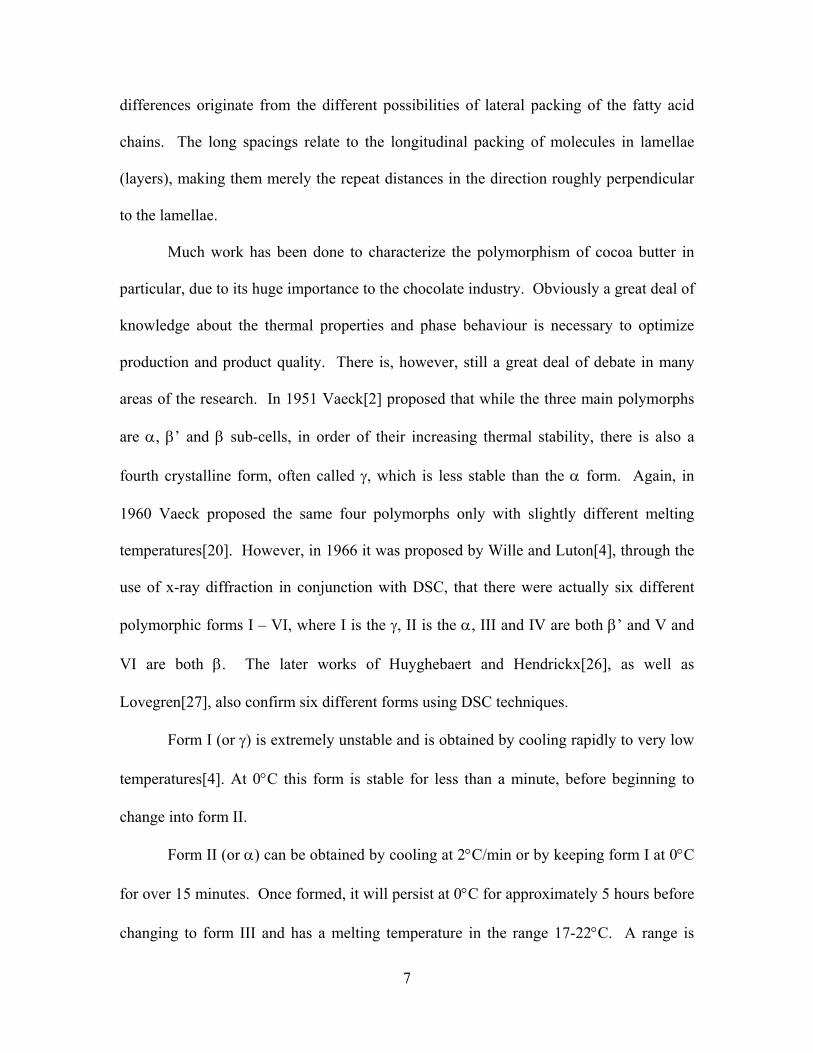
Figure 3: On the top from left to right, hexagonal, orthorhombic and monoclinic unit
cells. Across the bottom two rows it is shown how TAGs pack into the unit cells [25]. _ 6
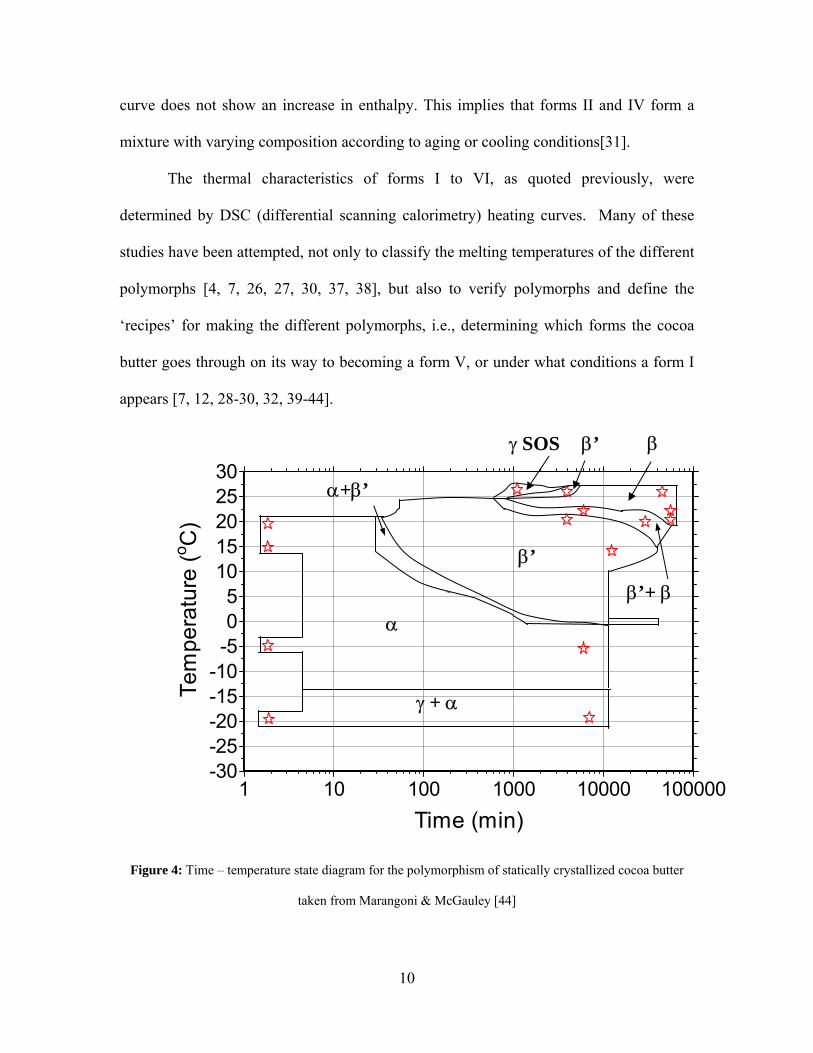
Figure 4: Time – temperature state diagram for the polymorphism of statically
crystallized cocoa butter taken from Marangoni & McGauley [44] _______________ 10
Figure 5: Linear velocity distribution for Newtonian fluids between parallel planes, one
of which moving with velocity U___________________________________________ 23
Figure 6: Three-dimensional stress components on a fluid element _______________ 25
Figure 7: Geometry involved in flow of fluid through two parallel plates __________ 27
Figure 8: Crystal planes diffracting x-rays at angle θ, where the distance A to B is dsinθ
or nλ/2 _______________________________________________________________ 33
Figure 9: X-ray diffraction pattern of the form II (α) structure of cocoa butter in terms of
q____________________________________________________________________ 35
Figure 10: On the left, Figure 5-7 taken from Mazzanti [25] showing a 2-dimensional
diffraction pattern of an oriented sample with the arrow indicating the 0 position and the
direction of the mosaic scan. On the right, a depiction of oriented crystals _________ 36
Figure 11: Diagram depicting diffraction intensity orientation scan ______________ 37
Figure 12: Diagram showing the sample rotation planes of φ and χ_______________ 37
Figure 13: Diagram showing the position of a Full Width Half Maximum (FWHM)
measurement __________________________________________________________ 38
ix
Figure 14: Diagram showing the bending of a beam___________________________ 39
Figure 15: Section of a beam _____________________________________________ 39
Figure 16: Cantilever beam, fixed at one end while a force is applied to bend the other 41
Figure 17: Close-up of three point bending stage with dimensions shown __________ 44
Figure 18: Diagram of a curved beam ______________________________________ 45
Figure 19: (a) A TA Instruments ARES-RFS showing the split Couette attachment
inserted into the water bath and the tool attached to the sensor. (b) and (c) The split
rheometer Couette attachment, shown (b) disassembled and (c) partially assembled. _ 49
Figure 20: The split Couette attachment with a sample of cocoa butter having been
cooled from 50 to 18°C at 0.5°C/min while sheared at 500s-1.____________________ 51
Figure 21: Comparison of crystallization viscosity curves for the split Couette attachment
and the 34mm standard Couette attachment. _________________________________ 53
Figure 22: Figure 6-28 taken from Mazzanti[25] depicting x-ray diffraction data of the α
peak taken in an x-ray accessible couette cell at the slow cooling rate of 0.5 C/min. __ 55
Figure 23: Cocoa butter ramped at 0.5°C/min from 50°C to 16°C whilst sheared in the
split couette rheometer attachment at shear rates of 90 – 1000s-1.________________ 57
Figure 24: Cocoa butter ramped at 0.5°C/min from 50°C to 16°C whilst sheared in the
split couette rheometer attachment at a shear rates of 1000s-1. __________________ 60
Figure 25: Cocoa butter ramped at 1°C/min from 50°C to 16°C whilst sheared in the
split couette rheometer attachment at shear rates of 90 – 1000s-1.________________ 61
Figure 26: Cocoa butter ramped at 2°C/min from 50°C to 16°C whilst sheared in the
split couette rheometer attachment at shear rates of 90 – 1000s-1.________________ 62
x
Figure 27: Cocoa butter ramped at 0.5°C/min from 50°C to 18°C whilst sheared in the
split couette rheometer attachment at shear rates of 90 – 1000s-1.________________ 63
Figure 28: Cocoa butter ramped at 1°C/min from 50°C to 18°C whilst sheared in the
split couette rheometer attachment at shear rates of 90 – 1000s-1.________________ 64
Figure 29: Cocoa butter ramped at 2°C/min from 50°C to 18°C whilst sheared in the
split couette rheometer attachment at shear rates of 90 – 1000s-1.________________ 65
Figure 30: Cocoa butter ramped at 0.5°C/min from 50°C to 20°C whilst sheared in the
split couette rheometer attachment at shear rates of 90 – 1000s-1.________________ 66
Figure 31: Cocoa butter ramped at 1°C/min from 50°C to 20°C whilst sheared in the
split couette rheometer attachment at shear rates of 90 – 1000s-1.________________ 67
Figure 32: Cocoa butter ramped at 2°C/min from 50°C to 20°C whilst sheared in the
split couette rheometer attachment at shear rates of 90 – 1000s-1.________________ 68
Figure 33: Graph of time taken to the onset of α crystallization from the end of a
temperature ramp vs shear rate, for cocoa butter ramped at 0.5°C/min to 16°C( ),
18°C ( ) and 20°C ( ); 1°C/min to 16°C ( ), 18°C ( ) and 20°C
( ); and 2°C/min to 16°C ( ), 18°C ( ) and 20°C ( ) whilst sheared
in the split couette rheometer attachment at shear rates of 90 – 1000s-1 ___________ 71
Figure 34: Graph of time taken from onset of α crystallization to the onset of βV
crystallization vs shear rate for cocoa butter ramped over 9 different cooling profiles of
50°C cooled at 0.5°C/min to 16°C ( ), 18°C ( ) and 20°C ( ); 1°C/min
to 16°C ( ), 18°C ( ) and 20°C ( ); and 2°C/min to 16°C ( ), 18°C
( ) and 20°C ( ) whilst sheared in the split couette rheometer attachment at
shear rates of 90 – 1000s-1_______________________________________________ 73
xi
Figure 35: Figure 6-19 taken from Mazzanti[25] depicting the onset times of βV extracted
from x-ray diffraction data taken in an x-ray accessible couette cell at a cooling rate of
3°C/min. _____________________________________________________________ 74
Figure 36: Graph of viscosity at the onset of βV crystallization vs shear rate for cocoa
butter ramped over 9 different cooling profiles whilst sheared in the split couette
rheometer attachment at shear rates of 90 – 1000 s-1. _________________________ 76
Figure 37: Graph of viscosity at the onset of βV crystallization vs shear rate for cocoa
butter ramped from 50-15°C at 1°C/min and 2°C /min whilst sheared in the split couette
rheometer attachment at shear rates of 90 – 1000s-1. __________________________ 78
Figure 38: Three repeated data runs of cocoa butter ramped at 0.5°C/min from 50°C to
20°C whilst sheared in the split couette rheometer attachment at a shear rate of 720s-1
illustrating deviations in repeatability.______________________________________ 79
Figure 39: Three repeated data runs of cocoa butter ramped at 1°C/min from 50°C to
20°C whilst sheared in the split couette rheometer attachment at a shear rate of 1000s-1
illustrating deviations in repeatability ______________________________________ 80
Figure 40: Diagram showing location of the DSC samples in relation to cocoa butter
cylinder ______________________________________________________________ 82
Figure 41: Depiction of the size and placement of a cocoa butter sample in a DSC pan.83
Figure 42: Differential scanning calorimetry graph of heat flow(W/g) vs temperature
(°C) for a sample of cocoa butter created under a shear rate of 1000s-1 whilst cooled
from 50-16°C in 2°C/min and stored for 28 days at 16°C. ______________________ 84
xii
Figure 43: Graph showing peak melting temperature extracted from DSC melting curves
for a sample of cocoa butter created under shear rates of 0-1000s-1 whilst cooled from
50-16°C in 0.5°C/min ___________________________________________________ 86
Figure 44: Graph showing peak melting temperature extracted from DSC melting curves
for a sample of cocoa butter created under shear rates of 0-1000s-1 whilst cooled from
50-16°C in 1°C/min ____________________________________________________ 87
Figure 45: Graph showing peak melting temperature extracted from DSC melting curves
for a sample of cocoa butter created under shear rates of 0-1000s-1 whilst cooled from
50-16°C in 2°C/min ____________________________________________________ 88
Figure 46: Graph showing peak melting temperature extracted from DSC melting curves
for a sample of cocoa butter created under shear rates of 0-1000s-1 whilst cooled from
50-18°C in 0.5°C/min ___________________________________________________ 89
Figure 47: Graph showing peak melting temperature extracted from DSC melting curves
for a sample of cocoa butter created under shear rates of 0-1000s-1 whilst cooled from
50-18°C in 1°C/min ____________________________________________________ 90
Figure 48: Graph showing peak melting temperature extracted from DSC melting curves
for a sample of cocoa butter created under shear rates of 0-1000s-1 whilst cooled from
50-18°C in 2°C/min ____________________________________________________ 91
Figure 49 Graph showing peak melting temperature extracted from DSC melting curves
for a sample of cocoa butter created under shear rates of 0-1000s-1 whilst cooled from
50-20°C in 0.5°C/min ___________________________________________________ 92
xiii
Figure 50: Graph showing peak melting temperature extracted from DSC melting curves
for a sample of cocoa butter created under shear rates of 0-1000s-1 whilst cooled from
50-20°C in 1°C/min ____________________________________________________ 93
Figure 51: Graph showing peak melting temperature extracted from DSC melting curves
for a sample of cocoa butter created under shear rates of 0-1000s-1 whilst cooled from
50-20°C in 2°C/min ____________________________________________________ 94
Figure 52: Figure depicting the occurrence of a shear transition in the DSC data. ( )
represents no transition in a given data set, while ( ) represents a transition occurring.
_____________________________________________________________________ 95
Figure 53: Heat flow vs temperature taken on day 0 for cocoa butter sheared at 360 and
500 s-1 whilst ramped from 50-20°C at 2°C/min ______________________________ 96
Figure 54: Heat flow vs temperature taken on day 28 for cocoa butter sheared at 360 and
500 s-1 whilst ramped from 50-20°C at 2°C/min ______________________________ 97
Figure 55: Graph showing x-ray intensity values as a function of Phi rotation for a 1mm2
piece of cocoa butter created in the split couette attachment by ramping from 50-20°C in
2°C/min, whilst shearing at 1000s-1 _______________________________________ 101
Figure 56: Orientation FWHM of phi scans done of cocoa butter ramped from 50-16°C
at 0.5, 1 and 2°C/min whilst sheared at 0 – 1000s-1. Data points not shown do not have
orientation. __________________________________________________________ 103
Figure 57: Orientation FWHM of phi scans done of cocoa butter ramped from 50-18°C
at 0.5, 1 and 2°C/min whilst sheared at 0 – 1000s-1. Data points not shown do not have
orientation. __________________________________________________________ 104
xiv
Figure 58: Orientation FWHM of phi scans done of cocoa butter ramped from 50-20°C
at 0.5, 1 and 2°C/min whilst sheared at 0 – 1000s-1. Data points not shown do not have
orientation. __________________________________________________________ 105
Figure 59: X-Ray diffraction patterns in q of a capillary of a chopped sample of cocoa
butter created with a temperature ramp from 50-20°C in 1°C/min whilst shearing at
360s-1 on each of day 1, day 8 and day 34.__________________________________ 106
Figure 60: X-Ray diffraction patterns in q of a capillary of a chopped sample of cocoa
butter created with a temperature ramp from 50-20°C in 1°C/min whilst shearing at
500s-1 on each of day 1, day 8 and day 33.__________________________________ 107
Figure 61: Comparison of x-ray diffraction patterns in q of a capillary of a chopped
sample of cocoa butter created with a temperature ramp from 50-20°C in 1°C/min whilst
shearing at 360s-1 and 500s-1 on day 34 and 33 respectively. ___________________ 108
Figure 62: Comparison of form V and VI high resolution x-ray patterns taken from
Guthrie et al. [84] _____________________________________________________ 109
Figure 63: Form V and VI high resolution x-ray patterns taken from Guthrie et al. [84]
and convoluted with a Gaussian of FWHM 0.01 to effectively decrease the resolution of
the x-ray patterns _____________________________________________________ 111
Figure 64: Figure showing x-ray diffraction patterns in q of a capillary of a chopped
sample of cocoa butter created with a temperature ramp from 50-20°C in 1°C/min whilst
shearing at 500s-1 on day 33 compared with a fit line generated from a combination of
70%βV and 30% βVI .___________________________________________________ 112
Figure 65: Three point bending apparatus. _________________________________ 113
Figure 66: Sample force versus position graph for 50-20°C in 2°C/min at 1000s-1 __ 114
xv
Figure 67: Graph showing peak breaking stress values for a sample of cocoa butter
created under shear rates of 0 – 1000s-1 whilst cooled from 50-16°C at 0.5, 1 and
2°C/min _____________________________________________________________ 116
Figure 68: Graph showing peak breaking stress values for a sample of cocoa butter
created under shear rates of 0 – 1000s-1 whilst cooled from 50-18°C at 0.5, 1 and
2°C/min _____________________________________________________________ 117
Figure 69: Graph showing peak breaking stress values for a sample of cocoa butter
created under shear rates of 0 – 1000s-1 whilst cooled from 50-20°C at 0.5, 1 and
2°C/min _____________________________________________________________ 118
Figure 70: Diagram showing orientation of cocoa butter cylinder section in 3-point
bending apparatus ____________________________________________________ 119
Figure 71: Graph showing Young’s Modulus values for a sample of cocoa butter created
under shear rates of 0 – 1000s-1 whilst cooled from 50-16°C at 0.5, 1 and 2°C/min__ 120
Figure 72: Graph showing Young’s Modulus values for a sample of cocoa butter created
under shear rates of 0 – 1000s-1 whilst cooled from 50-18°C at 0.5, 1 and 2°C/min__ 121
Figure 73: Graph showing Young’s Modulus values for a sample of cocoa butter created
under shear rates of 0 – 1000s-1 whilst cooled from 50-20°C at 0.5, 1 and 2°C/min__ 122
Figure 74: Diagram depicting theory of critical shear rate above which all α crystals
melt leaving βV free to have a completely uniform, defect free microstructure ______ 127
Figure 75: Figure 6-17 taken from Mazzanti showing FWHM data extracted from
diffraction images of form V taken in an x-ray accessible shear cell at a cooling rate of
3°C/min showing the FWHM decreasing with shear.__________________________ 129
xvi
Figure 76: Micrographs of cocoa butter crystallized from 50-20°C in 2°C/min at a) 360s-
1 and b) 500s-1 ________________________________________________________ 130
Figure 77: Differential scanning calorimetry graph of heat flow(W/g) vs temperature
(°C) for a sample of cocoa butter created under a shear rate of 500s-1 whilst cooled from
50-20°C in 2°C/min and stored for 2 years at 20°C. __________________________ 132
Figure 78: Syncrotron x-ray diffraction data of cocoa butter in a form II crystal structure
____________________________________________________________________ 139
Figure 79: Syncrotron x-ray diffraction data of cocoa butter in a form III crystal
structure ____________________________________________________________ 140
Figure 80: Syncrotron x-ray diffraction data of cocoa butter in a form IV crystal
structure ____________________________________________________________ 141
Figure 81: Syncrotron x-ray diffraction data of cocoa butter in a form V crystal structure
____________________________________________________________________ 142
Figure 82: Syncrotron x-ray diffraction data of cocoa butter in a form VI crystal
structure ____________________________________________________________ 143
Figure 83: Graph showing temperature corresponding to Figure 29 for cocoa butter
ramped at 2°C/min from 50-18°C at a shear rate of 90, 360, 500 and 1000s-1 ______ 145
Figure 84: Heat flow curves of samples created by being cooled from 50 to 16°C at
0.5°C/min whilst shearing at a rate of 90s-1. The four graphs shown are sample
repetitions carried out on day 0, day 1, day 7 and day 28. _____________________ 146
Figure 85: Heat flow curves of samples created by being cooled from 50 to 16°C at
0.5°C/min whilst shearing at a rate of 180s-1. The four graphs shown are sample
repetitions carried out on day 0, day 1, day 7 and day 28. _____________________ 147

xvii
Figure 86: Heat flow curves of samples created by being cooled from 50 to 16°C at
0.5°C/min whilst shearing at a rate of 360s-1. The four graphs shown are sample
repetitions carried out on day 0, day 1, day 7 and day 28. _____________________ 148
Figure 87: Heat flow curves of samples created by being cooled from 50 to 16°C at
0.5°C/min whilst shearing at a rate of 500s-1. The four graphs shown are sample
repetitions carried out on day 0, day 1, day 7 and day 28. _____________________ 149
Figure 88: Heat flow curves of samples created by being cooled from 50 to 16°C at
0.5°C/min whilst shearing at a rate of 720s-1. The four graphs shown are sample
repetitions carried out on day 0, day 1, day 7 and day 28. _____________________ 150
Figure 89: Heat flow curves of samples created by being cooled from 50 to 16°C at
0.5°C/min whilst shearing at a rate of 1000s-1. The four graphs shown are sample
repetitions carried out on day 0, day 1, day 7 and day 28. _____________________ 151
Figure 90: Heat flow curves of samples created by being cooled from 50 to 16°C at
1°C/min whilst shearing at a rate of 90s-1. The four graphs shown are sample repetitions
carried out on day 0, day 1, day 7 and day 28._______________________________ 152
Figure 91: Heat flow curves of samples created by being cooled from 50 to 16°C at
1°C/min whilst shearing at a rate of 180s-1. The four graphs shown are sample
repetitions carried out on day 0, day 1, day 7 and day 28. _____________________ 153
Figure 92: Heat flow curves of samples created by being cooled from 50 to 16°C at
1°C/min whilst shearing at a rate of 360s-1. The four graphs shown are sample
repetitions carried out on day 0, day 1, day 7 and day 28. _____________________ 154
xviii
Figure 93: Heat flow curves of samples created by being cooled from 50 to 16°C at
1°C/min whilst shearing at a rate of 500s-1. The four graphs shown are sample
repetitions carried out on day 0, day 1, day 7 and day 28. _____________________ 155
Figure 94: Heat flow curves of samples created by being cooled from 50 to 16°C at
1°C/min whilst shearing at a rate of 720s-1. The four graphs shown are sample
repetitions carried out on day 0, day 1, day 7 and day 28. _____________________ 156
Figure 95: Heat flow curves of samples created by being cooled from 50 to 16°C at
1°C/min whilst shearing at a rate of 1000s-1. The four graphs shown are sample
repetitions carried out on day 0, day 1, day 7 and day 28. _____________________ 157
Figure 96: Heat flow curves of samples created by being cooled from 50 to 18°C at
0.5°C/min whilst shearing at a rate of 90s-1. The four graphs shown are sample
repetitions carried out on day 0, day 1, day 7 and day 28. _____________________ 158
Figure 97: Heat flow curves of samples created by being cooled from 50 to 18°C at
0.5°C/min whilst shearing at a rate of 180s-1. The four graphs shown are sample
repetitions carried out on day 0, day 1, day 7 and day 28. _____________________ 159
Figure 98: Heat flow curves of samples created by being cooled from 50 to 18°C at
0.5°C/min whilst shearing at a rate of 360s-1. The four graphs shown are sample
repetitions carried out on day 0, day 1, day 7 and day 28. _____________________ 160
Figure 99: Heat flow curves of samples created by being cooled from 50 to 18°C at
0.5°C/min whilst shearing at a rate of 500s-1. The four graphs shown are sample
repetitions carried out on day 0, day 1 and day 28. ___________________________ 161
xix
Figure 100: Heat flow curves of samples created by being cooled from 50 to 18°C at
0.5°C/min whilst shearing at a rate of 720s-1. The four graphs shown are sample
repetitions carried out on day 0, day 1, day 7 and day 28. _____________________ 162
Figure 101: Heat flow curves of samples created by being cooled from 50 to 18°C at
0.5°C/min whilst shearing at a rate of 1000s-1. The four graphs shown are sample
repetitions carried out on day 0, day 1, day 7 and day 28. _____________________ 163
Figure 102: Heat flow curves of samples created by being cooled from 50 to 20°C at
0.5°C/min whilst shearing at a rate of 90s-1. The four graphs shown are sample
repetitions carried out on day 0, day 7 and day 28. ___________________________ 164
Figure 103: Heat flow curves of samples created by being cooled from 50 to 20°C at
0.5°C/min whilst shearing at a rate of 180s-1. The four graphs shown are sample
repetitions carried out on day 0, day 1, day 7 and day 28. _____________________ 165
Figure 104: Heat flow curves of samples created by being cooled from 50 to 20°C at
0.5°C/min whilst shearing at a rate of 360s-1. The four graphs shown are sample
repetitions carried out on day 0, day 1, day 7 and day 28. _____________________ 166
Figure 105: Heat flow curves of samples created by being cooled from 50 to 20°C at
0.5°C/min whilst shearing at a rate of 500s-1. The four graphs shown are sample
repetitions carried out on day 0, day 1, day 7 and day 28. _____________________ 167
Figure 106: Heat flow curves of samples created by being cooled from 50 to 20°C at
0.5°C/min whilst shearing at a rate of 720s-1. The four graphs shown are sample
repetitions carried out on day 0, day 1, day 7 and day 28. _____________________ 168
xx
Figure 107: Heat flow curves of samples created by being cooled from 50 to 20°C at
0.5°C/min whilst shearing at a rate of 1000s-1. The four graphs shown are sample
repetitions carried out on day 0, day 1, day 7 and day 28. _____________________ 169
Figure 108: Heat flow curves of samples created by being cooled from 50 to 18°C at
1°C/min whilst shearing at a rate of 90s-1. The four graphs shown are sample repetitions
carried out on day 0, day 1, day 7 and day 28._______________________________ 170
Figure 109: Heat flow curves of samples created by being cooled from 50 to 18°C at
1°C/min whilst shearing at a rate of 180s-1. The four graphs shown are sample
repetitions carried out on day 0, day 1, day 7 and day 28. _____________________ 171
Figure 110: Heat flow curves of samples created by being cooled from 50 to 18°C at
1°C/min whilst shearing at a rate of 360s-1. The four graphs shown are sample
repetitions carried out on day 0, day 1, day 7 and day 28. _____________________ 172
Figure 111: Heat flow curves of samples created by being cooled from 50 to 18°C at
1°C/min whilst shearing at a rate of 500s-1. The four graphs shown are sample
repetitions carried out on day 0, day 1, day 7 and day 28. _____________________ 173
Figure 112: Heat flow curves of samples created by being cooled from 50 to 18°C at
1°C/min whilst shearing at a rate of 720s-1. The four graphs shown are sample
repetitions carried out on day 0, day 1, day 7 and day 28. _____________________ 174
Figure 113: Heat flow curves of samples created by being cooled from 50 to 18°C at
1°C/min whilst shearing at a rate of 1000s-1. The four graphs shown are sample
repetitions carried out on day 0, day 1, day 7 and day 28. _____________________ 175
xxi
Figure 114: Heat flow curves of samples created by being cooled from 50 to 20°C at
1°C/min whilst shearing at a rate of 90s-1. The four graphs shown are sample repetitions
carried out on day 0, day 1, day 7 and day 28._______________________________ 176
Figure 115: Heat flow curves of samples created by being cooled from 50 to 20°C at
1°C/min whilst shearing at a rate of 180s-1. The four graphs shown are sample
repetitions carried out on day 0, day 1, day 7 and day 28. _____________________ 177
Figure 116: Heat flow curves of samples created by being cooled from 50 to 20°C at
1°C/min whilst shearing at a rate of 360s-1. The four graphs shown are sample
repetitions carried out on day 0, day 1, day 7 and day 28. _____________________ 178
Figure 117: Heat flow curves of samples created by being cooled from 50 to 20°C at
1°C/min whilst shearing at a rate of 500s-1. The four graphs shown are sample
repetitions carried out on day 0, day 1, day 7 and day 28. _____________________ 179
Figure 118: Heat flow curves of samples created by being cooled from 50 to 20°C at
1°C/min whilst shearing at a rate of 720s-1. The four graphs shown are sample
repetitions carried out on day 0, day 1, day 7 and day 28. _____________________ 180
Figure 119: Heat flow curves of samples created by being cooled from 50 to 20°C at
1°C/min whilst shearing at a rate of 1000s-1. The four graphs shown are sample
repetitions carried out on day 0, day 1, day 7 and day 28. _____________________ 181
Figure 120: Heat flow curves of samples created by being cooled from 50 to 16°C at
2°C/min whilst shearing at a rate of 90s-1. The four graphs shown are sample repetitions
carried out on day 0, day 1, day 7 and day 28._______________________________ 182
xxii
Figure 121: Heat flow curves of samples created by being cooled from 50 to 16°C at
2°C/min whilst shearing at a rate of 180s-1. The four graphs shown are sample
repetitions carried out on day 0, day 1, day 7 and day 28. _____________________ 183
Figure 122: Heat flow curves of samples created by being cooled from 50 to 16°C at
2°C/min whilst shearing at a rate of 360s-1. The four graphs shown are sample
repetitions carried out on day 0, day 1, day 7 and day 28. _____________________ 184
Figure 123: Heat flow curves of samples created by being cooled from 50 to 16°C at
2°C/min whilst shearing at a rate of 500s-1. The four graphs shown are sample
repetitions carried out on day 0, day 1, day 7 and day 28. _____________________ 185
Figure 124: Heat flow curves of samples created by being cooled from 50 to 16°C at
2°C/min whilst shearing at a rate of 720s-1. The four graphs shown are sample
repetitions carried out on day 0, day 1, day 7 and day 28. _____________________ 186
Figure 125: Heat flow curves of samples created by being cooled from 50 to 16°C at
2°C/min whilst shearing at a rate of 1000s-1. The four graphs shown are sample
repetitions carried out on day 0, day 1, day 7 and day 28. _____________________ 187
Figure 126: Heat flow curves of samples created by being cooled from 50 to 18°C at
2°C/min whilst shearing at a rate of 90s-1. The four graphs shown are sample repetitions
carried out on day 0, day 1, day 7 and day 28._______________________________ 188
Figure 127: Heat flow curves of samples created by being cooled from 50 to 18°C at
2°C/min whilst shearing at a rate of 180s-1. The four graphs shown are sample
repetitions carried out on day 0, day 1, day 7 and day 28. _____________________ 189
xxiii
Figure 128: Heat flow curves of samples created by being cooled from 50 to 18°C at
2°C/min whilst shearing at a rate of 360s-1. The four graphs shown are sample
repetitions carried out on day 0, day 1, day 7 and day 28. _____________________ 190
Figure 129: Heat flow curves of samples created by being cooled from 50 to 18°C at
2°C/min whilst shearing at a rate of 500s-1. The four graphs shown are sample
repetitions carried out on day 0, day 1, day 7 and day 28. _____________________ 191
Figure 130: Heat flow curves of samples created by being cooled from 50 to 18°C at
2°C/min whilst shearing at a rate of 720s-1. The four graphs shown are sample
repetitions carried out on day 0, day 1, day 7 and day 28. _____________________ 192
Figure 131: Heat flow curves of samples created by being cooled from 50 to 18°C at
2°C/min whilst shearing at a rate of 1000s-1. The four graphs shown are sample
repetitions carried out on day 0, day 1, day 7 and day 28. _____________________ 193
Figure 132: Heat flow curves of samples created by being cooled from 50 to 20°C at
2°C/min whilst shearing at a rate of 90s-1. The four graphs shown are sample repetitions
carried out on day 0, day 1, day 7 and day 28._______________________________ 194
Figure 133: Heat flow curves of samples created by being cooled from 50 to 20°C at
2°C/min whilst shearing at a rate of 180s-1. The four graphs shown are sample
repetitions carried out on day 0, day 1, day 7 and day 28. _____________________ 195
Figure 134: Heat flow curves of samples created by being cooled from 50 to 20°C at
2°C/min whilst shearing at a rate of 360s-1. The four graphs shown are sample
repetitions carried out on day 0, day 1, day 7 and day 28. _____________________ 196
xxiv
Figure 135: Heat flow curves of samples created by being cooled from 50 to 20°C at
2°C/min whilst shearing at a rate of 500s-1. The four graphs shown are sample
repetitions carried out on day 0, day 1, day 7 and day 28. _____________________ 197
Figure 136: Heat flow curves of samples created by being cooled from 50 to 20°C at
2°C/min whilst shearing at a rate of 720s-1. The four graphs shown are sample
repetitions carried out on day 0, day 1, day 7 and day 28. _____________________ 198
Figure 137: Heat flow curves of samples created by being cooled from 50 to 20°C at
2°C/min whilst shearing at a rate of 1000s-1. The four graphs shown are sample
repetitions carried out on day 0, day 1, day 7 and day 28. _____________________ 199
Figure 138: Graph showing enthalpy values extracted from DSC melting curves for a
sample of cocoa butter created under shear rates of 0-1000s-1 whilst cooled from 50-
16°C in 0.5°C/min_____________________________________________________ 200
Figure 139: Graph showing enthalpy values extracted from DSC melting curves for a
sample of cocoa butter created under shear rates of 0-1000s-1 whilst cooled from 50-
16°C in 1°C/min ______________________________________________________ 201
Figure 140: Graph showing enthalpy values extracted from DSC melting curves for a
sample of cocoa butter created under shear rates of 0-1000s-1 whilst cooled from 50-
16°C in 2°C/min ______________________________________________________ 202
Figure 141: Graph showing enthalpy values extracted from DSC melting curves for a
sample of cocoa butter created under shear rates of 0-1000s-1 whilst cooled from 50-
18°C in 0.5°C/min_____________________________________________________ 203
xxv
Figure 142: Graph showing enthalpy values extracted from DSC melting curves for a
sample of cocoa butter created under shear rates of 0-1000s-1 whilst cooled from 50-
18°C in 1°C/min ______________________________________________________ 204
Figure 143: Graph showing enthalpy values extracted from DSC melting curves for a
sample of cocoa butter created under shear rates of 0-1000s-1 whilst cooled from 50-
18°C in 2°C/min ______________________________________________________ 205
Figure 144: Graph showing enthalpy values extracted from DSC melting curves for a
sample of cocoa butter created under shear rates of 0-1000s-1 whilst cooled from 50-
20°C in 0.5°C/min_____________________________________________________ 206
Figure 145: Graph showing enthalpy values extracted from DSC melting curves for a
sample of cocoa butter created under shear rates of 0-1000s-1 whilst cooled from 50-
20°C in 1°C/min ______________________________________________________ 207
Figure 146: Graph showing enthalpy values extracted from DSC melting curves for a
sample of cocoa butter created under shear rates of 0-1000s-1 whilst cooled from 50-
20°C in 2°C/min ______________________________________________________ 208
xxvii
Glossary:
α form II a width of beam m β Form V and VI b distance between plates m β’ forms III and IV β-MPT (β-memory point temperature βV form V CS Heat capacity J/(kg°C)d interplanar spacing Å DSC Differential Scanning Calorimeter Ey(z) Young's modulus Pa Φ real heat flow J/s F Force N FWHM Full width at half maximum degrees γ form I γ& shear rate s-1 g gravity m/s2 h distance between two plates/2 m I intensity of transmitted beam I geometric moment of inertia kg m2 Io intensity of the incident beam λ Wavelength Å L length of beam m µ linear absorption coefficient 1/m M bending moment Nm P Pressure POP 1,3-palmitoyl-2-oleoylglycerol POS 1-palmitoyl-2-oleoyl-3-stearoylglycerol q scattering angle in reciprocal space Å -1 θ scattering angle degrees SOS 1,3-stearoyl-2-oleoylglycerol τ shear stress N/m2 T Temperature C t thickness of beam m TAG triacyglycerol U velocity of upper plate m/s u X component of velocity m/s v Y component of velocity m/s
xxviii
w Z component of velocity m/s ω angular velocity rad/s x thickness which x-ray beam passes through m y position in y axis
z distance of element section dz from neutral plane. m
η Visocisty Pa s ρ radius of curvature m σ normal stress Pa
1
1.0 Introduction
Cocoa butter, a highly complex system of triacyglyerols and other more minor
components, has the distinction of being the main ingredient in one of the world’s most
beloved foods – chocolate. As such, there has been a great deal of research into its
properties, both thermal and sensory. Published works date back to the early 1900s
classifying up to six different polymorphic forms by means of thermal and x-ray analysis
[2-7]. These different crystallographic structures vary in stability with the material
gradually transitioning through unstable, lower melting temperature polymorphs over
time to reach more stable forms.
The most favorable polymorphic form of cocoa butter for chocolate is called the
form V polymorph. It will produce chocolate with a suitable melting temperature, high
gloss and good snap[8]. Cocoa butter will reach the form V state if crystallized from the
melt and left alone at room temperature, but it will take days and the size of the crystals
formed will be very large. Chocolatiers know that stirring (the application of shear),
along with a heating and cooling cycle will help the chocolate to enter a form V structure
much more quickly. It is only in more recent times, however, that this qualitative
knowledge has been quantified analytically[9-18].
It has been demonstrated through the use of x-ray accessible shear cells that the
application of shear during a cooling ramp does indeed cause cocoa butter to accelerate
its transition into the more stable form V structure[10, 11]. However, the shear rates and
temperature ramps employed in some of these studies have differed considerably from
those generally used for production purposes. That fact, as well as the use of x-ray
diffraction, has led to the discovery that under certain conditions the cocoa butter
2
crystallites can be induced to align with one another, creating an oriented crystalline
material[10]. Up to a point, the higher the shear rate, the higher the degree of orientation.
Thus, while the creation of a form V structure in a considerably reduced time
would be very desirable, the effect of crystal orientation on the morphology and
mechanical properties of a chocolate product is unknown.
Up to this point shear cells used to create aligned cocoa butter samples did not
allow for samples to be extracted without melting. Therefore in order to investigate this
shear induced orientation, a Couette insert for a rheometer was designed to be capable of
splitting into two pieces, allowing for the intact extraction of a crystallized oriented
sample[1].
During sample creation in the rheometer, viscosity data for a large number of
shear rates, cooling rates and end point temperatures can be recorded. The viscosity data
can be used to further examine the shear acceleration effect over a large range of
temperature conditions and elucidate the effect of shear on the acceleration of the phase
transformation. Once the sample is removed intact, pieces of it can be analyzed for
melting temperature by using a differential scanning calorimeter, and then the orientation
of all of the planes can be examined using x-ray diffraction techniques. The breaking
stress of the samples can also be tested by use of a three-point bending apparatus.
In this way, the effects of orientation and shear on the physical properties of
cocoa butter can be examined.
In this thesis background material on the composition and structure of cocoa
butter as well as a brief survey of the literature in the field is presented, as well as
3
summaries of the relevant techniques of rheology, differential scanning calorimetry, x-ray
diffraction and three-point bending.
A presentation and discussion of viscosity data attained in the split couette cell
leads the results section. The samples are cooled from 50°C to 16, 18 or 20°C at 0.5, 1 or
2°C/min, creating nine different temperature conditions.
This is followed by peak melting temperature analysis over a period of 28 days.
Melting temperature data for each shear rate is presented for day 0, day 1, day 7 and day
28 for each temperature condition.
The melting data is followed by the x-ray orientation studies, x-ray diffraction
patterns of low and high shear samples and finally the peak breaking stress data.
A summary of the work and discussion of its implications and resulting working
theories concludes the thesis.
1.1 Background
Interest in chocolate has been ongoing for over three millennia, yet the
understanding of the physical structure of cocoa butter, its main component, is in its
infancy. Since techniques of chocolate manufacture have been guarded with the utmost
secrecy, it is difficult to gauge what is known and when the knowledge was acquired.
Published works date back to as early as 1900, when it was noted that there are
large variations in melting temperature[19]. By 1940 it was known that cocoa butter has
at least one stable and one unstable form[20]. Up to that point, the concept of studying a
system of pure components to better understand the behaviour of cocoa butter had not
been developed. However, parallel investigations into pure triacyglycerols, the main
4
component of cocoa butter, had been underway for some time. In fact, as far back as
1852, three different forms were reported for tristearin as well as other glycerides[21].
It is well known that the physical and chemical properties of vegetable fats
principally depend on their triacyglycerol (TAG) components. The TAG composition, in
conjunction with hydrocarbon chain length, fatty acids saturation and melting point give
rise to a highly complex thermal behaviour.
Melting and crystallization of fats are phase transitions and for a fat such as cocoa
butter the transition is generally explained in terms of fat polymorphism. Polymorphism
in fats is defined as the capacity of the lipids to crystallize into several forms differing in
structure and melting temperature.
Polymorphic variability of lipids, TAG in particular, is quite diverse. Generally, a
simple, broad classification can be made according to three main forms, usually given as
α, β and β’. It has also been found, however, that there are some cases where additional
classification of a low stability form γ occurs, as well as subclasses of structures within a
main form e.g. β1 and β2. Formation of these polymorphs for a given lipid material is
mainly dependent on the temperature at which crystallization takes place, although other
factors such as shear, cooling rate and fat content also play a role.
5
Figure 1: Typical TAG formation with a glycerol backbone and attached fatty acids. The TAG shown is
triolein (OOO)
In cocoa butter 80% of the TAG fraction is monounsaturated, of which 95% is the
sum of POP (1,3-palmitoyl-2-oleoylglycerol), SOS (1,3-stearoyl-2-oleoylglycerol) and
POS (1-palmitoyl-2-oleoyl-3-stearoylglycerol). Each polymorphic form has a different
typical x-ray diffraction pattern. This is due to the fact that the polymorphism itself
results from the different possibilities of lateral packing of the fatty acid chains and the
longitudinal stacking of molecules in lamellae. There are two main types of longitudinal
stacking of TAG molecules corresponding to two or three (2L or 3L) fatty acid lengths.
Figure 2: Representation of the two different types of longitudinal stacking for TAGs – the 2L and 3L fatty
acid lengths.
6
The three main types of lateral packing modes for TAGs are illustrated in Figure
3. The α form has a hexagonal unit cell, the β’ form has an orthorhombic unit cell and
the β form was thought to be triclinic unit cell[22]. Recently however, the structures for
the form V and VI of cocoa butter have been solved, and the β form has been shown to
have a monoclinic structure – the difference being that the angles α and β are equal to 90°
[23, 24].
Figure 3: On the top from left to right, hexagonal, orthorhombic and monoclinic unit cells. Across the
bottom two rows it is shown how TAGs pack into the unit cells [25].
The x-ray patterns are typically divided into two areas – low q (long spacings) and
high q (short spacings). The short spacings relate to the small distances between the fatty
acid hydrocarbon chains of the TAG. These spacings help define the polymorph since
α β’ β a
b c a
b
c
a
a c
7
differences originate from the different possibilities of lateral packing of the fatty acid
chains. The long spacings relate to the longitudinal packing of molecules in lamellae
(layers), making them merely the repeat distances in the direction roughly perpendicular
to the lamellae.
Much work has been done to characterize the polymorphism of cocoa butter in
particular, due to its huge importance to the chocolate industry. Obviously a great deal of
knowledge about the thermal properties and phase behaviour is necessary to optimize
production and product quality. There is, however, still a great deal of debate in many
areas of the research. In 1951 Vaeck[2] proposed that while the three main polymorphs
are α, β’ and β sub-cells, in order of their increasing thermal stability, there is also a
fourth crystalline form, often called γ, which is less stable than the α form. Again, in
1960 Vaeck proposed the same four polymorphs only with slightly different melting
temperatures[20]. However, in 1966 it was proposed by Wille and Luton[4], through the
use of x-ray diffraction in conjunction with DSC, that there were actually six different
polymorphic forms I – VI, where I is the γ, II is the α, III and IV are both β’ and V and
VI are both β. The later works of Huyghebaert and Hendrickx[26], as well as
Lovegren[27], also confirm six different forms using DSC techniques.
Form I (or γ) is extremely unstable and is obtained by cooling rapidly to very low
temperatures[4]. At 0°C this form is stable for less than a minute, before beginning to
change into form II.
Form II (or α) can be obtained by cooling at 2°C/min or by keeping form I at 0°C
for over 15 minutes. Once formed, it will persist at 0°C for approximately 5 hours before
changing to form III and has a melting temperature in the range 17-22°C. A range is
8
given due to cocoa butter composition variability, resulting in each cocoa butter having a
slightly different melting temperature for each polymorph. Typical x-ray data shows
strong identifying peaks at 49Å and 4.25 Å.
Form III (β’) is formed, according to Wille and Lutton[4], by either crystallizing
at 5-10°C or transforming the form II by storage at 5-10°C for 16 hours. Once formed it
persists for 5 days at 5°C or less than 4 hours at 16°C, before transforming into form IV.
Typical x-ray data shows identifying x-ray peaks at 49 Å, 4.25 Å and 3.86 Å.
Form IV (β’) is achieved either via transformation from form III, or from
solidification of the melt at 16-21°C. It is identified by strong x-ray peaks at 45 Å, 14.8
Å and 4.35 Å as well as two other medium intensity peaks at 4 Å and 3.8 Å. An accepted
melting range for forms III and IV is 20-27°C.
Form V (β) can be identified by a large shift in 001 x-ray diffraction peak position
to 63 Å, indicating a transformation from a double chain (2L) to a triple chain (3L)
structure. It can be obtained via transformation from a less stable form. General methods
involve cooling the melt to 25-28°C, reheating to 31-33°C and then either crystallizing at
this temperature, or dropping again to lower temperatures. Wille and Lutton[4] also
employed agitation of the sample to aid in crystallization. Once formed, the form V will
persist for months if stored at normal room temperatures.
While form VI (β) has an almost identical x-ray pattern to form V, with subtle
differences coming in the high q range only, there is a very noticeable change in melting
temperature. Form VI is also the only form which cannot be crystallized directly from
the melt. It forms only via a solid state transition from form V. An accepted melting
range for forms V and VI is 29-34°C.
9
While these six polymorphic forms have, over the years, been confirmed by other
authors[7, 26-29], debate still exists as to the validity of the distinction between the two
β’ forms III and IV, as well as the two β forms V and VI. Wille and Lutton[4]
themselves admitted that they were unsure about form III, since an examination of a
system comprised of the three largest TAG components failed to achieve a pure form III.
Likewise, Chapman et al.[7], were not able to obtain a pure form III and merely
extrapolate the data. Wille and Lutton[4] are, however, quite certain about the distinct
form VI, citing evidence that a pure sample of POS behaved in a similar fashion[4].
In 1980, Merken and Vaeck[30] once again report only 4 polymorphic forms in
cocoa butter, citing form III as being a mixture of II and IV and form VI being just form
V, lacking the liquid TAG fraction. They claim that the DSC peaks allotted to other
forms can be caused by various phenomena such as: separation of a solid solution in two
phases, thermal inertia of equipment and exothermic transformations interfering with
endothermic phenomena of fusion [30].
Support for this position has been steadily, if slowly, growing. While not all
authors are ready to abandon form VI, many have at least begun to question the validity
of a form III[6, 31-36]. Schlichter-Aronhime and Garti[31] for example have shown that
depending on the cooling rate in a DSC experiment, different melting temperatures are
achieved for a crystal structure thought to be form III. In fact, the slower the cooling rate,
the higher the melting temperature - a temperature not corresponding to any known
polymorph. As the melting point rises, the enthalpy value should increase, since it is
dependent on temperature. However, under conditions of very slow cooling, the melting
10
curve does not show an increase in enthalpy. This implies that forms II and IV form a
mixture with varying composition according to aging or cooling conditions[31].
The thermal characteristics of forms I to VI, as quoted previously, were
determined by DSC (differential scanning calorimetry) heating curves. Many of these
studies have been attempted, not only to classify the melting temperatures of the different
polymorphs [4, 7, 26, 27, 30, 37, 38], but also to verify polymorphs and define the
‘recipes’ for making the different polymorphs, i.e., determining which forms the cocoa
butter goes through on its way to becoming a form V, or under what conditions a form I
appears [7, 12, 28-30, 32, 39-44].
Figure 4: Time – temperature state diagram for the polymorphism of statically crystallized cocoa butter
taken from Marangoni & McGauley [44]
β’ β γ SOS
1 10 100 1000 10000 100000-30-25-20-15-10-505
1015202530
Time (min)
Tem
pera
ture
(o C)
γ + α
α
β’
α+β’
β’+ β
11
A time-temperature state diagram can be seen in Marangoni and McGauley [44]
(Figure 4) and a very similar state diagram is shown in van Malssen et al.[34].
Comparison of these figures demonstrates very aptly the differences in opinion of the
degree of complexity found. While the basic structure of the diagrams is the same,
Marangoni and McGauley [44] show many areas of mixed polymorphs, which are not
present in the work of van Malssen et al.[34]. Van Malssen et al.[34] show the
persistence of the γ, or form I, briefly above 0°C and also persisting for hours at –5°C.
This clearly contradicts the work of Marangoni and McGauley[44] who show the γ only
existing well below –10°C and then only in a mixed state.
A similar temperature-cooling rate state diagram was extrapolated by Spigno et
al.[40] from x-ray work done by van Malssen et al.[36]. This state diagram shows the
dependence of the polymorph on not only time and temperature, but also on the cooling
rate. Van Malssen et al.[36] conclude that the polymorph is dependent on the final
temperature of the cooling, only so long as the cooling rate is fast enough. If the cooling
rate is too slow, higher melting temperature polymorphs are allowed to form.
Not only is there debate about the number of polymorphic forms and the methods
of obtaining them, there is also a certain degree of variation in reported x-ray data and
melting temperatures. This has been explained as being due to the large compositional
variation between cocoa butters produced in different regions of the world[45]. In recent
years melting temperatures have been adopted as a range, rather than a specific value, to
incorporate this variation A large body of work is available which well defines this range
[4, 7, 20, 30, 37].
12
Dating back to Wille and Lutton[4], very comprehensive x-ray data have also
been gathered; due to the variations, however, a certain amount of cross referencing is
required to decide which data are the most accurate. Tables 2-4 in Appendix 1 compare
x-ray studies of the different polymorphs over the past 38 years. These tables include
small q values (long spacings). While the high q range (referred to as the short spacings)
are used more commonly, recently there has been more interest in the whole region[10,
29, 33, 46]. The short spacings are referred to as the fingerprint region, since the
polymorphic form can be determined easily with these peaks alone. However, the long
spacings are also useful, since they can also be used to identify the polymorph in most
cases and may present valuable information about the different polymorphs and their
phase transitions [33]. Appendix 2 shows typical synchrotron x-ray diffraction patterns
of forms II-VI.
A key area of disagreement in the literature, with regard to x-ray identification,
seems to be the identification of the form VI polymorph. While there are those who
dispute its existence as a distinct polymorph[30-32, 35, 47], the transition to this state
holds some importance to bloom studies (bloom being the disfiguration of chocolate’s
surface with a white growth) and hence identification still has some relevance. The
literature also contains varying short spacing diffraction images of form VI. A figure in
van Langevelde et al. [45] shows short spacings of different polymorphs. Forms III and
IV are not listed separately since this author agrees with Schlicher-Aronhime[31] and
believes it to be only one phase. Form VI is shown as it is typically identified
elsewhere[4, 5, 33, 43, 48-50], however van Malssen et al.[34] present a comparison of a
form V and VI that shows a remarkably different form VI. Forms V and VI (βV and βVI)
13
do not generally differ from each other anywhere other than the short spacings, yet here,
peaks above 5 Å are markedly different, while the short spacings themselves do not differ
significantly from each other. Hence, the form VI depicted here more closely resembles
a form V than a form VI.
This discrepancy in identifying form VI may be explained, in part, by considering
the work of van Langevelde et al. [45]. This work compared the form VI of a wide
variety of different cocoa butters from around the world. It was found that, depending on
the origin of the cocoa butter; the x-ray pattern of a form VI could very easily resemble
that of a typical form V, leaving the melting point as the only way to distinguish it as a
form VI. The same work also demonstrated that the x-ray pattern also changes
depending on the crystallization method used. That is to say, samples reached via the
memory effect or the isothermal method had different x-ray patterns for form VI within
the same cocoa butter sample. Form V was also seen to be different, although less so.
They conclude that it is then impossible to achieve a form VI that can be considered to be
typical of all cocoa butters.
Another comment of some interest is made by Adenier et al.[50], who state that it
is impossible to have a pure form VI, that is form V will always be present. An
examination of the x-ray patterns of these two forms shows that, indeed, the peaks of
form V are always contained within form VI.
Other authors have also undertaken, for the purpose of bloom studies, to show the
process of transformation between forms V and VI. To this end they have either
mathematically[45] or physically[49, 51] combined different combinations of forms V
and VI to achieve x-ray diagrams showing the progression of the change. These works
14
elucidate the possibility that some of the form VI data found in the literature may in fact
more closely resemble a mixture of forms V and VI.
A discrepancy, perhaps related, can be seen in the work of Loisel et al. [29],
which shows a form V x-ray image depicting a comparison of cocoa butter, to both its
high melting fraction (composed of those TAGs contained in cocoa butter with a high
melting point) and its low melting fraction (low melting point TAGs). While a very large
x-ray diffraction peak can be seen at 44.4 Å (q = 0.143 Å-1) for the high melting fraction,
a definite peak is still apparent in the pattern shown for the regular cocoa butter sample.
This peak is unusual since it has never been previously reported in a form V, but has been
seen repeatedly by this author in form VI. They also report a higher than usual melting
point for this structure (37°C), and explain it as being possibly due to a lipid segregation
or phase separation, stating that the peak position corresponds to a tristearin (SSS) peak.
Mazzanti et al.[11] also report possible phase separation of the βV under
conditions of low shear. They show a peak appearing at q=0.179 Å-1, which they claim
to be the 002 peak of a spacing 70.2 Å, which would be consistent with a phase
separation rich in SOS and POP[11].
These phase separations do much to underscore the comments of Merken and
Vaeck[30] and Schlichter-Aronhime[31], showing that fractionation is a very real
occurrence and cannot be overlooked in studies of polymorphism.
Another interesting phenomenon in cocoa butter polymorphism is called the
memory effect. Without it, form V (β) is generally only obtained via a phase
transformation from form IV (β’). It has been demonstrated, however, that it is possible
to have the βV easily obtained from the melt if there is a “β-memory effect”. This is due
15
to the fact that if the cocoa butter is not melted sufficiently, even a few form V or VI
crystallites persisting in molten cocoa butter are capable of causing complete form V
solidification of the sample [4, 7, 33, 35, 45]. While studies by Chapman et al.[7]
observe a form IV crystallizing from the melt due to the memory effect, most have seen
the emergence of the form V [4, 7, 33, 35, 45].
Work by van Malssen et al. [35] defines the β-MPT (β-memory point
temperature) as the temperature to which cocoa butter has to be heated to prevent
recrystallization into the βV within 45 minutes when cooled to 25°C (recall that the β
melting range is 25-28°C). The authors present results for a wide variety of different
cocoa butters which suggest that the highest of the β-MPT is 38°C. This result draws
attention to the huge range of values used throughout the literature to guard against the
memory effect. Some authors heat their samples to as high as 110°C for up to 2
hours[37, 52, 53], some to 80°C for 20[16] or 30 minutes[54], some to 70°C for 10
minutes[38], others to 50°C for 1 hour[55] and others to only 10°C above the melting
point of the specific polymorph[56].
This inconsistency in the literature and the lack of acceptance of a lower melting
temperature can, perhaps, be linked to the work being done on seed crystals[37, 47, 52,
57-60]. In 1989, Davis and Dimick[61] said that some minor components such as
glycolipids, phospholipids and saturated triacyglycerols, may serve as seed crystals and
promote the crystallization of the cocoa butter. They also showed that the seed crystals
have a very high melting temperature (above 60°C) and concluded that a unique
composition was responsible, rather than a different polymorph[37]. In 1991 Arruda et
al.[57] showed that if the very first seeds of crystal growth are extracted from the melt
16
and isolated, those crystals are different in composition from the original cocoa butter and
have a melting temperature of up to 70°C. They focused on the phospholipid composition
of the cocoa butter and showed that the seed crystals contained 4% phospholipids while
the original cocoa butter contained 0.34%. Their explanation for this is that a
phospholipid head contains about 10 water molecules. Below a certain energy level these
heads will be drawn together to form nucleation sites[57]. Looking also at the TAG
content, Chaiseri and Dimick[52] saw that early seed crystals had high concentrations of
complex lipids, saturated TAGs, saturated fatty acid rich diacylglycerols and
monoacylglyercols and that the rapidly nucleating seed crystals had higher concentrations
of SOS than their original cocoa butter.
These studies make it clear that there are parts of the cocoa butter which may not
melt at the β-MPT of 38°C given by van Malssen et al.[35], and their condition of
“preventing recrystallization into the βV within 45 minutes when cooled to 25°C” may
not be applicable in all conditions.
Accelerating the transition into the β or form V via the memory effect, and other
means, is part of another large area of cocoa butter research. Form V has always been a
huge part of research into cocoa butter due to its importance to the chocolate industry.
This form has the desired melting temperature, mouth feel, and glossy appearance.
Achieving the desired form V in as little time as possible has always been a goal of
research into the polymorphism of cocoa butter.
As far back as the 1950s, it was observed that applying shear (or agitation) to
chocolate or cocoa butter causes it to crystallize at a much faster rate[1, 9-18, 20, 62-65].
17
Dating back to 1985, Ziegleder [13] observed that by applying shear to cocoa
butter, it was induced to convert from form IV to form V. This work has been continued
more recently by several different groups[1, 9-12, 14-18, 63].
Stapley et al. [12] use a temperature controlled shear cell before reheating
samples enough to transfer them to a DSC. They report that high melting point forms
were achieved as long as the shear rates were high enough, the tempering time was long
enough and the re-warming temperature was low enough. Due to the nature of their
experiment, this seems to indicate that form V was achieved in the shear cell, and then
reformed in the DSC via the memory effect.
Bolliger et al. [14, 15] use a rotor to apply shear to chocolate as it is tempered.
They report that in a comparison of methods, the same quality of chocolate crystallization
can be achieved much more quickly by applying shear. They also report that changes in
shear significantly influence viscosity and melting enthalpy.
MacMillan et al. [9] report that the use of shear shortens the length of time to
reach form V by allowing form IV to be bypassed and form V reached from form III.
The highest shear rate used was 12 s-1, but the trend observed was that an increase in
shear shortened the induction time.
Mazzanti et al.[10, 11], however, report shear rates of 90 to 1440 s-1. While they
also report a shortened induction time via a transition directly from form II to form V, it
is surprisingly in a longer time than that reported by MacMillan et al. [9] (20 minutes as
compared to 2 minutes). This can, in part, be explained by differences in sample volume
and vast differences in cooling rate.
18
The difference in induction times between the work of Mazzanti et al.[10, 11] and
MacMillan et al.[9] could also, perhaps, be related to the work of Savage and
Dimick[53]. They show that the induction time of cocoa butters vary depending on their
origin. MacMillan et al. [9] list their cocoa butter as being of Ghanian origin, while the
origin of the Mazzanti et al.[10, 11] cocoa butters are unknown. It can be seen in the
more recent work of Mazzanti et al.[10, 11] however, that the two different cocoa butter
samples they employed also behaved differently from each other.
It should also be noted that while MacMillan et al. [9] report no orientation due to
shear, a very obvious orientation, in both forms II and V, is apparent in the work of
Mazzanti et al [10, 11]. The different planes examined in the two different experiments
explain this discrepancy, since orientation was not observed by Mazzanti et al. [10, 11] in
the plane examined by MacMillan et al. [9]
Mazzanti et al. [66] also expand on their shear work and develop a descriptive
model. They propose that the crystallites grow layer upon layer of slightly different
composition and that the shear rate and temperature applied define these compositions.
Simultaneously, the shear and temperature would define the crystalline interface area
available for secondary nucleation by promoting segregation and affecting the size
distribution of the crystallites. The combination of these factors – composition, area and
size distribution – favours dramatically the early onset of βV under shear and determines
the proportions of forms II, IV and V after the transition.
Also investigating the effects of shear are Toro-Vasquez et al.[16]. They use
DSC techniques in conjunction with rheology to monitor the crystallization process under
shear. While no conclusive x-ray data is offered, they report a shear rate effect that
19
favored β crystallization at temperatures of 19, 22, and 26.5°C, for rpm values of 120 and
400 rpm[16].
The work of Sonwai et al. [18] shows, among other things, work done with a
microscope shear cell. Shear rates of 3-500s-1 with a ramp of 50 to 20°C at 5°C/min were
examined and a decrease in the size of the crystallites as well as an increase in their
number was reported. This means that the application of shear acts to decrease the size
of crystals formed, yet increases the number of nucleation events.
The work of Dhonsi et al. [17] investigated shear rates of 1-50s-1 and
crystallization temperature of 13, 17, 20 and 23°C. The found that for the lower
temperatures, crystallization was fast, independent of shear rate. Only the highest
temperature of 23°C yielded a shear dependency of the crystallization time, with these
samples crystallizing faster than those sheared at 20°C.
Another method of accelerating the formation of form V is the application of
ultrasonics. Higaki et al. [67] report that the application of ultrasonics (20 Hz, 100W)
accelerates the formation of form V. A 3 second sonication raised the temperature of the
sample from 32.3 to 32.9°C and when cooled to 20°C and examined with x-rays showed
form V. A 9 second application, on the other hand, raised the sample temperature to
34.3°C and caused the formation of both forms II and V. A 15 second application raised
the temperature to 36.2°C and resulted in a sample of only form II. While the sonication
process does accelerates the formation of form V, it does so only for very short
application times, since the use of ultrasonics raises the temperature of the cocoa butter
through acoustic energy and causes the formation of mixed polymorphs.
20
Work with seed crystals to accelerate the transition had begun by the 1960s [3].
The basic concept of the research is that crystals are added to the melt and are then used
as nuclei for crystal growth, similar to what happens with the memory effect. Giddey and
Clerc[3] showed in 1961 that crystals of SOS and POS could be used to seed cocoa butter
and accelerate the transition into a stable form. Later, Koyano et al. [60] experimented
with adding seed crystals of a fine crystal powder to dark chocolate. They conclude that
the addition of the β2 form of BOB (1,3-dibehenoyl-2-oleoyl-glycerol) accelerates the
transition to form V. Hachiya et al.[58] have also demonstrated that the addition of seed
powders of form III, V and VI greatly accelerate the transition to form V, with powders
of form VI being the most effective. They do, however, caution that the polymorphic
form of the cocoa butter was more greatly influenced by the crystallization temperature
than the seed crystal[58].
The six forms of cocoa butter, have been extensively studied visually via
microscopy[2, 20, 28, 39, 42, 44, 47, 50, 54, 68-73]. The work of Hicklin et al.[28] for
example, not only characterizes the six polymorphs via x-ray diffraction, but also shows
images of them all. From these works it is clear that all six forms have a distinct visual
structure.
Hicklin et al.[28] show that form I has no distinct morphology, form II has
ordered lamellae, form III has protruding tubular crystals, form IV has densely packed
needle-like crystals, form V has multilayered crystals, regular in shape and form VI has
crystals protruding from a matrix of more regularly shaped crystals[28].
Marangoni and McGauley[44] on the other hand clearly demonstrate that the
visual appearance of many of the polymorphic forms is highly dependent on the
21
crystallization temperature and the amount of time allowed for crystallization. They
show that the γ and the α are granular in appearance regardless of the length of
crystallization time or crystallization temperature. The microstructure of the β’
polymorph, on the other hand, varied substantially depending on the crystallization time
and temperature. Generally, the higher the temperature and the longer the time, the more
deviation was seen from the granular structure, with first crystal clustering and then
~25µm crystallites with a needlelike appearance. Thus, both temperature and thermal
history will affect the microstructure of the β’ form. The β polymorph also displayed
different microstructures. After incubation for 4-5 weeks at 20 and 22°C the sample no
longer displayed uniform morphology – large microstructures (600 µm to 2 mm) were
also observed. After 4 weeks at 20°C, a granular morphology was the predominant
structure of the continuous phase, but the larger microstructures had a featherlike
appearance and were visible to the naked eye. It was concluded that the phase transition
from the β’ form to the β polymorph usually leads to the formation of the large
microstructures [44].
The mechanical properties of cocoa butter[54, 74-76] are also extremely
important as the hardness of a fat is strongly influences the perceived texture of a food
product[54]. When crystallizing, cocoa butter forms a three-dimensional crystal network
stabilized by van der Waals forces[77]. The strength of this network has been related to
several different properties. DeMan noted in 1976 that the solid fat content (SFC) will
strongly influence the mechanical behavior of a fat[78]. Further to that, he later notes
that the macroscopic properties of the network are influenced also by its chemical
composition, the polymorphic state, the crystallite size and shape and the spatial
22
distribution of the mass of the network[77]. Brunello et al. [54] confirm that the
mechanical properties of cocoa butter are not only governed by the amount of solid fat
present in the crystal network, but also by the structure of the network. Polymorphism
was found to strongly influence the mechanical properties indirectly via its effects on the
microstructure of the material[54]. The work of Campos et al.[79] with milk fat and lard
also makes these points, but goes on to show that networks with large particles and more
heterogeneously distributed mass are softer fats, whereas smaller particles and a more
homogenous distribution of mass result in a firmer fat.
Clearly, while there is huge body of research into many aspects of cocoa butter
properties and polymorphism, understanding of the mechanisms and underlying
processes is limited in part due to the wide diversity in the composition of different cocoa
butter samples and the complicated interactions of the many different TAGs contained
therein.
As cocoa butter research progresses, it is clear that while many questions can and
have been answered, the answers themselves lead us into a much more complicated,
multidimensional world of cocoa butter polymorphism. We can see that the cooling rate,
shear rate, temperature, time and composition lead to different phase separations and
polymorphs, and all play a role in defining morphology and structure.
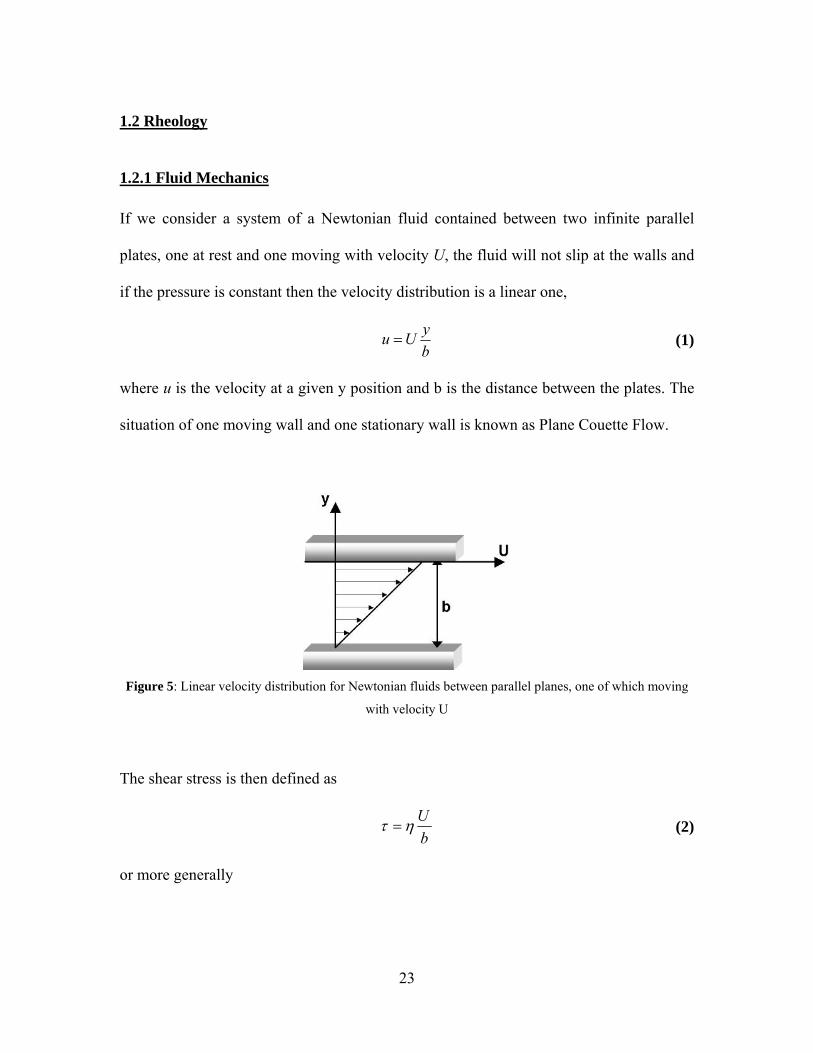
23
1.2 Rheology
1.2.1 Fluid Mechanics
If we consider a system of a Newtonian fluid contained between two infinite parallel
plates, one at rest and one moving with velocity U, the fluid will not slip at the walls and
if the pressure is constant then the velocity distribution is a linear one,
byUu = (1)
where u is the velocity at a given y position and b is the distance between the plates. The
situation of one moving wall and one stationary wall is known as Plane Couette Flow.
Figure 5: Linear velocity distribution for Newtonian fluids between parallel planes, one of which moving
with velocity U
The shear stress is then defined as
bUητ = (2)
or more generally
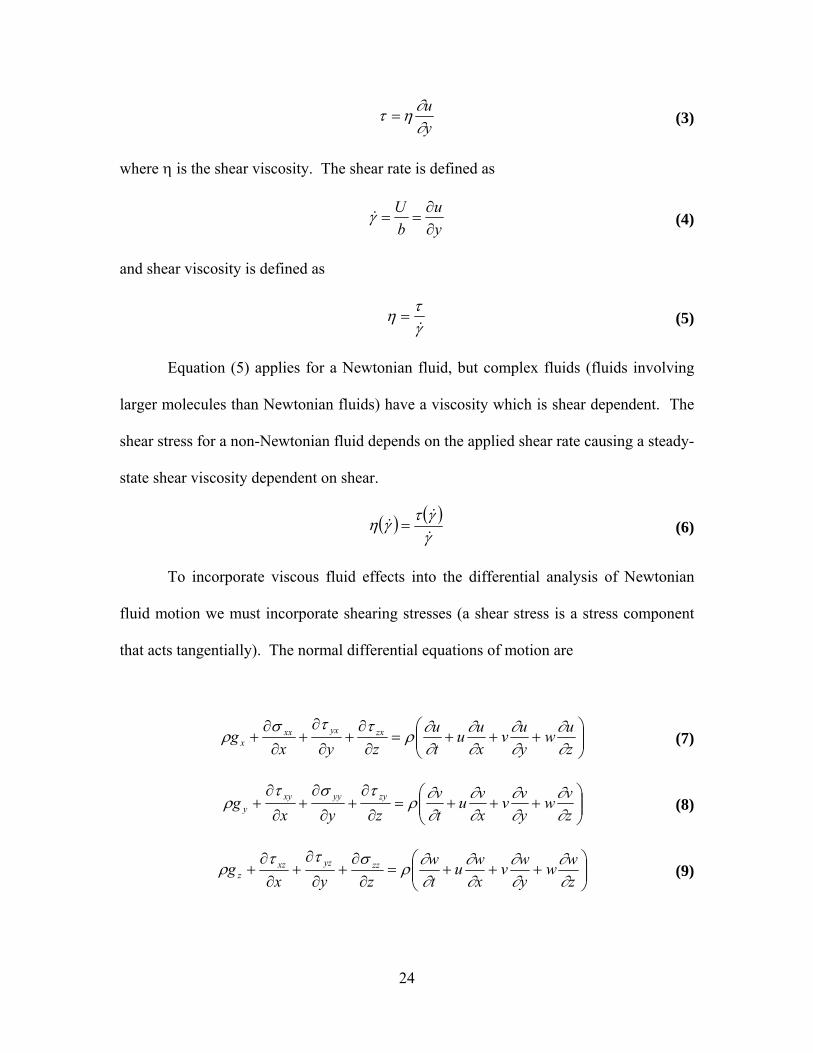
24
yu
∂∂ητ = (3)
where η is the shear viscosity. The shear rate is defined as
yu
bU
∂∂
==γ& (4)
and shear viscosity is defined as
γτη&
= (5)
Equation (5) applies for a Newtonian fluid, but complex fluids (fluids involving
larger molecules than Newtonian fluids) have a viscosity which is shear dependent. The
shear stress for a non-Newtonian fluid depends on the applied shear rate causing a steady-
state shear viscosity dependent on shear.
( ) ( )γγτγη&
&& = (6)
To incorporate viscous fluid effects into the differential analysis of Newtonian
fluid motion we must incorporate shearing stresses (a shear stress is a stress component
that acts tangentially). The normal differential equations of motion are
⎟⎟⎠
⎞⎜⎜⎝
⎛+++=
∂∂
+∂
∂+
∂∂
+zuw
yuv
xuu
tu
zyxg zxyxxx
x ∂∂
∂∂
∂∂
∂∂ρ
ττσρ (7)
⎟⎟⎠
⎞⎜⎜⎝
⎛+++=
∂
∂+
∂
∂+
∂
∂+
zvw
yvv
xvu
tv
zyxg zyyyxy
y ∂∂
∂∂
∂∂
∂∂ρ
τστρ (8)
⎟⎟⎠
⎞⎜⎜⎝
⎛+++=
∂∂
+∂
∂+
∂∂
+zww
ywv
xwu
tw
zyxg zzyzxz
z ∂∂
∂∂
∂∂
∂∂ρ
σττρ (9)
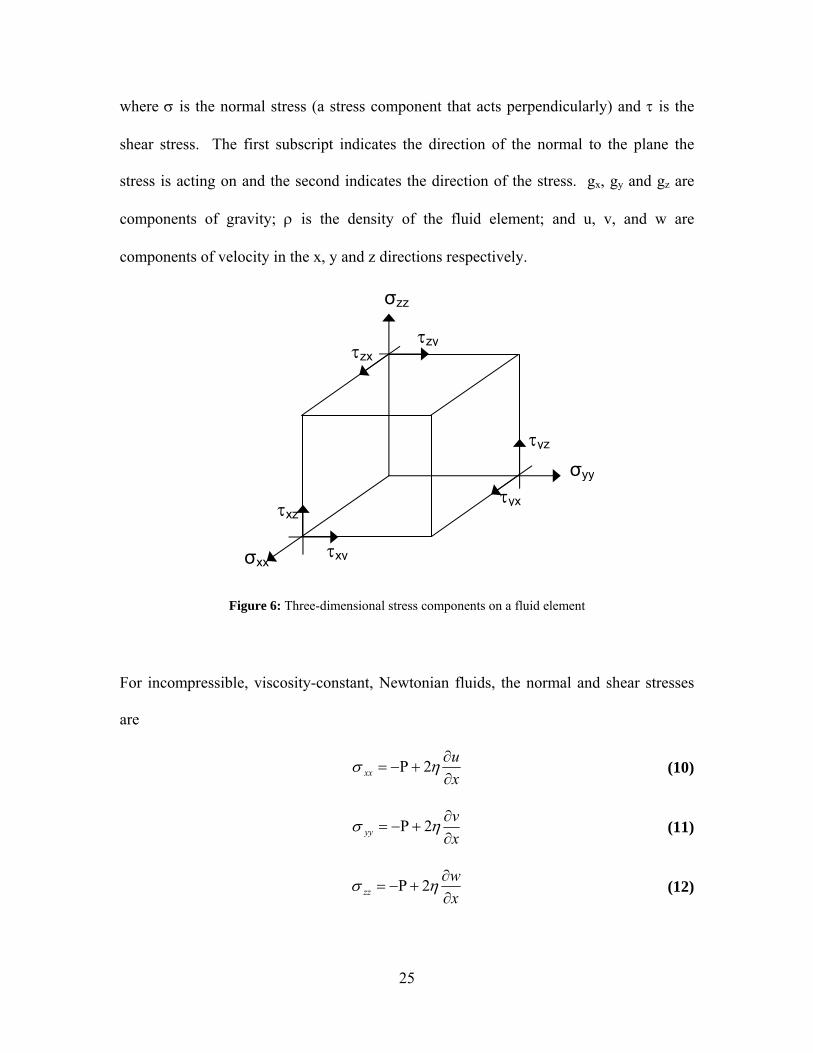
25
where σ is the normal stress (a stress component that acts perpendicularly) and τ is the
shear stress. The first subscript indicates the direction of the normal to the plane the
stress is acting on and the second indicates the direction of the stress. gx, gy and gz are
components of gravity; ρ is the density of the fluid element; and u, v, and w are
components of velocity in the x, y and z directions respectively.
Figure 6: Three-dimensional stress components on a fluid element
For incompressible, viscosity-constant, Newtonian fluids, the normal and shear stresses
are
xu
xx ∂∂
+Ρ−= ησ 2 (10)
xv
yy ∂∂
+Ρ−= ησ 2 (11)
xw
zz ∂∂
+Ρ−= ησ 2 (12)
σxx
σyy
σzz
τyz
τxz
τxy
τzx
τyx
τzy
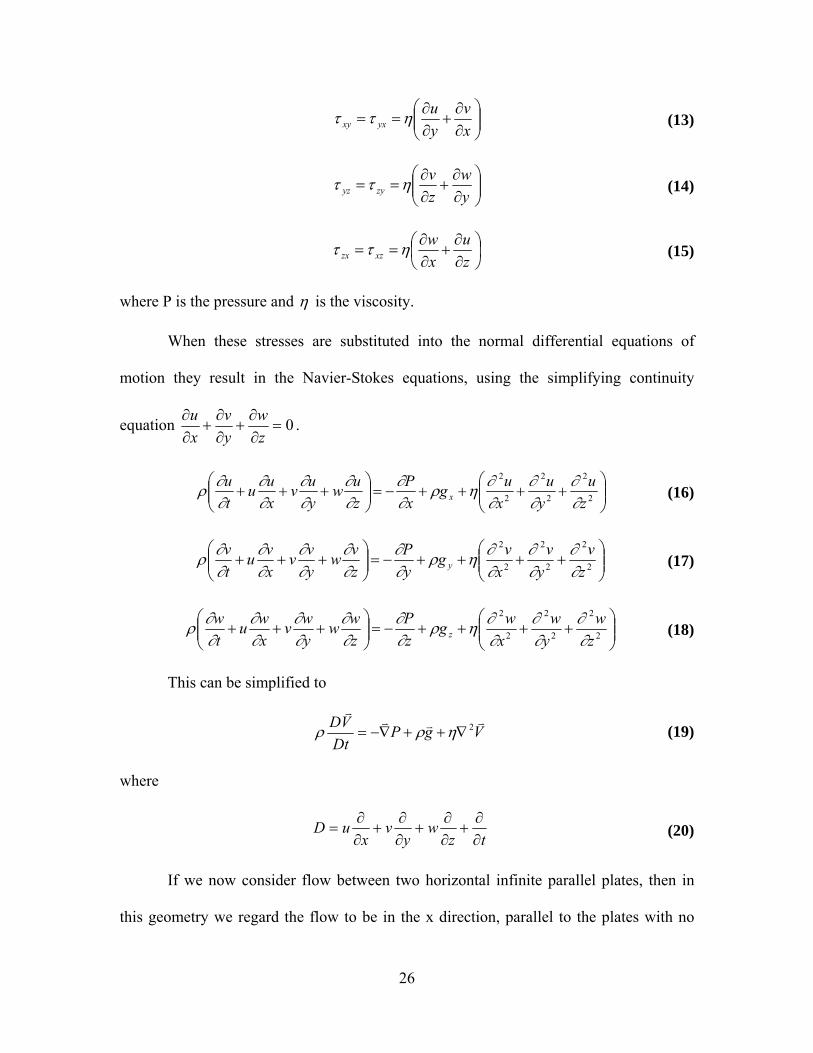
26
⎟⎟⎠
⎞⎜⎜⎝
⎛∂∂
+∂∂
==xv
yu
yxxy ηττ (13)
⎟⎟⎠
⎞⎜⎜⎝
⎛∂∂
+∂∂
==yw
zv
zyyz ηττ (14)
⎟⎠⎞
⎜⎝⎛
∂∂
+∂∂
==zu
xw
xzzx ηττ (15)
where P is the pressure and η is the viscosity.
When these stresses are substituted into the normal differential equations of
motion they result in the Navier-Stokes equations, using the simplifying continuity
equation 0=∂∂
+∂∂
+∂∂
zw
yv
xu .
⎟⎟⎠
⎞⎜⎜⎝
⎛++++−=⎟⎟
⎠
⎞⎜⎜⎝
⎛+++ 2
2
2
2
2
2
zu
yu
xug
xP
zuw
yuv
xuu
tu
x ∂∂
∂∂
∂∂ηρ
∂∂
∂∂
∂∂
∂∂
∂∂ρ (16)
⎟⎟⎠
⎞⎜⎜⎝
⎛++++−=⎟⎟
⎠
⎞⎜⎜⎝
⎛+++ 2
2
2
2
2
2
zv
yv
xvg
yP
zvw
yvv
xvu
tv
y ∂∂
∂∂
∂∂ηρ
∂∂
∂∂
∂∂
∂∂
∂∂ρ (17)
⎟⎟⎠
⎞⎜⎜⎝
⎛++++−=⎟⎟
⎠
⎞⎜⎜⎝
⎛+++ 2
2
2
2
2
2
zw
yw
xwg
zP
zww
ywv
xwu
tw
z ∂∂
∂∂
∂∂ηρ
∂∂
∂∂
∂∂
∂∂
∂∂ρ (18)
This can be simplified to
VgP
DtVD vvvv
2∇++∇−= ηρρ (19)
where
tz
wy
vx
uD∂∂
+∂∂
+∂∂
+∂∂
= (20)
If we now consider flow between two horizontal infinite parallel plates, then in
this geometry we regard the flow to be in the x direction, parallel to the plates with no
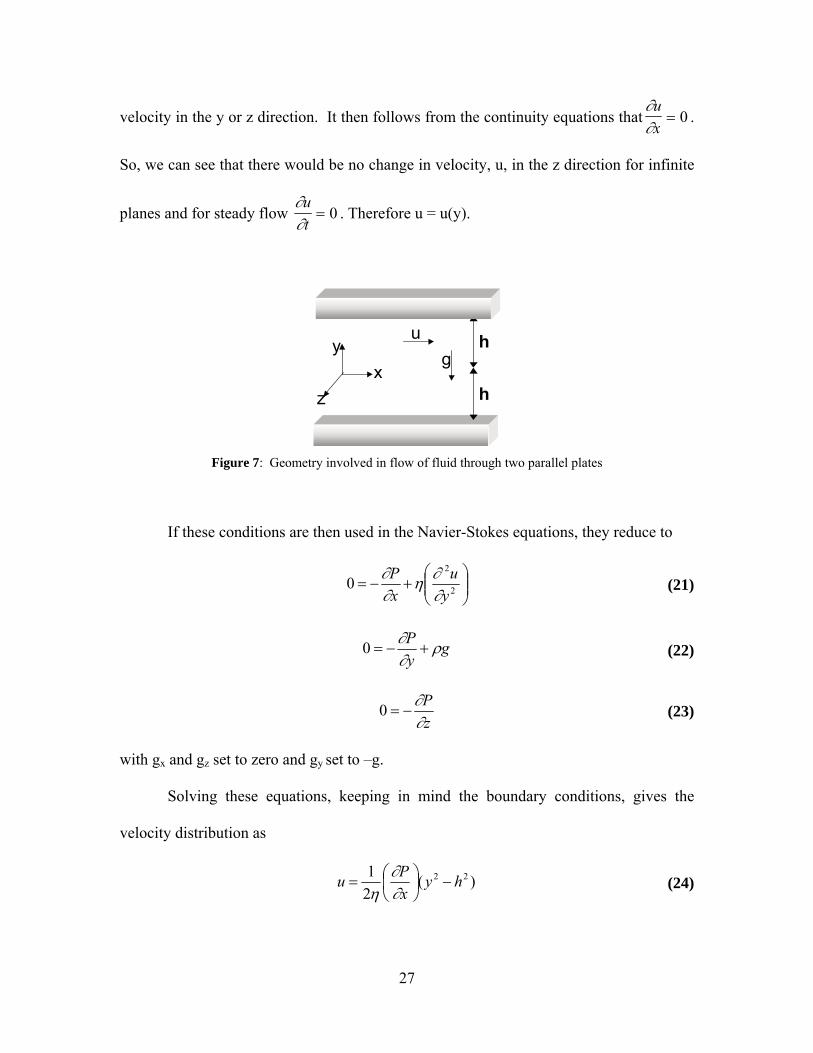
27
velocity in the y or z direction. It then follows from the continuity equations that∂∂ux
= 0 .
So, we can see that there would be no change in velocity, u, in the z direction for infinite
planes and for steady flow ∂∂ut
= 0 . Therefore u = u(y).
�
�
��
��
�
Figure 7: Geometry involved in flow of fluid through two parallel plates
If these conditions are then used in the Navier-Stokes equations, they reduce to
⎟⎟⎠
⎞⎜⎜⎝
⎛+−= 2
2
0yu
xP
∂∂η
∂∂ (21)
g
yP ρ
∂∂
+−=0 (22)
zP
∂∂
−=0 (23)
with gx and gz set to zero and gy set to –g.
Solving these equations, keeping in mind the boundary conditions, gives the
velocity distribution as
)(
21 22 hy
xPu −⎟
⎠⎞
⎜⎝⎛=
∂∂
η (24)
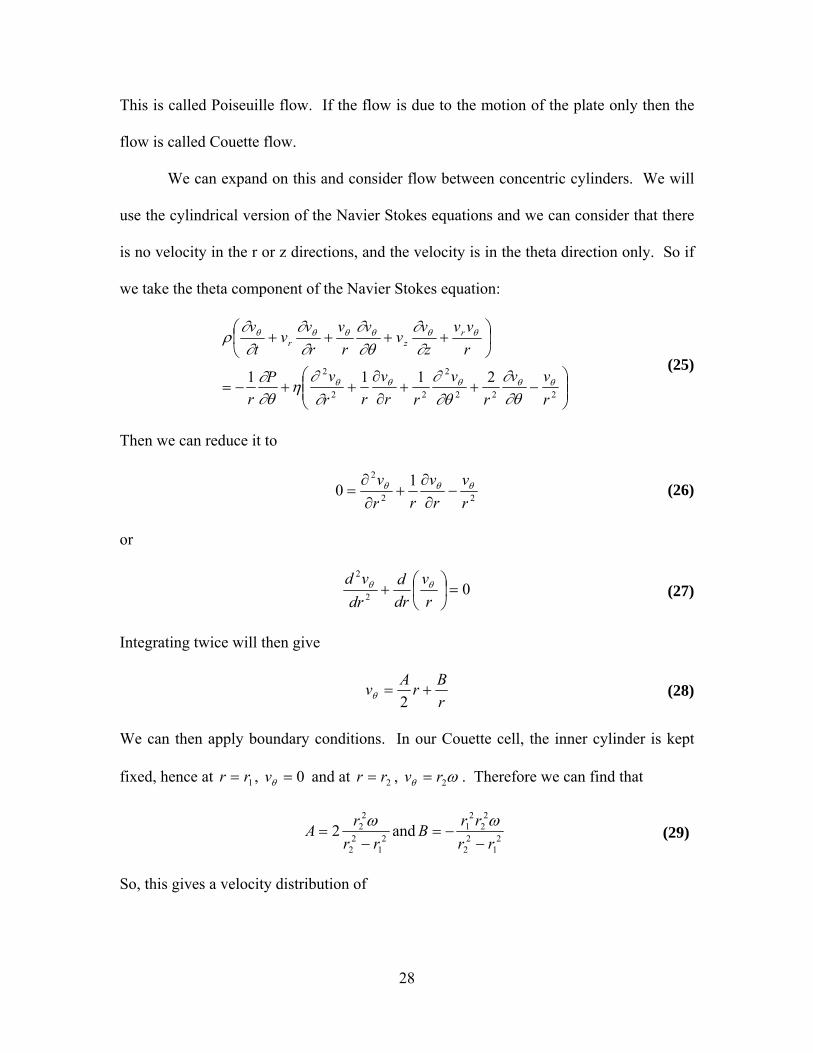
28
This is called Poiseuille flow. If the flow is due to the motion of the plate only then the
flow is called Couette flow.
We can expand on this and consider flow between concentric cylinders. We will
use the cylindrical version of the Navier Stokes equations and we can consider that there
is no velocity in the r or z directions, and the velocity is in the theta direction only. So if
we take the theta component of the Navier Stokes equation:
⎟⎟⎠
⎞⎜⎜⎝
⎛−++
∂∂
++−=
⎟⎠
⎞⎜⎝
⎛ ++++
222
2
22
2 2111rvv
rv
rrv
rrvP
r
rvv
zv
vv
rv
rv
vt
v rzr
θθθθθ
θθθθθθ
∂θ∂
∂θ∂
∂∂
η∂θ∂
∂∂
∂θ∂
∂∂
∂∂
ρ (25)
Then we can reduce it to
22
2 10rv
rv
rrv θθθ −
∂∂
+∂∂
= (26)
or
02
2
=⎟⎠⎞
⎜⎝⎛+
rv
drd
drvd θθ (27)
Integrating twice will then give
rBrAv +=
2θ (28)
We can then apply boundary conditions. In our Couette cell, the inner cylinder is kept
fixed, hence at 1rr = , 0=θv and at 2rr = , ωθ 2rv = . Therefore we can find that
2
12
2
222
rrrA
−=
ω and 21
22
22
21
rrrrB−
−=ω (29)
So, this gives a velocity distribution of
29
⎥⎦
⎤⎢⎣
⎡−
−=
rr
rrr
rv
21
21
22
22 ω
θ (30)
The shearing stress on the inner cylinder can also be calculated from
2
12
2
22
12
1rr
rr
vdrdr
rr −−=⎥
⎦
⎤⎢⎣
⎡⎟⎠⎞
⎜⎝⎛−=
=
ωηητ θ (31)
1.2.2 Rheometry
Rheology can be defined as the study of the flow and deformation of matter. Sir
Isaac Newton found that when a pressure was applied to a fluid, it flowed at a precise rate
and that the rate was proportional to the magnitude of the applied pressure. This is the
essence of rheology and is expressed in Newton’s Law, which states that the shear stress,
τ, is proportional to the strain rate (the rate of change of strain with respect to time),
•
= γγdtd . Here strain is defined as a deformation of a material under an applied force.
The constant of proportionality is the viscosity η and
•
= γητ (32)
From this equation it can be seen that the viscosity is readily obtainable by measuring the
shear stress and strain rate.
The Advanced Rheometry Expansion System (or ARES) from TA Instruments is
a controlled strain rheometer which is capable of subjecting a sample to either a dynamic
(sinusoidal) or steady (linear) shear strain, then measuring the resultant torque exerted by
the sample in response to the strain. Strain is applied by the motor and a transducer
measures the resulting torque.
30
For our experiments only the steady shear strain is used, with the outer cylinder of
the couette cell constantly rotating and subjecting the sample to a steady shear rate for the
duration of the experiment. The measured torque is then converted into shear stress and
combined with the shear cell geometry and applied strain to produce a measurement of
viscosity.
1.3 Differential Scanning Calorimetry
Differential Scanning Calorimetry (DSC) is a technique for measuring the
difference between the heat flow rate to a sample and to a reference sample while they
are subjected to identical temperature environments of heating or cooling [80].
The measurement of the difference in heat flow rate can only be accomplished
during a heating or cooling ramp since, barring chemical reaction heat flow rates, a
temperature ramp is required for a heat flow.
There are two basic types of DSCs: the Heat Flux DSC and the Power
Compensation DSC. In power compensation DSC the temperatures of the sample and the
reference are controlled independently using two different furnaces. The temperatures
are made identical by varying the power input to the two furnaces. The energy required
to do this is then a measure of the enthalpy or heat capacity change in the system. In heat
flux DSC, the sample and the reference are connected by a low resistance heat flow path
and the assembly is enclosed in a single furnace. Enthalpy or heat capacity changes in
the sample cause a difference in its temperature relative to the reference. The
temperature difference is recorded and related to enthalpy change in the sample using
calibration experiments.
31
The particular DSC we use is a TA Instruments Q100. This is a heat flux DSC
with a turret-type measuring system. In this system the heat exchange takes place via
small hollow cylinders which serve as elevated sample supports. This is a relatively new
design which allows for large heating and cooling rates with a small sample volume. A
more common type of DSC is the disk-type where the heat exchange takes place via a
disk which serves as a solid sample support. The disk-type is a simple and easily built
design with a high sensitivity, allowing for small sample volumes, however the heat
exchange between the furnace and the sample is limited, allowing for only medium
heating and cooling rates.
A turret-type system has the advantages of a very small system size combined
with a low thermal mass, a very short heat conducting path, a direct connection between
the sample and the furnace and no interference between the sample and the reference.
These things combine and result in a smaller furnace and a quicker thermal response time
than the disk-type system[81]. This allows for faster heating and cooling rates.
For a steady-state measurement, the real heat flow Φ of the sample is directly
proportional to the measurement signal ∆T. (∆T is simply the difference between the
temperature of the sample and the reference) The conditions of constant heat
consumption are achieved when the sample and reference have different, temperature-
independent heat capacities. In this way, a greater amount of heat will always flow into
the sample whose heat capacity is higher, in order to maintain the steady-state heating
rate. When the heat capacity of the sample is greater than the reference then the real heat
flow is directly proportional to the difference in sample temperatures.
32
TKSR ∆⋅−=∆Φ ' (33)
However, there is no steady-state condition for measurement during a transition or
reaction. Where there is a quasi-steady state then the following is valid in approximation
( )RSSR CC −=∆Φ β (34)
( ) TKCC RS ∆⋅−=− 'β (35)
This relation describes the baseline and is the basic equation for determining the
heat capacity CS. For an empty reference crucible CR = 0 and
βTKCS
∆⋅−= ' (36)
Integration of the measured curve with the baseline subtracted gives the heat of transition
or reaction. The heat equals the enthalpy of reaction or transition only if the heat
capacity is constant during the transformation. Otherwise the enthalpy of transition is a
function of temperature. As a consequence the peak area is an integral mean value of the
enthalpy change within the temperature regime of the peak.
1.4 X-ray Diffraction
The peaks in an x-ray diffraction pattern are directly related to the atomic
distances. Let us consider an incident x-ray beam interacting with the atoms arranged in a
periodic manner as shown Figure 8.
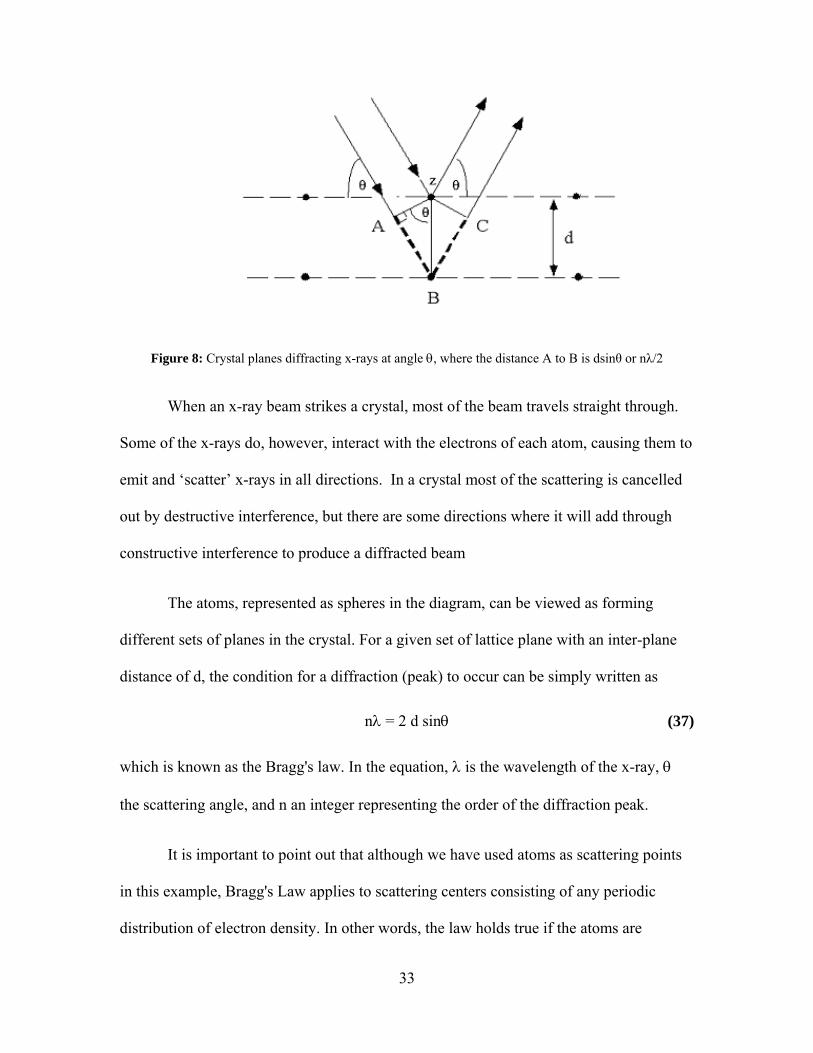
33
Figure 8: Crystal planes diffracting x-rays at angle θ, where the distance A to B is dsinθ or nλ/2
When an x-ray beam strikes a crystal, most of the beam travels straight through.
Some of the x-rays do, however, interact with the electrons of each atom, causing them to
emit and ‘scatter’ x-rays in all directions. In a crystal most of the scattering is cancelled
out by destructive interference, but there are some directions where it will add through
constructive interference to produce a diffracted beam
The atoms, represented as spheres in the diagram, can be viewed as forming
different sets of planes in the crystal. For a given set of lattice plane with an inter-plane
distance of d, the condition for a diffraction (peak) to occur can be simply written as
nλ = 2 d sinθ (37)
which is known as the Bragg's law. In the equation, λ is the wavelength of the x-ray, θ
the scattering angle, and n an integer representing the order of the diffraction peak.
It is important to point out that although we have used atoms as scattering points
in this example, Bragg's Law applies to scattering centers consisting of any periodic
distribution of electron density. In other words, the law holds true if the atoms are
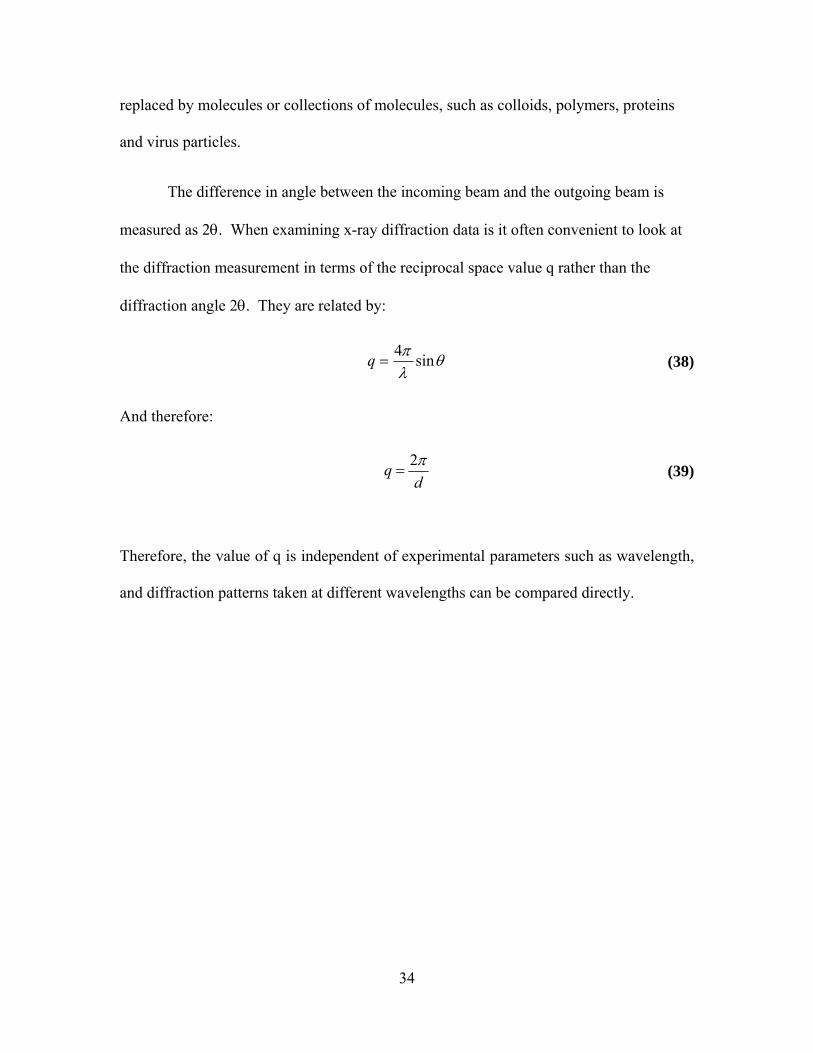
34
replaced by molecules or collections of molecules, such as colloids, polymers, proteins
and virus particles.
The difference in angle between the incoming beam and the outgoing beam is
measured as 2θ. When examining x-ray diffraction data is it often convenient to look at
the diffraction measurement in terms of the reciprocal space value q rather than the
diffraction angle 2θ. They are related by:
θ
λπ sin4
=q (38)
And therefore:
d
q π2=
(39)
Therefore, the value of q is independent of experimental parameters such as wavelength,
and diffraction patterns taken at different wavelengths can be compared directly.
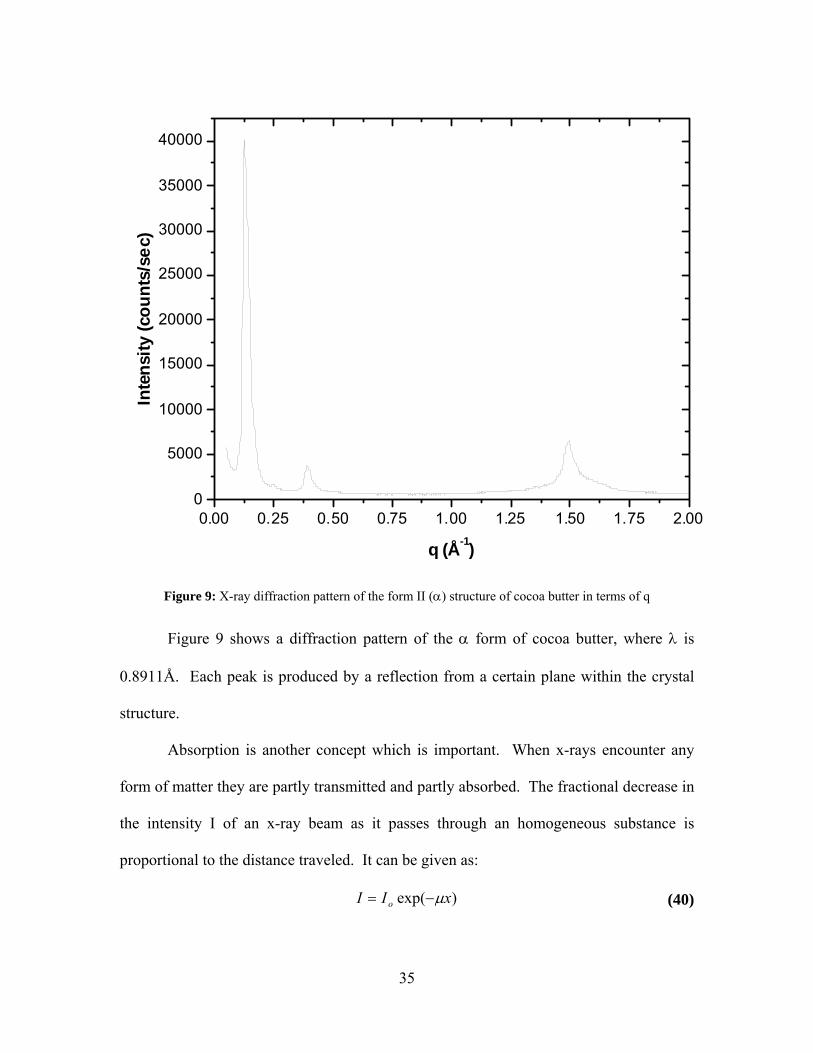
35
0.00 0.25 0.50 0.75 1.00 1.25 1.50 1.75 2.000
5000
10000
15000
20000
25000
30000
35000
40000In
tens
ity (c
ount
s/se
c)
q (Å-1)
Figure 9: X-ray diffraction pattern of the form II (α) structure of cocoa butter in terms of q
Figure 9 shows a diffraction pattern of the α form of cocoa butter, where λ is
0.8911Å. Each peak is produced by a reflection from a certain plane within the crystal
structure.
Absorption is another concept which is important. When x-rays encounter any
form of matter they are partly transmitted and partly absorbed. The fractional decrease in
the intensity I of an x-ray beam as it passes through an homogeneous substance is
proportional to the distance traveled. It can be given as:
)exp( xII o µ−= (40)
36
where I is the intensity of the transmitted beam, Io is the intensity of the incident beam, µ
is the linear absorption coefficient and x is the thickness the beam passes through.
Orientation within a crystalline material such as cocoa butter can be described as
having all of the crystal platelets lined up in the same direction. The effect of orientation
on a diffraction pattern can be seen in Figure 10. This is a 2-dimension diffraction
pattern, showing a ring of diffraction. The diffraction intensity is higher at the sides than
at the top and bottom indicating a preferred orientation within the material.
Figure 10: On the left, Figure 5-7 taken from Mazzanti [25] showing a 2-dimensional diffraction pattern
of an oriented sample with the arrow indicating the 0 position and the direction of the mosaic scan. On the
right, a depiction of oriented crystals
If we convert the diffraction pattern in Figure 10 into a one dimensional representation
we get something like Figure 11, which is a representation of the intensity around the
diffraction circle. This can also be referred to as a mosaic scan.
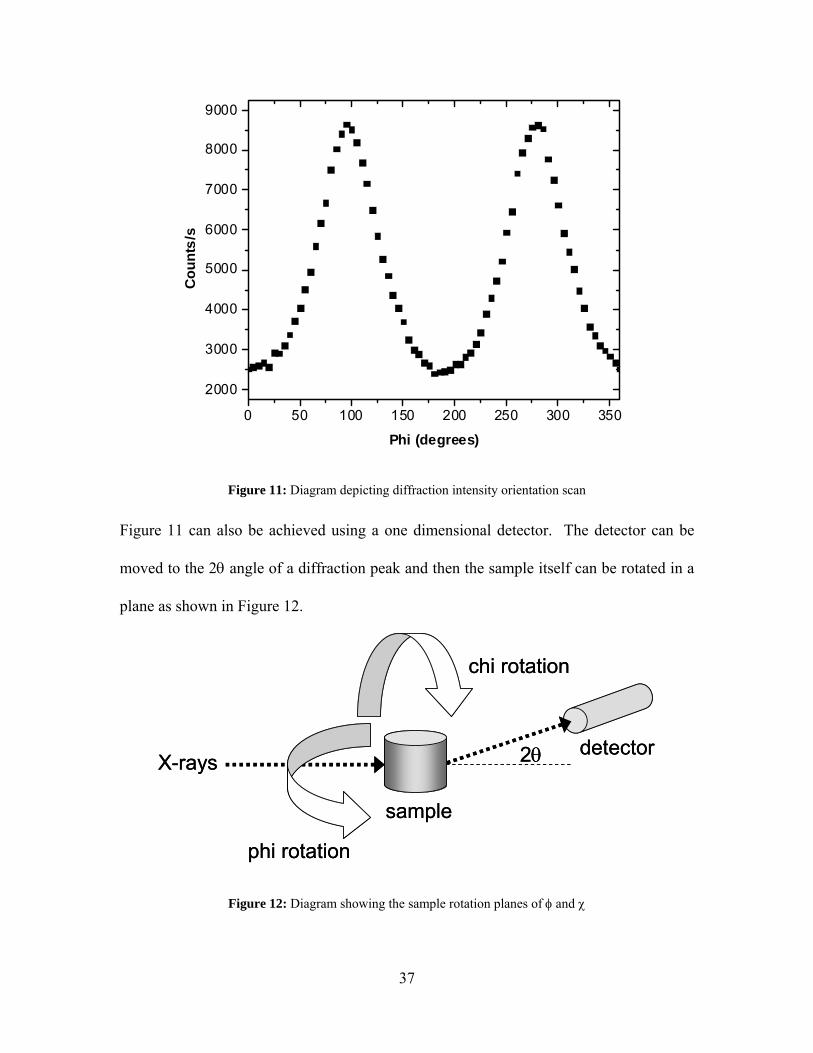
37
0 50 100 150 200 250 300 350
2000
3000
4000
5000
6000
7000
8000
9000
Cou
nts/
s
Phi (degrees)
Figure 11: Diagram depicting diffraction intensity orientation scan
Figure 11 can also be achieved using a one dimensional detector. The detector can be
moved to the 2θ angle of a diffraction peak and then the sample itself can be rotated in a
plane as shown in Figure 12.
sample
detector
phi rotation
chi rotation
2θX-rays
sample
detector
phi rotation
chi rotation
2θX-rays
Figure 12: Diagram showing the sample rotation planes of φ and χ
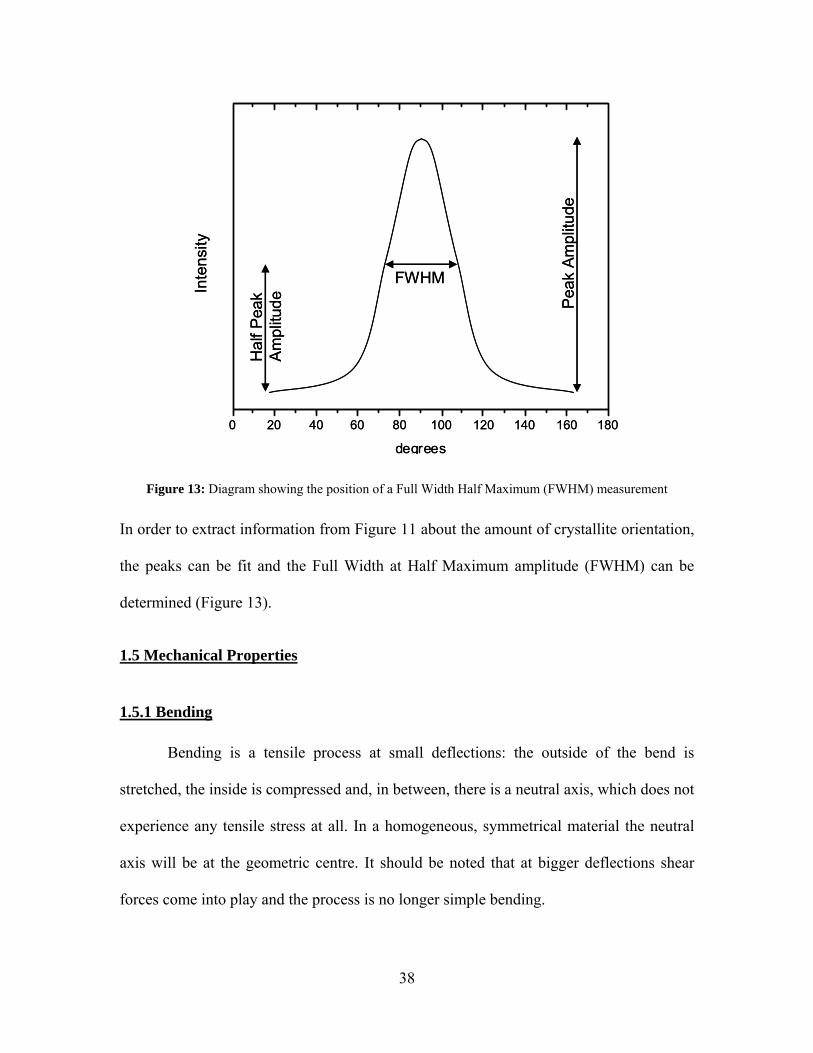
38
Pea
k Am
plitu
de
Hal
f Pea
k A
mpl
itude
Inte
nsity
FWHM
0 20 40 60 80 100 120 140 160 180
degrees
Pea
k Am
plitu
de
Hal
f Pea
k A
mpl
itude
Inte
nsity
FWHM
0 20 40 60 80 100 120 140 160 180
degrees
Figure 13: Diagram showing the position of a Full Width Half Maximum (FWHM) measurement
In order to extract information from Figure 11 about the amount of crystallite orientation,
the peaks can be fit and the Full Width at Half Maximum amplitude (FWHM) can be
determined (Figure 13).
1.5 Mechanical Properties
1.5.1 Bending
Bending is a tensile process at small deflections: the outside of the bend is
stretched, the inside is compressed and, in between, there is a neutral axis, which does not
experience any tensile stress at all. In a homogeneous, symmetrical material the neutral
axis will be at the geometric centre. It should be noted that at bigger deflections shear
forces come into play and the process is no longer simple bending.
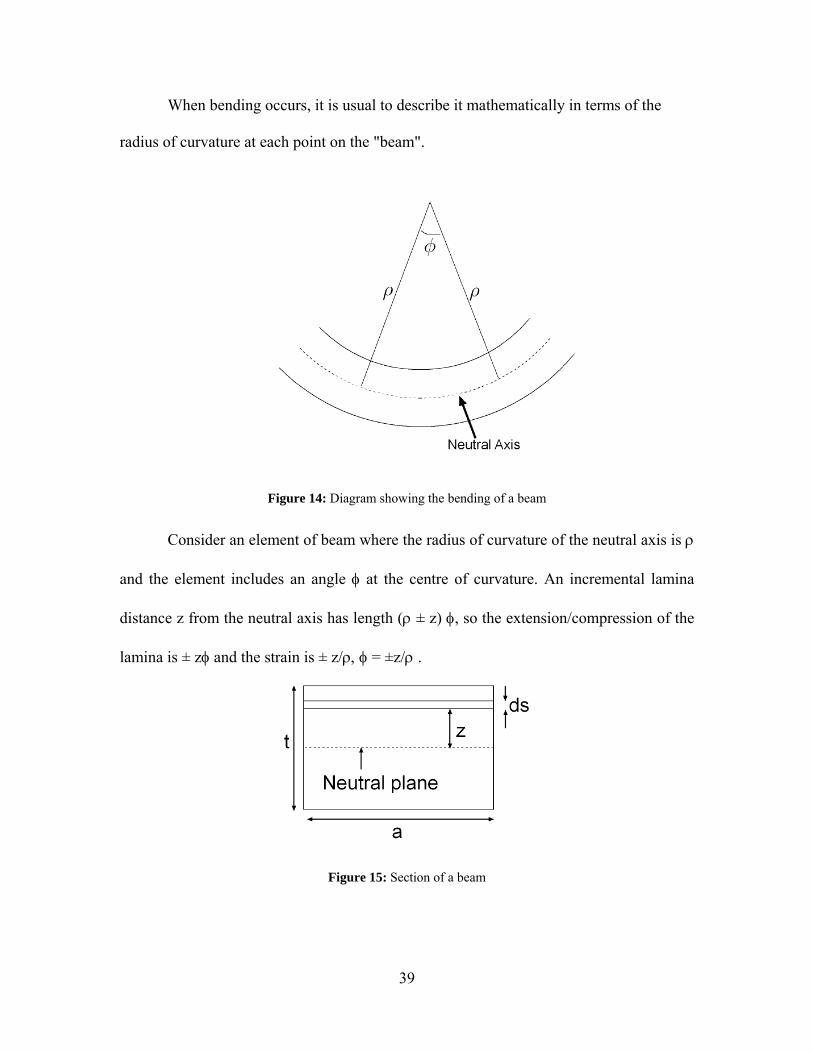
39
When bending occurs, it is usual to describe it mathematically in terms of the
radius of curvature at each point on the "beam".
Figure 14: Diagram showing the bending of a beam
Consider an element of beam where the radius of curvature of the neutral axis is ρ
and the element includes an angle φ at the centre of curvature. An incremental lamina
distance z from the neutral axis has length (ρ ± z) φ, so the extension/compression of the
lamina is ± zφ and the strain is ± z/ρ, φ = ±z/ρ .
Figure 15: Section of a beam
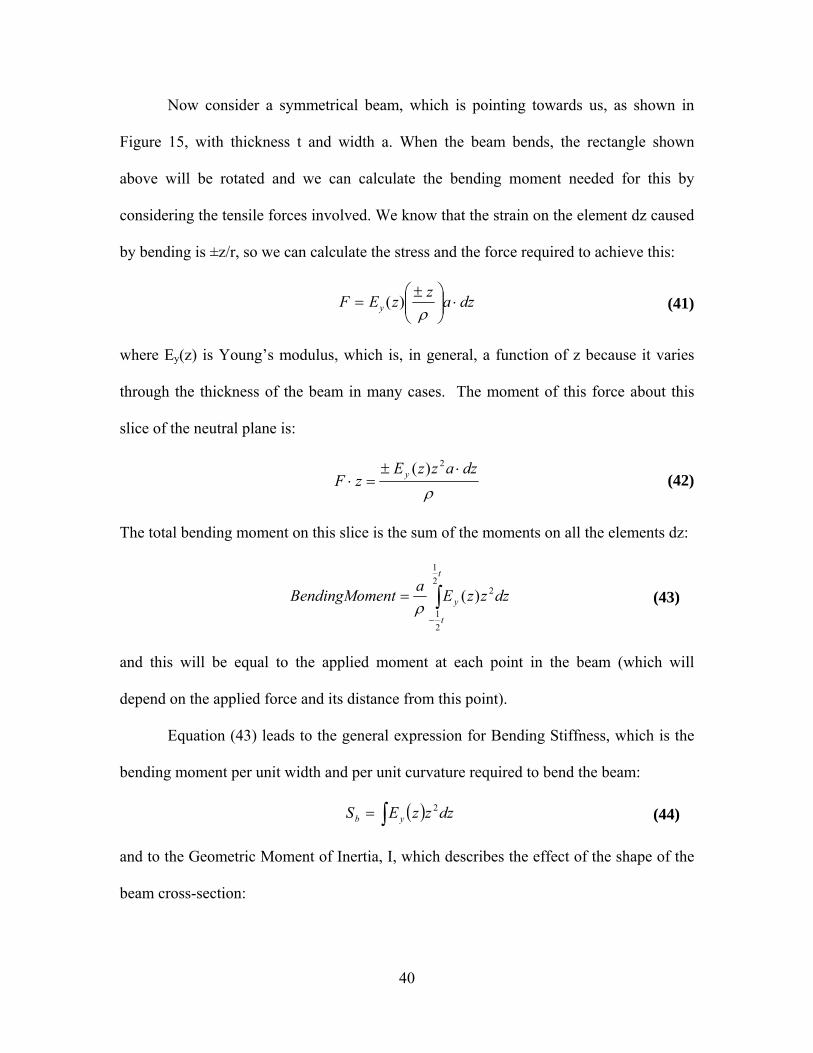
40
Now consider a symmetrical beam, which is pointing towards us, as shown in
Figure 15, with thickness t and width a. When the beam bends, the rectangle shown
above will be rotated and we can calculate the bending moment needed for this by
considering the tensile forces involved. We know that the strain on the element dz caused
by bending is ±z/r, so we can calculate the stress and the force required to achieve this:
dzazzEF y ⋅⎟⎟
⎠
⎞⎜⎜⎝
⎛ ±=
ρ)( (41)
where Ey(z) is Young’s modulus, which is, in general, a function of z because it varies
through the thickness of the beam in many cases. The moment of this force about this
slice of the neutral plane is:
ρdzazzE
zF y ⋅±=⋅
2)( (42)
The total bending moment on this slice is the sum of the moments on all the elements dz:
∫−
=
t
t
y dzzzEaentBendingMom21
21
2)(ρ
(43)
and this will be equal to the applied moment at each point in the beam (which will
depend on the applied force and its distance from this point).
Equation (43) leads to the general expression for Bending Stiffness, which is the
bending moment per unit width and per unit curvature required to bend the beam:
( )∫= dzzzES yb2 (44)
and to the Geometric Moment of Inertia, I, which describes the effect of the shape of the
beam cross-section:
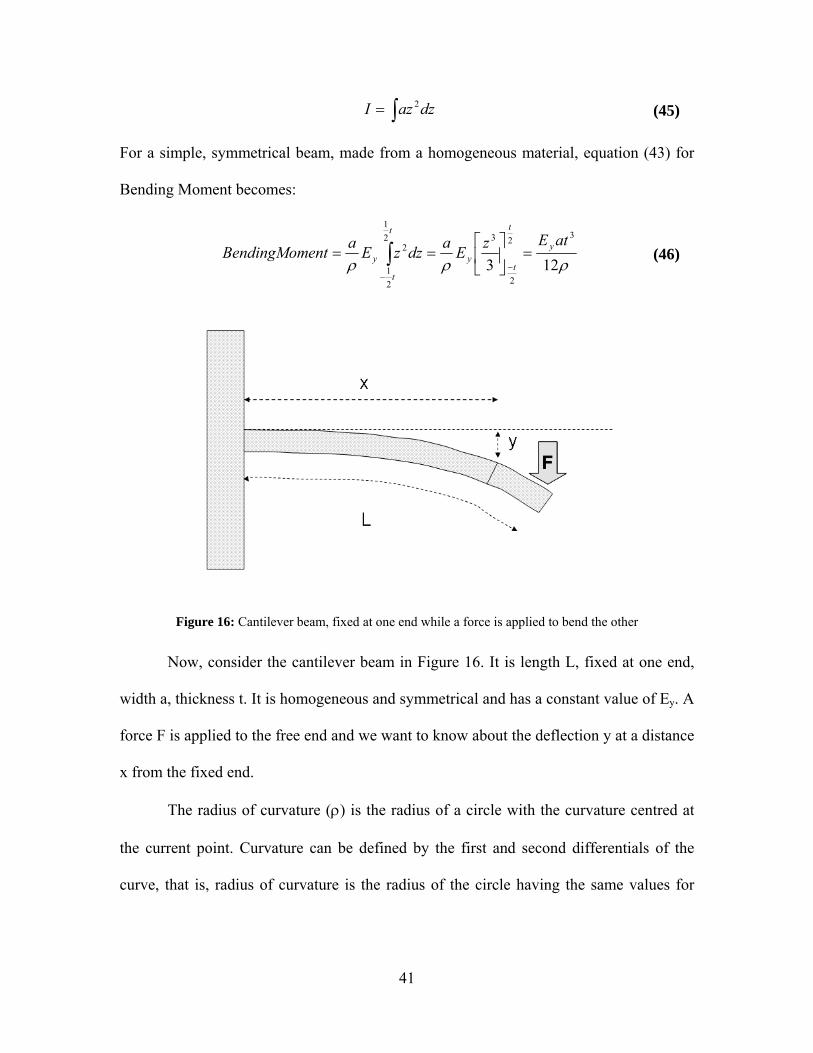
41
∫= dzazI 2 (45)
For a simple, symmetrical beam, made from a homogeneous material, equation (43) for
Bending Moment becomes:
ρρρ 123
32
2
321
21
2 atEzEadzzEaentBendingMom y
t
ty
t
t
y =⎥⎦
⎤⎢⎣
⎡==
−−
∫ (46)
Figure 16: Cantilever beam, fixed at one end while a force is applied to bend the other
Now, consider the cantilever beam in Figure 16. It is length L, fixed at one end,
width a, thickness t. It is homogeneous and symmetrical and has a constant value of Ey. A
force F is applied to the free end and we want to know about the deflection y at a distance
x from the fixed end.
The radius of curvature (ρ) is the radius of a circle with the curvature centred at
the current point. Curvature can be defined by the first and second differentials of the
curve, that is, radius of curvature is the radius of the circle having the same values for
42
dy/dx and d2y/dx2 as the current point. The value of ρ can be calculated by manipulating
the equation for a circle:
A circle with centre (a,b) and radius r has equation:
( ) 222)( rbyax =−+− (47)
If we differentiate with respect to x:
( ) 02)(2 =−+−dxdybyax (48)
Which, when rearranged and after substituting r back in gives
( )( )
bybyr
dxdy
−−−
−=21
22
(49)
Differentiating a second time
( ) 0222 2
22
=−+⎟⎠⎞
⎜⎝⎛+
dxydby
dxdy
2
2
2
1
)(
dxyd
dxdy
by⎟⎟⎠
⎞⎜⎜⎝
⎛⎟⎠⎞
⎜⎝⎛+−
=−
(50)
If we substitute (50) into (49), rearrange and simplify then we find
23
2
2
2
1
1
⎟⎟⎠
⎞⎜⎜⎝
⎛⎟⎠⎞
⎜⎝⎛+
=
dxdy
dxyd
r
(51)
So, the radius of curvature, ρ, is defined as
43
23
2
2
2
1
1
⎟⎟⎠
⎞⎜⎜⎝
⎛⎟⎠⎞
⎜⎝⎛+
=
dxdy
dxyd
ρ
(52)
But for small deflections
dxdy is small and 1
2
<<⎟⎠⎞
⎜⎝⎛
dxdy so
2
21dx
yd=
ρ (53)
The bending moment at distance x from the wall equals the applied bending moment.
Using equations (44), (45) and (53):
)(2
2
xLFdx
ydIEentBendingMom y −== (54)
Integrating, we get
KxLx
IEF
dxdy
y
+⎟⎟⎠
⎞⎜⎜⎝
⎛−=
2
2
(55)
There is a boundary condition that, at x=0, dy/dx = 0, so K =0.
Integrating a second time:
KxLx
IEFyy
′+⎟⎟⎠
⎞⎜⎜⎝
⎛−=
62
33
(56)
There is a boundary condition that, at x = 0, y = 0 so K’ = 0. So at x = L:
IE
FLyy
L 3
3
= (57)
And the bending stiffness is
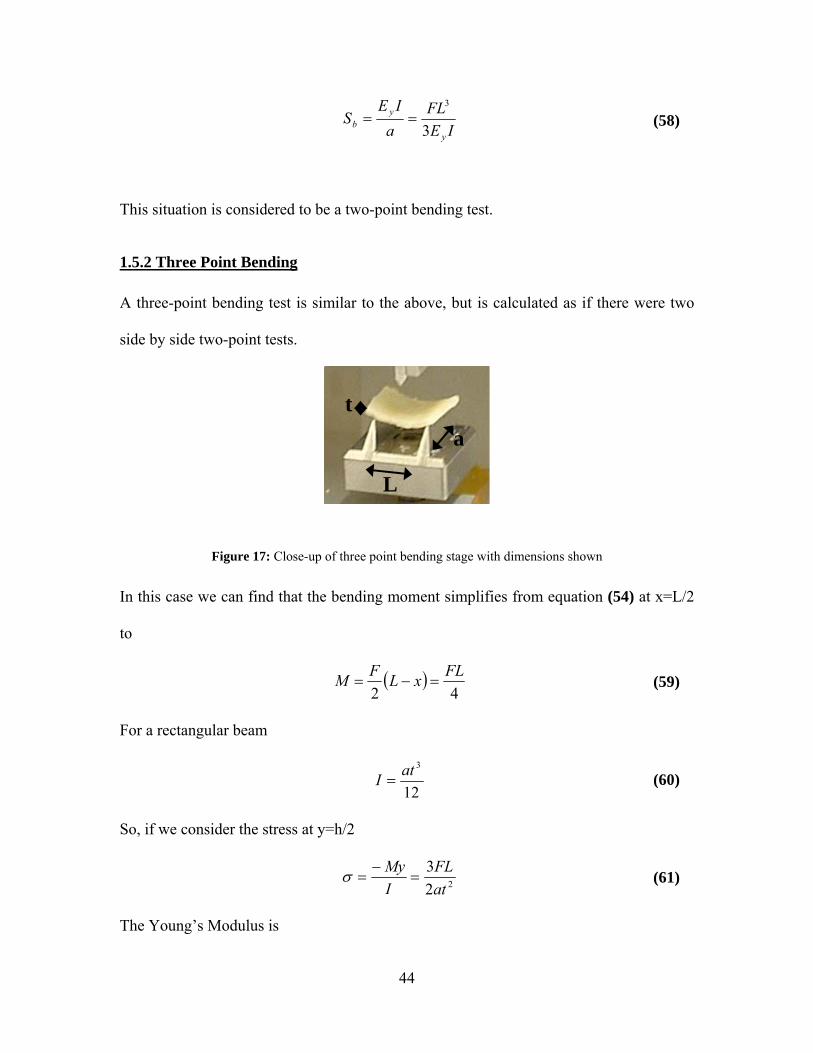
44
IE
FLa
IES
y
yb 3
3
== (58)
This situation is considered to be a two-point bending test.
1.5.2 Three Point Bending
A three-point bending test is similar to the above, but is calculated as if there were two
side by side two-point tests.
Figure 17: Close-up of three point bending stage with dimensions shown
In this case we can find that the bending moment simplifies from equation (54) at x=L/2
to
( )42
FLxLFM =−= (59)
For a rectangular beam
12
3atI = (60)
So, if we consider the stress at y=h/2
22
3atFL
IMy
=−
=σ (61)
The Young’s Modulus is
at
L
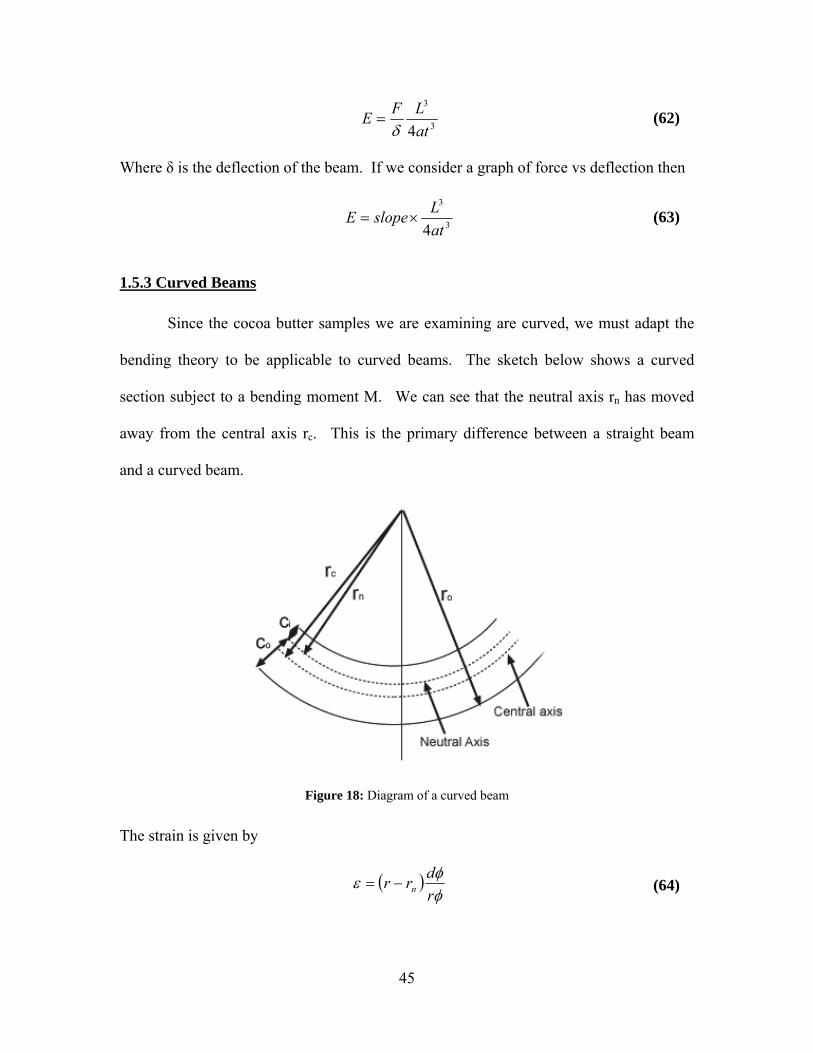
45
3
3
4atLFE
δ= (62)
Where δ is the deflection of the beam. If we consider a graph of force vs deflection then
3
3
4atLslopeE ×= (63)
1.5.3 Curved Beams
Since the cocoa butter samples we are examining are curved, we must adapt the
bending theory to be applicable to curved beams. The sketch below shows a curved
section subject to a bending moment M. We can see that the neutral axis rn has moved
away from the central axis rc. This is the primary difference between a straight beam
and a curved beam.
Figure 18: Diagram of a curved beam
The strain is given by
( )φφε
rdrr n−= (64)
46
The strain is 0 when r is at the neutral axis and is maximum when r is the outer radius of
the beam (r = ro)
Using the relationship of stress/strain = E the normal stress is simply
( )φφεσ
rdrrEE n−== (65)
The location of the neutral axis is obtained by summing the product of the normal stress
and the area elements over the whole area and setting it to 0
∫∫ =
−=⋅
A
n
A
dAr
rrEddA 0φ
φσ (66)
This reduces to
∫ =⎟
⎠⎞
⎜⎝⎛−
An r
dArA 0 (67)
And so for a rectangle,
( )
⎟⎟⎠
⎞⎜⎜⎝
⎛−
=⎟⎠⎞
⎜⎝⎛
=
∫i
o
io
A
n
rr
rr
rdAAr
ln
(68)
where ri is the inner radius and ro is the outer radius.
The stress resulting from an applied bending moment is derived from the fact that
the resisting moment is simply the integral over the whole section of the moment arm
from the neutral axis (y) multiplied by σdA (= dF). It reduces to
( )( )n
nc
rrrrAr
M−
−=
σ (69)
And so
( )rrrA
rrM
nc
n
)( −−
=σ (70)
47
The maximum stress will occur at either the inner or the outer surface.
The curved beam flexure formula is in reasonable agreement with the straight beam
formula for beams with a ratio of curvature to beam depth of rc/h > 5. As the beam
curvature/depth radius increases the difference between the maximum stress calculated
by curved beam formula and the normal beam formula reduces. If the ratio is about 10
then a maximum stress error of only about 4% results from using the straight beam
formulae.
48
2.0 Experiment
2.1 Split Rheometer Couette Cell
2.1.1 Split Couette Cell Design:
Simple temperature controlled shear flow can be achieved with a rheometer quite
easily by employing a water bath for temperature control and concentric cylinders for
applying shear. With a TA Instruments ARES-RFS strain controlled rheometer (Figure
19(a)), a cylindrical ‘cup’ is rotated, while a stationary ‘tool’ or ‘bob’ is held within the
cup and connected to a sensor above. In this manner a sample is contained between two
surfaces and sheared between one stationary and one moving surface, the traditional
Couette geometry. The bob sensor measures normal force and torque, allowing for
continuous monitoring of the crystallization process within the sample. The temperature
of the system is monitored via a sensor at the bottom of the sample cup set into the water
bath.
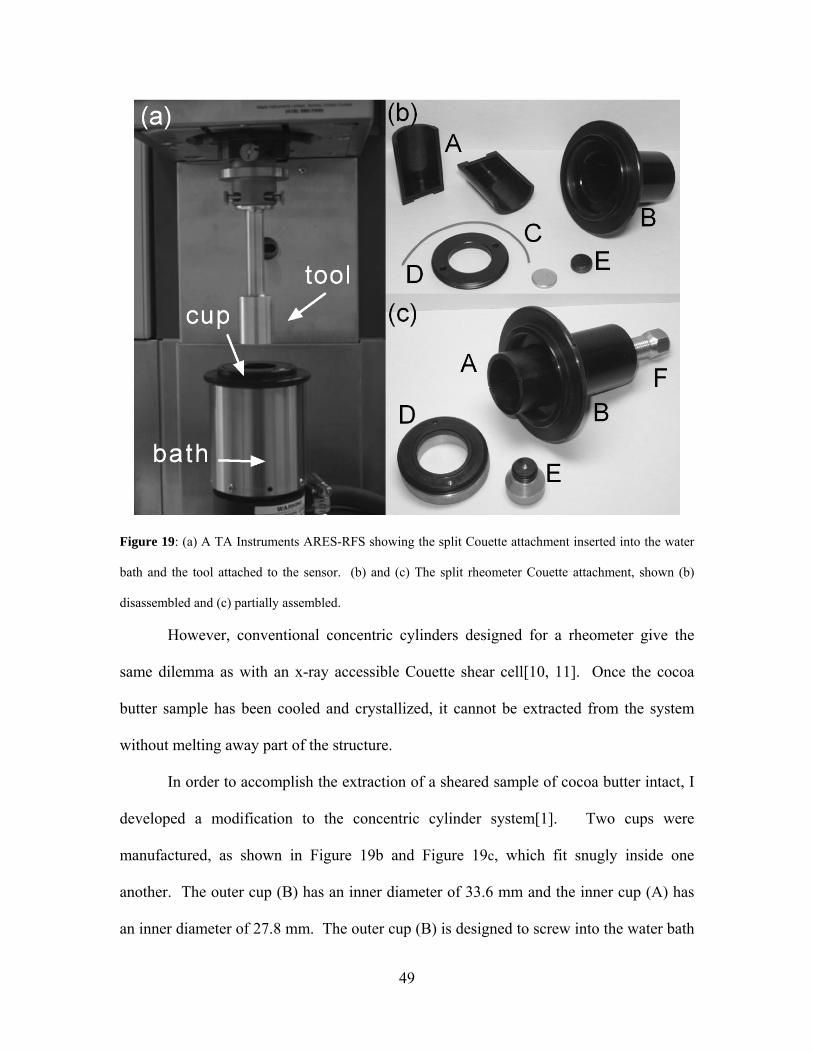
49
Figure 19: (a) A TA Instruments ARES-RFS showing the split Couette attachment inserted into the water
bath and the tool attached to the sensor. (b) and (c) The split rheometer Couette attachment, shown (b)
disassembled and (c) partially assembled.
However, conventional concentric cylinders designed for a rheometer give the
same dilemma as with an x-ray accessible Couette shear cell[10, 11]. Once the cocoa
butter sample has been cooled and crystallized, it cannot be extracted from the system
without melting away part of the structure.
In order to accomplish the extraction of a sheared sample of cocoa butter intact, I
developed a modification to the concentric cylinder system[1]. Two cups were
manufactured, as shown in Figure 19b and Figure 19c, which fit snugly inside one
another. The outer cup (B) has an inner diameter of 33.6 mm and the inner cup (A) has
an inner diameter of 27.8 mm. The outer cup (B) is designed to screw into the water bath
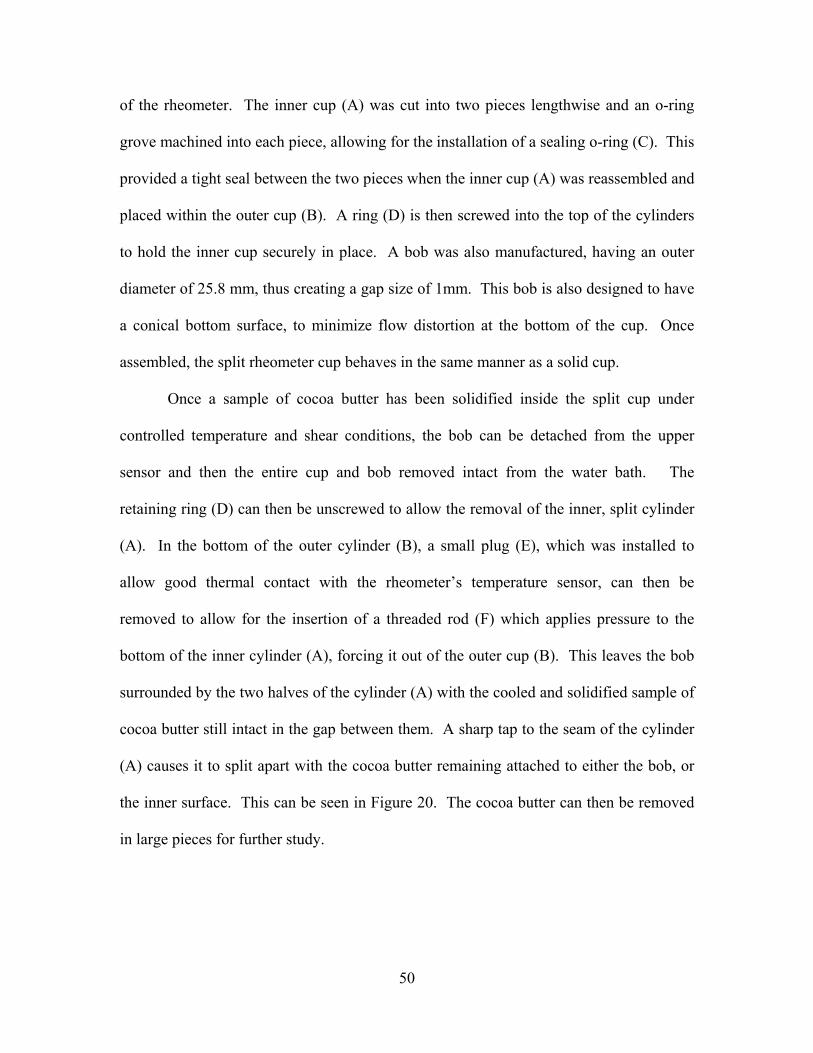
50
of the rheometer. The inner cup (A) was cut into two pieces lengthwise and an o-ring
grove machined into each piece, allowing for the installation of a sealing o-ring (C). This
provided a tight seal between the two pieces when the inner cup (A) was reassembled and
placed within the outer cup (B). A ring (D) is then screwed into the top of the cylinders
to hold the inner cup securely in place. A bob was also manufactured, having an outer
diameter of 25.8 mm, thus creating a gap size of 1mm. This bob is also designed to have
a conical bottom surface, to minimize flow distortion at the bottom of the cup. Once
assembled, the split rheometer cup behaves in the same manner as a solid cup.
Once a sample of cocoa butter has been solidified inside the split cup under
controlled temperature and shear conditions, the bob can be detached from the upper
sensor and then the entire cup and bob removed intact from the water bath. The
retaining ring (D) can then be unscrewed to allow the removal of the inner, split cylinder
(A). In the bottom of the outer cylinder (B), a small plug (E), which was installed to
allow good thermal contact with the rheometer’s temperature sensor, can then be
removed to allow for the insertion of a threaded rod (F) which applies pressure to the
bottom of the inner cylinder (A), forcing it out of the outer cup (B). This leaves the bob
surrounded by the two halves of the cylinder (A) with the cooled and solidified sample of
cocoa butter still intact in the gap between them. A sharp tap to the seam of the cylinder
(A) causes it to split apart with the cocoa butter remaining attached to either the bob, or
the inner surface. This can be seen in Figure 20. The cocoa butter can then be removed
in large pieces for further study.
51
Figure 20: The split Couette attachment with a sample of cocoa butter having been cooled from 50 to 18°C
at 0.5°C/min while sheared at 500s-1.
A typical rheometer sample run for the split Couette attachment is shown in
Figure 21. A sample of cocoa butter (2.8mL) is put into the sample cup. The bob is
lowered to create a gap of 0.6mm between the bottom of the bob and the bottom surface
of the cup. The sample is held in a melted state at 50°C for a period of 30 minutes before
a shear rate of 360s-1 is applied, simultaneously with the temperature beginning to
decrease at a rate of 0.5°C/min from 50°C to 18°C. Once 18°C is reached, the
temperature plateaus and two separate crystallization events occur. The first event is the
transition from the melt to crystal form II [11]. The second event is the transition from
form II to form V [11]. X-ray diffraction of such a sample confirms the presence of a
mixed structure consisting of forms II and V, with the amount of form V increasing
proportionally to the applied shear rate[25]. That is, the higher the shear rate, the more
form V present in the sample.
52
To assess the ability of the split Couette insert to accurately measure viscosity a
comparison was done with the standard cup and bob provided with the rheometer. The
attachment has an inner cup diameter of 34mm and a bob diameter of 32mm, thus
creating a 1mm gap. A large sample volume of 15mL is required. The bob features an
indent at the bottom to minimize end effects. Figure 21 shows a comparison of the two
different Couette attachments. Clearly these two results are quite comparable, yet there
are differences in both the viscosity and the time to onset of crystallization. The
differences in viscosity can be accounted for by considering that there would be a lag in
cooling the larger sample volume, while the difference in the onset time of crystallization
is only slight and certainly within reasonable limits for our instrument given the degree of
temperature control that is attainable.
The temperature of the top and bottom of the sample was also closely monitored
during an experiment to assess temperature lag within the sample volume. At the end of
the fastest cooling ramp of 2°C/min the top of the cell was found to be only 0.2° warmer
than the bottom of the cell.
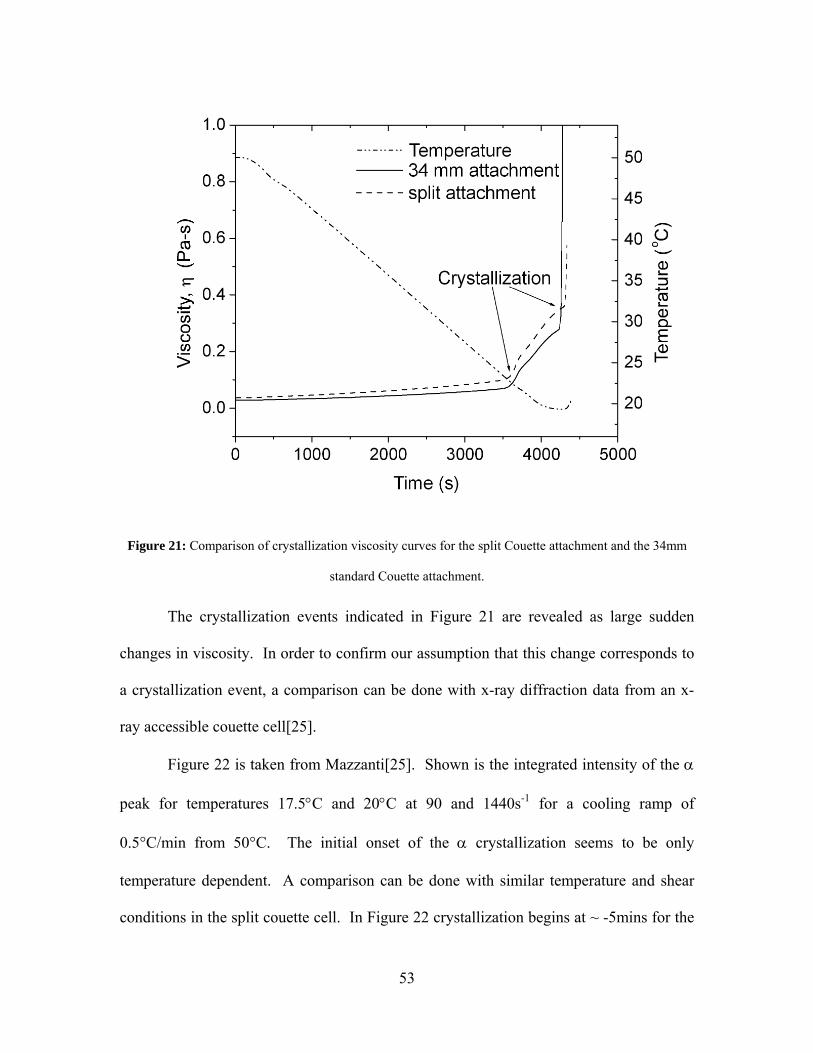
53
Figure 21: Comparison of crystallization viscosity curves for the split Couette attachment and the 34mm
standard Couette attachment.
The crystallization events indicated in Figure 21 are revealed as large sudden
changes in viscosity. In order to confirm our assumption that this change corresponds to
a crystallization event, a comparison can be done with x-ray diffraction data from an x-
ray accessible couette cell[25].
Figure 22 is taken from Mazzanti[25]. Shown is the integrated intensity of the α
peak for temperatures 17.5°C and 20°C at 90 and 1440s-1 for a cooling ramp of
0.5°C/min from 50°C. The initial onset of the α crystallization seems to be only
temperature dependent. A comparison can be done with similar temperature and shear
conditions in the split couette cell. In Figure 22 crystallization begins at ~ -5mins for the
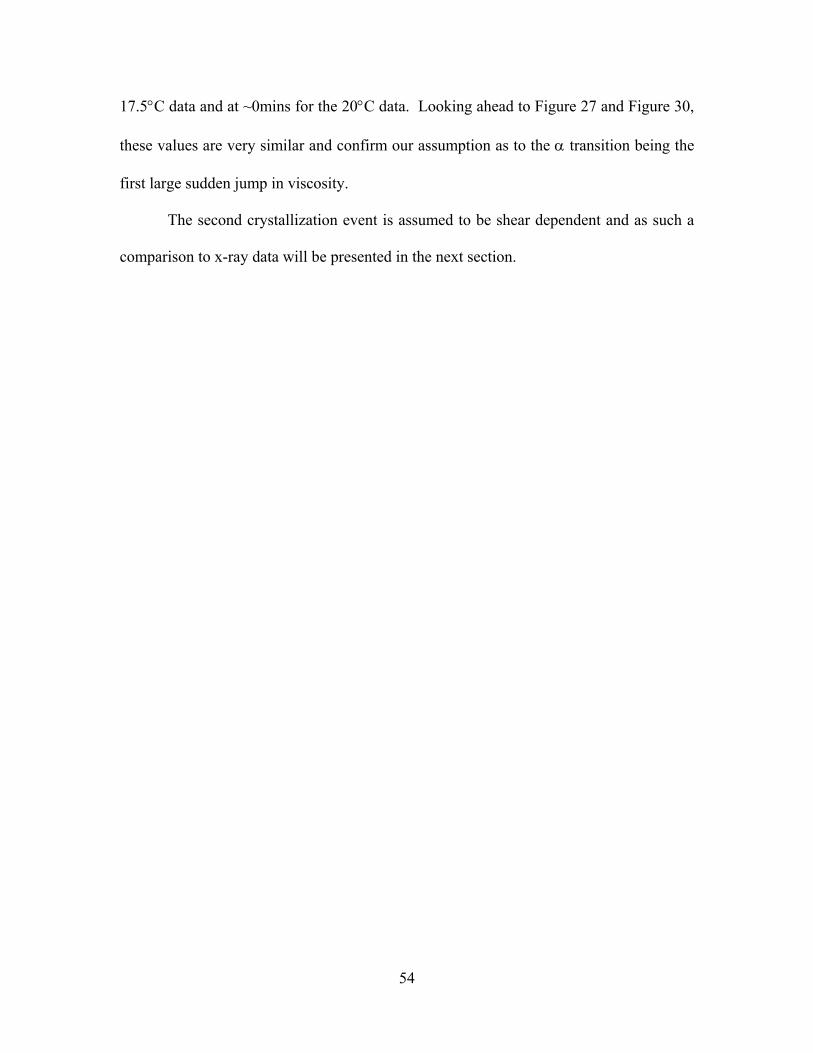
54
17.5°C data and at ~0mins for the 20°C data. Looking ahead to Figure 27 and Figure 30,
these values are very similar and confirm our assumption as to the α transition being the
first large sudden jump in viscosity.
The second crystallization event is assumed to be shear dependent and as such a
comparison to x-ray data will be presented in the next section.
55
2
4
6
8
0.005
0.006
0.007
0.008
0 10 20 30
0.126
0.127
0.128
Inte
grat
ed In
tens
ity a
.u.
FWH
M, A
-1
Time, min
0 s-1, 17.5 C 90 s-1, 17.5 C 1440 s-1, 17.5 C 90 s-1, 20 C 1440 s-1, 20 C
Peak
pos
ition
, A-1
Figure 22: Figure 6-28 taken from Mazzanti[25] depicting x-ray diffraction data of the α peak taken in an
x-ray accessible couette cell at the slow cooling rate of 0.5 C/min.
56
2.2.2 Split Couette Experiments:
Cocoa butter was obtained from Barry-Callebaut (Belgium). A volume of 4mL
was placed into the Couette cell. This volume was changed from the previously shown
results (Figure 21) in order to have a volume which just submerged the bob. This was
done to eliminate any effect of a change of density in the material due to crystallization
and temperature (I.e,. a change in density of the material would change the volume and
thus height of the sample in the cup, effectively changing the contact area. Submerging
the bob means the contact area remains constant regardless). This submersion also
eliminated edge effects. A cap was also placed on the top of the cell to help minimize
heat flow from or to the surroundings.
The cocoa butter, once loaded into the cell, was heated to 50°C for 30 minutes
before being subjected to a cooling ramp. This initial hold time was used to make sure
that the sample was fully melted. The water bath surrounding the outer cylinder was
employed to cool the system with three different cooling rates (0.5°C/min, 1°C/min and
2°C/min) to three different end point temperatures (16°C, 18°C, and 20°C). Viscosity
and temperature as a function of time were recorded by the rheometer until the cocoa
butter had crystallized to a point where the torque on the inner cylinder was sufficient to
cause the system to shut down to protect the sensor.
The cocoa butter was then extracted from the sample cup in two half cylinder
pieces and stored in an incubator set to the end point temperature until needed.
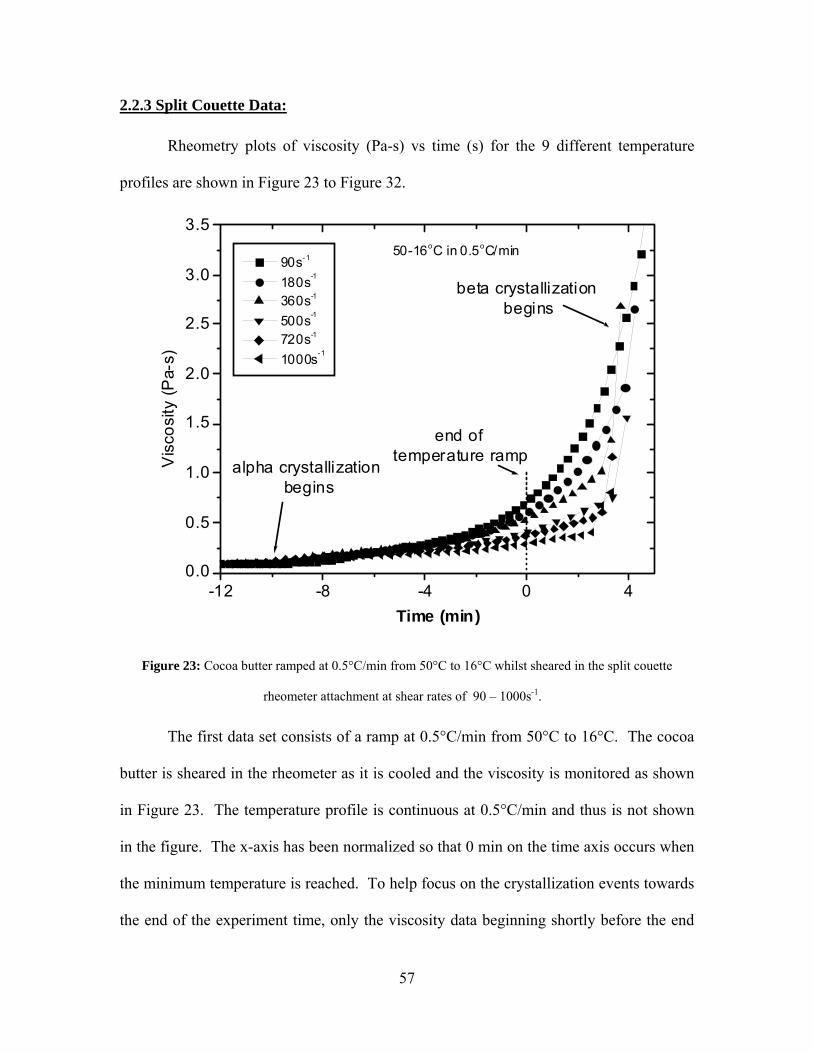
57
2.2.3 Split Couette Data:
Rheometry plots of viscosity (Pa-s) vs time (s) for the 9 different temperature
profiles are shown in Figure 23 to Figure 32.
-12 -8 -4 0 40.0
0.5
1.0
1.5
2.0
2.5
3.0
3.5
beta crystallization begins
end of temperature ramp
alpha crystallization begins
50-16oC in 0.5oC/min
Vis
cosi
ty (P
a-s)
Time (min)
90s-1
180s-1
360s-1
500s-1
720s-1
1000s-1
Figure 23: Cocoa butter ramped at 0.5°C/min from 50°C to 16°C whilst sheared in the split couette
rheometer attachment at shear rates of 90 – 1000s-1.
The first data set consists of a ramp at 0.5°C/min from 50°C to 16°C. The cocoa
butter is sheared in the rheometer as it is cooled and the viscosity is monitored as shown
in Figure 23. The temperature profile is continuous at 0.5°C/min and thus is not shown
in the figure. The x-axis has been normalized so that 0 min on the time axis occurs when
the minimum temperature is reached. To help focus on the crystallization events towards
the end of the experiment time, only the viscosity data beginning shortly before the end
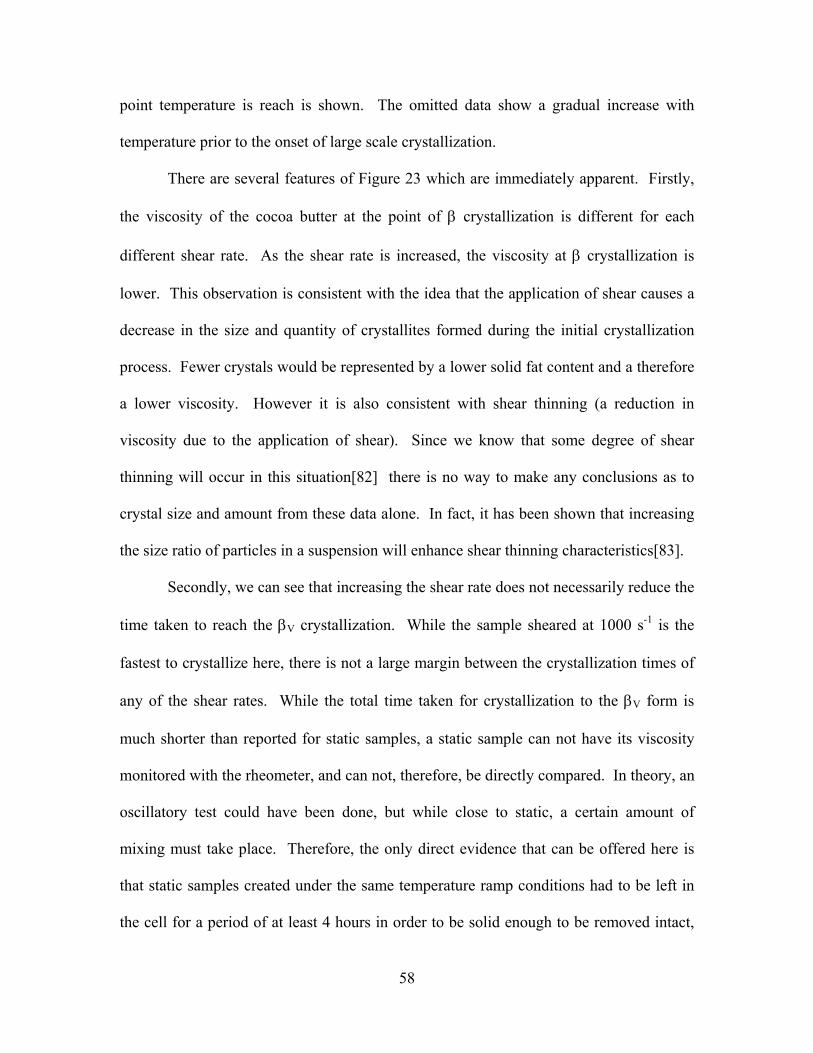
58
point temperature is reach is shown. The omitted data show a gradual increase with
temperature prior to the onset of large scale crystallization.
There are several features of Figure 23 which are immediately apparent. Firstly,
the viscosity of the cocoa butter at the point of β crystallization is different for each
different shear rate. As the shear rate is increased, the viscosity at β crystallization is
lower. This observation is consistent with the idea that the application of shear causes a
decrease in the size and quantity of crystallites formed during the initial crystallization
process. Fewer crystals would be represented by a lower solid fat content and a therefore
a lower viscosity. However it is also consistent with shear thinning (a reduction in
viscosity due to the application of shear). Since we know that some degree of shear
thinning will occur in this situation[82] there is no way to make any conclusions as to
crystal size and amount from these data alone. In fact, it has been shown that increasing
the size ratio of particles in a suspension will enhance shear thinning characteristics[83].
Secondly, we can see that increasing the shear rate does not necessarily reduce the
time taken to reach the βV crystallization. While the sample sheared at 1000 s-1 is the
fastest to crystallize here, there is not a large margin between the crystallization times of
any of the shear rates. While the total time taken for crystallization to the βV form is
much shorter than reported for static samples, a static sample can not have its viscosity
monitored with the rheometer, and can not, therefore, be directly compared. In theory, an
oscillatory test could have been done, but while close to static, a certain amount of
mixing must take place. Therefore, the only direct evidence that can be offered here is
that static samples created under the same temperature ramp conditions had to be left in
the cell for a period of at least 4 hours in order to be solid enough to be removed intact,
59
whilst the sheared samples could be removed immediately. A phase diagram of static
work can however be found in Marangoni and McGauley [44] (Figure 4).
We should also note that the two separate crystallization events shown in Figure
21 are much more difficult to pinpoint here. The second event is still quite obvious;
however the α transition is much more ambiguous. An event seems to take place at ~ -10
minutes. On this scale it is hard to differentiate, however if we focus, for example, on the
1000s-1 shear rate on the original scale as shown in Figure 24 it becomes much more
apparent. In this particular data set of 50-16°C in 0.5°C/min, the low final temperature
allows for a very large range in viscosities between the shear rates as at lower
temperature, more fat will crystallize and that fat will have a higher solid fat content due
to the lower temperature.
60
-70 -60 -50 -40 -30 -20 -10 0 100.0
0.1
0.2
0.3
0.4
0.5
alpha crystallization begins
beta crystallization begins
Vis
cosi
ty (P
a-s)
Time (min)
Figure 24: Cocoa butter ramped at 0.5°C/min from 50°C to 16°C whilst sheared in the split couette
rheometer attachment at a shear rates of 1000s-1.
Moving now to look at the same end point temperature, but with a slightly faster
cooling ramp (Figure 25), we notice that the main differences between it and Figure 23
are the larger spread between the viscosities of the different shear rates, the shape of the
curves and the final crystallization time.
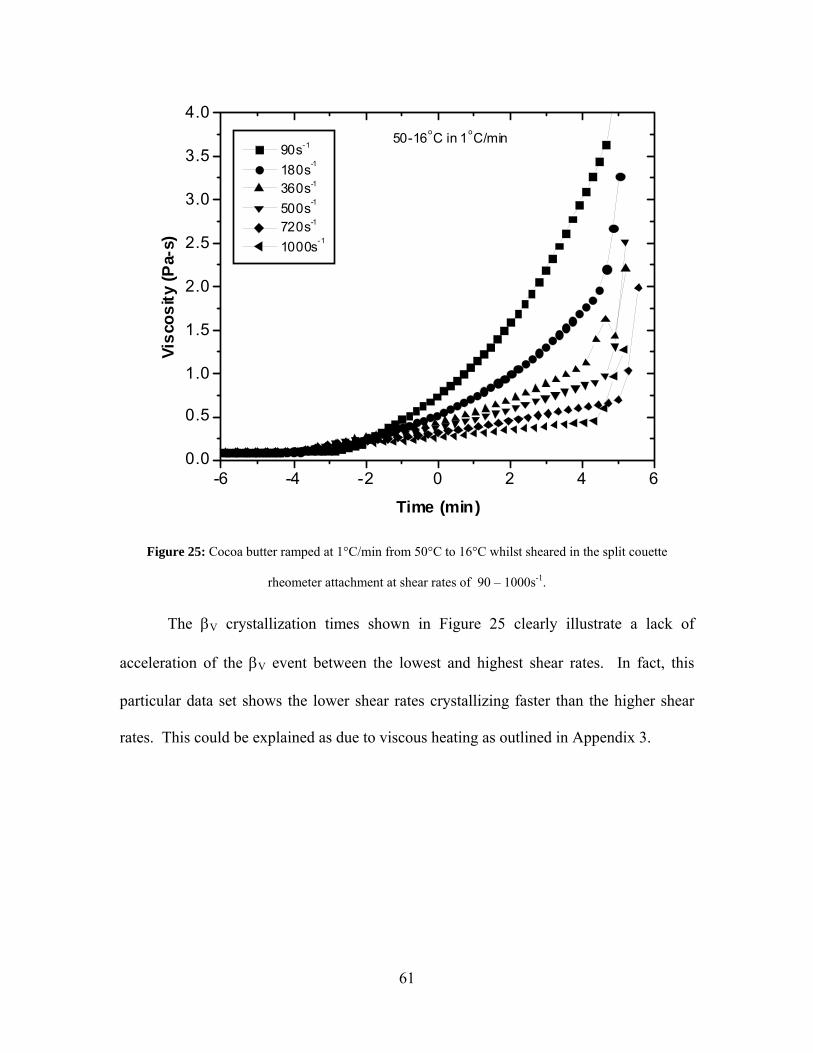
61
-6 -4 -2 0 2 4 60.0
0.5
1.0
1.5
2.0
2.5
3.0
3.5
4.050-16oC in 1oC/min
Visc
osity
(Pa-
s)
Time (min)
90s-1
180s-1
360s-1
500s-1
720s-1
1000s-1
Figure 25: Cocoa butter ramped at 1°C/min from 50°C to 16°C whilst sheared in the split couette
rheometer attachment at shear rates of 90 – 1000s-1.
The βV crystallization times shown in Figure 25 clearly illustrate a lack of
acceleration of the βV event between the lowest and highest shear rates. In fact, this
particular data set shows the lower shear rates crystallizing faster than the higher shear
rates. This could be explained as due to viscous heating as outlined in Appendix 3.
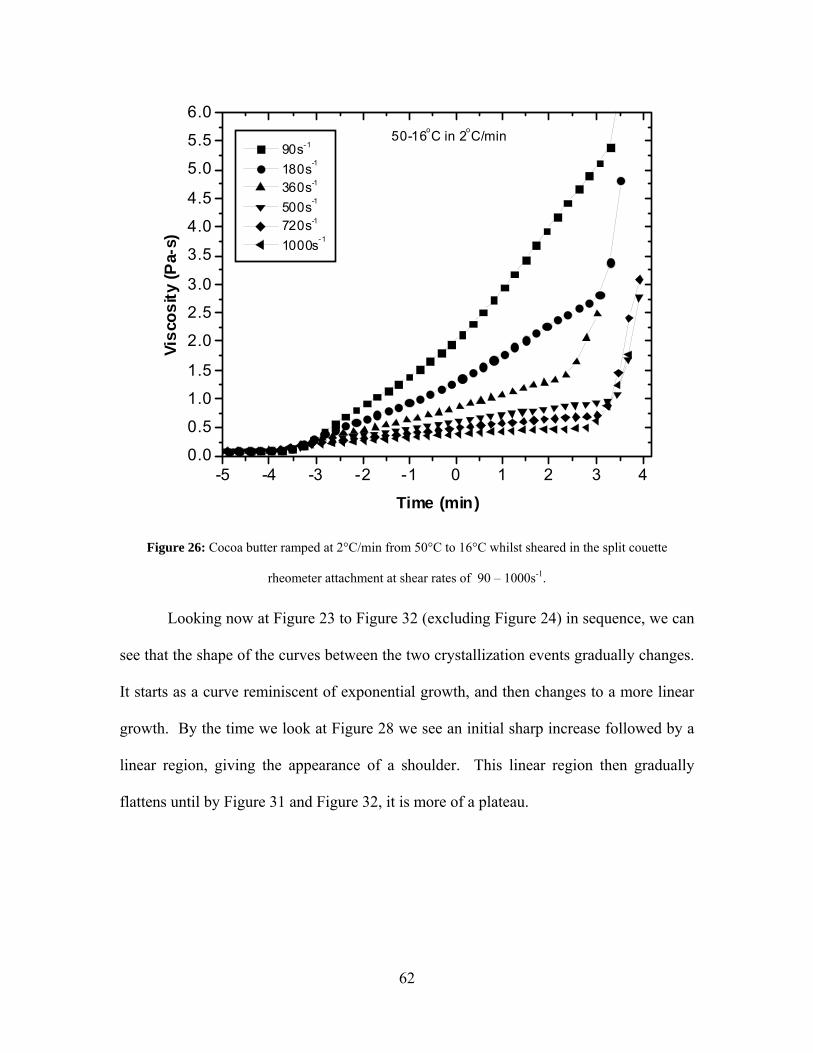
62
-5 -4 -3 -2 -1 0 1 2 3 40.0
0.5
1.0
1.5
2.0
2.5
3.0
3.5
4.0
4.5
5.0
5.5
6.050-16oC in 2oC/min
Visc
osity
(Pa-
s)
Time (min)
90s-1
180s-1
360s-1
500s-1
720s-1
1000s-1
Figure 26: Cocoa butter ramped at 2°C/min from 50°C to 16°C whilst sheared in the split couette
rheometer attachment at shear rates of 90 – 1000s-1.
Looking now at Figure 23 to Figure 32 (excluding Figure 24) in sequence, we can
see that the shape of the curves between the two crystallization events gradually changes.
It starts as a curve reminiscent of exponential growth, and then changes to a more linear
growth. By the time we look at Figure 28 we see an initial sharp increase followed by a
linear region, giving the appearance of a shoulder. This linear region then gradually
flattens until by Figure 31 and Figure 32, it is more of a plateau.
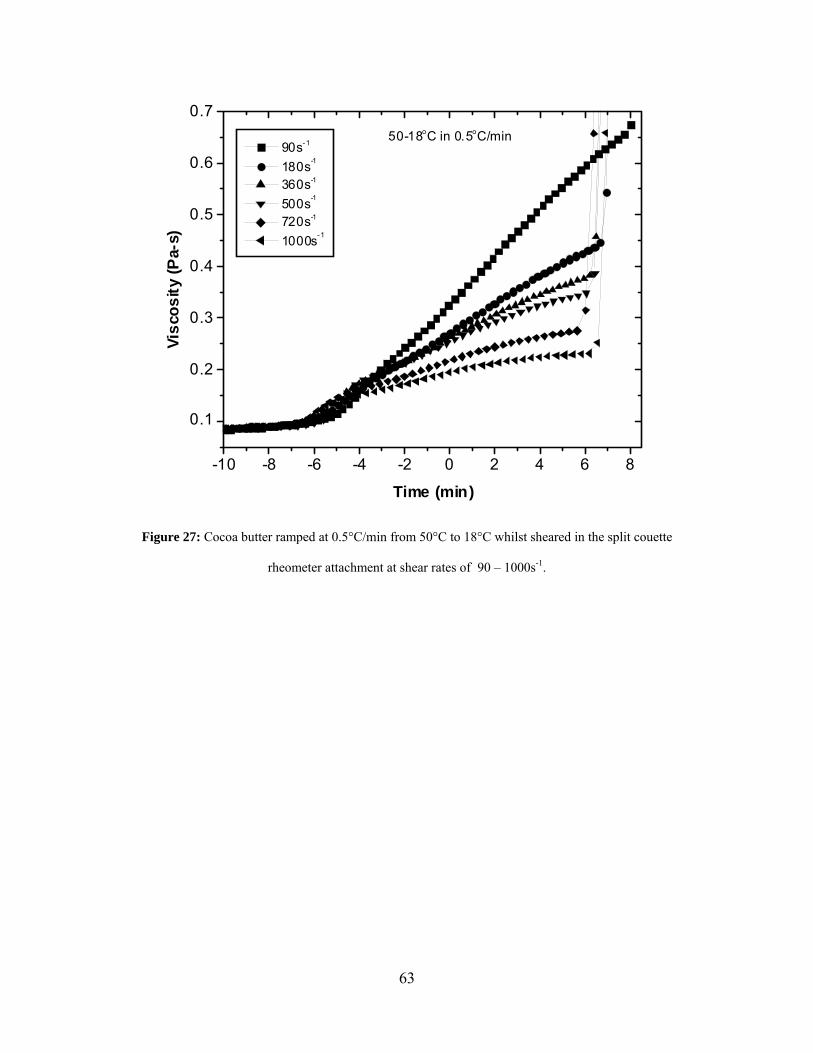
63
-10 -8 -6 -4 -2 0 2 4 6 8
0.1
0.2
0.3
0.4
0.5
0.6
0.750-18oC in 0.5oC/min
Visc
osity
(Pa-
s)
Time (min)
90s-1
180s-1
360s-1
500s-1
720s-1
1000s-1
Figure 27: Cocoa butter ramped at 0.5°C/min from 50°C to 18°C whilst sheared in the split couette
rheometer attachment at shear rates of 90 – 1000s-1.
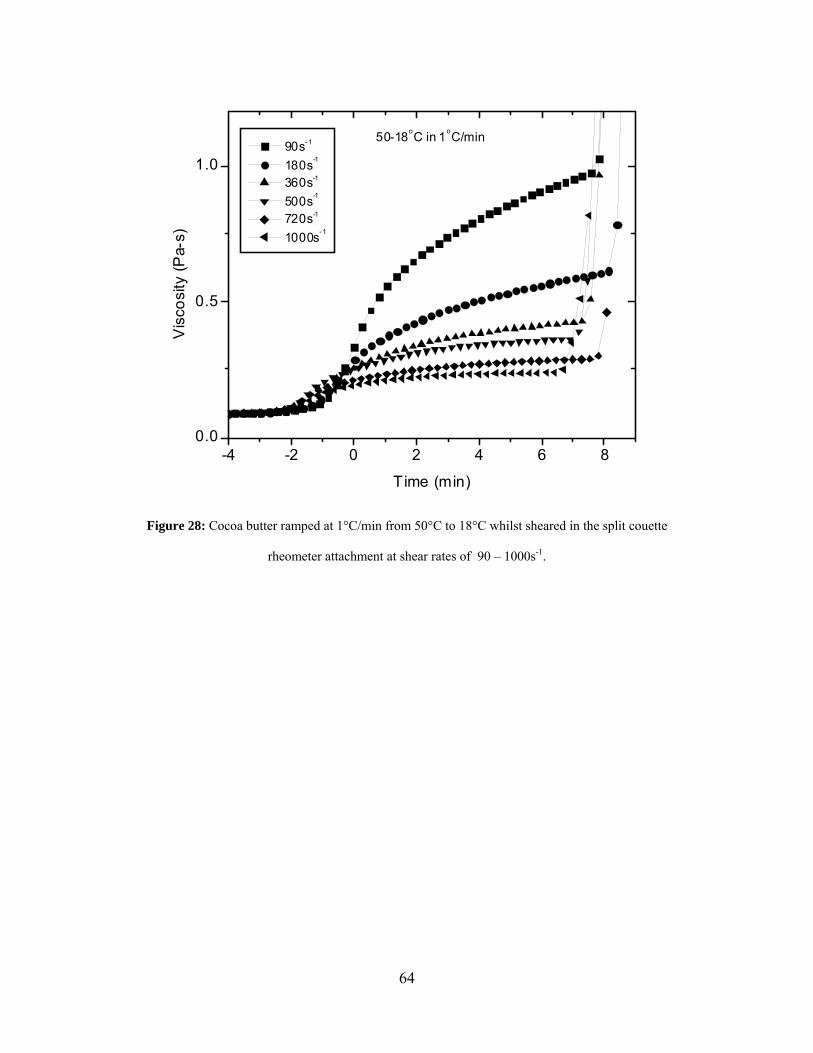
64
-4 -2 0 2 4 6 80.0
0.5
1.0
50-18oC in 1oC/min
Vis
cosi
ty (P
a-s)
T ime (min)
90s-1
180s-1
360s-1
500s-1
720s-1
1000s-1
Figure 28: Cocoa butter ramped at 1°C/min from 50°C to 18°C whilst sheared in the split couette
rheometer attachment at shear rates of 90 – 1000s-1.
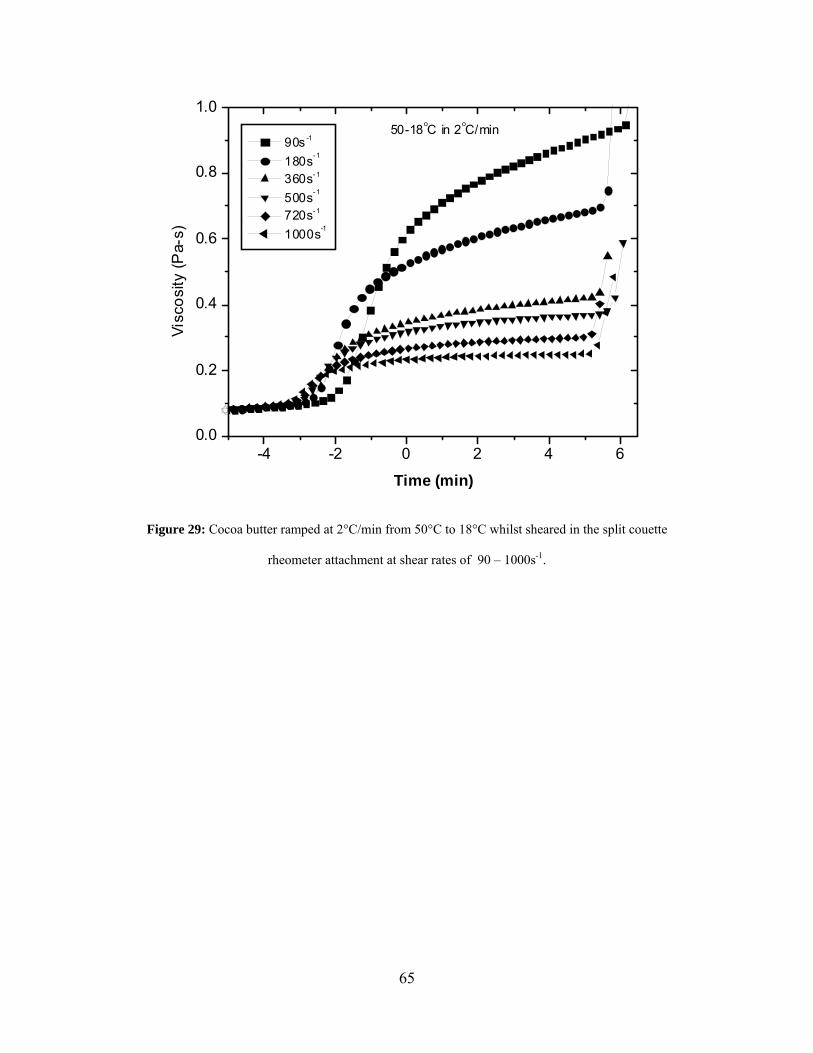
65
-4 -2 0 2 4 60.0
0.2
0.4
0.6
0.8
1.050-18oC in 2oC/min
Visc
osity
(Pa-
s)
Time (min)
90s -1
180s-1
360s-1
500s-1
720s-1
1000s-1
Figure 29: Cocoa butter ramped at 2°C/min from 50°C to 18°C whilst sheared in the split couette
rheometer attachment at shear rates of 90 – 1000s-1.
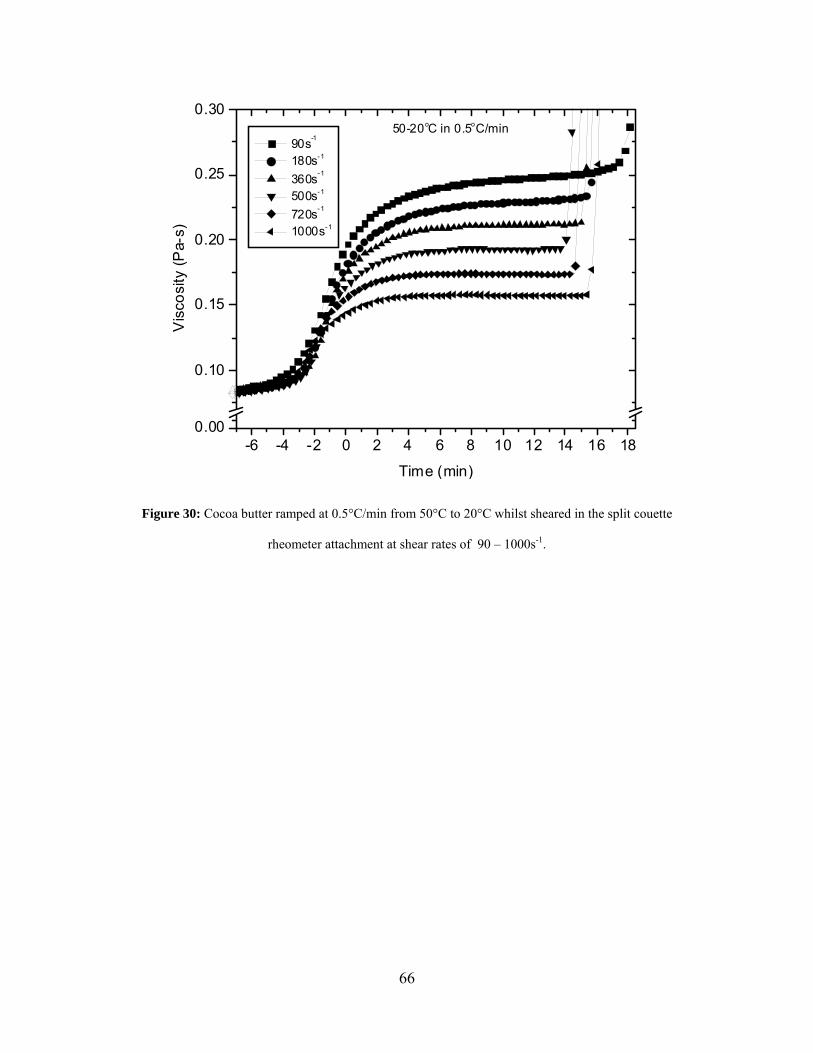
66
-6 -4 -2 0 2 4 6 8 10 12 14 16 180.00
0.10
0.15
0.20
0.25
0.3050-20oC in 0.5oC/min
Vis
cosi
ty (P
a-s)
Time (min)
90s-1
180s-1
360s-1
500s-1
720s-1
1000s-1
Figure 30: Cocoa butter ramped at 0.5°C/min from 50°C to 20°C whilst sheared in the split couette
rheometer attachment at shear rates of 90 – 1000s-1.
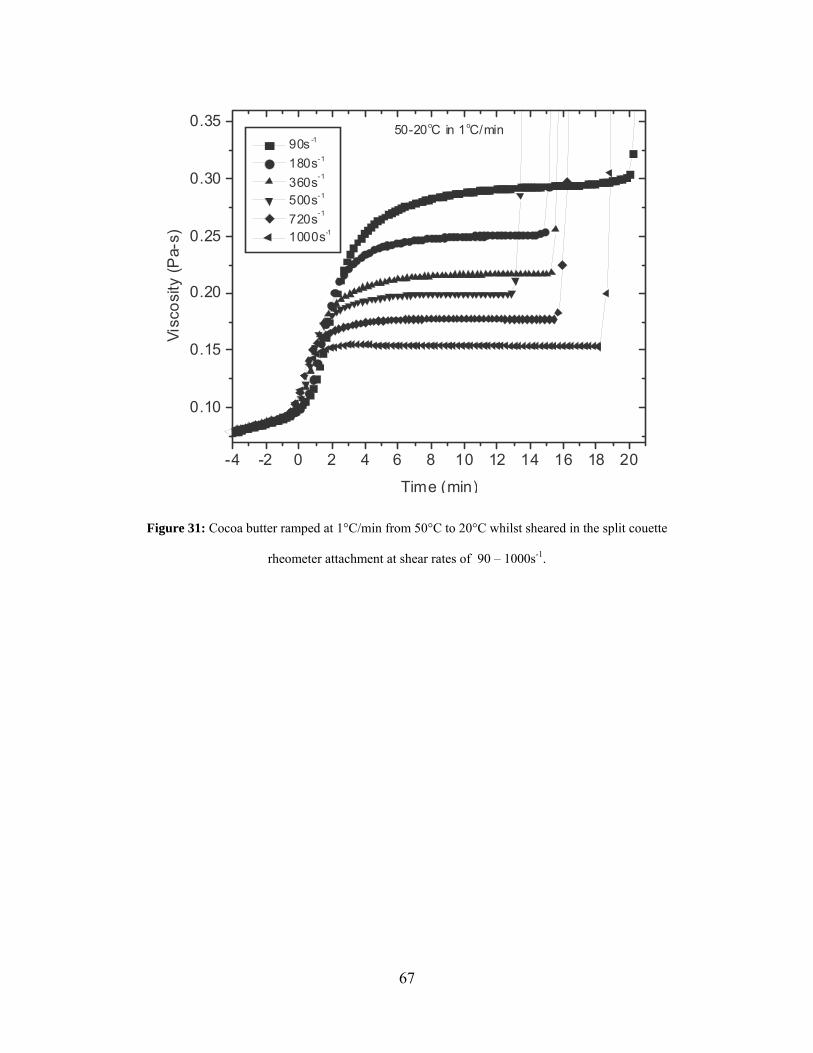
67
-4 -2 0 2 4 6 8 10 12 14 16 18 20
0.10
0.15
0.20
0.25
0.30
0.35 50-20oC in 1oC/min
Visc
osity
(Pa-
s)
Time (min)
90s -1
180s-1
360s-1
500s-1
720s-1
1000s-1
Figure 31: Cocoa butter ramped at 1°C/min from 50°C to 20°C whilst sheared in the split couette
rheometer attachment at shear rates of 90 – 1000s-1.
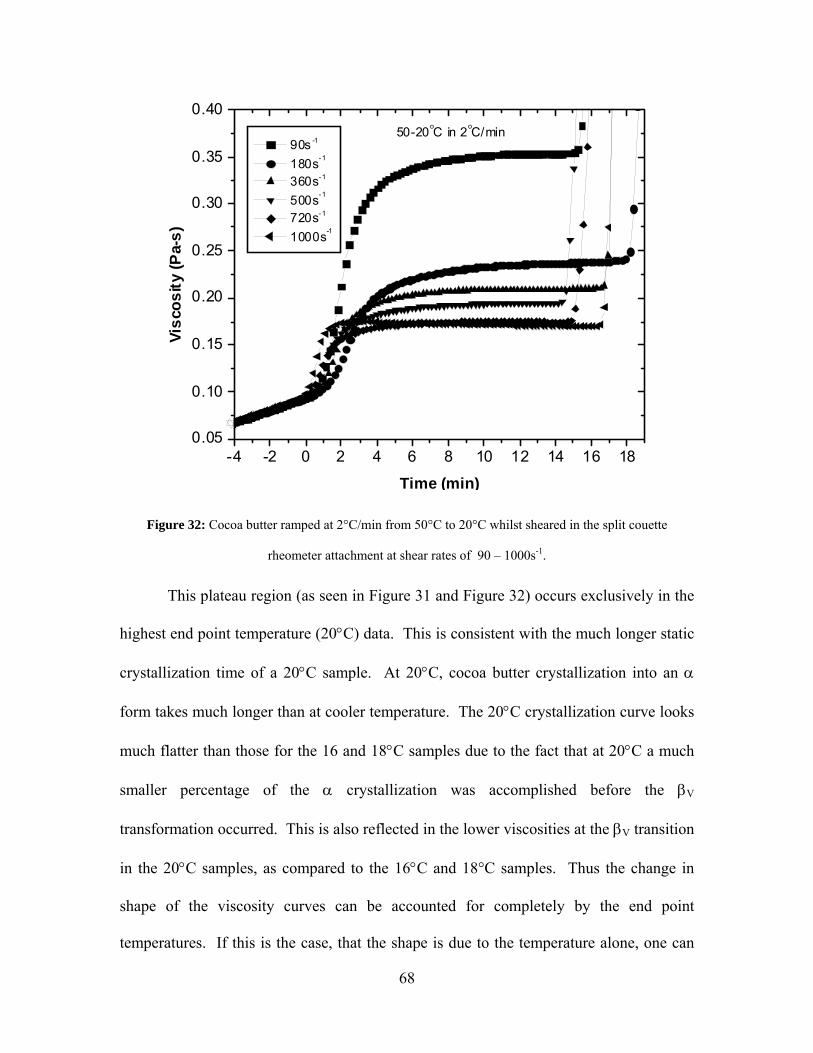
68
-4 -2 0 2 4 6 8 10 12 14 16 180.05
0.10
0.15
0.20
0.25
0.30
0.35
0.4050-20oC in 2oC/min
Visc
osity
(Pa-
s)
Time (min)
90s -1
180s-1
360s-1
500s-1
720s-1
1000s-1
Figure 32: Cocoa butter ramped at 2°C/min from 50°C to 20°C whilst sheared in the split couette
rheometer attachment at shear rates of 90 – 1000s-1.
This plateau region (as seen in Figure 31 and Figure 32) occurs exclusively in the
highest end point temperature (20°C) data. This is consistent with the much longer static
crystallization time of a 20°C sample. At 20°C, cocoa butter crystallization into an α
form takes much longer than at cooler temperature. The 20°C crystallization curve looks
much flatter than those for the 16 and 18°C samples due to the fact that at 20°C a much
smaller percentage of the α crystallization was accomplished before the βV
transformation occurred. This is also reflected in the lower viscosities at the βV transition
in the 20°C samples, as compared to the 16°C and 18°C samples. Thus the change in
shape of the viscosity curves can be accounted for completely by the end point
temperatures. If this is the case, that the shape is due to the temperature alone, one can
69
speculate that the shape of the viscosity curves of static samples under these cooling
conditions would be very similar, although this assertion is impossible to verify.
The cooling ramp also has a very obvious effect on the shape of the crystallization
curves. The slowest cooling rate of 0.5°C/min allows the crystallization process to begin
at higher temperatures. At these higher temperatures crystallization is a naturally slower
process and the change is viscosity is very gradual. This results in the beginning of the
viscosity curve having a slow increase. This happens to a lesser extent with the 1°C/min
ramp also. The differences in the end point temperatures, as already stated, is that the
16°C temperature creates a much larger impetus for crystallization, which causes a very
fast crystallization rate and hence a rapid increase in viscosity. Crystallization at 18°C is
~2 minutes slower and a further ~10 minutes slower at 20°C. Thus, the change in shape
between the curves can be fully explained. The exponential shape at 16°C is due to the
very fast crystallization at the endpoint with a variable length of initial slower growth due
to the slower crystallization ahead of the endpoint temperature. At 18°C this effect is less
apparent due to the endpoint crystallization itself happening much more slowly, and by
20°C the crystallization ahead of the endpoint temperature has minimal effect.
It can also be seen that the α transition time is not always at the same time
for each temperature set. While Figure 32 is an exception, it is generally the case that if
there is a deviation in a data set, it is because the lowest shear rates are making their α
transition slightly later. This could indicate a slight acceleration of the α transition due to
shear for the higher temperature end points. We can examine this further by looking at a
plot of the α transition times (Figure 33). These times can be easily extracted by eye,
however the values were confirmed using derivative edge detection techniques. This
70
technique uses the second derivative of the curve and yields a peak whose position is
easily determined at the point of increase. It should also be noted that in normalizing the
α crystallization times to the end of the ramp, actual temperatures of the sample were
used rather than the temperature of the water bath. A certain amount of temperature lag
is expected between the water bath and the sample. This lag increases with a lower end
point temperature. Thus for example, the 0.5 °C/min temperature ramps for 20°C, 18°C
and 16°C will not be offset from each other in time by exactly 4 minutes as would be
expected. The difference between the data sets will increase with decreasing
temperature.
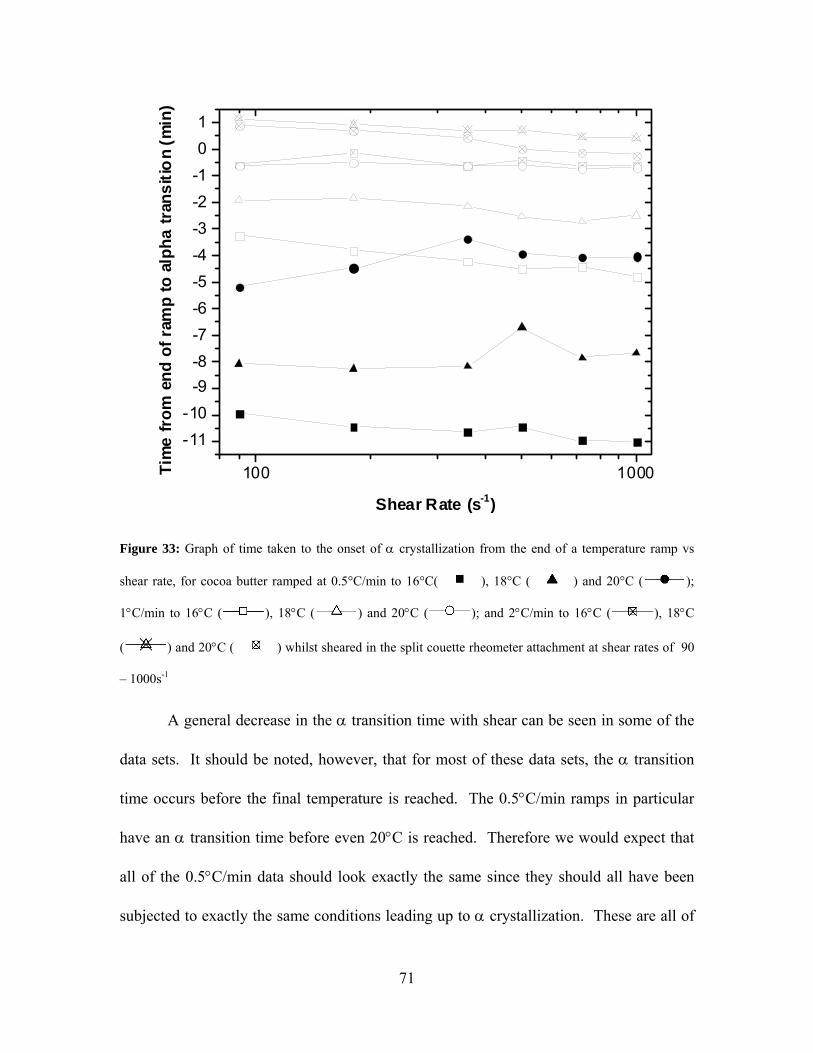
71
100 1000
-11-10
-9-8-7-6-5-4-3-2-101
Tim
e fr
om e
nd o
f ram
p to
alp
ha tr
ansi
tion
(min
)
Shear Rate (s-1)
Figure 33: Graph of time taken to the onset of α crystallization from the end of a temperature ramp vs
shear rate, for cocoa butter ramped at 0.5°C/min to 16°C( ), 18°C ( ) and 20°C ( );
1°C/min to 16°C ( ), 18°C ( ) and 20°C ( ); and 2°C/min to 16°C ( ), 18°C
( ) and 20°C ( ) whilst sheared in the split couette rheometer attachment at shear rates of 90
– 1000s-1
A general decrease in the α transition time with shear can be seen in some of the
data sets. It should be noted, however, that for most of these data sets, the α transition
time occurs before the final temperature is reached. The 0.5°C/min ramps in particular
have an α transition time before even 20°C is reached. Therefore we would expect that
all of the 0.5°C/min data should look exactly the same since they should all have been
subjected to exactly the same conditions leading up to α crystallization. These are all of
72
the solid symbols. While they have been normalized to the end of the ramp time and are
offset from each other accordingly, the shape and deviation of these curves should be the
same. Clearly they are very different from each other in shape with the 20°C and 18°C
data varying by ~2 minutes and the 16°C data varying only within ~1 minute between
shear rates.
Therefore, we can only conclude that the events leading up to α crystallization are
not constant and that the error in Figure 33 can be on the order of minutes in some cases.
(This is much larger than any experimental errors reasonably assumed and so error bars
are not included). As such, any acceleration effects shown in the α crystallization data
could be explained as within error. These differences between individual data sets should
only affect comparison of the α crystallization time since βV crystallization can be
normalized to the α time.
The effects of viscous heating should also be considered when looking at the α
crystallization times. This is examined in appendix 3.
If we examine the effect of shear rate on the acceleration of the α to βV transition
time, we can quantitatively analyze what we have already noticed qualitatively: that there
is no large decrease in crystallization time due to shear for the shear rates examined. The
α and βV crystallization times can be extracted from the viscosity curves and used to
create a graph showing the time between the α and βV crystallizations plotted vs shear
rate (Figure 34).
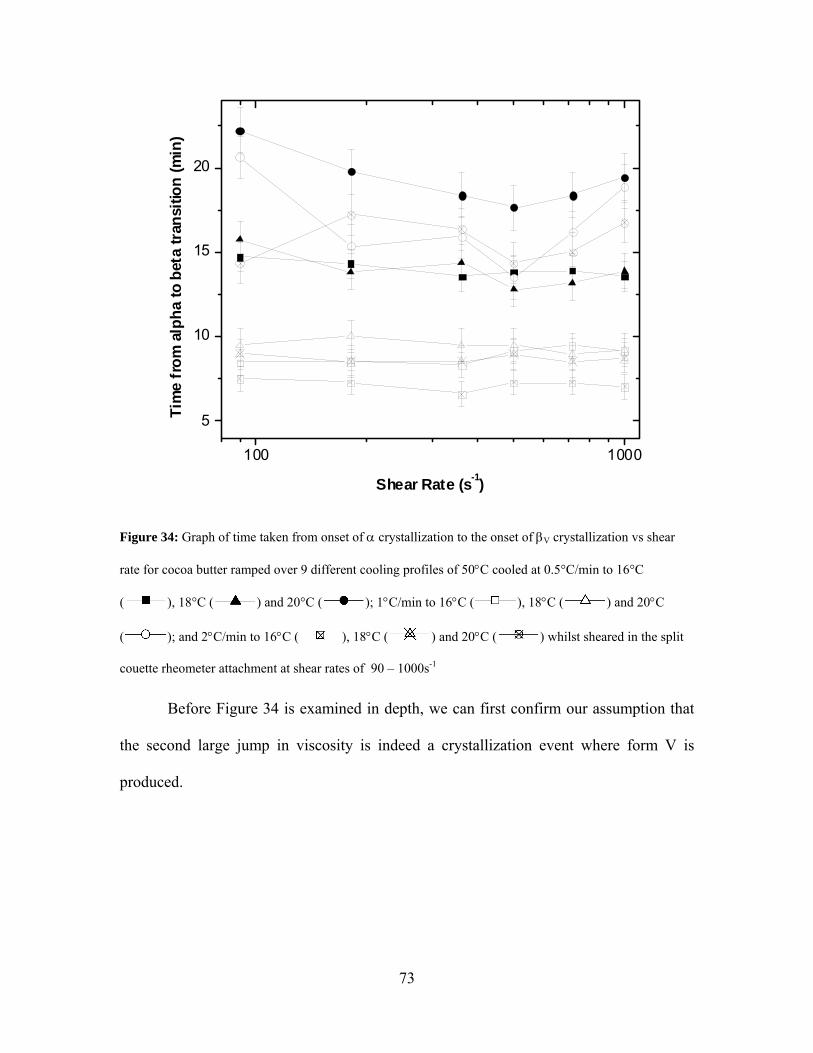
73
100 1000
5
10
15
20Ti
me
from
alp
ha to
bet
a tr
ansi
tion
(min
)
Shear Rate (s-1)
Figure 34: Graph of time taken from onset of α crystallization to the onset of βV crystallization vs shear
rate for cocoa butter ramped over 9 different cooling profiles of 50°C cooled at 0.5°C/min to 16°C
( ), 18°C ( ) and 20°C ( ); 1°C/min to 16°C ( ), 18°C ( ) and 20°C
( ); and 2°C/min to 16°C ( ), 18°C ( ) and 20°C ( ) whilst sheared in the split
couette rheometer attachment at shear rates of 90 – 1000s-1
Before Figure 34 is examined in depth, we can first confirm our assumption that
the second large jump in viscosity is indeed a crystallization event where form V is
produced.
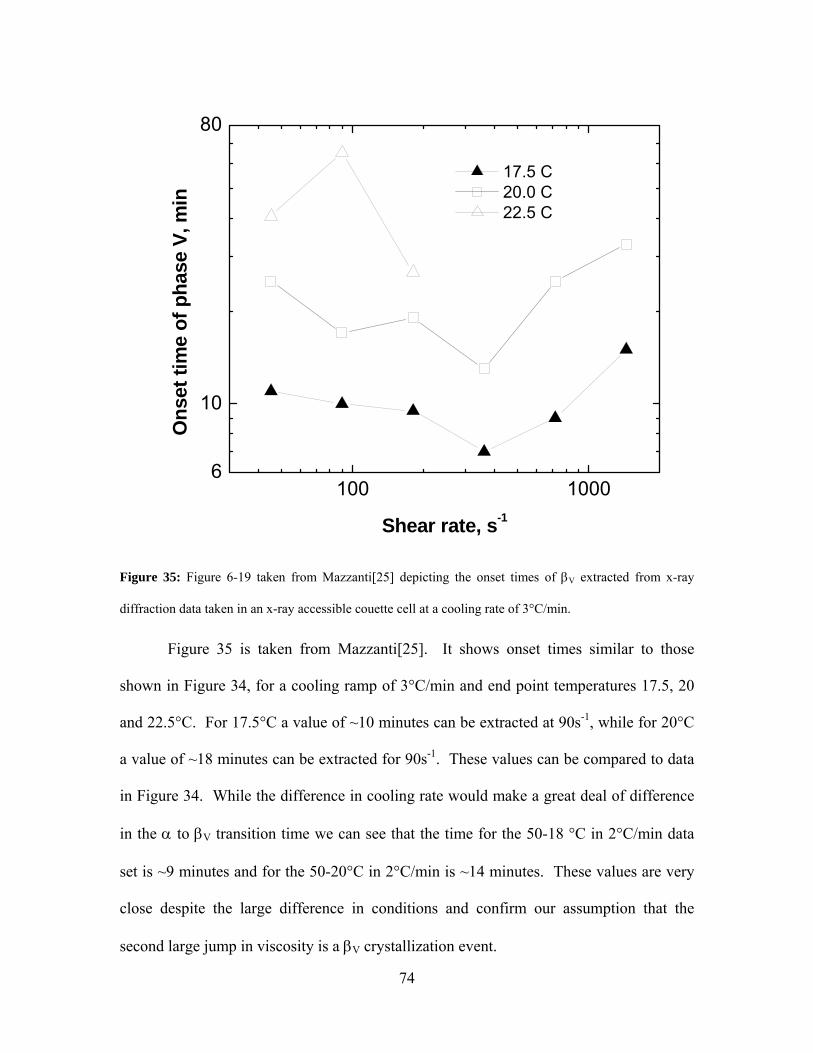
74
100 10006
10
80
17.5 C 20.0 C 22.5 C
Ons
et ti
me
of p
hase
V, m
in
Shear rate, s-1
Figure 35: Figure 6-19 taken from Mazzanti[25] depicting the onset times of βV extracted from x-ray
diffraction data taken in an x-ray accessible couette cell at a cooling rate of 3°C/min.
Figure 35 is taken from Mazzanti[25]. It shows onset times similar to those
shown in Figure 34, for a cooling ramp of 3°C/min and end point temperatures 17.5, 20
and 22.5°C. For 17.5°C a value of ~10 minutes can be extracted at 90s-1, while for 20°C
a value of ~18 minutes can be extracted for 90s-1. These values can be compared to data
in Figure 34. While the difference in cooling rate would make a great deal of difference
in the α to βV transition time we can see that the time for the 50-18 °C in 2°C/min data
set is ~9 minutes and for the 50-20°C in 2°C/min is ~14 minutes. These values are very
close despite the large difference in conditions and confirm our assumption that the
second large jump in viscosity is a βV crystallization event.
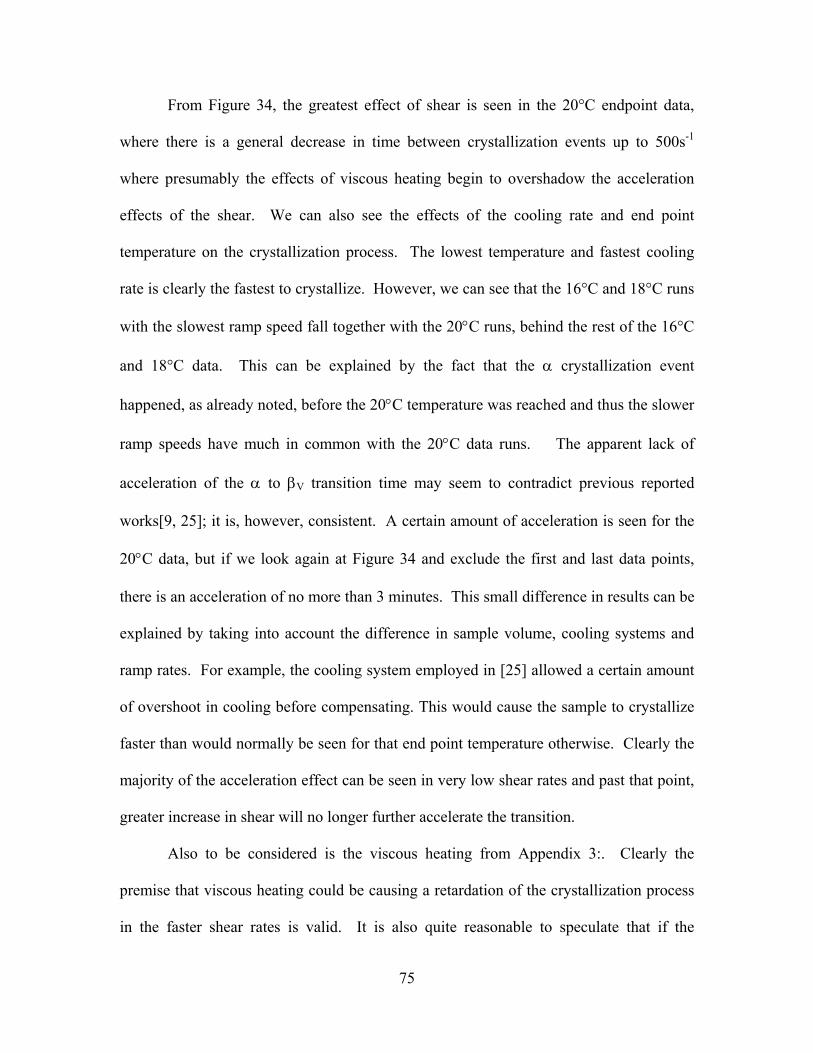
75
From Figure 34, the greatest effect of shear is seen in the 20°C endpoint data,
where there is a general decrease in time between crystallization events up to 500s-1
where presumably the effects of viscous heating begin to overshadow the acceleration
effects of the shear. We can also see the effects of the cooling rate and end point
temperature on the crystallization process. The lowest temperature and fastest cooling
rate is clearly the fastest to crystallize. However, we can see that the 16°C and 18°C runs
with the slowest ramp speed fall together with the 20°C runs, behind the rest of the 16°C
and 18°C data. This can be explained by the fact that the α crystallization event
happened, as already noted, before the 20°C temperature was reached and thus the slower
ramp speeds have much in common with the 20°C data runs. The apparent lack of
acceleration of the α to βV transition time may seem to contradict previous reported
works[9, 25]; it is, however, consistent. A certain amount of acceleration is seen for the
20°C data, but if we look again at Figure 34 and exclude the first and last data points,
there is an acceleration of no more than 3 minutes. This small difference in results can be
explained by taking into account the difference in sample volume, cooling systems and
ramp rates. For example, the cooling system employed in [25] allowed a certain amount
of overshoot in cooling before compensating. This would cause the sample to crystallize
faster than would normally be seen for that end point temperature otherwise. Clearly the
majority of the acceleration effect can be seen in very low shear rates and past that point,
greater increase in shear will no longer further accelerate the transition.
Also to be considered is the viscous heating from Appendix 3:. Clearly the
premise that viscous heating could be causing a retardation of the crystallization process
in the faster shear rates is valid. It is also quite reasonable to speculate that if the
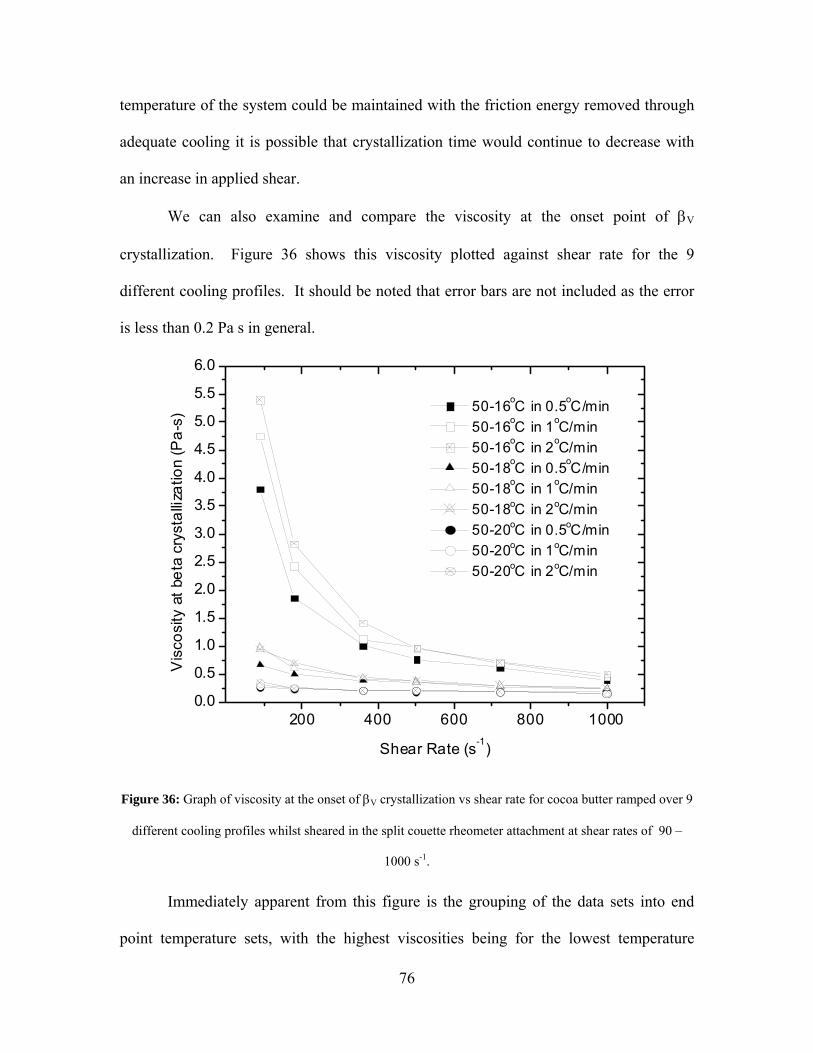
76
temperature of the system could be maintained with the friction energy removed through
adequate cooling it is possible that crystallization time would continue to decrease with
an increase in applied shear.
We can also examine and compare the viscosity at the onset point of βV
crystallization. Figure 36 shows this viscosity plotted against shear rate for the 9
different cooling profiles. It should be noted that error bars are not included as the error
is less than 0.2 Pa s in general.
200 400 600 800 10000.0
0.5
1.0
1.5
2.0
2.5
3.0
3.5
4.0
4.5
5.0
5.5
6.0
Vis
cosi
ty a
t bet
a cr
ysta
lliza
tion
(Pa-
s)
Shear Rate (s-1)
Figure 36: Graph of viscosity at the onset of βV crystallization vs shear rate for cocoa butter ramped over 9
different cooling profiles whilst sheared in the split couette rheometer attachment at shear rates of 90 –
1000 s-1.
Immediately apparent from this figure is the grouping of the data sets into end
point temperature sets, with the highest viscosities being for the lowest temperature
50-16oC in 0.5oC/min 50-16oC in 1oC/min 50-16oC in 2oC/min 50-18oC in 0.5oC/min 50-18oC in 1oC/min 50-18oC in 2oC/min 50-20oC in 0.5oC/min 50-20oC in 1oC/min 50-20oC in 2oC/min
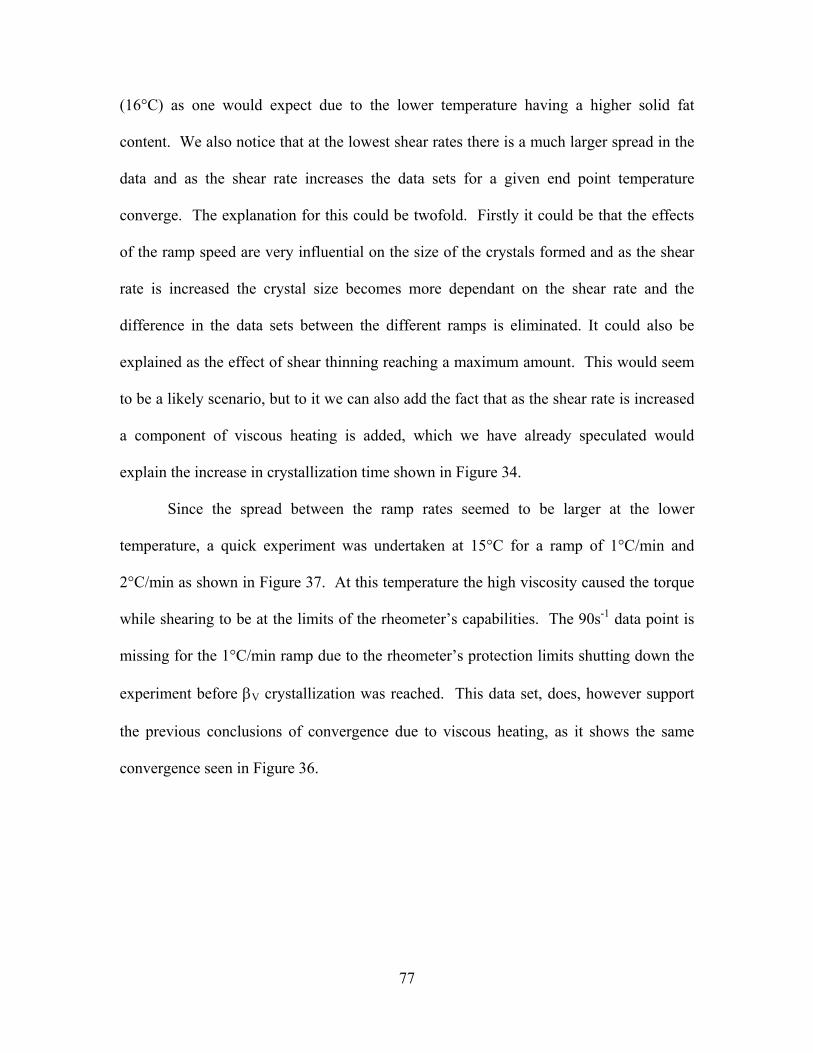
77
(16°C) as one would expect due to the lower temperature having a higher solid fat
content. We also notice that at the lowest shear rates there is a much larger spread in the
data and as the shear rate increases the data sets for a given end point temperature
converge. The explanation for this could be twofold. Firstly it could be that the effects
of the ramp speed are very influential on the size of the crystals formed and as the shear
rate is increased the crystal size becomes more dependant on the shear rate and the
difference in the data sets between the different ramps is eliminated. It could also be
explained as the effect of shear thinning reaching a maximum amount. This would seem
to be a likely scenario, but to it we can also add the fact that as the shear rate is increased
a component of viscous heating is added, which we have already speculated would
explain the increase in crystallization time shown in Figure 34.
Since the spread between the ramp rates seemed to be larger at the lower
temperature, a quick experiment was undertaken at 15°C for a ramp of 1°C/min and
2°C/min as shown in Figure 37. At this temperature the high viscosity caused the torque
while shearing to be at the limits of the rheometer’s capabilities. The 90s-1 data point is
missing for the 1°C/min ramp due to the rheometer’s protection limits shutting down the
experiment before βV crystallization was reached. This data set, does, however support
the previous conclusions of convergence due to viscous heating, as it shows the same
convergence seen in Figure 36.
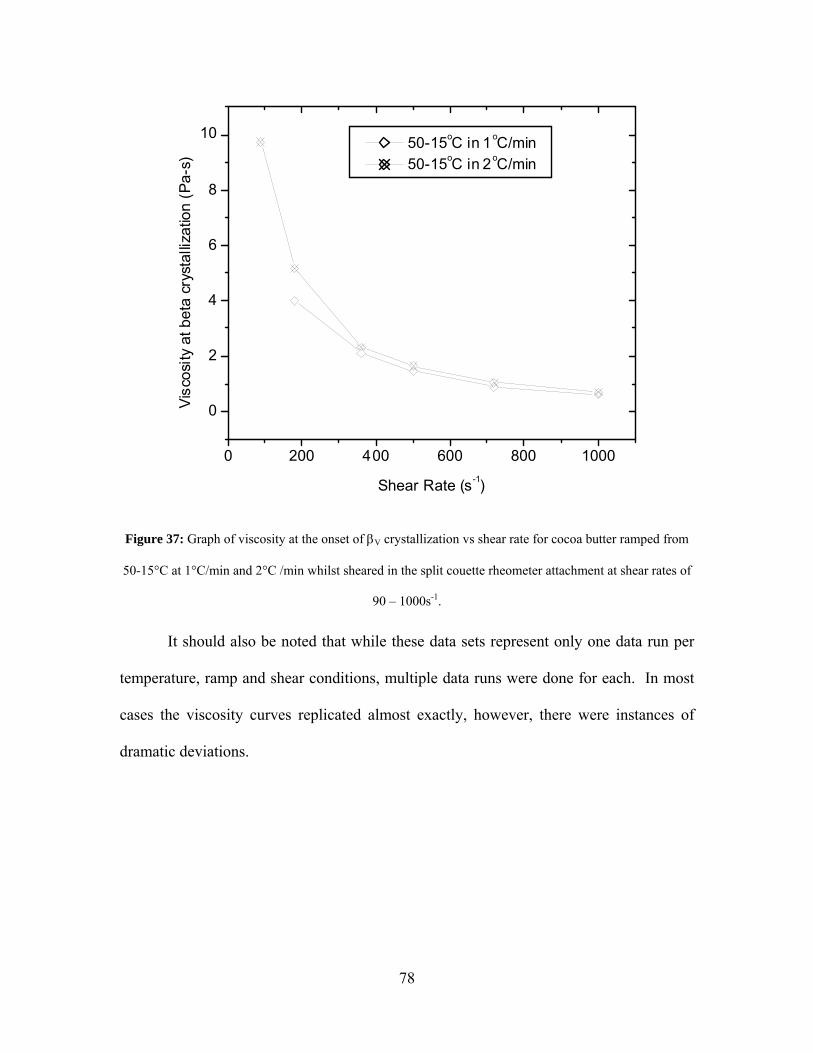
78
0 200 400 600 800 1000
0
2
4
6
8
10
Visc
osity
at b
eta
crys
talli
zatio
n (P
a-s)
Shear Rate (s-1)
50-15oC in 1oC/min 50-15oC in 2oC/min
Figure 37: Graph of viscosity at the onset of βV crystallization vs shear rate for cocoa butter ramped from
50-15°C at 1°C/min and 2°C /min whilst sheared in the split couette rheometer attachment at shear rates of
90 – 1000s-1.
It should also be noted that while these data sets represent only one data run per
temperature, ramp and shear conditions, multiple data runs were done for each. In most
cases the viscosity curves replicated almost exactly, however, there were instances of
dramatic deviations.
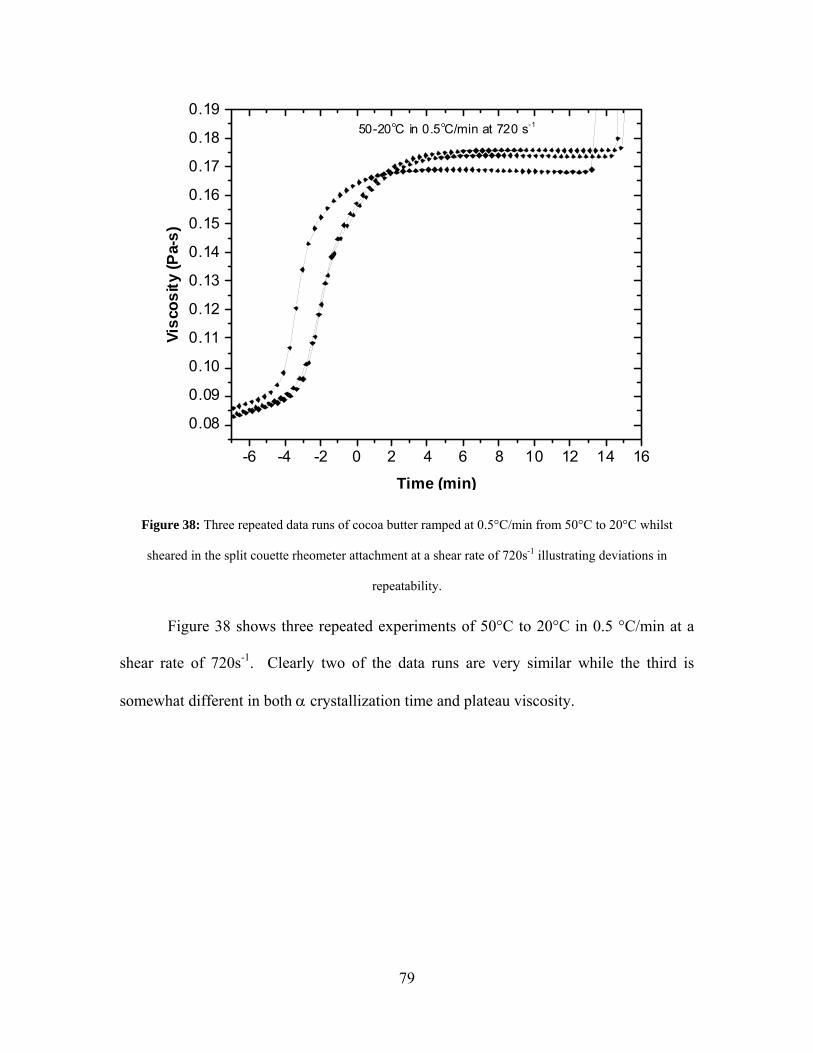
79
-6 -4 -2 0 2 4 6 8 10 12 14 16
0.08
0.09
0.10
0.11
0.12
0.13
0.14
0.15
0.16
0.17
0.18
0.1950-20oC in 0.5oC/min at 720 s-1
Visc
osity
(Pa-
s)
Time (min)
Figure 38: Three repeated data runs of cocoa butter ramped at 0.5°C/min from 50°C to 20°C whilst
sheared in the split couette rheometer attachment at a shear rate of 720s-1 illustrating deviations in
repeatability.
Figure 38 shows three repeated experiments of 50°C to 20°C in 0.5 °C/min at a
shear rate of 720s-1. Clearly two of the data runs are very similar while the third is
somewhat different in both α crystallization time and plateau viscosity.
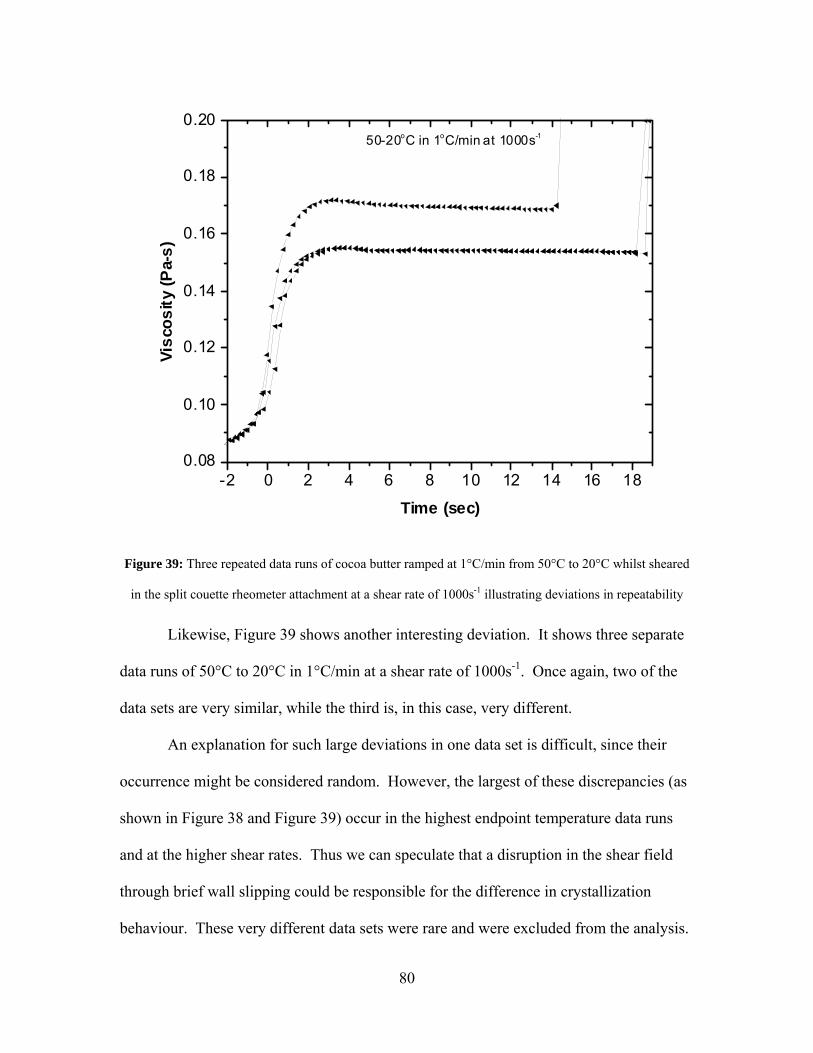
80
-2 0 2 4 6 8 10 12 14 16 180.08
0.10
0.12
0.14
0.16
0.18
0.2050-20oC in 1oC/min at 1000s-1
Visc
osity
(Pa-
s)
Time (sec)
Figure 39: Three repeated data runs of cocoa butter ramped at 1°C/min from 50°C to 20°C whilst sheared
in the split couette rheometer attachment at a shear rate of 1000s-1 illustrating deviations in repeatability
Likewise, Figure 39 shows another interesting deviation. It shows three separate
data runs of 50°C to 20°C in 1°C/min at a shear rate of 1000s-1. Once again, two of the
data sets are very similar, while the third is, in this case, very different.
An explanation for such large deviations in one data set is difficult, since their
occurrence might be considered random. However, the largest of these discrepancies (as
shown in Figure 38 and Figure 39) occur in the highest endpoint temperature data runs
and at the higher shear rates. Thus we can speculate that a disruption in the shear field
through brief wall slipping could be responsible for the difference in crystallization
behaviour. These very different data sets were rare and were excluded from the analysis.
81
To summarize, the investigation of the effects of shear on the viscosity of cocoa
butter when subjected to various temperature conditions yielded some unexpected results.
Previous work[25] with similar shear rates and temperature had shown a decrease in the
βV crystallization time up to a shear rate of 360s-1 for a cooling ramp of 3°C/min. This
investigation, however, shows no appreciable acceleration in the transition time over a
range of 90 – 1000s-1 for all but the 20°C end point data. There is, however, a very large
decrease in the crystallization time as compared to static conditions[25]. This difference
can be explained as due to the difference in cooling rate, end point temperature, and
sample size. These things would all have a noticeable effect on the crystallization of the
cocoa butter sample and can explain the difference in the results.
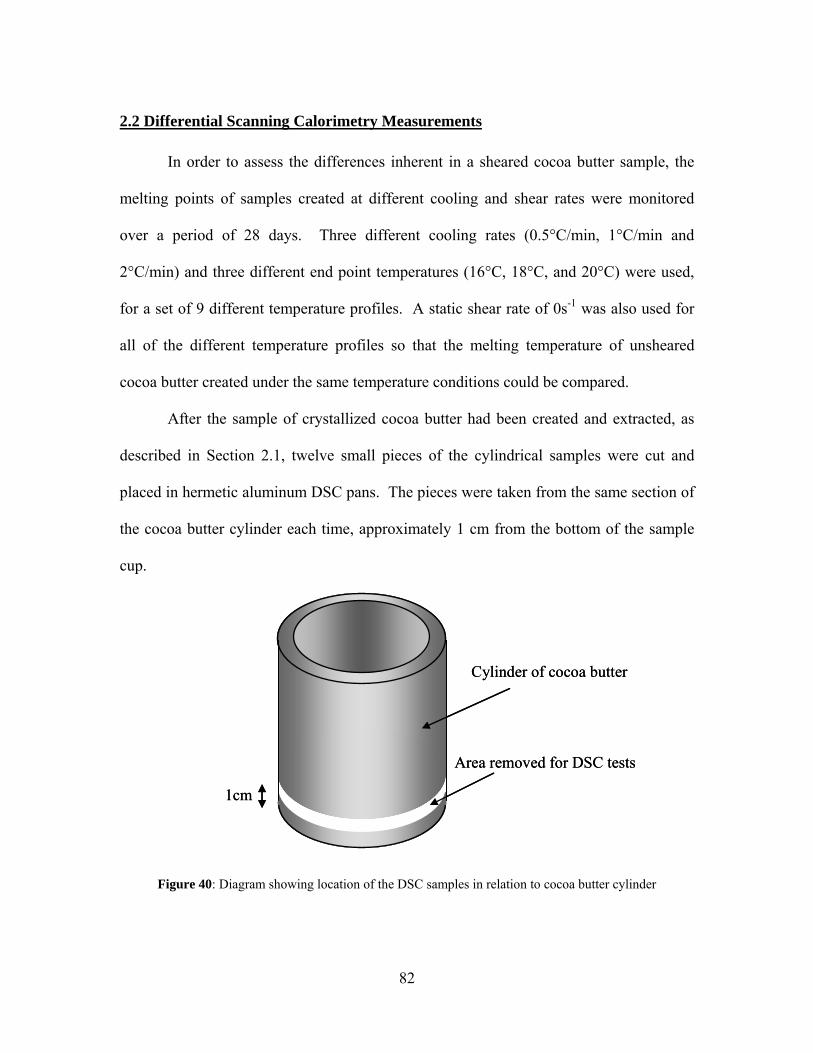
82
2.2 Differential Scanning Calorimetry Measurements
In order to assess the differences inherent in a sheared cocoa butter sample, the
melting points of samples created at different cooling and shear rates were monitored
over a period of 28 days. Three different cooling rates (0.5°C/min, 1°C/min and
2°C/min) and three different end point temperatures (16°C, 18°C, and 20°C) were used,
for a set of 9 different temperature profiles. A static shear rate of 0s-1 was also used for
all of the different temperature profiles so that the melting temperature of unsheared
cocoa butter created under the same temperature conditions could be compared.
After the sample of crystallized cocoa butter had been created and extracted, as
described in Section 2.1, twelve small pieces of the cylindrical samples were cut and
placed in hermetic aluminum DSC pans. The pieces were taken from the same section of
the cocoa butter cylinder each time, approximately 1 cm from the bottom of the sample
cup.
1cm
Cylinder of cocoa butter
Area removed for DSC tests
1cm
Cylinder of cocoa butter
Area removed for DSC tests
Figure 40: Diagram showing location of the DSC samples in relation to cocoa butter cylinder
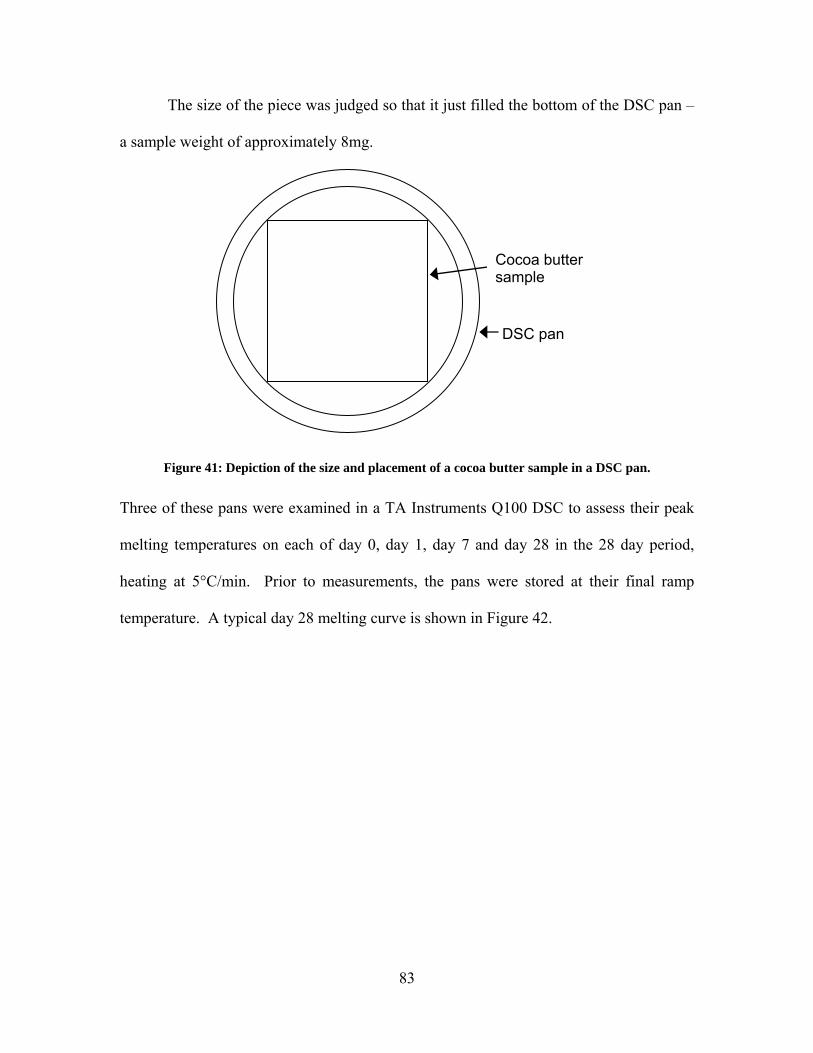
83
The size of the piece was judged so that it just filled the bottom of the DSC pan –
a sample weight of approximately 8mg.
Figure 41: Depiction of the size and placement of a cocoa butter sample in a DSC pan.
Three of these pans were examined in a TA Instruments Q100 DSC to assess their peak
melting temperatures on each of day 0, day 1, day 7 and day 28 in the 28 day period,
heating at 5°C/min. Prior to measurements, the pans were stored at their final ramp
temperature. A typical day 28 melting curve is shown in Figure 42.
Cocoa butter sample
DSC pan
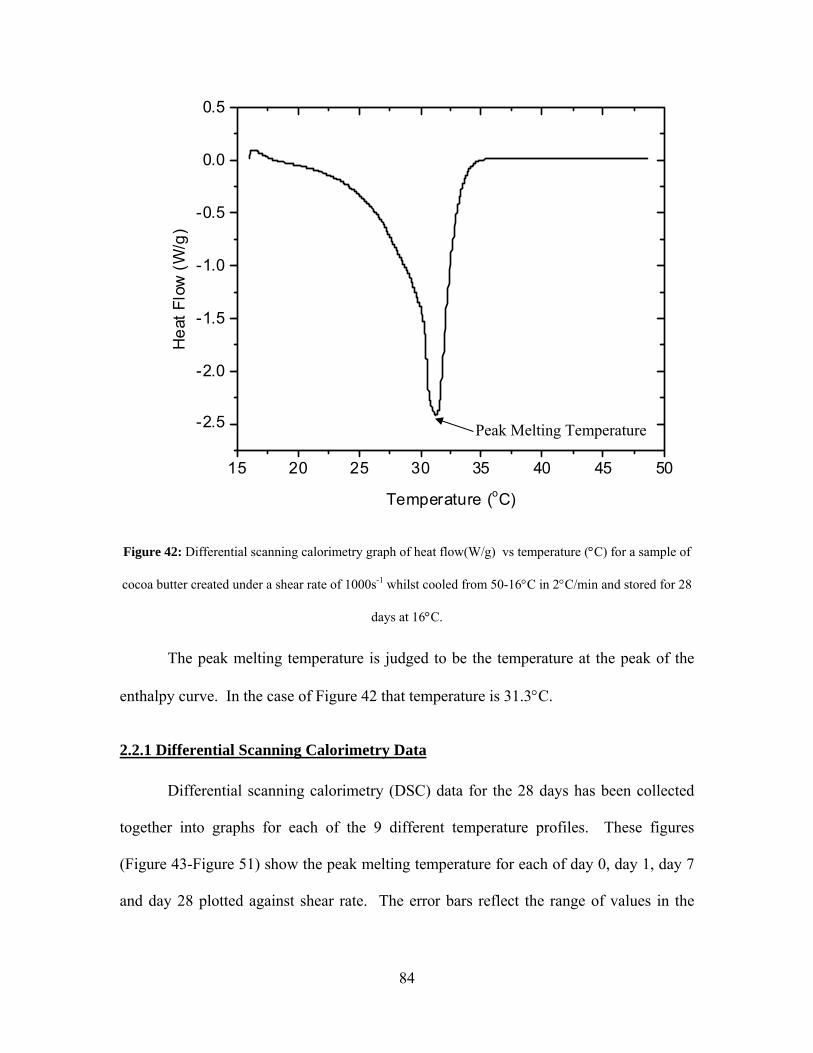
84
15 20 25 30 35 40 45 50
-2.5
-2.0
-1.5
-1.0
-0.5
0.0
0.5
Hea
t Flo
w (W
/g)
Temperature (oC)
Figure 42: Differential scanning calorimetry graph of heat flow(W/g) vs temperature (°C) for a sample of
cocoa butter created under a shear rate of 1000s-1 whilst cooled from 50-16°C in 2°C/min and stored for 28
days at 16°C.
The peak melting temperature is judged to be the temperature at the peak of the
enthalpy curve. In the case of Figure 42 that temperature is 31.3°C.
2.2.1 Differential Scanning Calorimetry Data
Differential scanning calorimetry (DSC) data for the 28 days has been collected
together into graphs for each of the 9 different temperature profiles. These figures
(Figure 43-Figure 51) show the peak melting temperature for each of day 0, day 1, day 7
and day 28 plotted against shear rate. The error bars reflect the range of values in the
Peak Melting Temperature
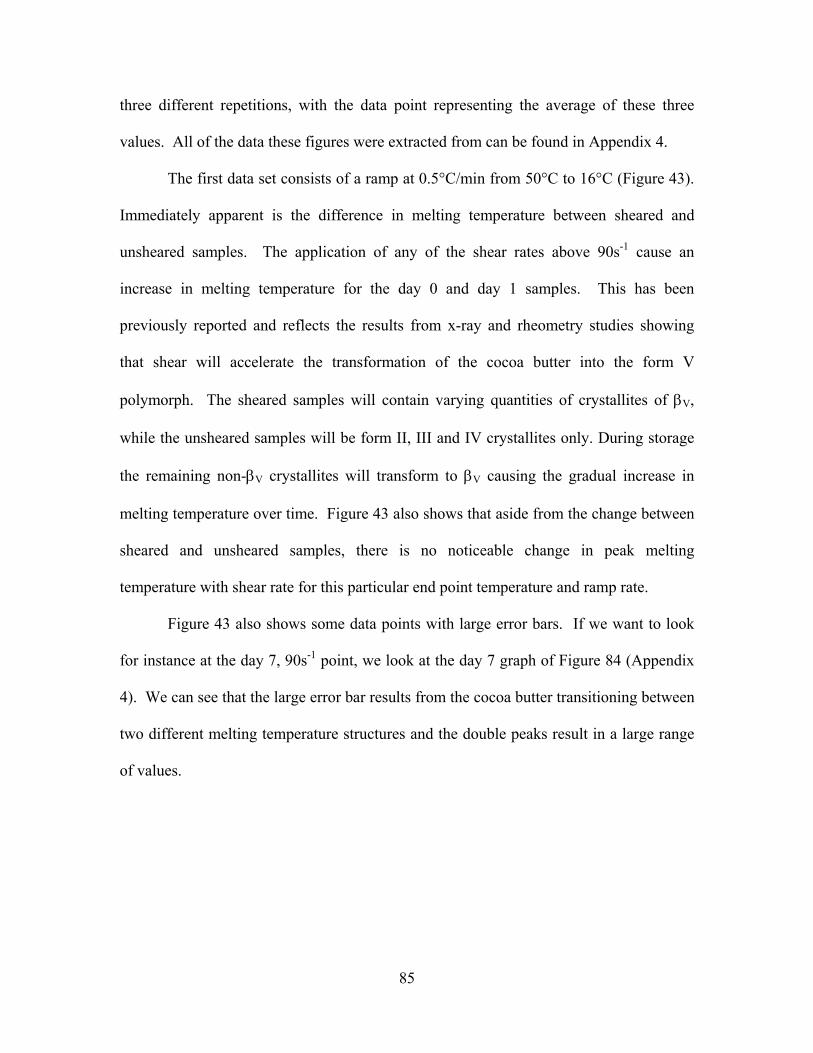
85
three different repetitions, with the data point representing the average of these three
values. All of the data these figures were extracted from can be found in Appendix 4.
The first data set consists of a ramp at 0.5°C/min from 50°C to 16°C (Figure 43).
Immediately apparent is the difference in melting temperature between sheared and
unsheared samples. The application of any of the shear rates above 90s-1 cause an
increase in melting temperature for the day 0 and day 1 samples. This has been
previously reported and reflects the results from x-ray and rheometry studies showing
that shear will accelerate the transformation of the cocoa butter into the form V
polymorph. The sheared samples will contain varying quantities of crystallites of βV,
while the unsheared samples will be form II, III and IV crystallites only. During storage
the remaining non-βV crystallites will transform to βV causing the gradual increase in
melting temperature over time. Figure 43 also shows that aside from the change between
sheared and unsheared samples, there is no noticeable change in peak melting
temperature with shear rate for this particular end point temperature and ramp rate.
Figure 43 also shows some data points with large error bars. If we want to look
for instance at the day 7, 90s-1 point, we look at the day 7 graph of Figure 84 (Appendix
4). We can see that the large error bar results from the cocoa butter transitioning between
two different melting temperature structures and the double peaks result in a large range
of values.
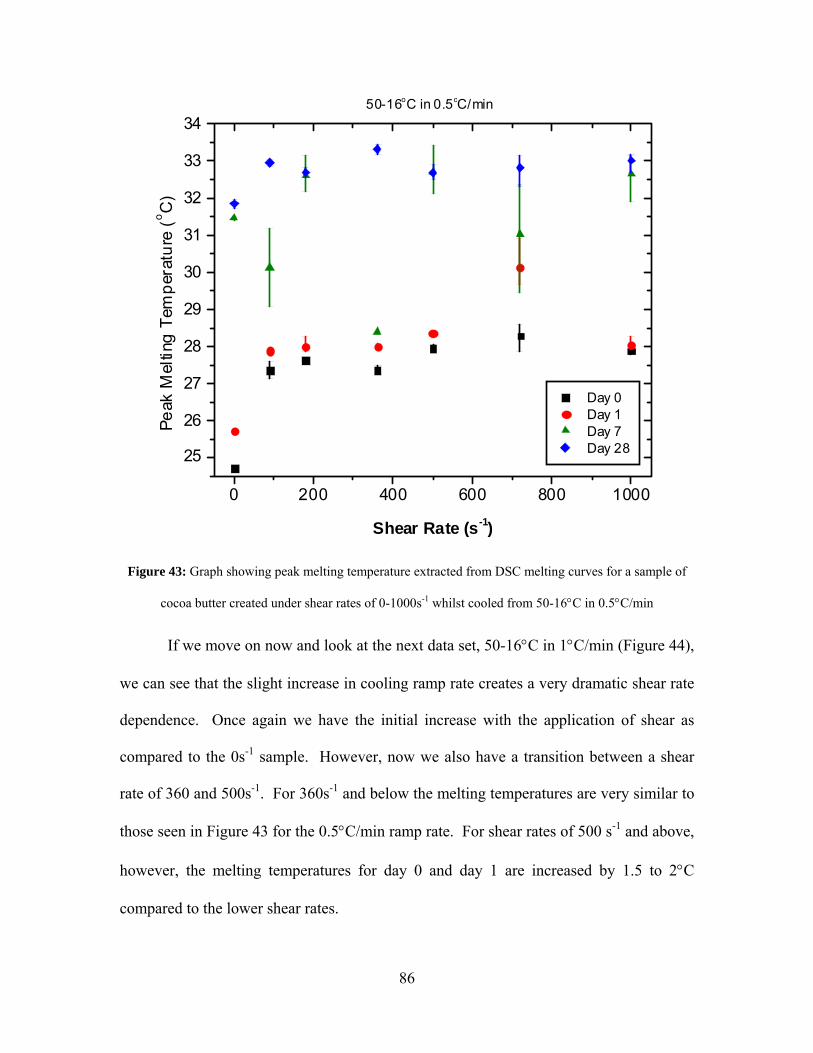
86
0 200 400 600 800 1000
25
26
27
28
29
30
31
32
33
3450-16oC in 0.5oC/min
Peak
Mel
ting
Tem
pera
ture
(o C)
Shear Rate (s-1)
Day 0 Day 1 Day 7 Day 28
Figure 43: Graph showing peak melting temperature extracted from DSC melting curves for a sample of
cocoa butter created under shear rates of 0-1000s-1 whilst cooled from 50-16°C in 0.5°C/min
If we move on now and look at the next data set, 50-16°C in 1°C/min (Figure 44),
we can see that the slight increase in cooling ramp rate creates a very dramatic shear rate
dependence. Once again we have the initial increase with the application of shear as
compared to the 0s-1 sample. However, now we also have a transition between a shear
rate of 360 and 500s-1. For 360s-1 and below the melting temperatures are very similar to
those seen in Figure 43 for the 0.5°C/min ramp rate. For shear rates of 500 s-1 and above,
however, the melting temperatures for day 0 and day 1 are increased by 1.5 to 2°C
compared to the lower shear rates.
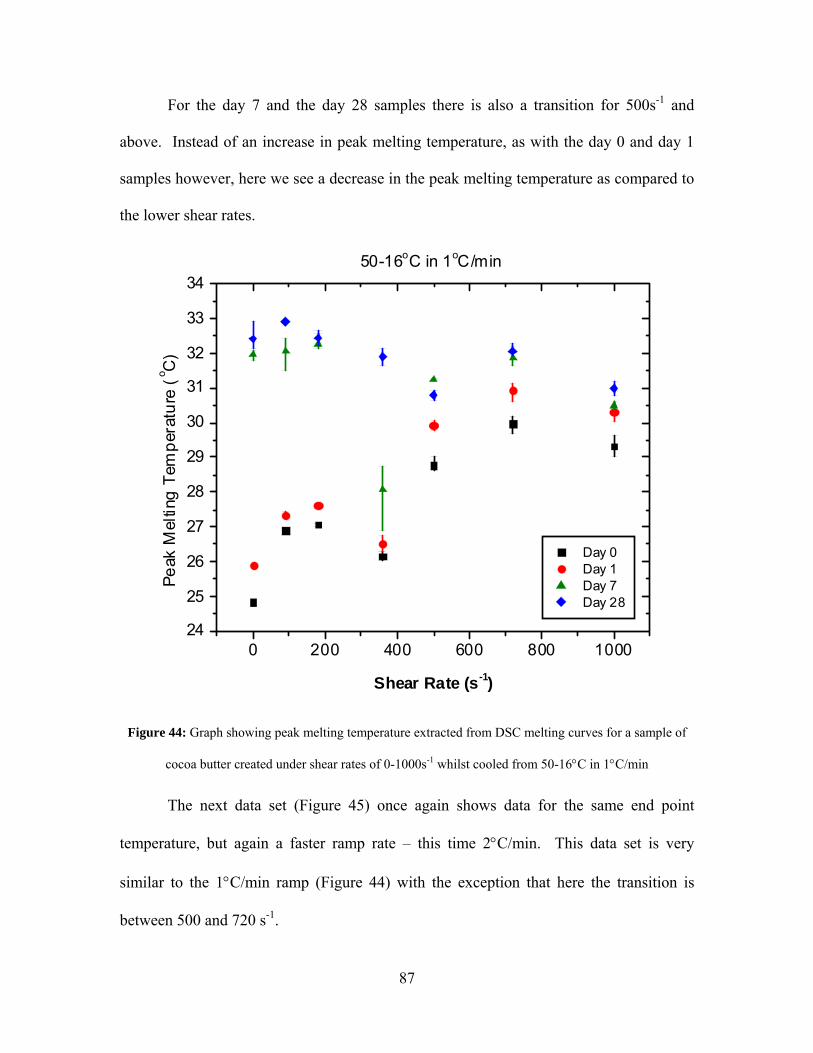
87
For the day 7 and the day 28 samples there is also a transition for 500s-1 and
above. Instead of an increase in peak melting temperature, as with the day 0 and day 1
samples however, here we see a decrease in the peak melting temperature as compared to
the lower shear rates.
0 200 400 600 800 100024
25
26
27
28
29
30
31
32
33
3450-16oC in 1oC/min
Peak
Mel
ting
Tem
pera
ture
(o C
)
Shear Rate (s-1)
Day 0 Day 1 Day 7 Day 28
Figure 44: Graph showing peak melting temperature extracted from DSC melting curves for a sample of
cocoa butter created under shear rates of 0-1000s-1 whilst cooled from 50-16°C in 1°C/min
The next data set (Figure 45) once again shows data for the same end point
temperature, but again a faster ramp rate – this time 2°C/min. This data set is very
similar to the 1°C/min ramp (Figure 44) with the exception that here the transition is
between 500 and 720 s-1.
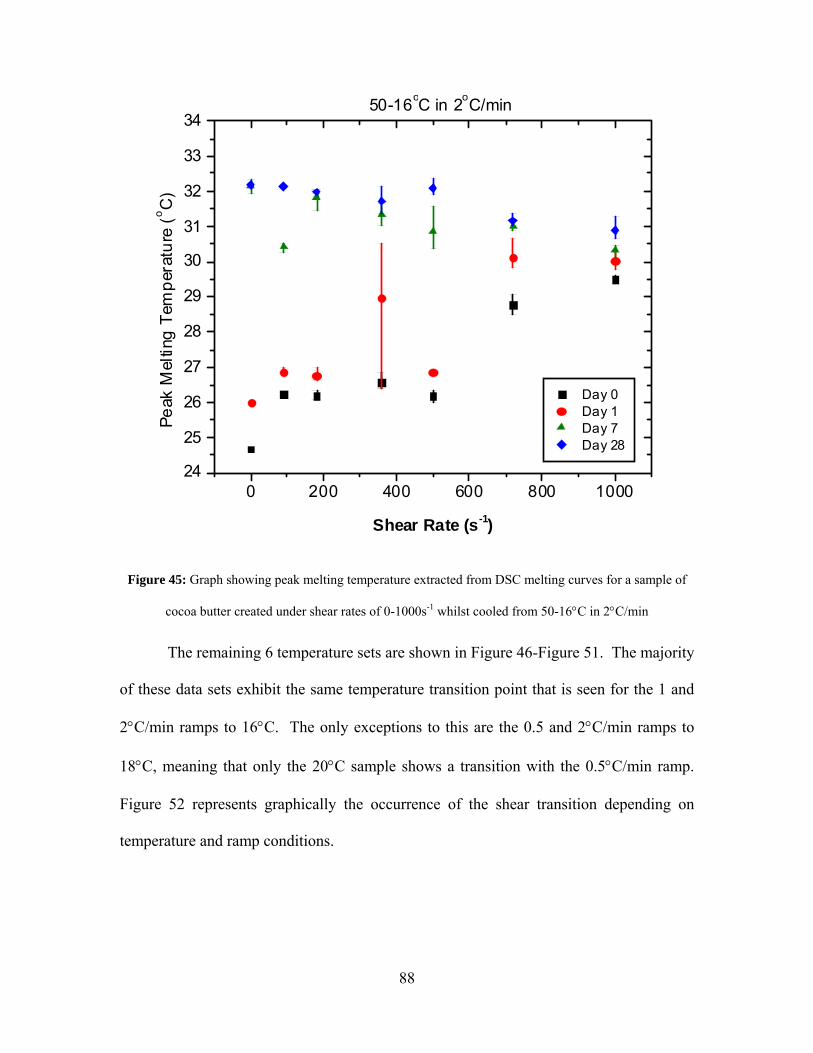
88
0 200 400 600 800 100024
25
26
27
28
29
30
31
32
33
3450-16oC in 2oC/min
Peak
Mel
ting
Tem
pera
ture
(o C)
Shear Rate (s-1)
Day 0 Day 1 Day 7 Day 28
Figure 45: Graph showing peak melting temperature extracted from DSC melting curves for a sample of
cocoa butter created under shear rates of 0-1000s-1 whilst cooled from 50-16°C in 2°C/min
The remaining 6 temperature sets are shown in Figure 46-Figure 51. The majority
of these data sets exhibit the same temperature transition point that is seen for the 1 and
2°C/min ramps to 16°C. The only exceptions to this are the 0.5 and 2°C/min ramps to
18°C, meaning that only the 20°C sample shows a transition with the 0.5°C/min ramp.
Figure 52 represents graphically the occurrence of the shear transition depending on
temperature and ramp conditions.
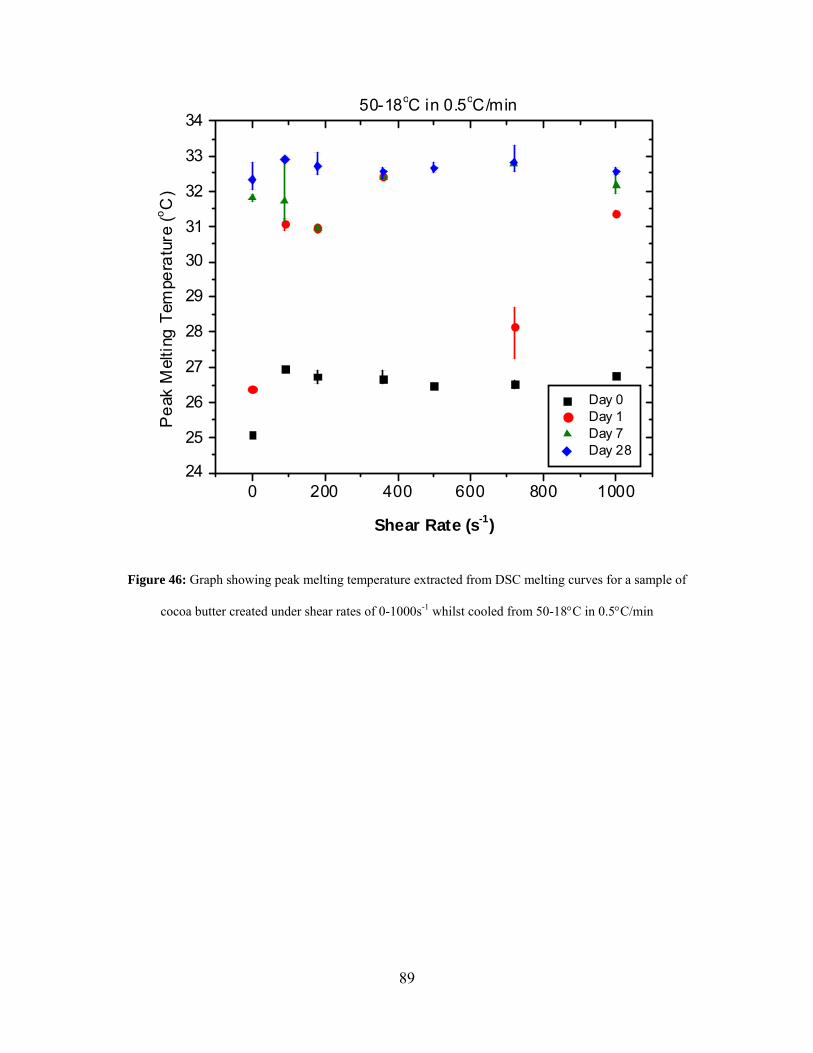
89
0 200 400 600 800 100024
25
26
27
28
29
30
31
32
33
3450-18oC in 0.5oC/min
Pea
k M
eltin
g Te
mpe
ratu
re (o C
)
Shear Rate (s-1)
Day 0 Day 1 Day 7 Day 28
Figure 46: Graph showing peak melting temperature extracted from DSC melting curves for a sample of
cocoa butter created under shear rates of 0-1000s-1 whilst cooled from 50-18°C in 0.5°C/min
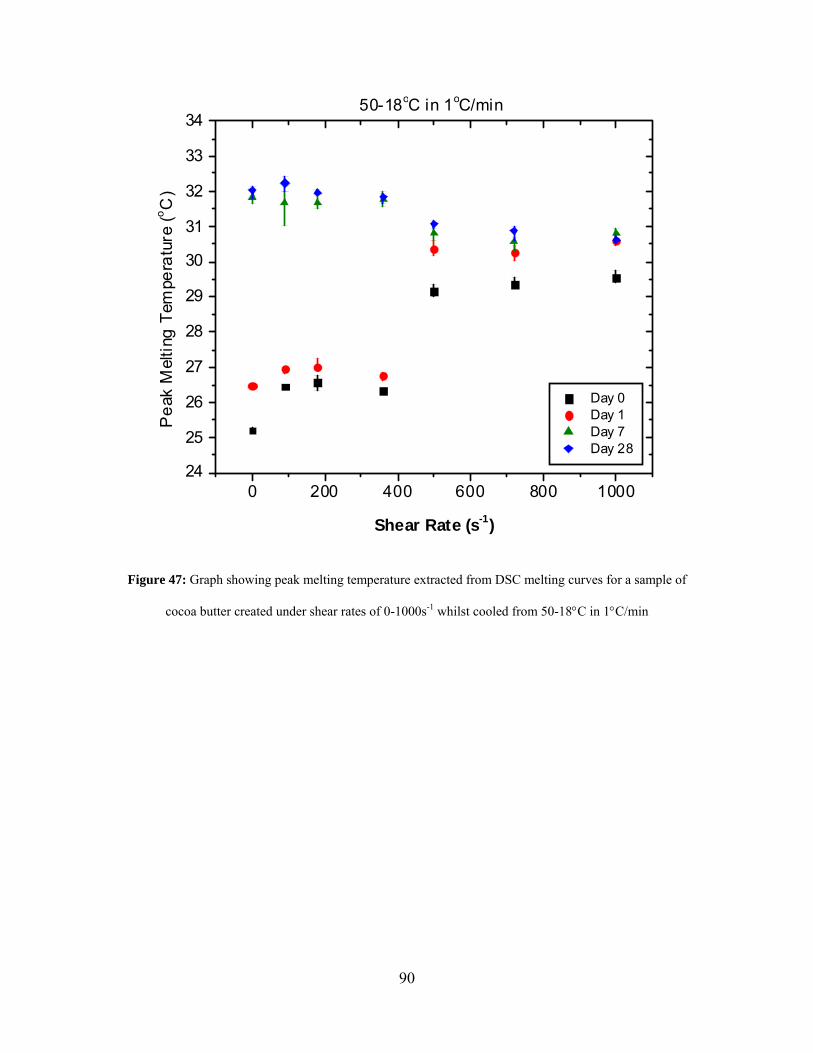
90
0 200 400 600 800 100024
25
26
27
28
29
30
31
32
33
3450-18oC in 1oC/min
Pea
k M
eltin
g Te
mpe
ratu
re (o C
)
Shear Rate (s-1)
Day 0 Day 1 Day 7 Day 28
Figure 47: Graph showing peak melting temperature extracted from DSC melting curves for a sample of
cocoa butter created under shear rates of 0-1000s-1 whilst cooled from 50-18°C in 1°C/min
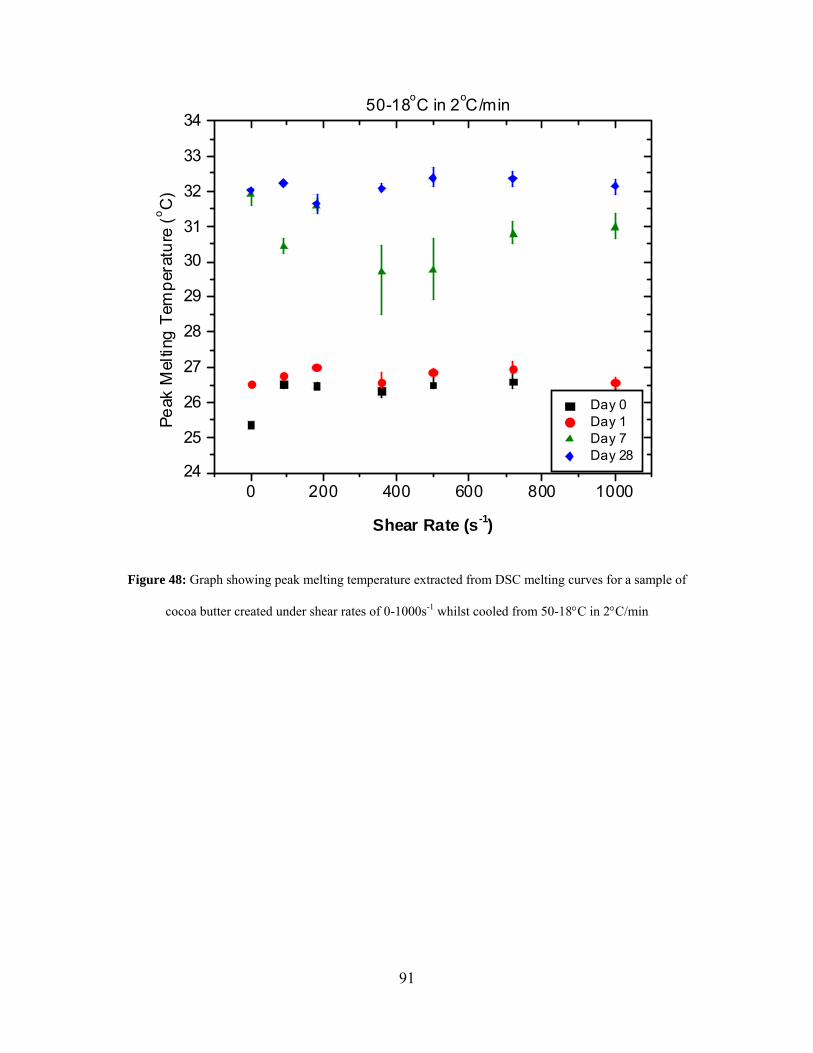
91
0 200 400 600 800 100024
25
26
27
28
29
30
31
32
33
3450-18oC in 2oC/min
Peak
Mel
ting
Tem
pera
ture
(o C)
Shear Rate (s-1)
Day 0 Day 1 Day 7 Day 28
Figure 48: Graph showing peak melting temperature extracted from DSC melting curves for a sample of
cocoa butter created under shear rates of 0-1000s-1 whilst cooled from 50-18°C in 2°C/min
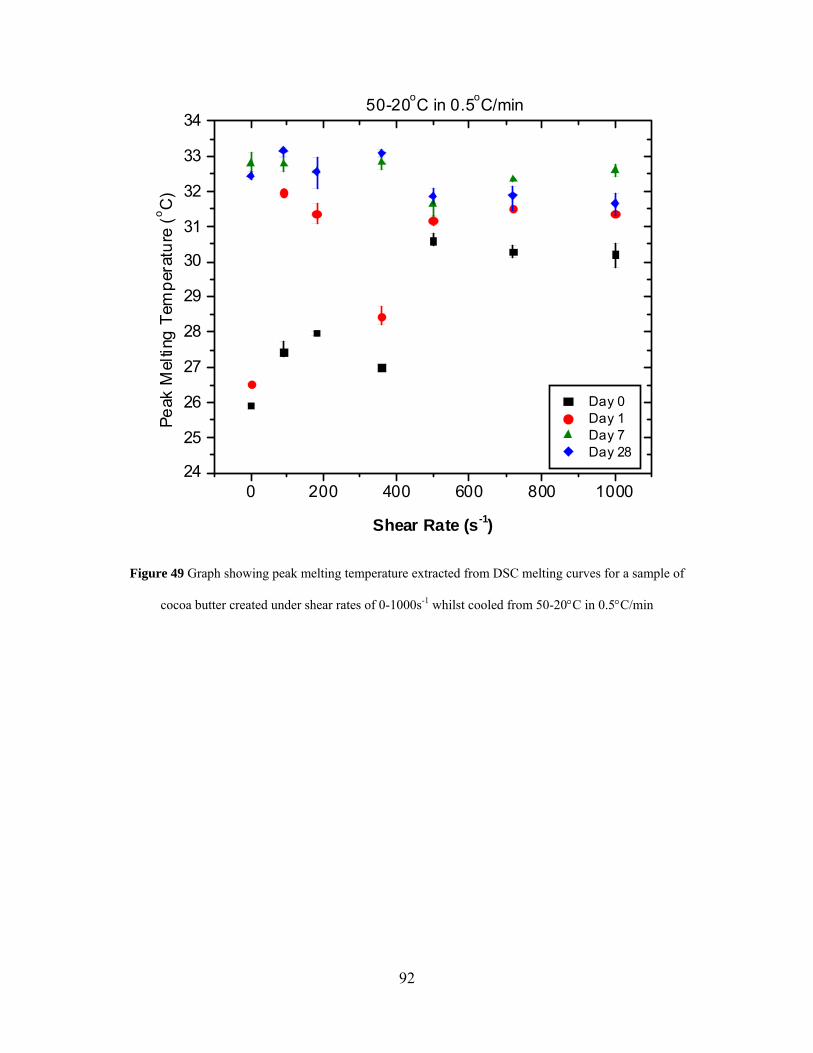
92
0 200 400 600 800 100024
25
26
27
28
29
30
31
32
33
3450-20oC in 0.5oC/min
Peak
Mel
ting
Tem
pera
ture
(o C)
Shear Rate (s-1)
Day 0 Day 1 Day 7 Day 28
Figure 49 Graph showing peak melting temperature extracted from DSC melting curves for a sample of
cocoa butter created under shear rates of 0-1000s-1 whilst cooled from 50-20°C in 0.5°C/min
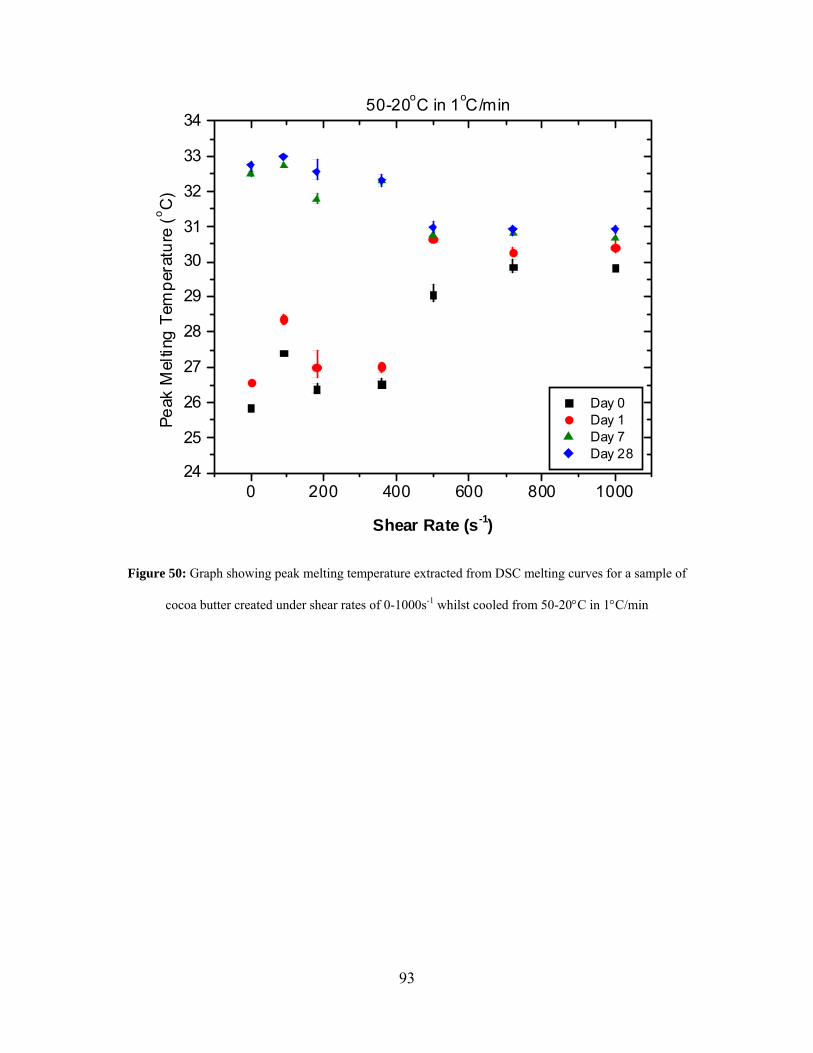
93
0 200 400 600 800 100024
25
26
27
28
29
30
31
32
33
3450-20oC in 1oC/min
Peak
Mel
ting
Tem
pera
ture
(o C)
Shear Rate (s-1)
Day 0 Day 1 Day 7 Day 28
Figure 50: Graph showing peak melting temperature extracted from DSC melting curves for a sample of
cocoa butter created under shear rates of 0-1000s-1 whilst cooled from 50-20°C in 1°C/min
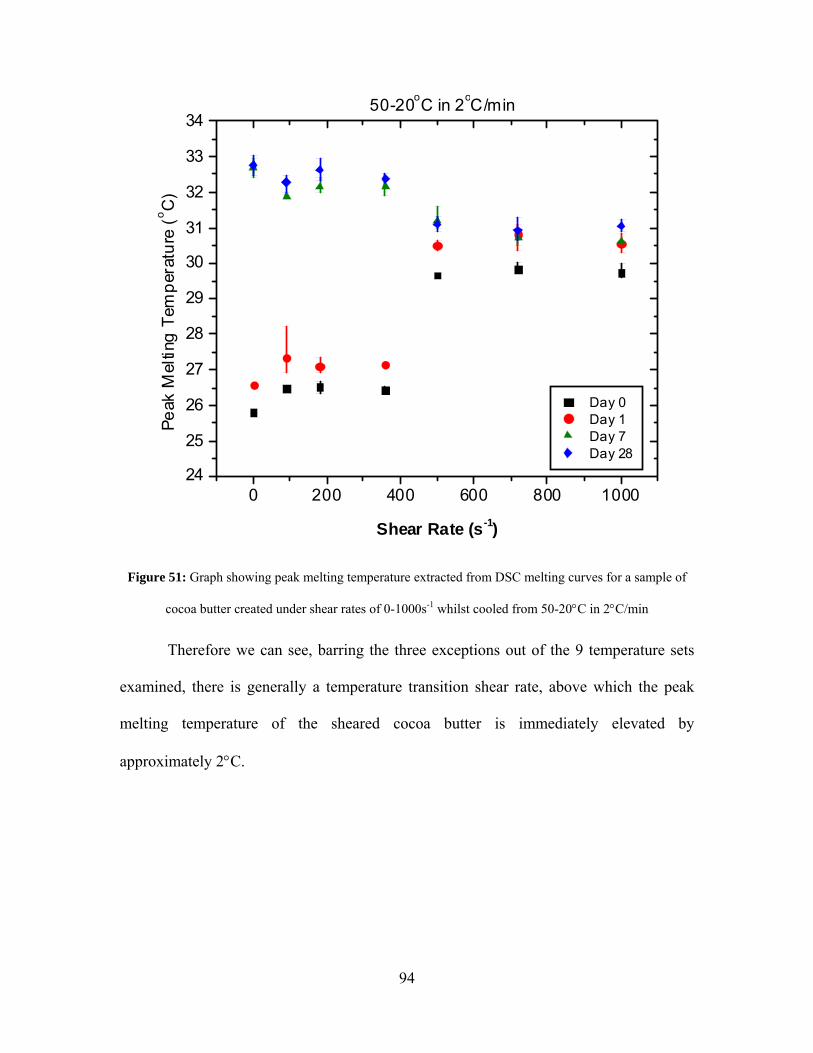
94
0 200 400 600 800 100024
25
26
27
28
29
30
31
32
33
3450-20oC in 2oC/min
Peak
Mel
ting
Tem
pera
ture
(o C)
Shear Rate (s-1)
Day 0 Day 1 Day 7 Day 28
Figure 51: Graph showing peak melting temperature extracted from DSC melting curves for a sample of
cocoa butter created under shear rates of 0-1000s-1 whilst cooled from 50-20°C in 2°C/min
Therefore we can see, barring the three exceptions out of the 9 temperature sets
examined, there is generally a temperature transition shear rate, above which the peak
melting temperature of the sheared cocoa butter is immediately elevated by
approximately 2°C.
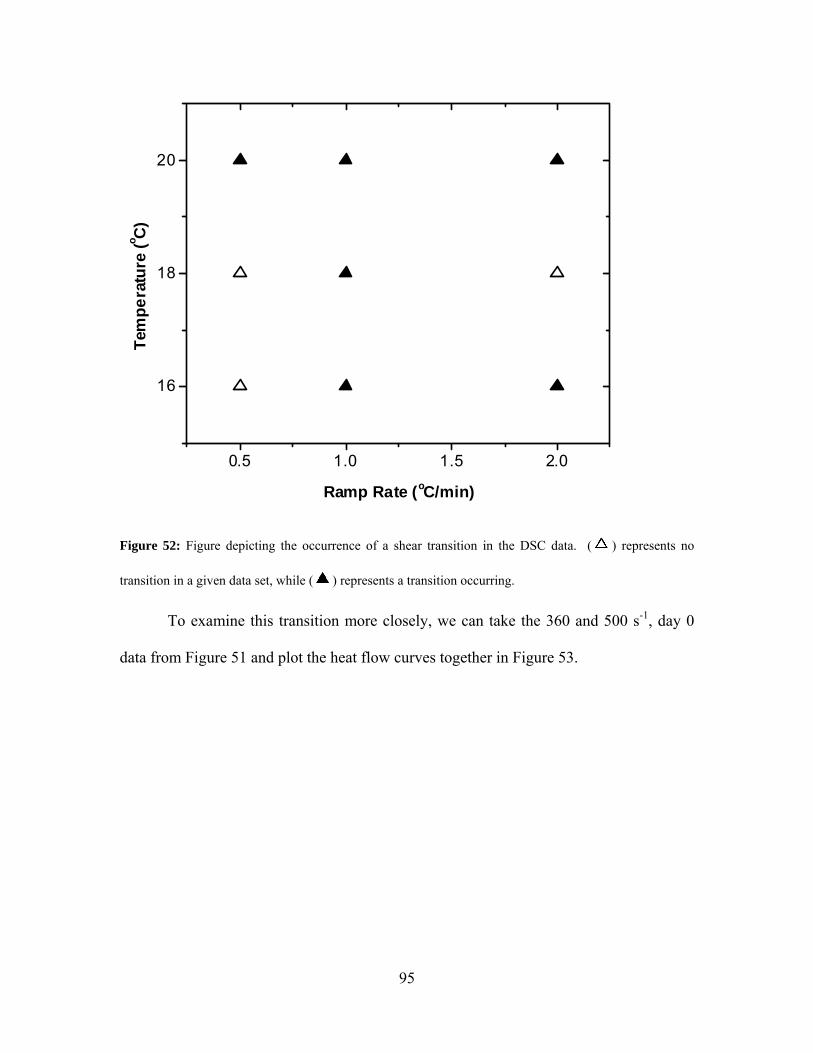
95
0.5 1.0 1.5 2.0
16
18
20Te
mpe
ratu
re (o C
)
Ramp Rate (oC/min)
Figure 52: Figure depicting the occurrence of a shear transition in the DSC data. ( ) represents no
transition in a given data set, while ( ) represents a transition occurring.
To examine this transition more closely, we can take the 360 and 500 s-1, day 0
data from Figure 51 and plot the heat flow curves together in Figure 53.
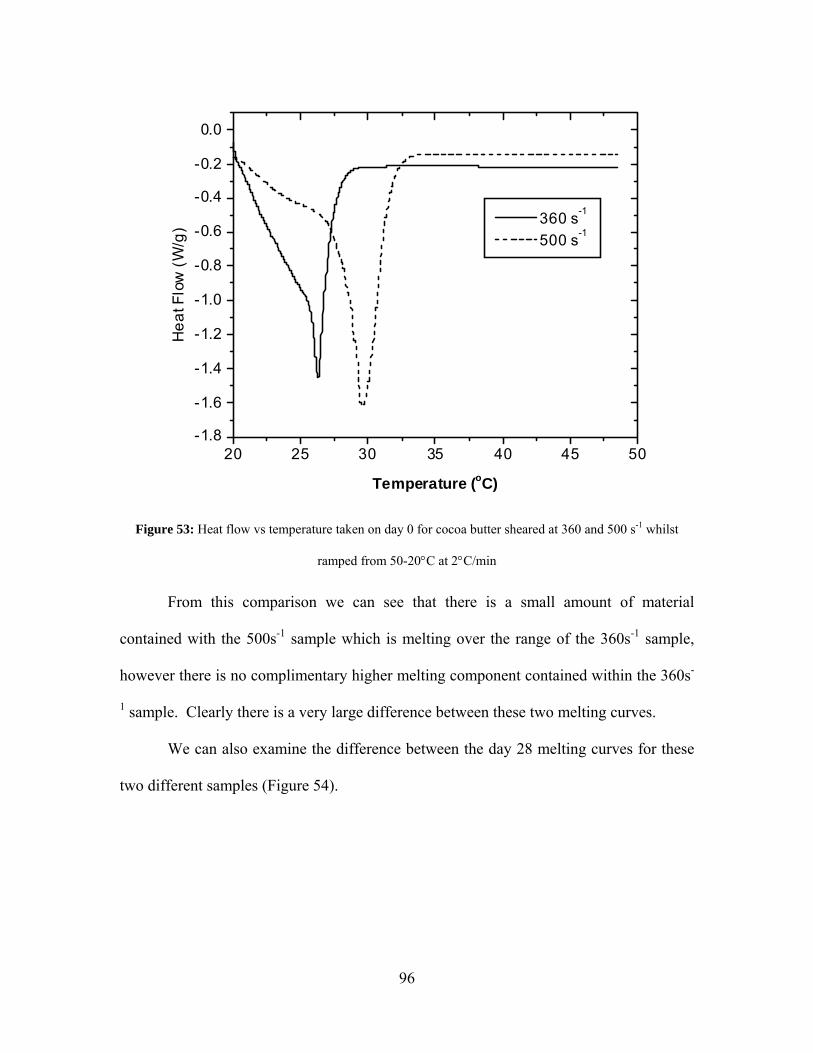
96
20 25 30 35 40 45 50-1.8
-1.6
-1.4
-1.2
-1.0
-0.8
-0.6
-0.4
-0.2
0.0
Hea
t Flo
w (W
/g)
Temperature (oC)
360 s-1
500 s-1
Figure 53: Heat flow vs temperature taken on day 0 for cocoa butter sheared at 360 and 500 s-1 whilst
ramped from 50-20°C at 2°C/min
From this comparison we can see that there is a small amount of material
contained with the 500s-1 sample which is melting over the range of the 360s-1 sample,
however there is no complimentary higher melting component contained within the 360s-
1 sample. Clearly there is a very large difference between these two melting curves.
We can also examine the difference between the day 28 melting curves for these
two different samples (Figure 54).
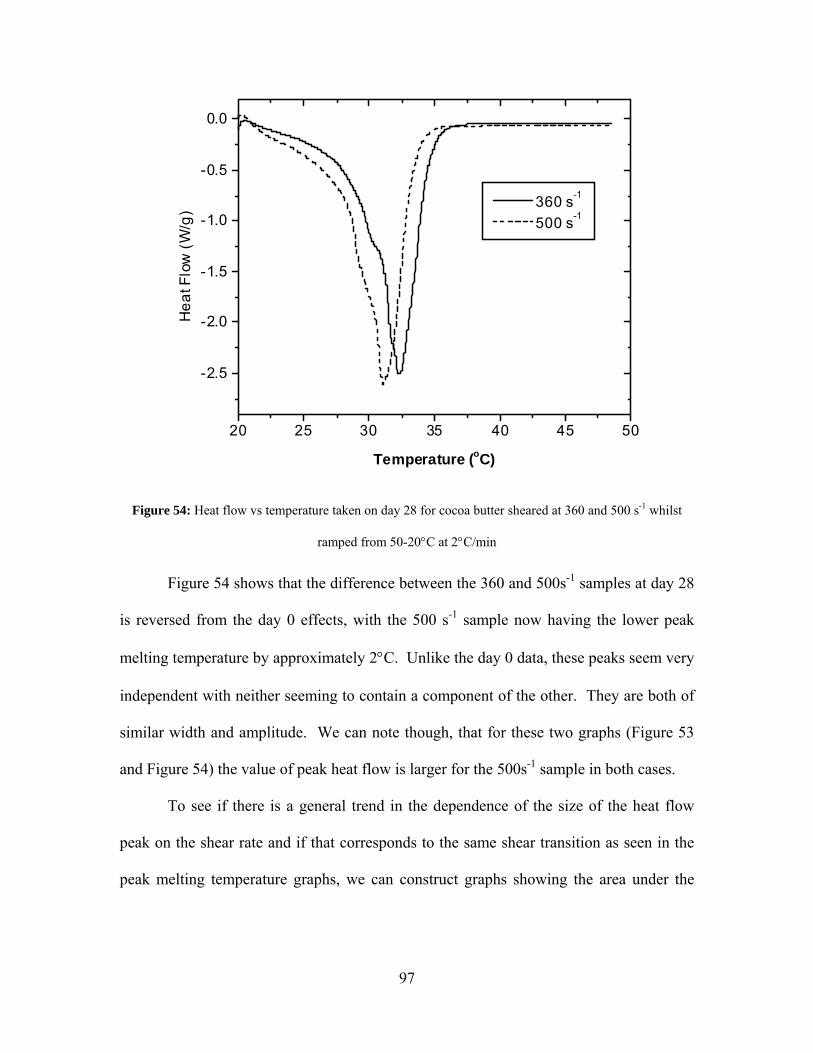
97
20 25 30 35 40 45 50
-2.5
-2.0
-1.5
-1.0
-0.5
0.0
Hea
t Flo
w (W
/g)
Temperature (oC)
360 s-1
500 s-1
Figure 54: Heat flow vs temperature taken on day 28 for cocoa butter sheared at 360 and 500 s-1 whilst
ramped from 50-20°C at 2°C/min
Figure 54 shows that the difference between the 360 and 500s-1 samples at day 28
is reversed from the day 0 effects, with the 500 s-1 sample now having the lower peak
melting temperature by approximately 2°C. Unlike the day 0 data, these peaks seem very
independent with neither seeming to contain a component of the other. They are both of
similar width and amplitude. We can note though, that for these two graphs (Figure 53
and Figure 54) the value of peak heat flow is larger for the 500s-1 sample in both cases.
To see if there is a general trend in the dependence of the size of the heat flow
peak on the shear rate and if that corresponds to the same shear transition as seen in the
peak melting temperature graphs, we can construct graphs showing the area under the
98
heat flow peaks (enthalpy) and plot that against shear rate for the day 0, day 1, day 7 and
day 28 samples. These plots can be found in Appendix 5 (Figure 138 to Figure 146).
Figure 138 to Figure 146 are considerably noisier than Figure 43 to Figure 51,
however they show convergence above 500s-1 for the same samples. That is, for the
transition shear rate of between 360 and 500 s-1, there is an increase in the enthalpy for
the day 0 and day 1 compared to values below the shear transition. The general noisiness
of the data shows a general increase in the random error of the data. While these values
incorporate error due to measurement of the mass of the samples, the variability also
indicates that the amount of crystallization is much more variable than the melting
temperature of those crystals.
We can note from the melting data that the melting temperatures observed at the
higher shear rates are in fact lower that that generally seen for a βV polymorph in this
cocoa butter. In fact, as we have already noted, it is almost 2°C lower that that of the
lower shear rate βV forms produced. From this, as well as the fact that this lower melting
temperature persists throughout the whole 28 days, it seems reasonable to conclude that
the jump in melting temperature at higher shear rates is caused by crystallization of either
a different polymorph or of predominantly lower melting temperature TAGs crystallizing
into a βV structure. This will be discussed further in section 3.
While the difference in melting temperature alone does seem very clear,
obviously x-ray analysis is required for confirmation (and can be found in section 2.3.2)
and supports the theory of selective crystallization.
Still to be discussed, however, is the reason behind the certain data sets which do
not exhibit the shear transition. These data sets are the 50-16°C in 0.5°C/min, the 50-
99
18°C in 0.5°C/min and the 50-18°C in 2°C/min. There are a few possibilities for the
explanation. Firstly, there may simply be no transition for those conditions. The slow
cooling rate of 0.5°C/min for examples allows for a much slower crystallization and more
α crystallites to form before a βV transition. The presence of a larger amount of α
crystallites could impede the transformation into the chemically altered βV form.
Secondly, we have seen that the transition need not occur at 500s-1, it has been
seen at 720s-1, and therefore it is possible that a transition occurs off the scale, above
1000s-1. Unfortunately the rheometer limitations make this impossible to test.
The third possibility is a function of the experimental variability. It was seen over
the course of these measurements that a given data point above the shear transition could
show no change in temperature for one sample, yet for a repeated sample created under
exactly the same conditions with a very similar viscosity profile, there would be a change
in temperature. While unlikely due to the number of repetitions done for the three data
sets, it is possible that a transition is merely less likely, but still possible under those
conditions.
If we consider what the data sets have in common, we can see that the 0.5°C/min
ramps are more likely explained by the lack of a transition point simply due to the
presence of a large amount of α crystallites which remain through the βV transition. The
18°C in 2°C/min data set seems more likely to be explained as either having a higher
transition shear rate or merely having an erroneous 1000s-1 data point.
We must still consider why such a transition with shear would occur in the first
place. First, however, the x-ray and mechanical data should be examined to provide a
fuller picture of the situation. A more detailed discussion will follow in section 3.
100
2.3 X-ray Measurements of Sheared Cocoa Butter
Once a sample of cocoa butter has been extracted from the split couette apparatus
(Section 2.1), x-ray diffraction studies can be done to assess the orientation of the sample.
A fixed target CuKα source was utilized with a focusing graphite monochromator crystal
and a Bicron point detector. This gives a beam with a wavelength of 1.54 Å. One set of
slits before the sample was used to further collimate the x-ray beam and two further pairs
on either end of a helium filled flight path after the sample helped cut out background
scatter. The resulting beam has a resolution ∆q = 0.03 Å-1. The sample is mounted in a
Huber 4-circle diffractometer.
In order to minimize the effects of sample size on the orientation scans, the
sample needs to be as uniform as possible. If this was not the case then the effects of
attenuation though varying amounts of cocoa butter could mimic orientation. Since the
thickness of the cocoa butter is 1mm, a sample is created which is roughly a cylinder of
diameter 1mm and height 1mm. The cocoa butter cylinder can then be mounted on a
wire and placed in the x-ray beam whose size is larger than the sample. Thus, the entire
sample volume is encompassed by the beam. By rotating the detector through a scan in
the theta plane, a diffraction image can be achieved (such as those shown in Appendix 2).
Since the application of shear accelerates the appearance of the form V structure, only
orientation in that structure was investigated as it persisted over the course of all of the
measurements. A typical orientation, or mosaic, scan of the (002) diffraction peak of the
βV crystal is shown in Figure 55. The (002) peak was selected since it was a clearer peak,
away from the interference of the direct beam on the data
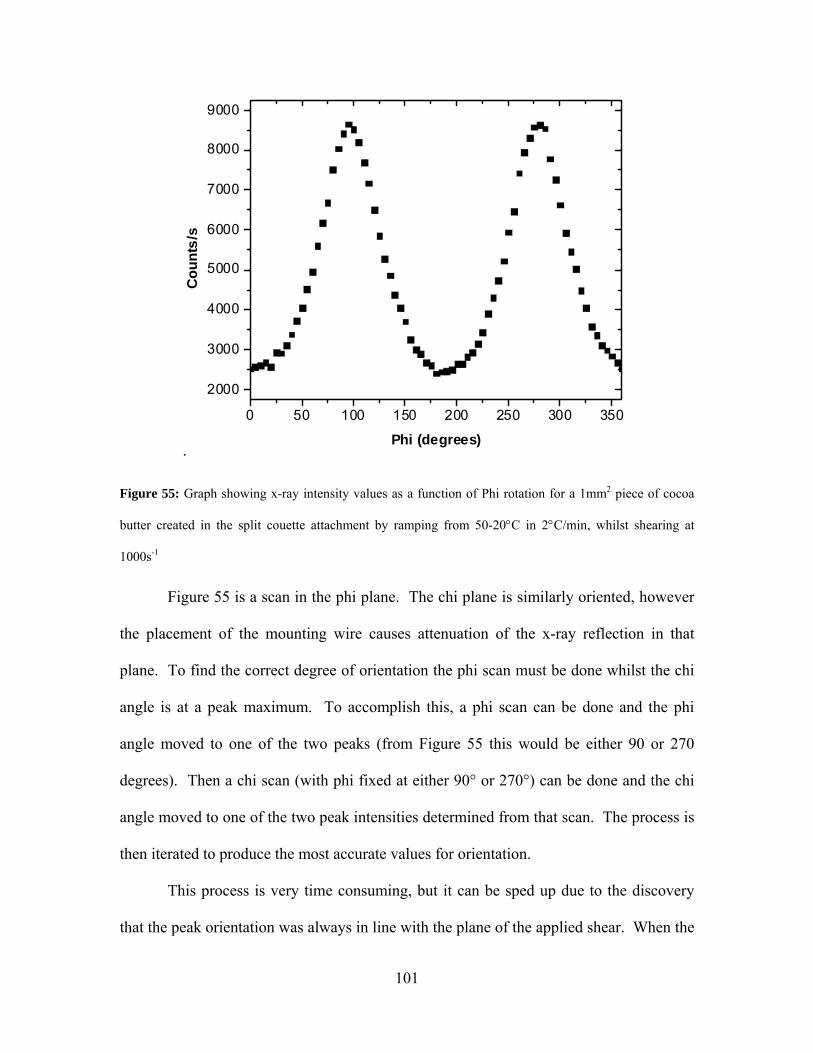
101
.
0 50 100 150 200 250 300 350
2000
3000
4000
5000
6000
7000
8000
9000
Cou
nts/
s
Phi (degrees)
Figure 55: Graph showing x-ray intensity values as a function of Phi rotation for a 1mm2 piece of cocoa
butter created in the split couette attachment by ramping from 50-20°C in 2°C/min, whilst shearing at
1000s-1
Figure 55 is a scan in the phi plane. The chi plane is similarly oriented, however
the placement of the mounting wire causes attenuation of the x-ray reflection in that
plane. To find the correct degree of orientation the phi scan must be done whilst the chi
angle is at a peak maximum. To accomplish this, a phi scan can be done and the phi
angle moved to one of the two peaks (from Figure 55 this would be either 90 or 270
degrees). Then a chi scan (with phi fixed at either 90° or 270°) can be done and the chi
angle moved to one of the two peak intensities determined from that scan. The process is
then iterated to produce the most accurate values for orientation.
This process is very time consuming, but it can be sped up due to the discovery
that the peak orientation was always in line with the plane of the applied shear. When the
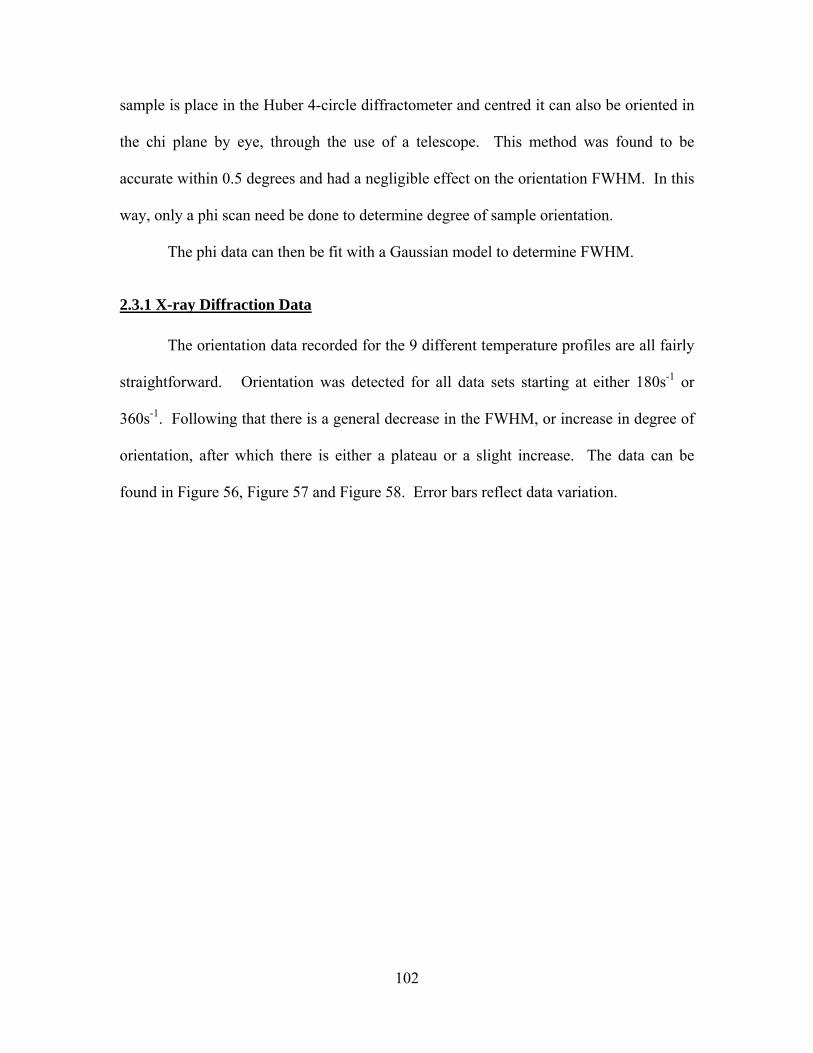
102
sample is place in the Huber 4-circle diffractometer and centred it can also be oriented in
the chi plane by eye, through the use of a telescope. This method was found to be
accurate within 0.5 degrees and had a negligible effect on the orientation FWHM. In this
way, only a phi scan need be done to determine degree of sample orientation.
The phi data can then be fit with a Gaussian model to determine FWHM.
2.3.1 X-ray Diffraction Data
The orientation data recorded for the 9 different temperature profiles are all fairly
straightforward. Orientation was detected for all data sets starting at either 180s-1 or
360s-1. Following that there is a general decrease in the FWHM, or increase in degree of
orientation, after which there is either a plateau or a slight increase. The data can be
found in Figure 56, Figure 57 and Figure 58. Error bars reflect data variation.
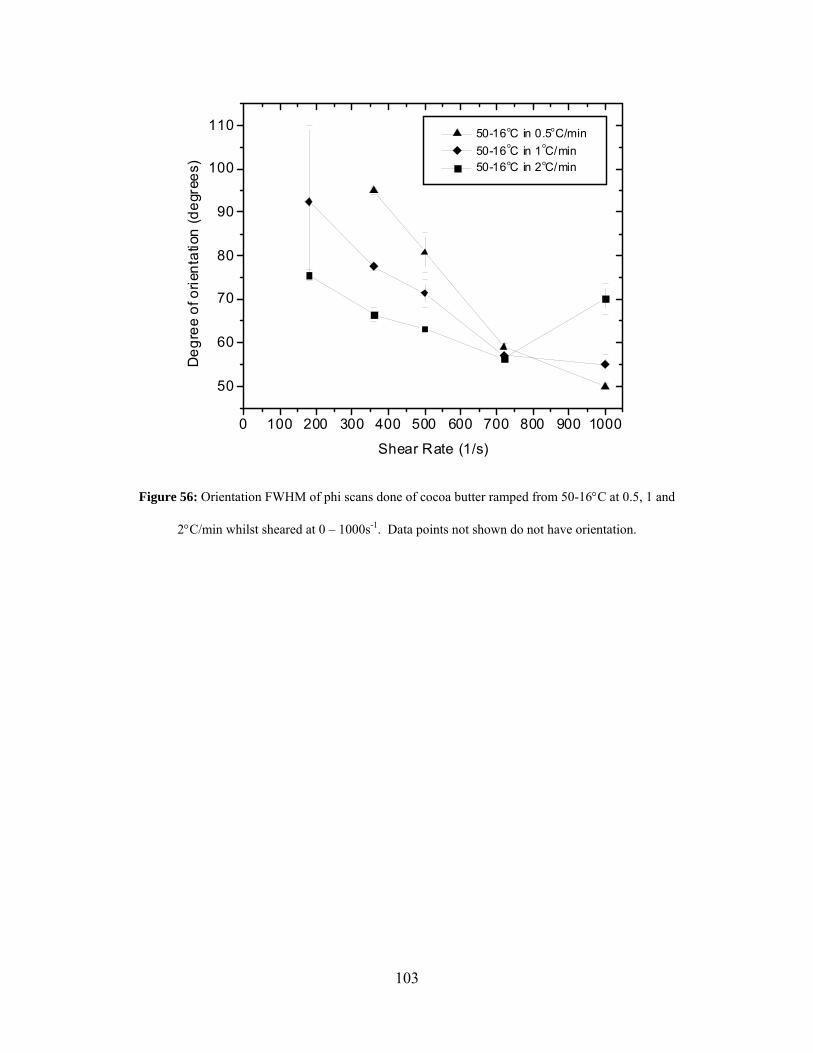
103
0 100 200 300 400 500 600 700 800 900 1000
50
60
70
80
90
100
110 50-16oC in 0.5oC/min 50-16oC in 1oC/min 50-16oC in 2oC/min
Deg
ree
of o
rient
atio
n (d
egre
es)
Shear Rate (1/s)
Figure 56: Orientation FWHM of phi scans done of cocoa butter ramped from 50-16°C at 0.5, 1 and
2°C/min whilst sheared at 0 – 1000s-1. Data points not shown do not have orientation.
104
0 100 200 300 400 500 600 700 800 900 1000
40
50
60
70
80
90
100
110 50-18oC in 0.5oC/min 50-18oC in 1oC/min 50-18oC in 2oC/min
Deg
ree
of o
rient
atio
n (d
egre
es)
Shear Rate (1/s)
Figure 57: Orientation FWHM of phi scans done of cocoa butter ramped from 50-18°C at 0.5, 1 and
2°C/min whilst sheared at 0 – 1000s-1. Data points not shown do not have orientation.
The general increase in the degree of orientation is expected from previous
results[25], which showed an increase in the degree of orientation with shear rate. The
few points which appear to be discrepancies in this trend would perhaps be eliminated
with an increased sampling.
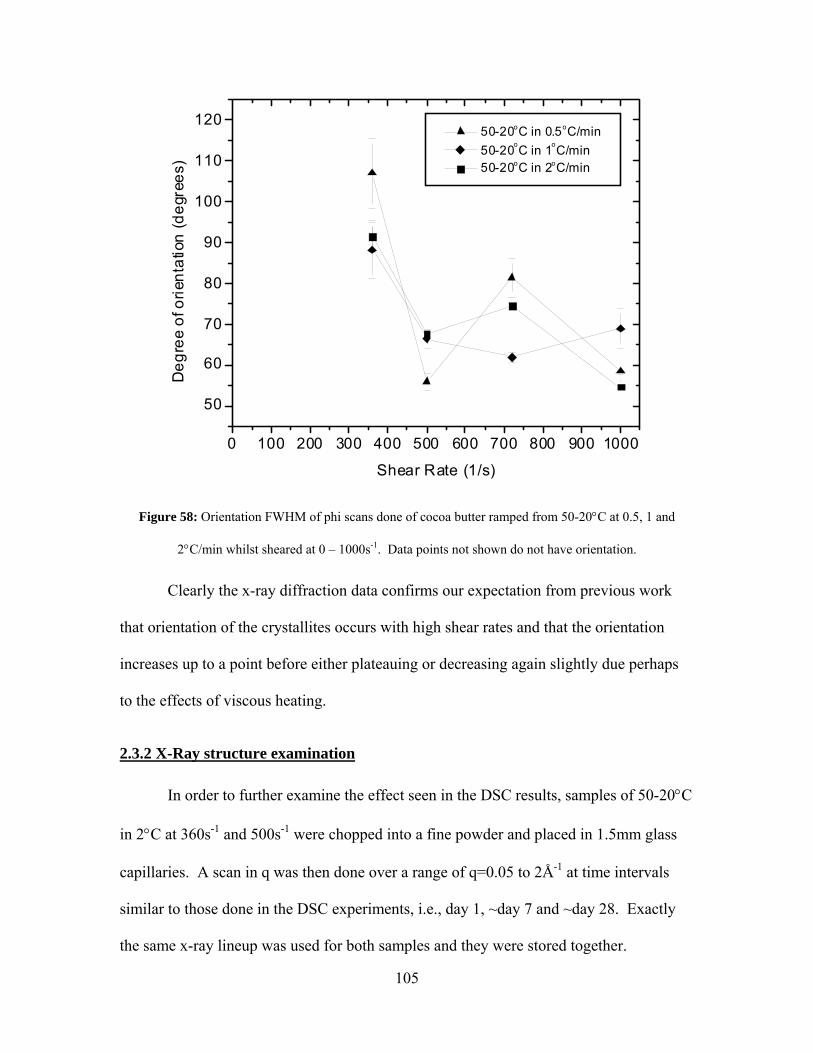
105
0 100 200 300 400 500 600 700 800 900 1000
50
60
70
80
90
100
110
120 50-20oC in 0.5oC/min 50-20oC in 1oC/min 50-20oC in 2oC/min
Deg
ree
of o
rient
atio
n (d
egre
es)
Shear Rate (1/s)
Figure 58: Orientation FWHM of phi scans done of cocoa butter ramped from 50-20°C at 0.5, 1 and
2°C/min whilst sheared at 0 – 1000s-1. Data points not shown do not have orientation.
Clearly the x-ray diffraction data confirms our expectation from previous work
that orientation of the crystallites occurs with high shear rates and that the orientation
increases up to a point before either plateauing or decreasing again slightly due perhaps
to the effects of viscous heating.
2.3.2 X-Ray structure examination
In order to further examine the effect seen in the DSC results, samples of 50-20°C
in 2°C at 360s-1 and 500s-1 were chopped into a fine powder and placed in 1.5mm glass
capillaries. A scan in q was then done over a range of q=0.05 to 2Å-1 at time intervals
similar to those done in the DSC experiments, i.e., day 1, ~day 7 and ~day 28. Exactly
the same x-ray lineup was used for both samples and they were stored together.
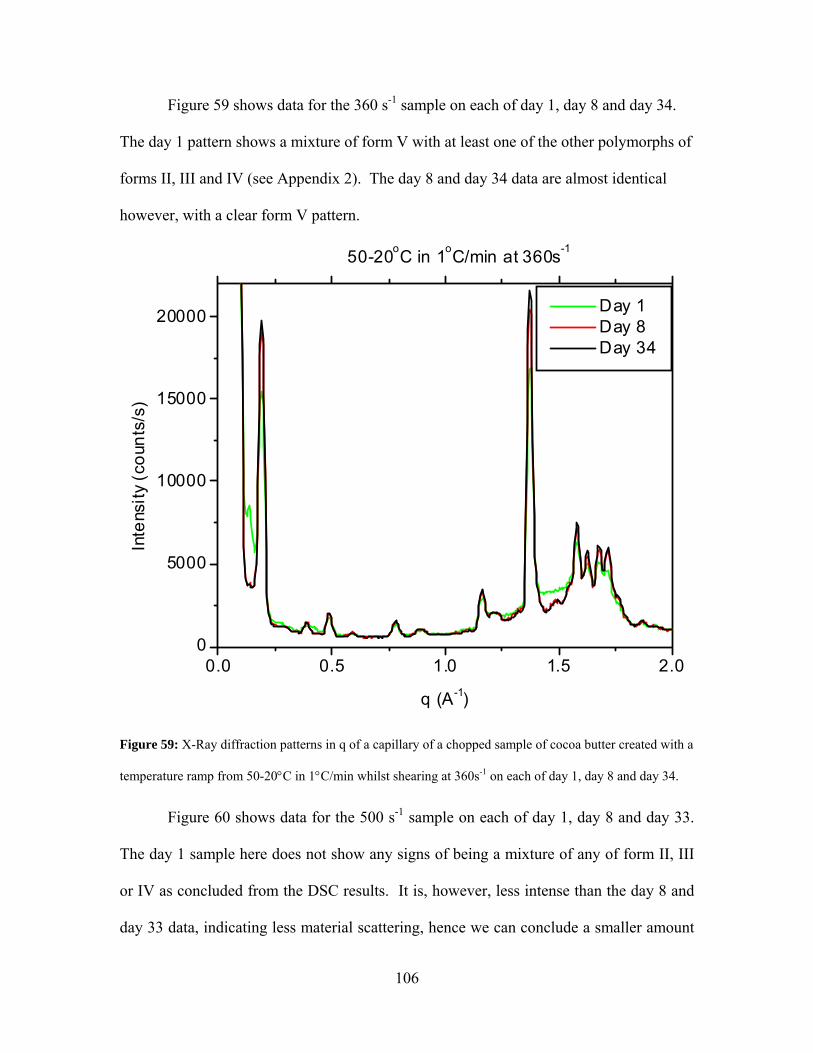
106
Figure 59 shows data for the 360 s-1 sample on each of day 1, day 8 and day 34.
The day 1 pattern shows a mixture of form V with at least one of the other polymorphs of
forms II, III and IV (see Appendix 2). The day 8 and day 34 data are almost identical
however, with a clear form V pattern.
0.0 0.5 1.0 1.5 2.00
5000
10000
15000
20000
50-20oC in 1oC/min at 360s-1
Inte
nsity
(cou
nts/
s)
q (A-1)
Day 1 Day 8 Day 34
Figure 59: X-Ray diffraction patterns in q of a capillary of a chopped sample of cocoa butter created with a
temperature ramp from 50-20°C in 1°C/min whilst shearing at 360s-1 on each of day 1, day 8 and day 34.
Figure 60 shows data for the 500 s-1 sample on each of day 1, day 8 and day 33.
The day 1 sample here does not show any signs of being a mixture of any of form II, III
or IV as concluded from the DSC results. It is, however, less intense than the day 8 and
day 33 data, indicating less material scattering, hence we can conclude a smaller amount
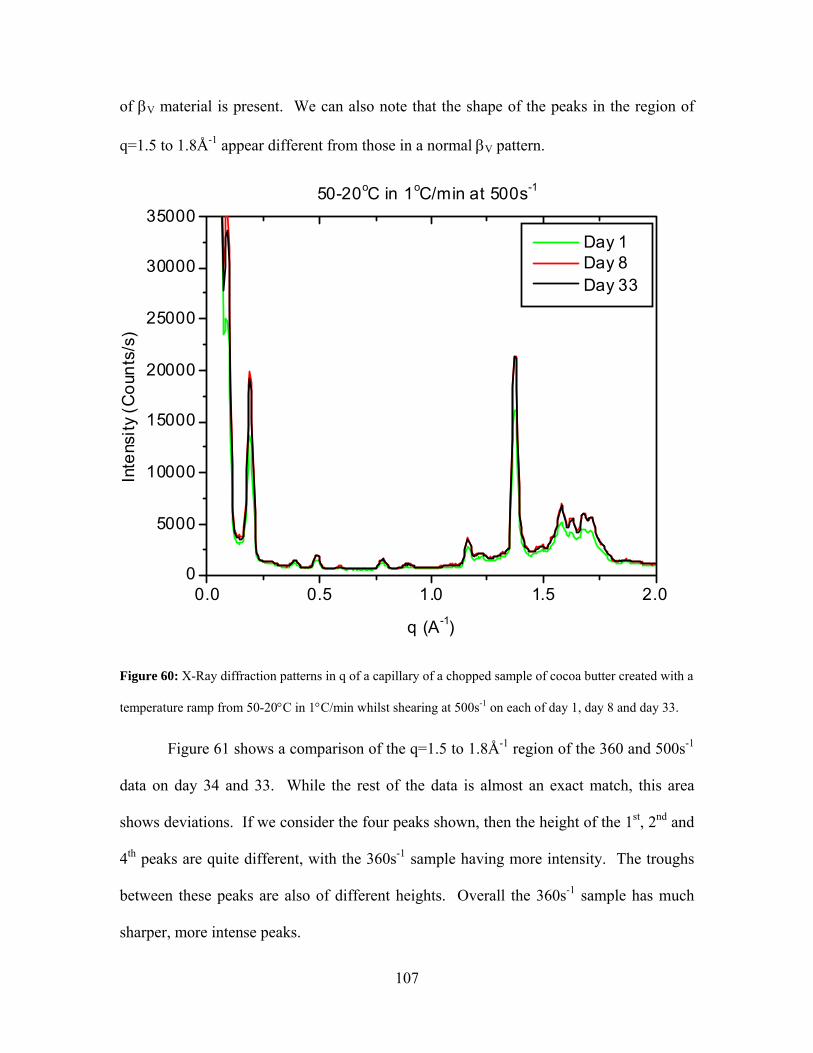
107
of βV material is present. We can also note that the shape of the peaks in the region of
q=1.5 to 1.8Å-1 appear different from those in a normal βV pattern.
0.0 0.5 1.0 1.5 2.00
5000
10000
15000
20000
25000
30000
3500050-20oC in 1oC/min at 500s-1
Inte
nsity
(Cou
nts/
s)
q (A-1)
Day 1 Day 8 Day 33
Figure 60: X-Ray diffraction patterns in q of a capillary of a chopped sample of cocoa butter created with a
temperature ramp from 50-20°C in 1°C/min whilst shearing at 500s-1 on each of day 1, day 8 and day 33.
Figure 61 shows a comparison of the q=1.5 to 1.8Å-1 region of the 360 and 500s-1
data on day 34 and 33. While the rest of the data is almost an exact match, this area
shows deviations. If we consider the four peaks shown, then the height of the 1st, 2nd and
4th peaks are quite different, with the 360s-1 sample having more intensity. The troughs
between these peaks are also of different heights. Overall the 360s-1 sample has much
sharper, more intense peaks.
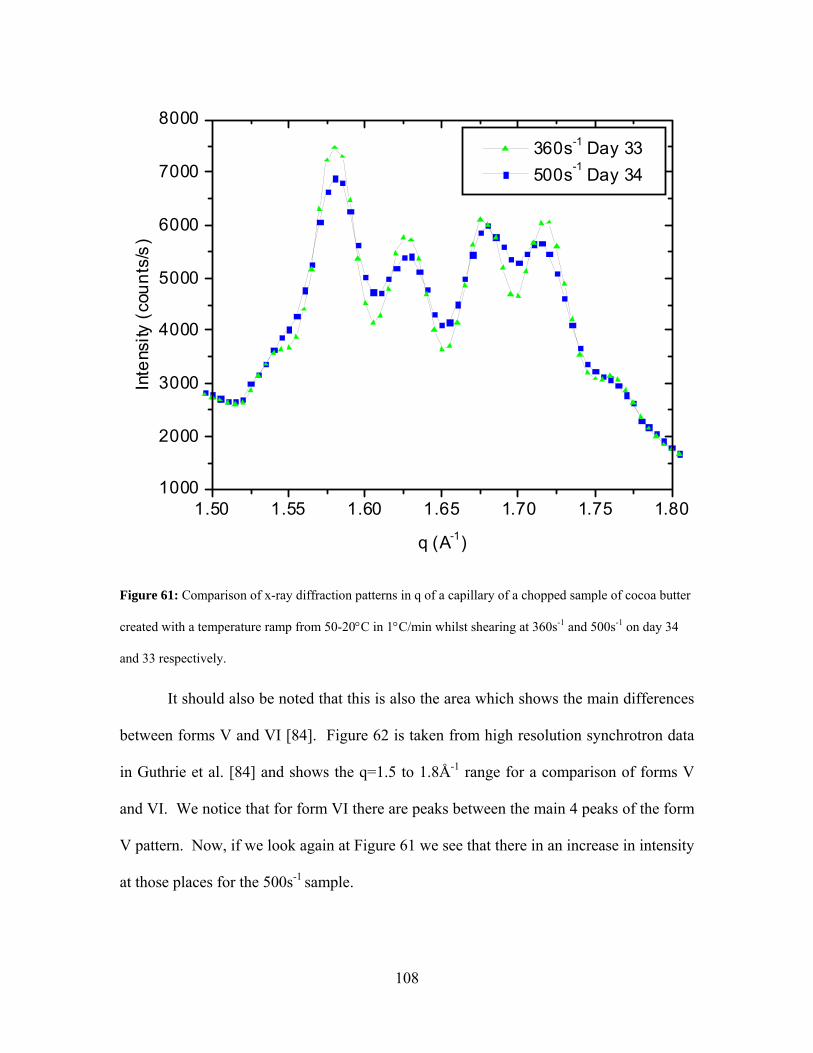
108
1.50 1.55 1.60 1.65 1.70 1.75 1.801000
2000
3000
4000
5000
6000
7000
8000In
tens
ity (c
ount
s/s)
q (A-1)
360s-1 Day 33 500s-1 Day 34
Figure 61: Comparison of x-ray diffraction patterns in q of a capillary of a chopped sample of cocoa butter
created with a temperature ramp from 50-20°C in 1°C/min whilst shearing at 360s-1 and 500s-1 on day 34
and 33 respectively.
It should also be noted that this is also the area which shows the main differences
between forms V and VI [84]. Figure 62 is taken from high resolution synchrotron data
in Guthrie et al. [84] and shows the q=1.5 to 1.8Å-1 range for a comparison of forms V
and VI. We notice that for form VI there are peaks between the main 4 peaks of the form
V pattern. Now, if we look again at Figure 61 we see that there in an increase in intensity
at those places for the 500s-1 sample.
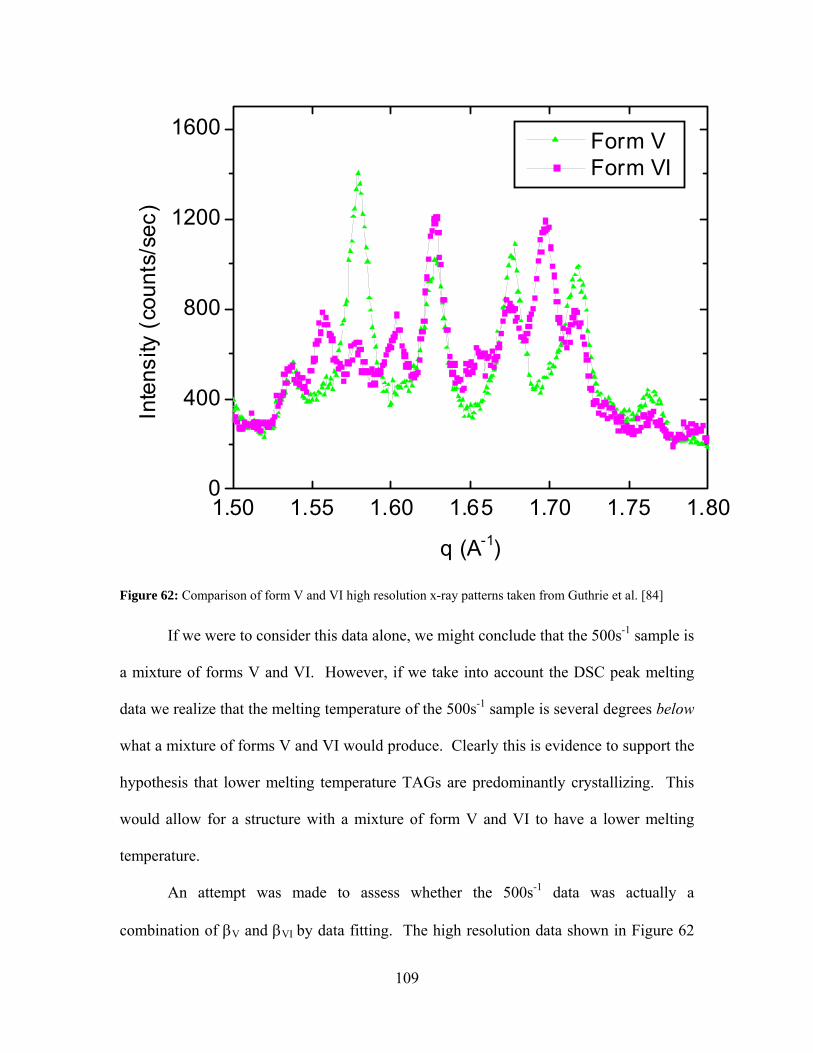
109
1.50 1.55 1.60 1.65 1.70 1.75 1.800
400
800
1200
1600In
tens
ity (c
ount
s/se
c)
q (A-1)
Form V Form VI
Figure 62: Comparison of form V and VI high resolution x-ray patterns taken from Guthrie et al. [84]
If we were to consider this data alone, we might conclude that the 500s-1 sample is
a mixture of forms V and VI. However, if we take into account the DSC peak melting
data we realize that the melting temperature of the 500s-1 sample is several degrees below
what a mixture of forms V and VI would produce. Clearly this is evidence to support the
hypothesis that lower melting temperature TAGs are predominantly crystallizing. This
would allow for a structure with a mixture of form V and VI to have a lower melting
temperature.
An attempt was made to assess whether the 500s-1 data was actually a
combination of βV and βVI by data fitting. The high resolution data shown in Figure 62
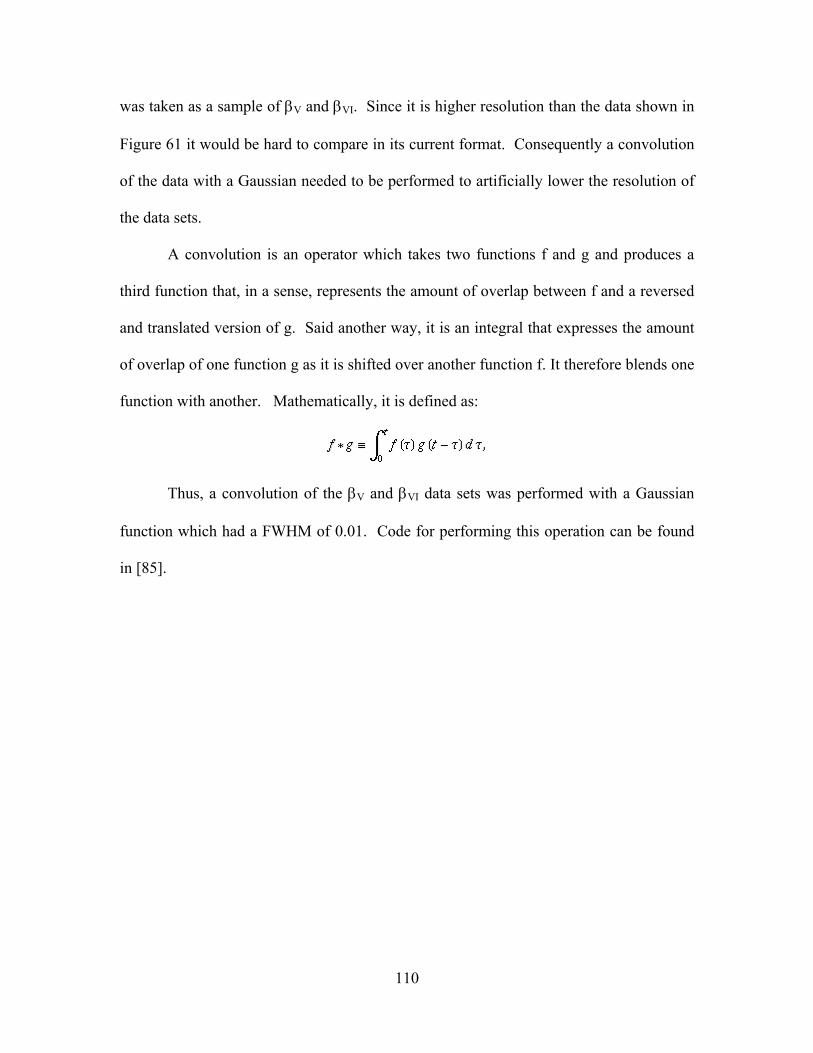
110
was taken as a sample of βV and βVI. Since it is higher resolution than the data shown in
Figure 61 it would be hard to compare in its current format. Consequently a convolution
of the data with a Gaussian needed to be performed to artificially lower the resolution of
the data sets.
A convolution is an operator which takes two functions f and g and produces a
third function that, in a sense, represents the amount of overlap between f and a reversed
and translated version of g. Said another way, it is an integral that expresses the amount
of overlap of one function g as it is shifted over another function f. It therefore blends one
function with another. Mathematically, it is defined as:
Thus, a convolution of the βV and βVI data sets was performed with a Gaussian
function which had a FWHM of 0.01. Code for performing this operation can be found
in [85].
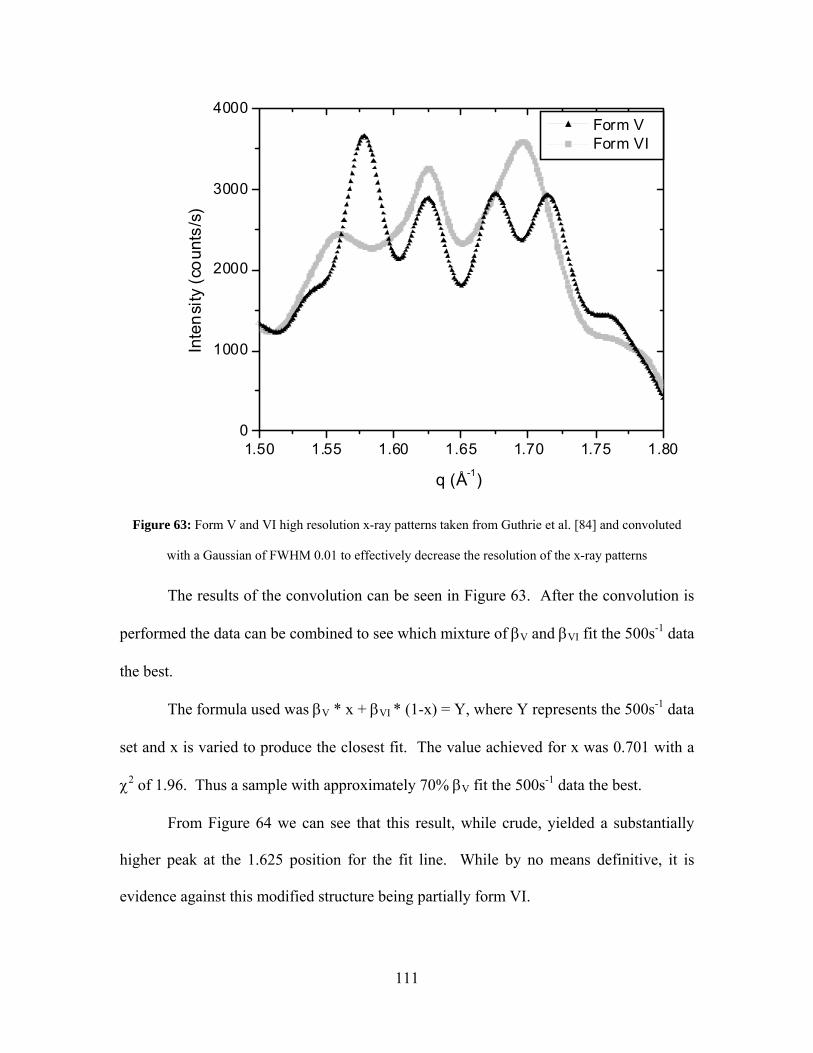
111
1.50 1.55 1.60 1.65 1.70 1.75 1.800
1000
2000
3000
4000
Inte
nsity
(cou
nts/
s)
q (Å-1)
Form V Form VI
Figure 63: Form V and VI high resolution x-ray patterns taken from Guthrie et al. [84] and convoluted
with a Gaussian of FWHM 0.01 to effectively decrease the resolution of the x-ray patterns
The results of the convolution can be seen in Figure 63. After the convolution is
performed the data can be combined to see which mixture of βV and βVI fit the 500s-1 data
the best.
The formula used was βV * x + βVI * (1-x) = Y, where Y represents the 500s-1 data
set and x is varied to produce the closest fit. The value achieved for x was 0.701 with a
χ2 of 1.96. Thus a sample with approximately 70% βV fit the 500s-1 data the best.
From Figure 64 we can see that this result, while crude, yielded a substantially
higher peak at the 1.625 position for the fit line. While by no means definitive, it is
evidence against this modified structure being partially form VI.
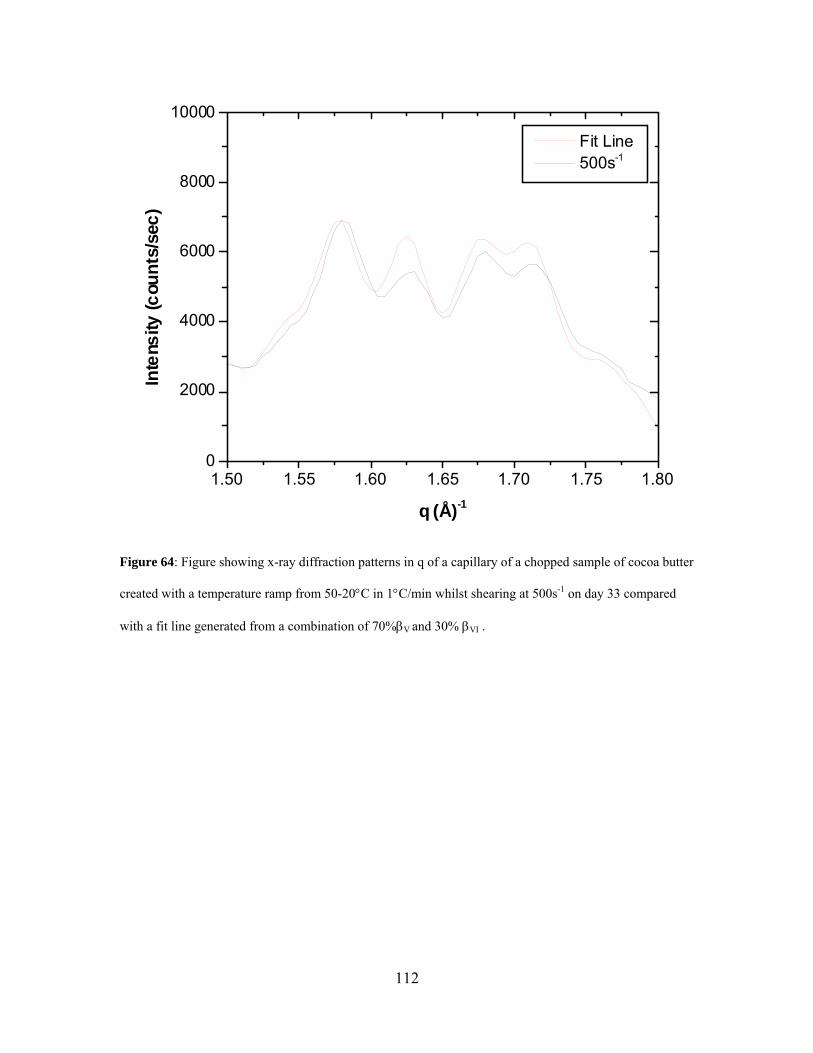
112
1.50 1.55 1.60 1.65 1.70 1.75 1.800
2000
4000
6000
8000
10000
Inte
nsity
(cou
nts/
sec)
q (Å)-1
Fit Line 500s-1
Figure 64: Figure showing x-ray diffraction patterns in q of a capillary of a chopped sample of cocoa butter
created with a temperature ramp from 50-20°C in 1°C/min whilst shearing at 500s-1 on day 33 compared
with a fit line generated from a combination of 70%βV and 30% βVI .
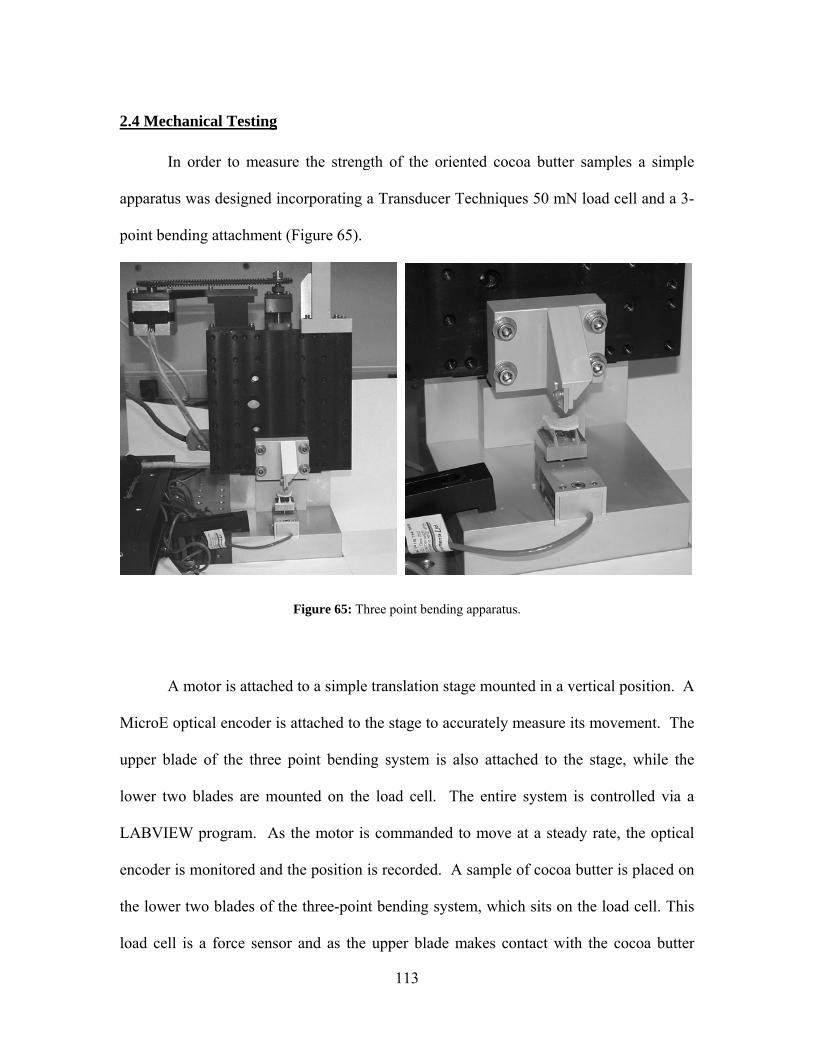
113
2.4 Mechanical Testing
In order to measure the strength of the oriented cocoa butter samples a simple
apparatus was designed incorporating a Transducer Techniques 50 mN load cell and a 3-
point bending attachment (Figure 65).
Figure 65: Three point bending apparatus.
A motor is attached to a simple translation stage mounted in a vertical position. A
MicroE optical encoder is attached to the stage to accurately measure its movement. The
upper blade of the three point bending system is also attached to the stage, while the
lower two blades are mounted on the load cell. The entire system is controlled via a
LABVIEW program. As the motor is commanded to move at a steady rate, the optical
encoder is monitored and the position is recorded. A sample of cocoa butter is placed on
the lower two blades of the three-point bending system, which sits on the load cell. This
load cell is a force sensor and as the upper blade makes contact with the cocoa butter
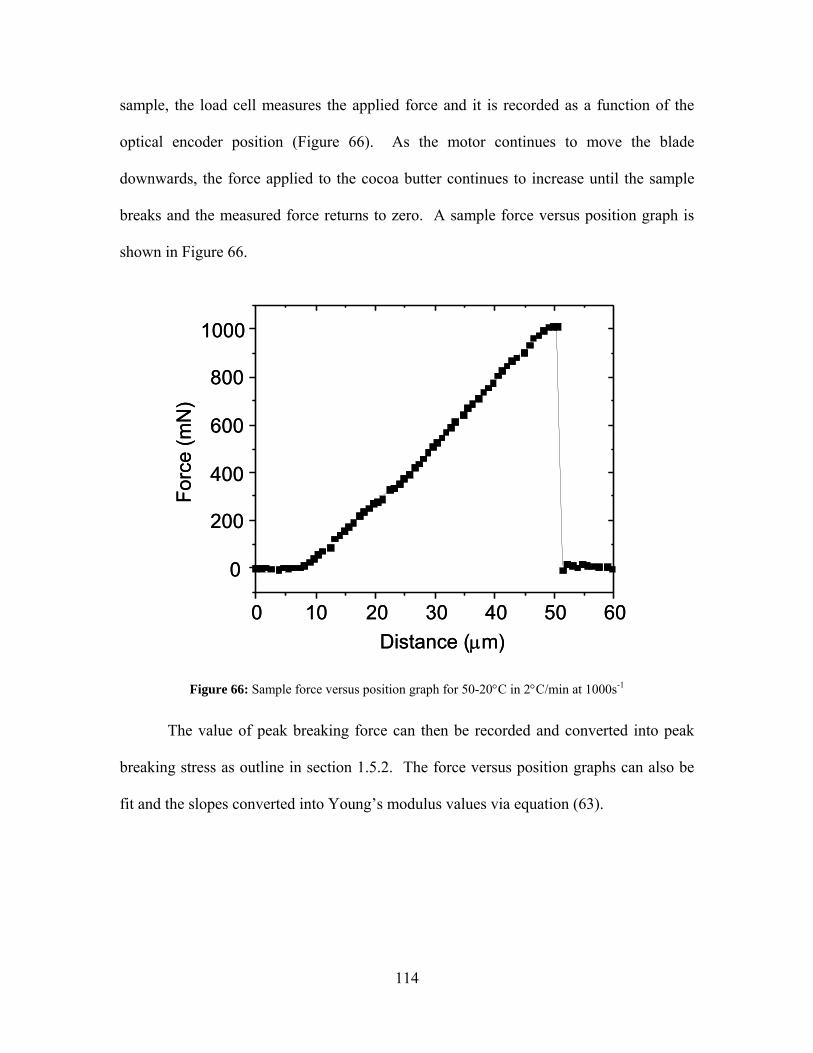
114
sample, the load cell measures the applied force and it is recorded as a function of the
optical encoder position (Figure 66). As the motor continues to move the blade
downwards, the force applied to the cocoa butter continues to increase until the sample
breaks and the measured force returns to zero. A sample force versus position graph is
shown in Figure 66.
0 10 20 30 40 50 60
0
200
400
600
800
1000
Forc
e (m
N)
Distance (µm)0 10 20 30 40 50 60
0
200
400
600
800
1000
Forc
e (m
N)
Distance (µm)
Figure 66: Sample force versus position graph for 50-20°C in 2°C/min at 1000s-1
The value of peak breaking force can then be recorded and converted into peak
breaking stress as outline in section 1.5.2. The force versus position graphs can also be
fit and the slopes converted into Young’s modulus values via equation (63).
115
2.4.1 Mechanical Testing Data
Graphs of peak breaking stress versus shear rate for the 9 different temperature
profiles are shown in Figure 67 to Figure 69. The results are very strikingly similar to
those seen in section 2.2 for the DSC values.
For those samples which exhibited a transition in melting temperature between
360 and 500s-1 (50-16°C in 1°C/min and 2°C/min; 50-18°C in 1°C/min; 50-20°C in
0.5°C/min, 1°C/min and 2°C/min) we can see that there is also a transition in peak
breaking stress with the shear rates above the transition showing an increase in breaking
stress.
Figure 67 is perhaps the least clear of the three end point temperatures reflecting
the fact that there is a higher solid fat content (SFC) in the samples at the lowest
temperature of 16°C and hence the peak breaking stress is already higher than for the
other two samples. Despite this we can see that there is an increase for the 1 and 2°C/min
samples with shear rate, but not for the 0.5°C/min sample. Any increase seen there is
within the range of error.
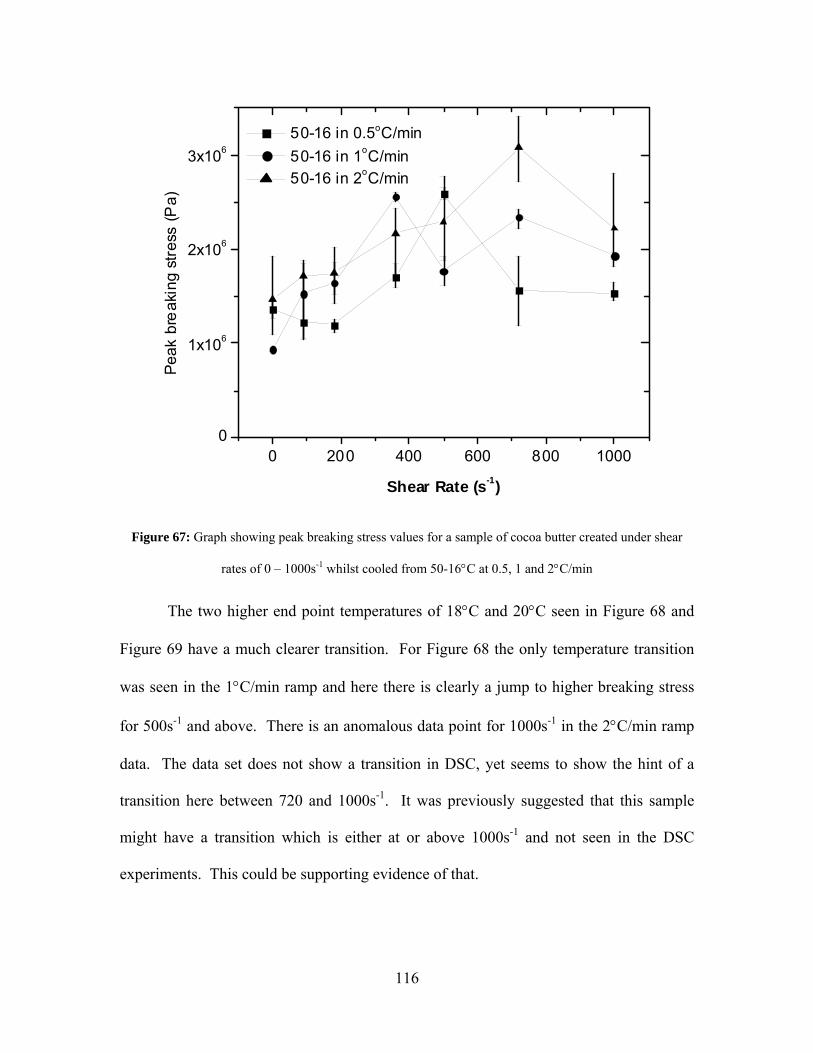
116
0 200 400 600 800 10000
1x10⁶
2x10⁶
3x10⁶ 50-16 in 0.5oC/min 50-16 in 1oC/min 50-16 in 2oC/min
Peak
bre
akin
g st
ress
(Pa)
Shear Rate (s-1)
Figure 67: Graph showing peak breaking stress values for a sample of cocoa butter created under shear
rates of 0 – 1000s-1 whilst cooled from 50-16°C at 0.5, 1 and 2°C/min
The two higher end point temperatures of 18°C and 20°C seen in Figure 68 and
Figure 69 have a much clearer transition. For Figure 68 the only temperature transition
was seen in the 1°C/min ramp and here there is clearly a jump to higher breaking stress
for 500s-1 and above. There is an anomalous data point for 1000s-1 in the 2°C/min ramp
data. The data set does not show a transition in DSC, yet seems to show the hint of a
transition here between 720 and 1000s-1. It was previously suggested that this sample
might have a transition which is either at or above 1000s-1 and not seen in the DSC
experiments. This could be supporting evidence of that.
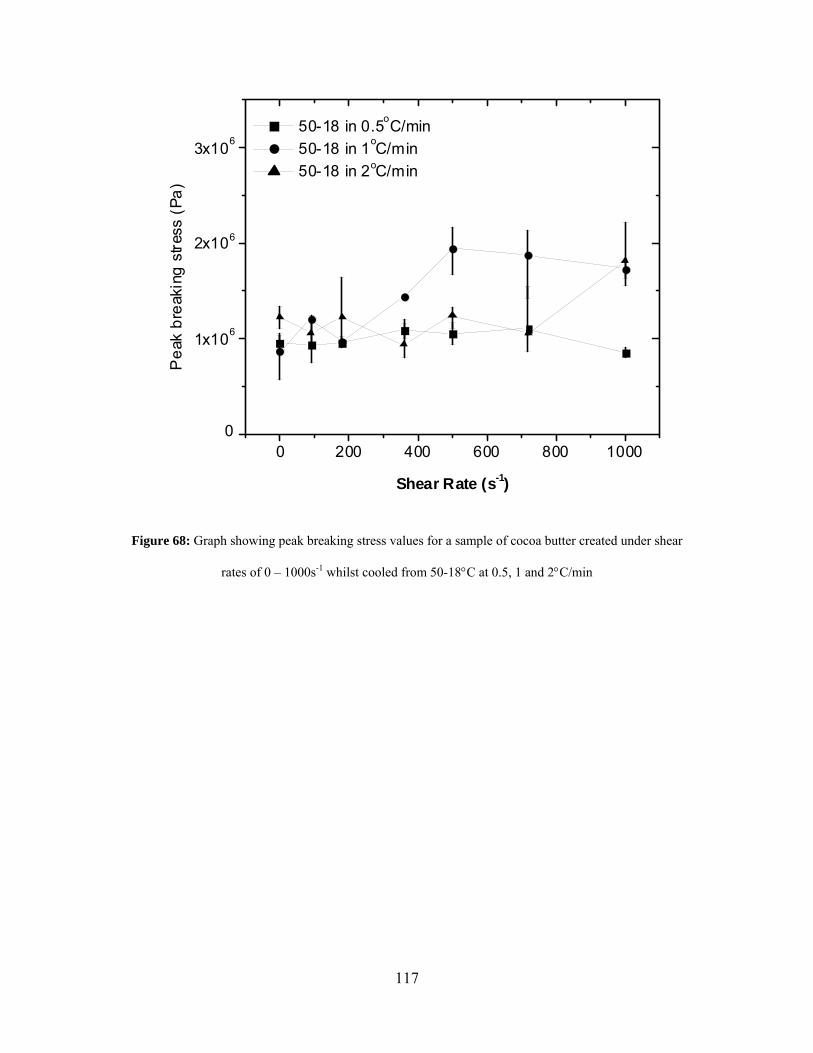
117
0 200 400 600 800 10000
1x10⁶
2x10⁶
3x10⁶ 50-18 in 0.5oC/min 50-18 in 1oC/min 50-18 in 2oC/min
Pea
k br
eaki
ng s
tress
(Pa)
Shear Rate (s-1)
Figure 68: Graph showing peak breaking stress values for a sample of cocoa butter created under shear
rates of 0 – 1000s-1 whilst cooled from 50-18°C at 0.5, 1 and 2°C/min
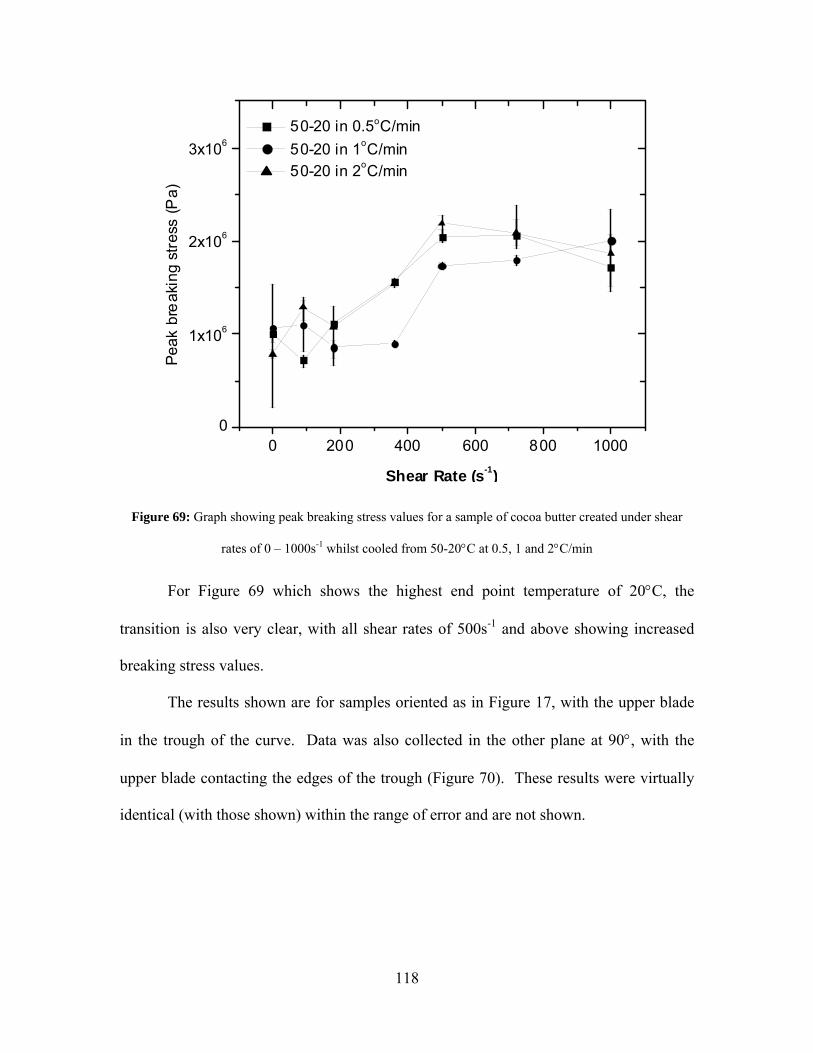
118
0 200 400 600 800 10000
1x10⁶
2x10⁶
3x10⁶ 50-20 in 0.5oC/min 50-20 in 1oC/min 50-20 in 2oC/min
Peak
bre
akin
g st
ress
(Pa)
Shear Rate (s-1)
Figure 69: Graph showing peak breaking stress values for a sample of cocoa butter created under shear
rates of 0 – 1000s-1 whilst cooled from 50-20°C at 0.5, 1 and 2°C/min
For Figure 69 which shows the highest end point temperature of 20°C, the
transition is also very clear, with all shear rates of 500s-1 and above showing increased
breaking stress values.
The results shown are for samples oriented as in Figure 17, with the upper blade
in the trough of the curve. Data was also collected in the other plane at 90°, with the
upper blade contacting the edges of the trough (Figure 70). These results were virtually
identical (with those shown) within the range of error and are not shown.
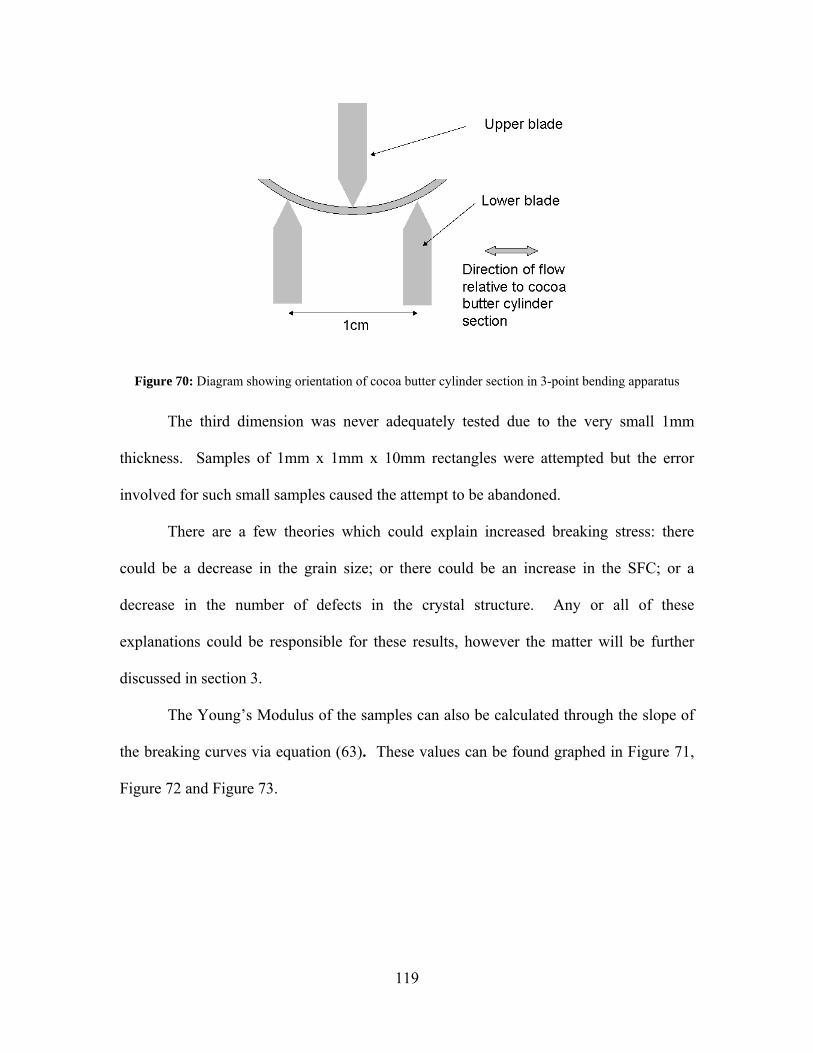
119
Figure 70: Diagram showing orientation of cocoa butter cylinder section in 3-point bending apparatus
The third dimension was never adequately tested due to the very small 1mm
thickness. Samples of 1mm x 1mm x 10mm rectangles were attempted but the error
involved for such small samples caused the attempt to be abandoned.
There are a few theories which could explain increased breaking stress: there
could be a decrease in the grain size; or there could be an increase in the SFC; or a
decrease in the number of defects in the crystal structure. Any or all of these
explanations could be responsible for these results, however the matter will be further
discussed in section 3.
The Young’s Modulus of the samples can also be calculated through the slope of
the breaking curves via equation (63). These values can be found graphed in Figure 71,
Figure 72 and Figure 73.
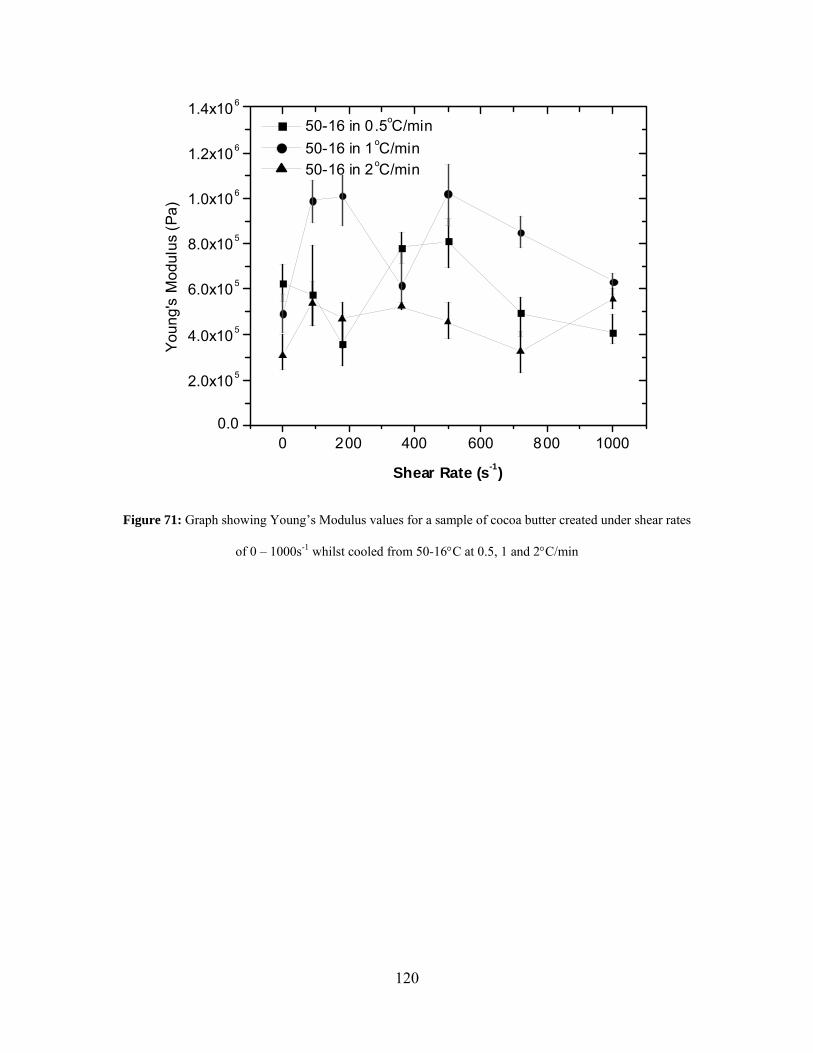
120
0 200 400 600 800 10000.0
2.0x10⁵
4.0x10⁵
6.0x10⁵
8.0x10⁵
1.0x10⁶
1.2x10⁶
1.4x10⁶
50-16 in 0.5oC/min 50-16 in 1oC/min 50-16 in 2oC/min
Youn
g's
Mod
ulus
(Pa)
Shear Rate (s-1)
Figure 71: Graph showing Young’s Modulus values for a sample of cocoa butter created under shear rates
of 0 – 1000s-1 whilst cooled from 50-16°C at 0.5, 1 and 2°C/min
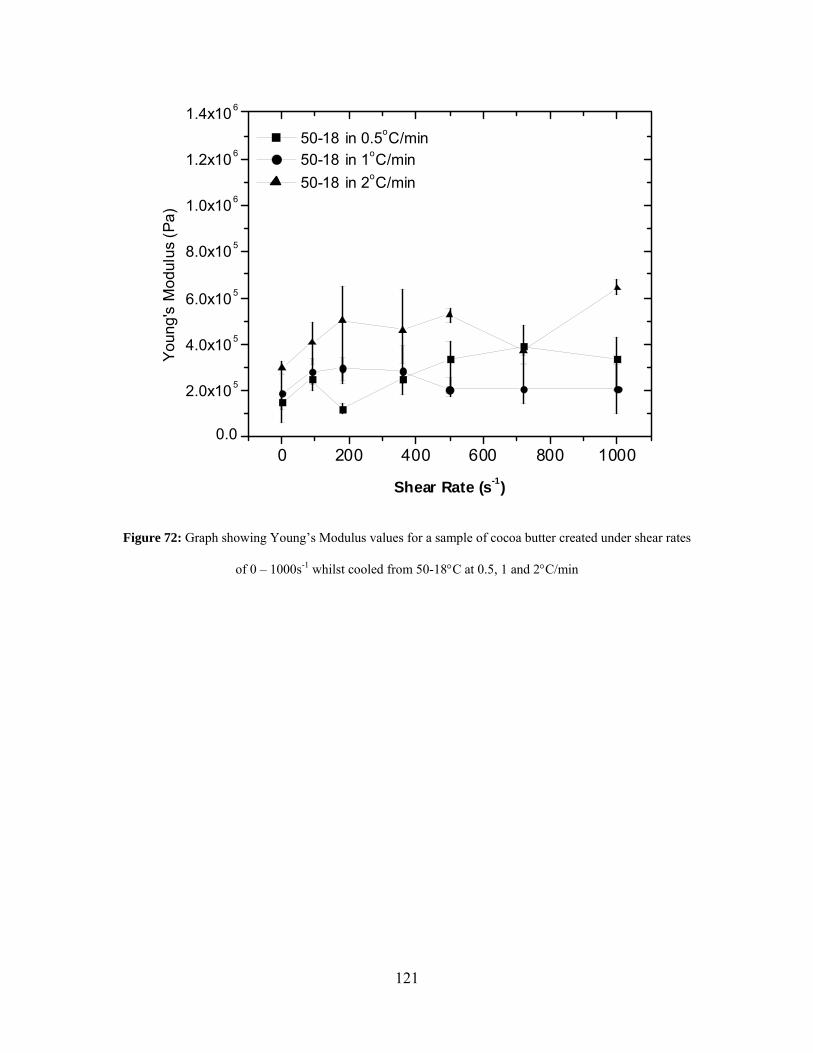
121
0 200 400 600 800 10000.0
2.0x10⁵
4.0x10⁵
6.0x10⁵
8.0x10⁵
1.0x10⁶
1.2x10⁶
1.4x10⁶
50-18 in 0.5oC/min 50-18 in 1oC/min 50-18 in 2oC/min
Youn
g's
Mod
ulus
(Pa)
Shear Rate (s-1)
Figure 72: Graph showing Young’s Modulus values for a sample of cocoa butter created under shear rates
of 0 – 1000s-1 whilst cooled from 50-18°C at 0.5, 1 and 2°C/min
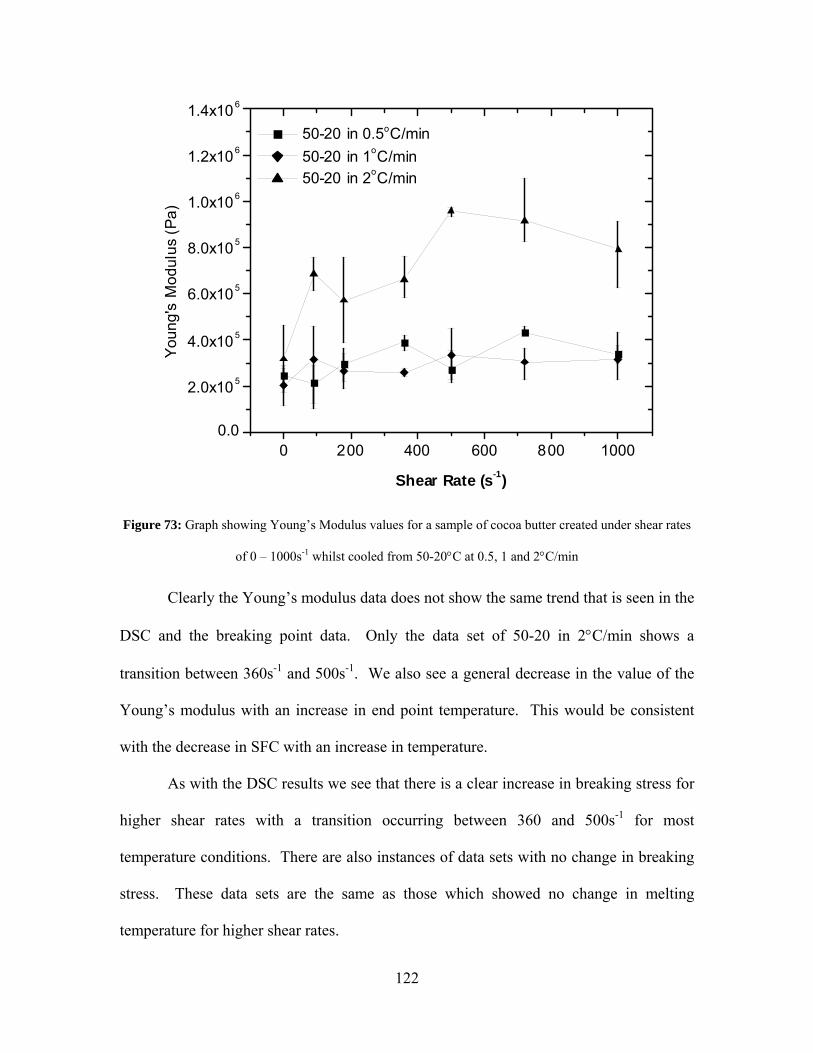
122
0 200 400 600 800 10000.0
2.0x10⁵
4.0x10⁵
6.0x10⁵
8.0x10⁵
1.0x10⁶
1.2x10⁶
1.4x10⁶
50-20 in 0.5oC/min 50-20 in 1oC/min 50-20 in 2oC/min
Youn
g's
Mod
ulus
(Pa)
Shear Rate (s-1)
Figure 73: Graph showing Young’s Modulus values for a sample of cocoa butter created under shear rates
of 0 – 1000s-1 whilst cooled from 50-20°C at 0.5, 1 and 2°C/min
Clearly the Young’s modulus data does not show the same trend that is seen in the
DSC and the breaking point data. Only the data set of 50-20 in 2°C/min shows a
transition between 360s-1 and 500s-1. We also see a general decrease in the value of the
Young’s modulus with an increase in end point temperature. This would be consistent
with the decrease in SFC with an increase in temperature.
As with the DSC results we see that there is a clear increase in breaking stress for
higher shear rates with a transition occurring between 360 and 500s-1 for most
temperature conditions. There are also instances of data sets with no change in breaking
stress. These data sets are the same as those which showed no change in melting
temperature for higher shear rates.
123
3.0 Discussion
Many different types of experiments were carried out to test the physical
properties of cocoa butter, resulting in large quantities of information to be interpreted.
In order to simplify the discussion of the results of these different experiments the
20°C end point case can be discussed first. This temperature should result in the slowest
kinetics of transformation with the 18 and 16°C endpoints being much faster, more
chaotic and less clear in their interpretation.
Cocoa butter was sheared in the specially designed split couette cell to allow for
the extraction of fully crystallized sheared samples. As the sheared cocoa butter samples
were being created viscosity data was collected which can be interpreted to give the time
of α and βV crystallite formation. In this way the effect of shear on the α-βV transition
time can be fully examined for a large number of shear rates, temperatures and cooling
rates. This allows for further examination of the previously reported shear acceleration of
the βV transition.
The viscosity data for the 50-20°C at 0.5°C/min, 1°C/min and 2°C/min ramps all
show a more complicated relationship between shear and α-βV crystallization time than a
mere shear acceleration effect. In fact, a general decrease in crystallization time is seen
only until 500s-1 when the crystallization time begins to increase again due to viscous
heating.
The melting temperature of the material is also very important and is used in
determining the crystal structure and composition of a material, with clear melting ranges
being given for different crystal forms. Results of this investigation can help us to see if
124
orientation affects the melting properties or the application of shear alone affects the
melting properties.
From the melting (DSC) data there is an obvious change in melting temperature
between the 360s-1 and 500s-1 shear rates. Above 500s-1 there is an increase in the day 0
melting temperature by ~ 4°C and a decrease in the day 28 melting temperature by ~ 2°C.
While the lower shear rates contain a mixture of forms and thus have a lower melting
point, above the transition the melting temperature is immediately elevated. More
remarkable however is that this elevated temperature is not consistent with a form V
polymorph. After a period of 28 days this temperature has still not moved significantly
and remains at least 2°C lower than a typical form V polymorph melting temperature in
this cocoa butter.
Taking this information about the melting temperature and using it to evaluate the
rheometry data we don’t see any distinct change in the viscosity data above 500s-1 to
account for such a large change in melting temperature. That is, there is no delineation
between the 0-360s-1 data set and the 500-1000s-1 data set for any of the cooling ramps.
The creation of sheared samples which can be extracted intact from the apparatus
also allows for examination of the previously reported shear alignment/orientation of the
cocoa butter crystallites. Once the samples are extracted, x-ray diffraction allows for the
degree of orientation associated with each shear, temperature and cooling rate point to be
mapped out, allowing for further conclusions to be drawn about the conditions required
for shear induced alignment to occur.
125
The orientation data shows orientation occurring at 360s-1 and declining to a
plateau for the 500-1000 s-1 shear rates in to 50-20°C samples. Clearly this orientation
plateau coincides with the change in melting temperatures.
X-ray diffraction can also be used to examine any structural changes brought
about by shear or shear induced orientation. X-ray peak positions can be used to identify
the different crystal forms and small changes in position and intensity of these peaks can
show changes in composition and fractionation.
X-ray structure examination of two samples on either side of the transition (a
360s-1 sample and a 500s-1 samples for 50-20°C in 1°C/min) reveal obvious differences
yet show them to both be of the β ‘family’.
A comparison of the x-ray peak positions of the 500s-1 and a high resolution form
VI pattern show remarkable similarities to a transition to a form VI structure. i.e. a
strengthening at ~1.55, 1.6, 1.65 and 1.7 Å, along with a weakening at ~ 1.575, 1.675 and
1.725 Å. While this can be considered as evidence for the 500s-1 sample containing some
form VI, we know that this structure would have an even higher melting temperature than
a form V structure, rather than the lower one observed.
It is true, however, that small changes in chemical composition of the crystallites
could also be responsible for the changes in peak intensity. High resolution x-ray
diffraction studies of these samples would be required to more accurately assess the
differences between the two x-ray patterns
Finally the breaking strength of the shear samples can be examined with a three
point breaking apparatus. The breaking strength is dependent on temperature due to
changes in solid fat content associated with storage temperature (i.e, the lower the
126
temperature, the higher the breaking stress); however the dependency on shear and
orientation can also be examined. Grain size and domain size will also have an effect on
breaking strength and the link between shear, temperature and cooling rate on these
properties can also be examined.
A look at the peak breaking stress for the different shear and cooling rates shows
a transition point again between 360 and 500 s-1 to higher breaking values.
In order to understand the reason behind the “transition point” we can first
reconsider the properties of the high shear cocoa butter
As has been speculated previously, these DSC and X-ray results in particular
clearly indicate the presence of an alternate chemical composition and structure above the
transition point. These high shear samples have a lower 28 day melting temperature, yet
an apparent contradictory mixture of forms V and VI, as well as elevated breaking stress
values.
To explain this, we can consider the process occurring during crystallization.
Firstly we can say that under static conditions large α crystallites will form with a small
number of nucleation sites. This has been observed numerous times through
microscopy[44]. Under static conditions, as the material cools, certain TAGs will
selectively crystallize first and then be locked away from the crystallization process, thus
changing the chemical composition of the remaining melt. This will create an ‘onion’
effect where the chemical composition of a crystallite will change radially.
Now, if we apply shear to the same system of α crystallizing cocoa butter, it will
limit the crystal size and increase the number of nucleation sites. It will also promote
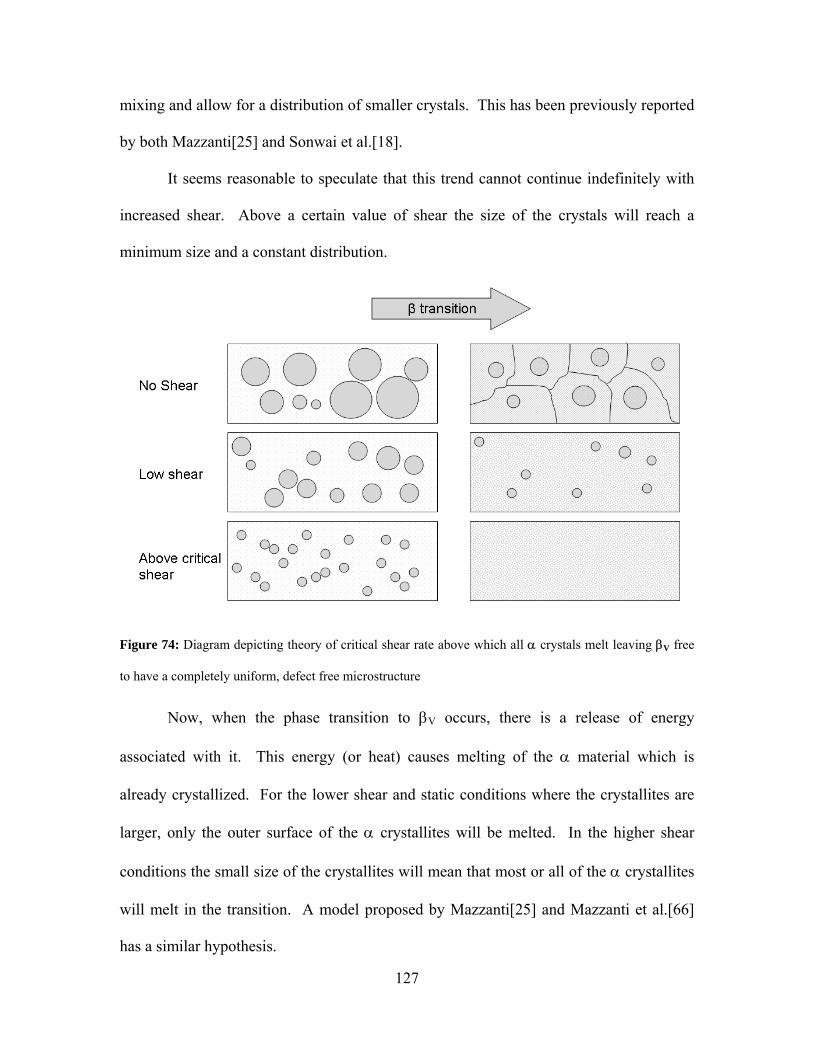
127
mixing and allow for a distribution of smaller crystals. This has been previously reported
by both Mazzanti[25] and Sonwai et al.[18].
It seems reasonable to speculate that this trend cannot continue indefinitely with
increased shear. Above a certain value of shear the size of the crystals will reach a
minimum size and a constant distribution.
Figure 74: Diagram depicting theory of critical shear rate above which all α crystals melt leaving βV free
to have a completely uniform, defect free microstructure
Now, when the phase transition to βV occurs, there is a release of energy
associated with it. This energy (or heat) causes melting of the α material which is
already crystallized. For the lower shear and static conditions where the crystallites are
larger, only the outer surface of the α crystallites will be melted. In the higher shear
conditions the small size of the crystallites will mean that most or all of the α crystallites
will melt in the transition. A model proposed by Mazzanti[25] and Mazzanti et al.[66]
has a similar hypothesis.
128
What this means for the βV crystallization is that above a certain critical shear
rate, the α crystallites will be small enough that the release of heat energy at the βV
transition will be enough to completely melt all of the α material. This would mean that
at the point of initial βV crystallization, form V has access to all of the material which
would normally have been locked away in α crystallites. That is, above the critical shear
rate, TAGs previously inaccessible have now become available for crystallization and the
degree of mixing due to shear allows for βV crystallization to occur selectively, i.e., the
crystallization process can select the TAGs most favourable for crystallization. This
crystallization process could then result in a βV form which is composed of TAGs of a
lower melting temperature.
The lack of residual α in this structure as well as the larger number of nucleation
sites caused by increased mixing due to shear would allow for a more uniform network of
crystals to form from the beginning, without defects caused by α crystallites which would
later transform into βV crystals. This uniform network of small crystals will then result in
a structure of higher breaking stress[86-88].
An examination of the x-ray peak widths would be able to yield information about
the coherence length of the samples. If the higher shear structures did indeed contain
fewer defects then the peak widths would be narrower in q. Unfortunately the resolution
of the in-house setup is not high enough to allow for such small differences to be
apparent. Data found in Mazzanti[25] (Figure 75) acquired with an x-ray accessible
shear cell at a synchrotron facility and with much higher resolution does show a decrease
in peak width. High resolution studies of the samples would be very informative both for
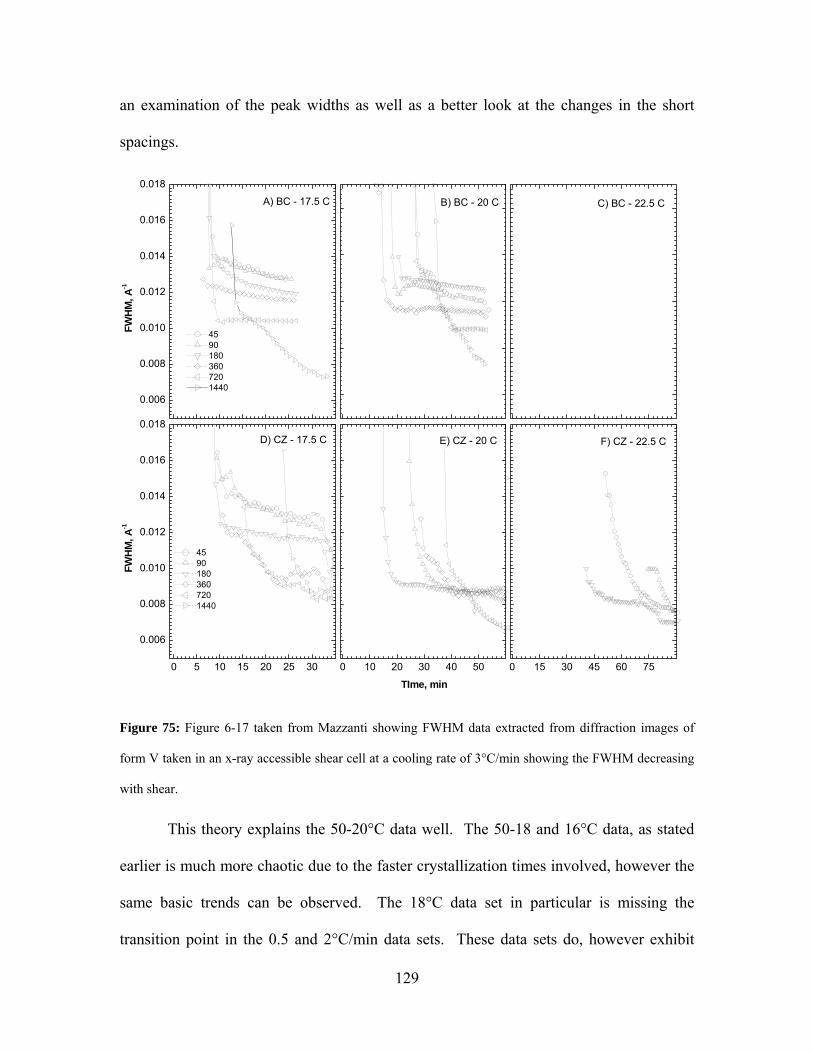
129
an examination of the peak widths as well as a better look at the changes in the short
spacings.
0 5 10 15 20 25 30
0.006
0.008
0.010
0.012
0.014
0.016
0.018
0 10 20 30 40 50 0 15 30 45 60 75
0.006
0.008
0.010
0.012
0.014
0.016
0.018
45901803607201440
FW
HM
, A-1
D) CZ - 17.5 C
TIme, min
E) CZ - 20 C
F) CZ - 22.5 C
45901803607201440
FW
HM
, A-1
A) BC - 17.5 C
B) BC - 20 C
C) BC - 22.5 C
Figure 75: Figure 6-17 taken from Mazzanti showing FWHM data extracted from diffraction images of
form V taken in an x-ray accessible shear cell at a cooling rate of 3°C/min showing the FWHM decreasing
with shear.
This theory explains the 50-20°C data well. The 50-18 and 16°C data, as stated
earlier is much more chaotic due to the faster crystallization times involved, however the
same basic trends can be observed. The 18°C data set in particular is missing the
transition point in the 0.5 and 2°C/min data sets. These data sets do, however exhibit
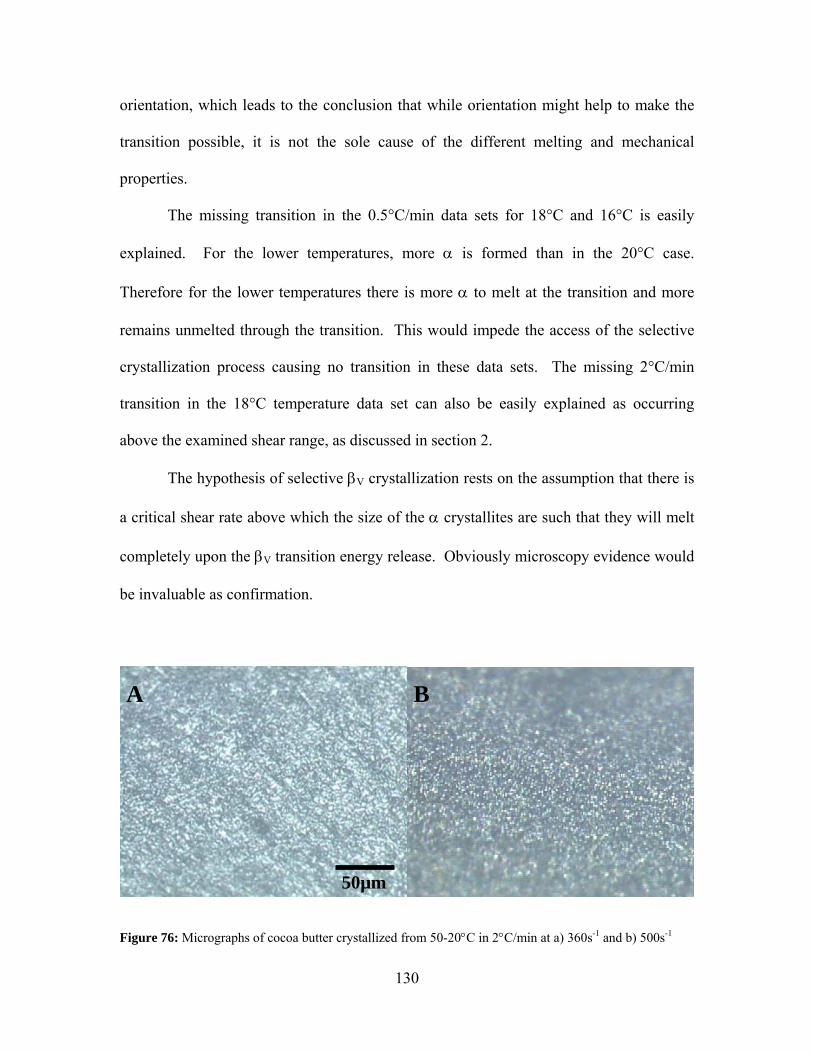
130
orientation, which leads to the conclusion that while orientation might help to make the
transition possible, it is not the sole cause of the different melting and mechanical
properties.
The missing transition in the 0.5°C/min data sets for 18°C and 16°C is easily
explained. For the lower temperatures, more α is formed than in the 20°C case.
Therefore for the lower temperatures there is more α to melt at the transition and more
remains unmelted through the transition. This would impede the access of the selective
crystallization process causing no transition in these data sets. The missing 2°C/min
transition in the 18°C temperature data set can also be easily explained as occurring
above the examined shear range, as discussed in section 2.
The hypothesis of selective βV crystallization rests on the assumption that there is
a critical shear rate above which the size of the α crystallites are such that they will melt
completely upon the βV transition energy release. Obviously microscopy evidence would
be invaluable as confirmation.
Figure 76: Micrographs of cocoa butter crystallized from 50-20°C in 2°C/min at a) 360s-1 and b) 500s-1
A
50µm
B
131
Figure 76 shows micrographs of the cocoa butter samples from either side of the
transition. The images are of a broken edge of the sample under 10x magnification. The
poor quality of the images is due to the uneven nature of the edge, but it was felt that any
attempt to create a smooth edge would result in destruction of the crystallites. Even so
we can see that the crystal sizes are very similar with the 500s-1 sample appearing slightly
smaller.
Microscopy can also be done to confirm the decrease in particle size proposed,
however a change in the method for sample creation may yield a sample more suitable
for microscopy. A microscopy accessible shear cell would be ideal where the
crystallization process could be viewed under shear and the melting of the crystallites in
the βV transition observed and confirmed. Such a shear cell is described in Sonwai et
al.[18] which is commercially available. Experiments described therein do show a
reduction in particle size with shear rate, however data was taken for a fast cooling rate
and only up to 500s-1. An examination of shear rates on either side of a transition point
shearing constantly would be invaluable for theory confirmation.
Chemical analysis may also be attempted with the ‘shear changed’ samples. A
separation of the crystallites from the liquid fat might be attempted for the lower SFC
samples. A study of a higher temperature such as 22°C might yield a slow enough
crystallization process to make that possible.
The aging of the ‘shear changed’ samples can also shed light on its properties.
Samples which had been stored for two years were examined to assess the permanence of
the shear induced changes. Differential scanning calorimetry revealed a significant
melting temperature jump as compared to the day 28 values. For a sample of 50-20°C in
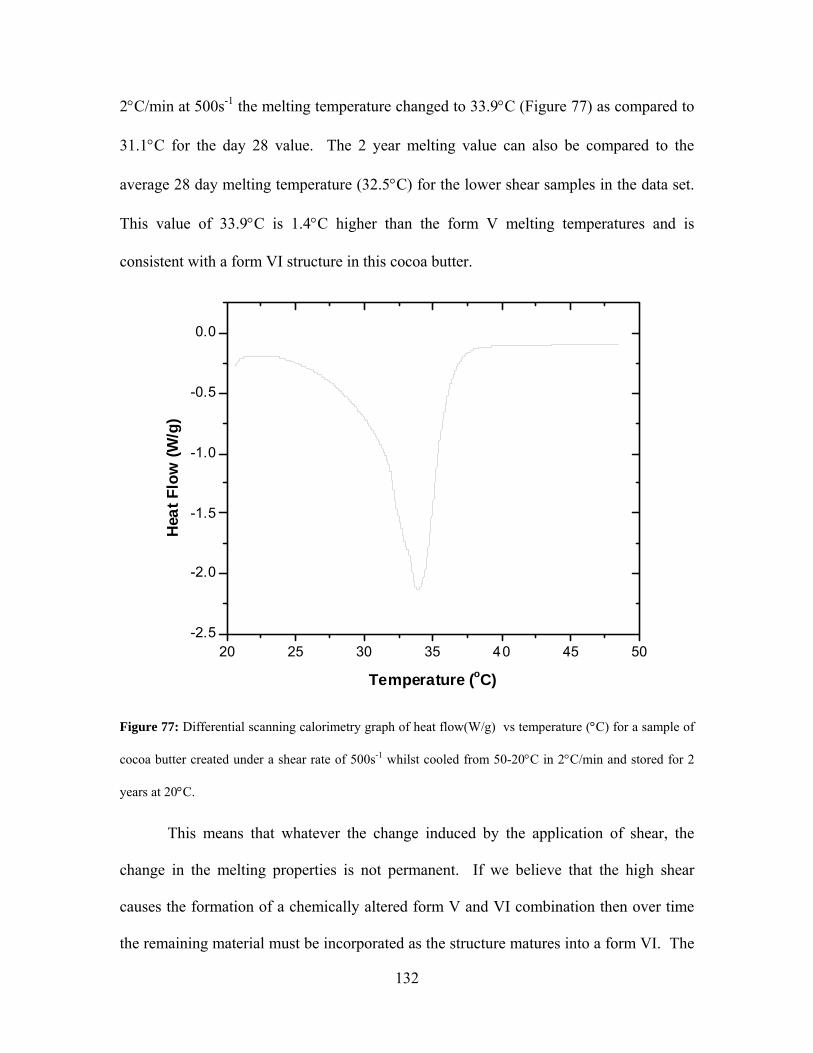
132
2°C/min at 500s-1 the melting temperature changed to 33.9°C (Figure 77) as compared to
31.1°C for the day 28 value. The 2 year melting value can also be compared to the
average 28 day melting temperature (32.5°C) for the lower shear samples in the data set.
This value of 33.9°C is 1.4°C higher than the form V melting temperatures and is
consistent with a form VI structure in this cocoa butter.
20 25 30 35 40 45 50-2.5
-2.0
-1.5
-1.0
-0.5
0.0
Hea
t Flo
w (W
/g)
Temperature (oC)
Figure 77: Differential scanning calorimetry graph of heat flow(W/g) vs temperature (°C) for a sample of
cocoa butter created under a shear rate of 500s-1 whilst cooled from 50-20°C in 2°C/min and stored for 2
years at 20°C.
This means that whatever the change induced by the application of shear, the
change in the melting properties is not permanent. If we believe that the high shear
causes the formation of a chemically altered form V and VI combination then over time
the remaining material must be incorporated as the structure matures into a form VI. The
133
solid fat content of the material would increase if that were the case. Thus a much longer
study following the aging of the ‘shear changed’ samples would allow for measurement
of SFC to help confirm the theory.
X-ray analysis of the two year old samples showed no change in orientation
showing that once created the aging of a sample into a form VI has no effect. X-ray
structure analysis was not done of an aged sample, but would also provide invaluable
information.
The mechanical testing of the aged sample also showed retention of the elevated
breaking stress in the ‘shear changed’ samples. This lends credence to the theory that
fewer defects and smaller grain cause the increase in breaking stress.
To conclude, the application of shear to cocoa butter during crystallization causes
acceleration of the α to βV transition time for any applied shear rate as well as preferred
orientation of crystallites above a certain shear rate. There is also a critical shear rate for
certain cooling conditions which results in the formation of a chemically altered βV
structure, exhibiting altered melting properties and enhanced breaking strength.
134
4.0 Conclusions
In this investigation of the changes in properties of cocoa butter due to the
application of shear, many interesting discoveries were made.
Viscosities of the cocoa butter samples under shear were recorded during sample
creation, resulting in a data set showing the influence of shear, temperature and cooling
rate on viscosity and crystallization time. Large jumps in viscosity were identified by
comparison with x-ray diffraction data as α and βV crystallization events. Comparison of
α – βV crystallization times for the nine different temperature profiles allowed for the
conclusion that over a shear range of 90 - 1000 s-1, there was no further appreciable shear
acceleration of the form V transformation for the 16 and 18°C temperatures and only a
slight increase up to 500s-1 for the 20°C temperature.
Sheared samples were also examined with differential scanning calorimetry.
Samples were examined for peak melting temperature on each of day 0, day 1, day 7 and
day 28. Six of the nine different temperature conditions examined yielded a critical shear
rate, above which the melting points of the samples were dramatically different than for
low shear and no shear samples. For the day 0 and day 1 samples, above 500s-1 the
melting temperatures were ~2°C higher than for 360s-1 and below. For the day 7 and day
28 samples, above 500s-1 the peak melting temperatures were ~2°C lower than for the
lower shear and no shear samples.
The orientation of sheared samples was also examined using x-ray diffraction. In
all of the nine temperature sets, orientation was present for shear rates of 360s-1 and
higher.
135
Breaking stress measurements were performed on sheared and non-sheared
samples. These tests showed results remarkable similar to those seen in the DSC tests,
with a critical shear rate existing in six of the nine temperature sets, above which an
increase in the breaking strength occurs.
Taking the DSC and mechanical evidence of a shear dependent transition in
samples properties, an examination of samples on either side of the critical shear rate was
done with x-ray diffraction yielding two distinct x-ray patterns of the βV family, leading
to the conclusion that the higher shear sample was of a different chemical composition.
We can speculate then that the application of high shear rates causes a change in
the crystallization of cocoa butter leading to selective crystallization and the formation of
a compositionally different form V crystal with fewer defects than its lower/no shear
counterparts. That is, there exists a shear transition point exists for some temperature
conditions above which a transformation into this chemically altered βV polymorph takes
place. This form has a stable melting temperature ~2°C lower than its lower shear
counterpart, a distinct x-ray fingerprint and enhanced breaking properties.
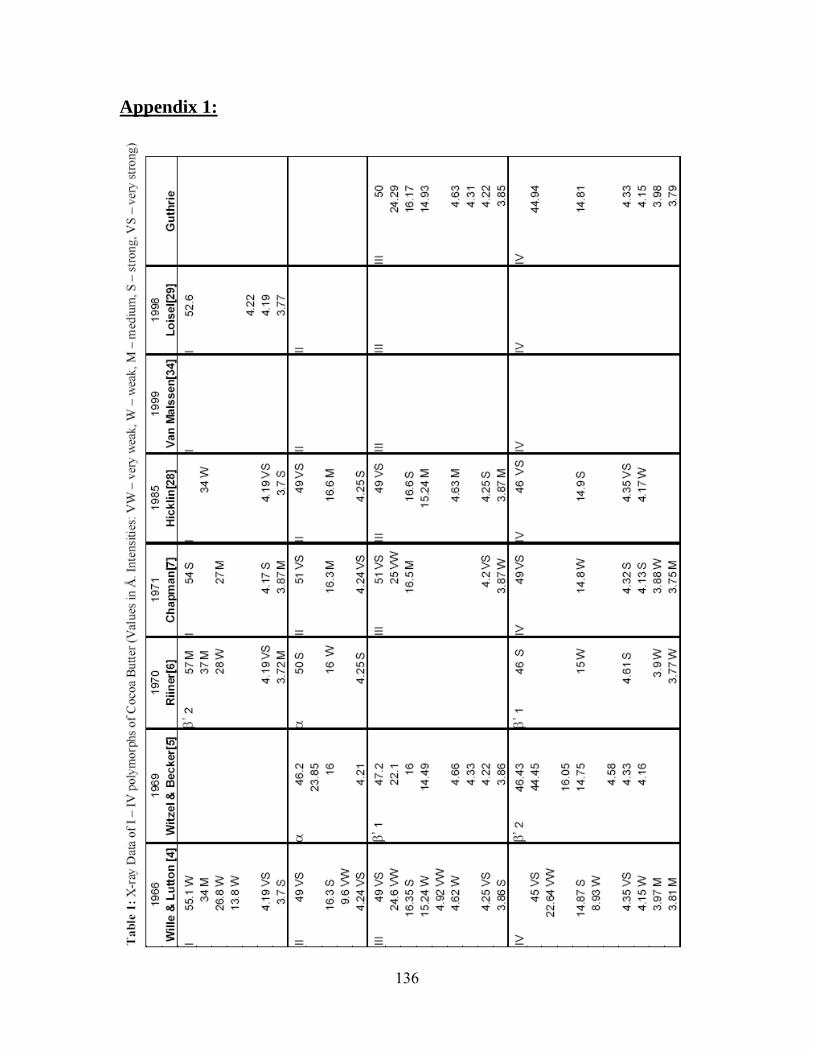
136
Appendix 1:
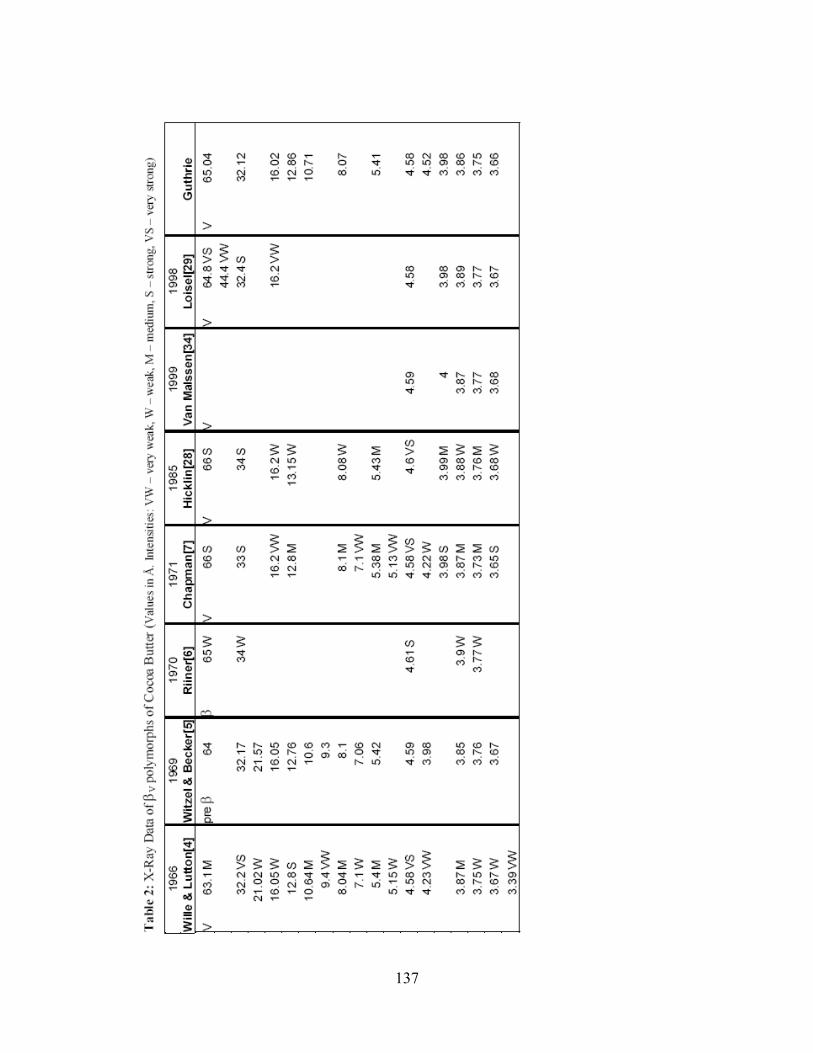
137
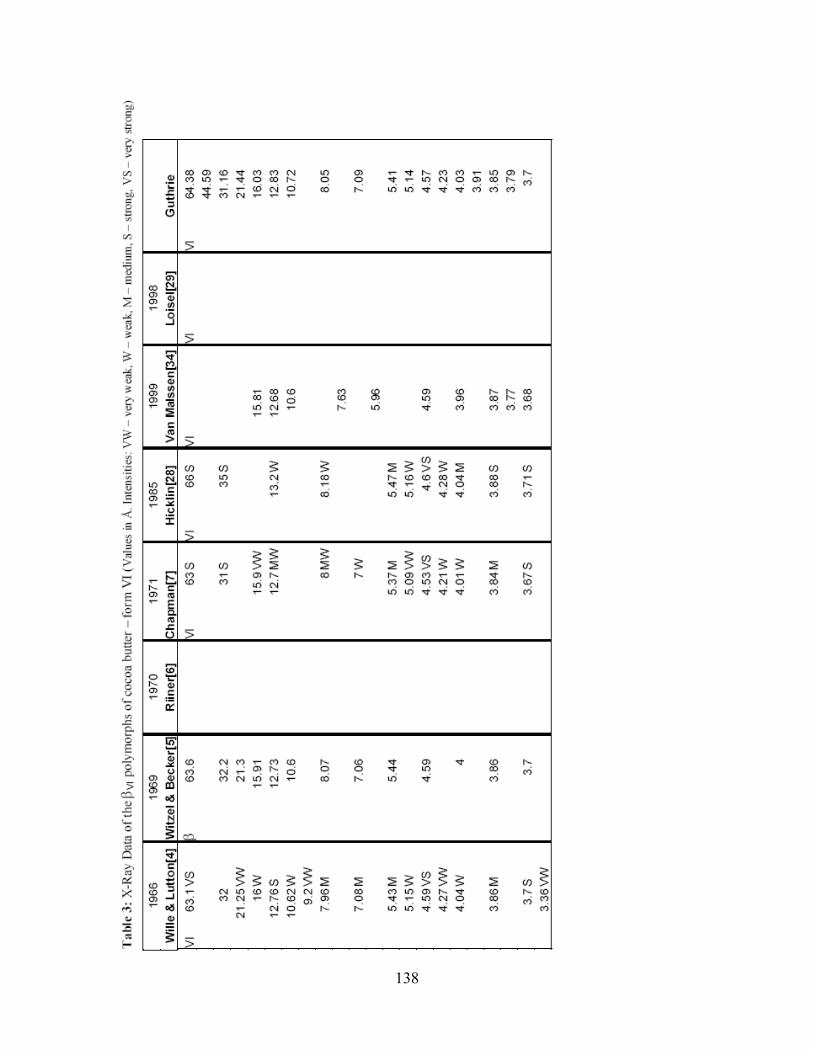
138
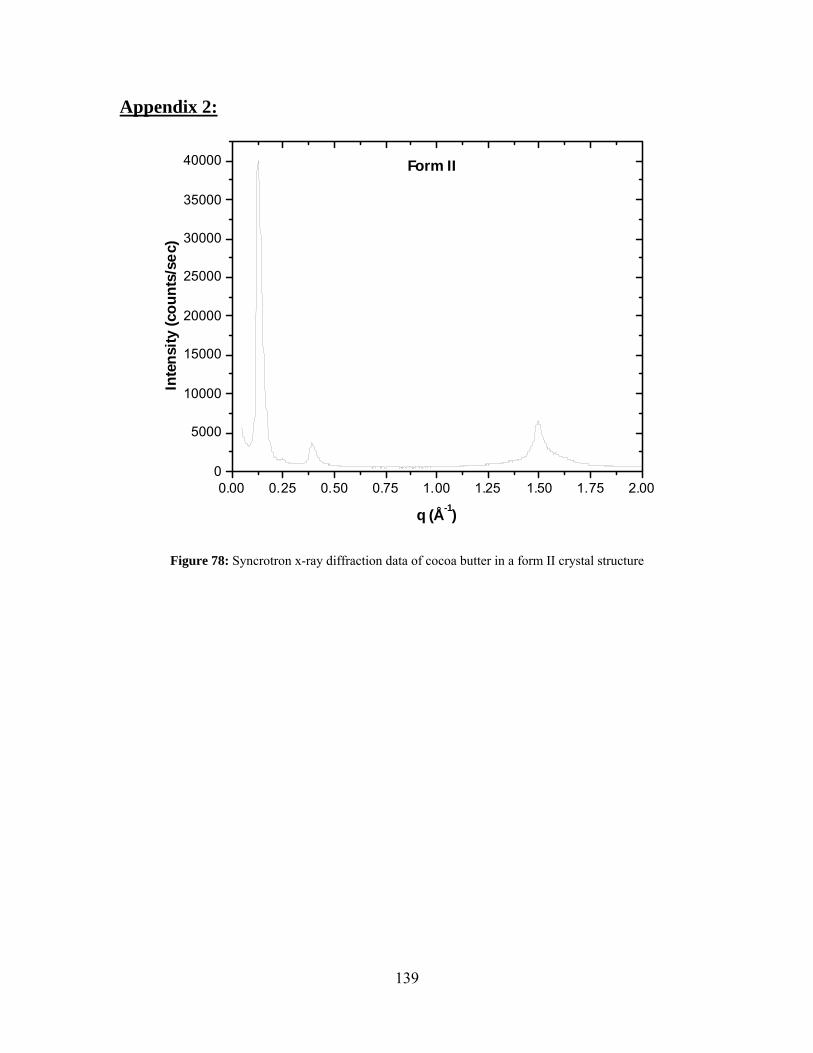
139
Appendix 2:
0.00 0.25 0.50 0.75 1.00 1.25 1.50 1.75 2.000
5000
10000
15000
20000
25000
30000
35000
40000 Form IIIn
tens
ity (c
ount
s/se
c)
q (Å-1)
Figure 78: Syncrotron x-ray diffraction data of cocoa butter in a form II crystal structure
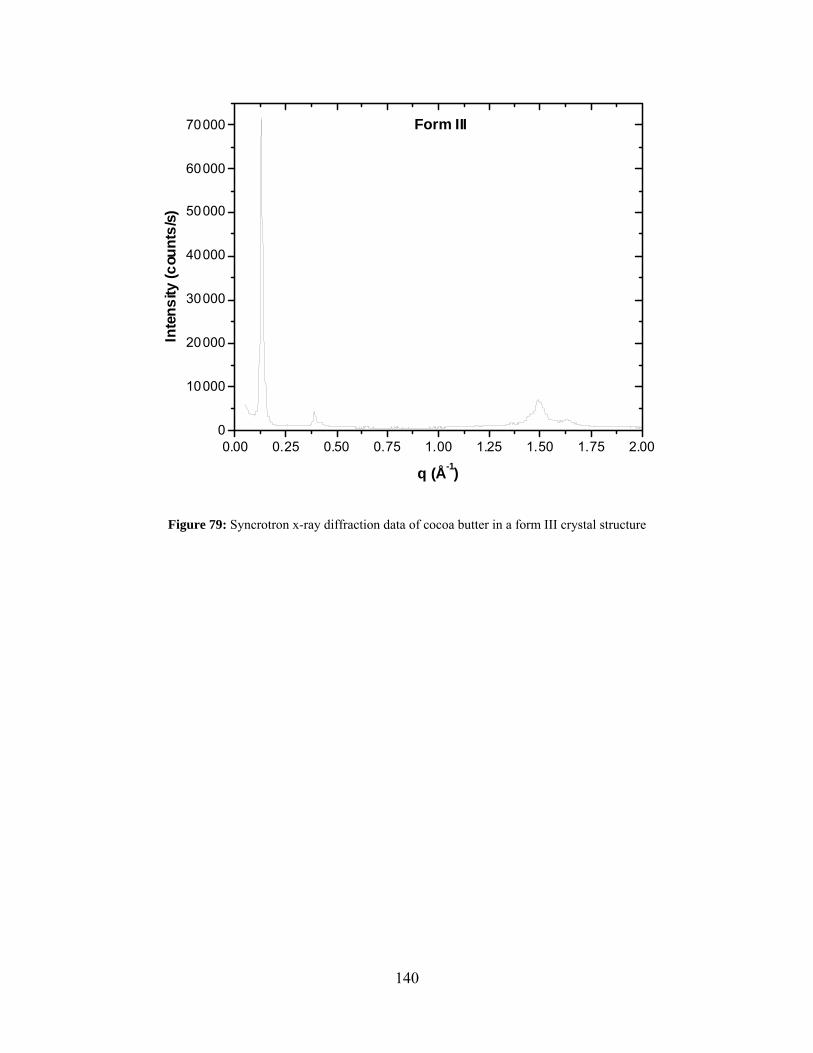
140
0.00 0.25 0.50 0.75 1.00 1.25 1.50 1.75 2.000
10000
20000
30000
40000
50000
60000
70000 Form III
Inte
nsity
(cou
nts/
s)
q (Å-1)
Figure 79: Syncrotron x-ray diffraction data of cocoa butter in a form III crystal structure
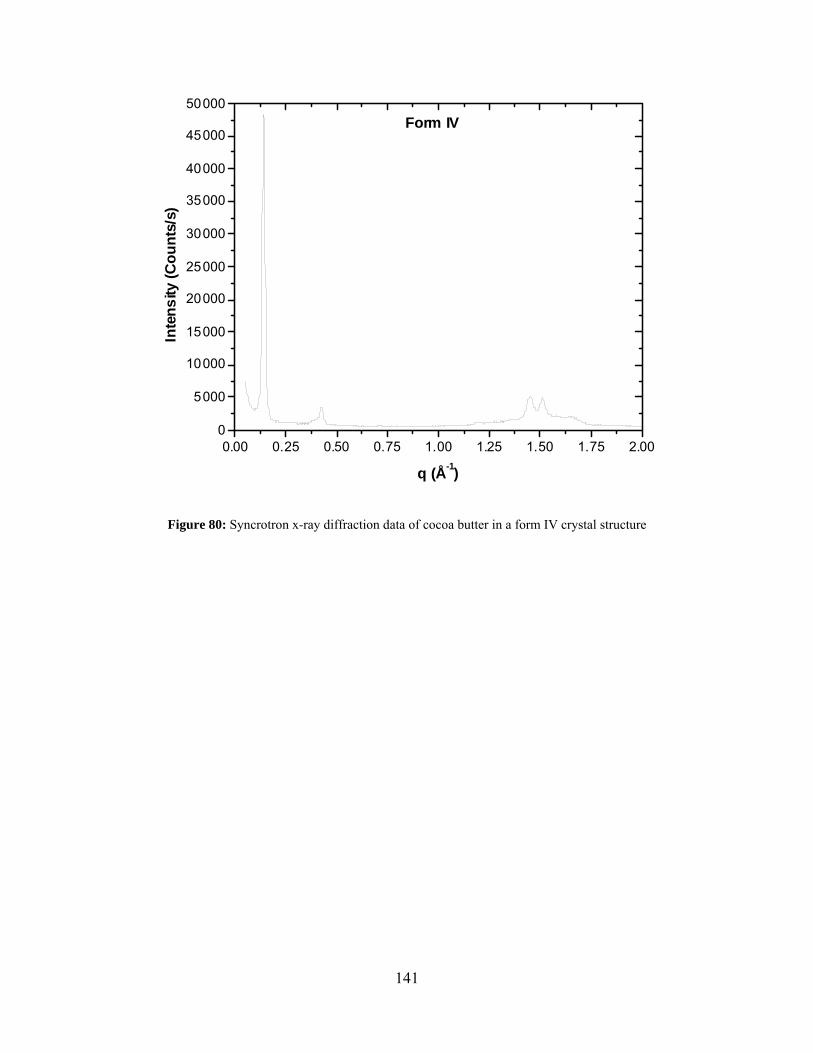
141
0.00 0.25 0.50 0.75 1.00 1.25 1.50 1.75 2.000
5000
10000
15000
20000
25000
30000
35000
40000
45000
50000Form IV
Inte
nsity
(Cou
nts/
s)
q (Å-1)
Figure 80: Syncrotron x-ray diffraction data of cocoa butter in a form IV crystal structure
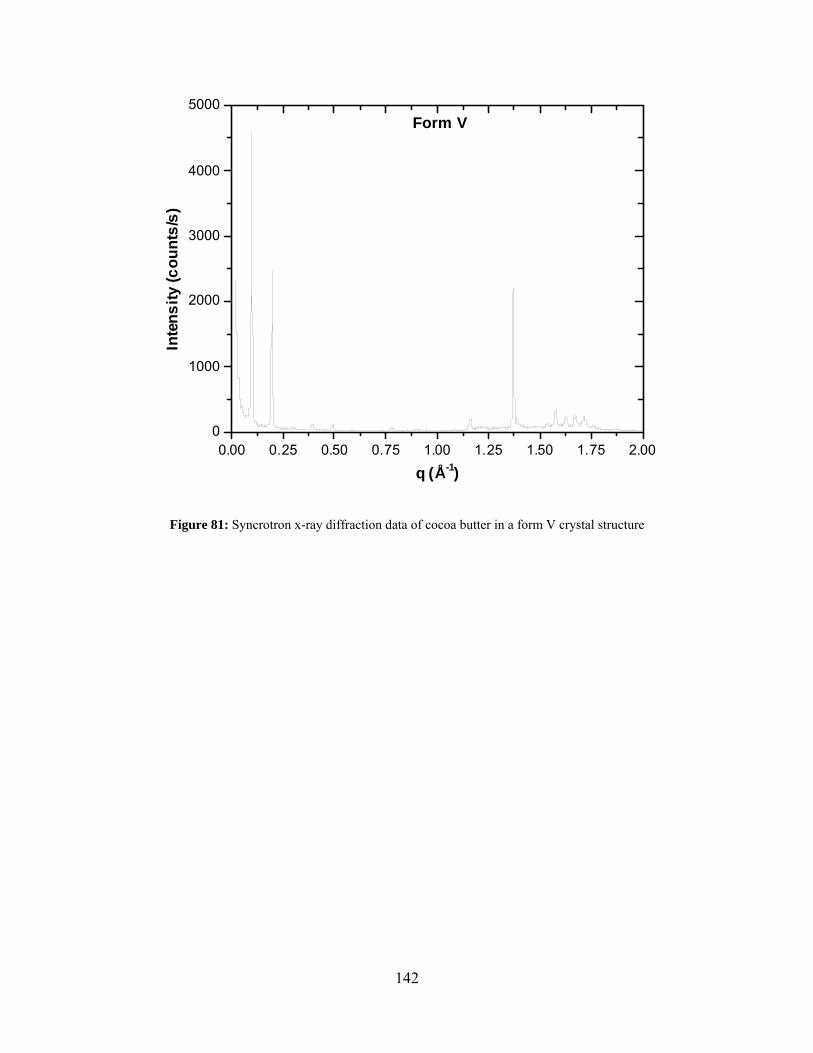
142
0.00 0.25 0.50 0.75 1.00 1.25 1.50 1.75 2.000
1000
2000
3000
4000
5000Form V
Inte
nsity
(cou
nts/
s)
q (Å-1)
Figure 81: Syncrotron x-ray diffraction data of cocoa butter in a form V crystal structure
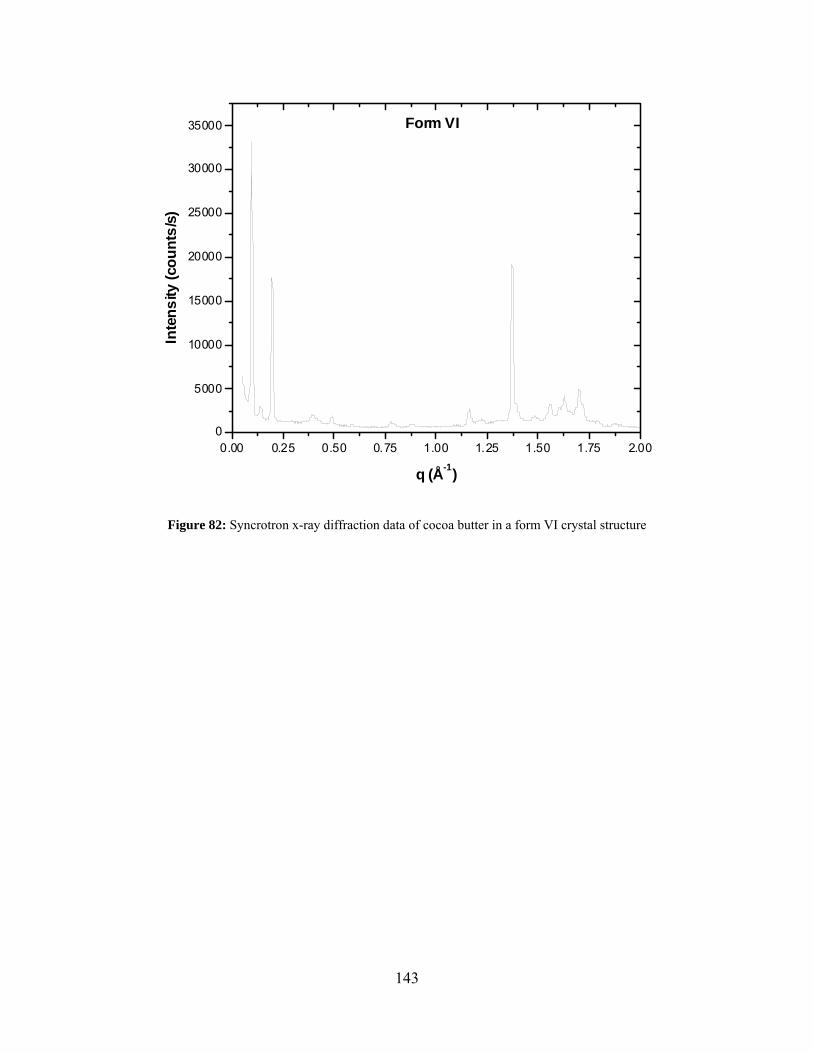
143
0.00 0.25 0.50 0.75 1.00 1.25 1.50 1.75 2.000
5000
10000
15000
20000
25000
30000
35000 Form VI
Inte
nsity
(cou
nts/
s)
q (Å-1)
Figure 82: Syncrotron x-ray diffraction data of cocoa butter in a form VI crystal structure
144
Appendix 3:
The effects of viscous heating should also be considered when looking at the α
crystallization times. The cooling of the system was controlled using the water bath’s
built in controller to minimize the effects of overshooting and have a better repeatability
in the ramp. As such, no attempt was made by the system to compensate for the rise in
temperature due to any heating effects. Therefore the recorded temperature of the system
shows the effects of the viscous heating as well as any heat of crystallization. If we look
at the actual recorded temperature data for 50-18°C in 2°C/min we can see the effects of
the viscous heating on the system temperature. The lowest shear rate is a full half degree
cooler than the highest shear rate (Figure 83). This is true for all of the temperature
conditions examined.
.
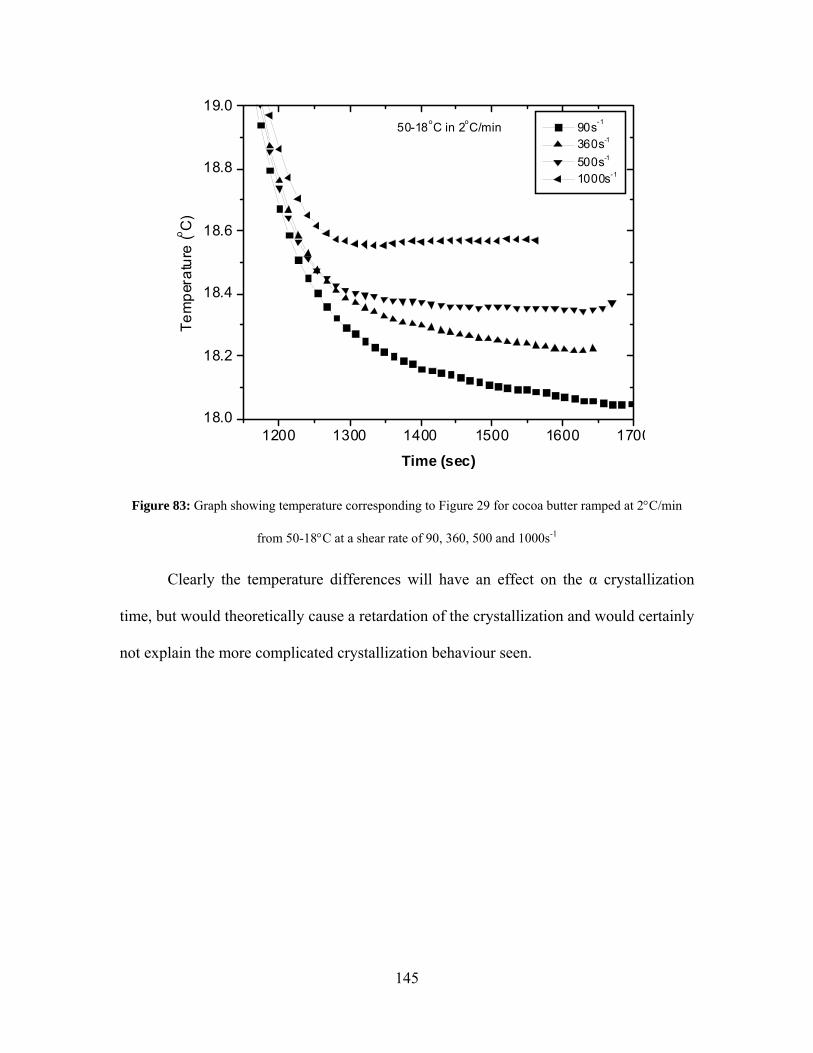
145
1200 1300 1400 1500 1600 170018.0
18.2
18.4
18.6
18.8
19.050-18oC in 2oC/min
Tem
pera
ture
(o C)
Time (sec)
90s-1
360s-1
500s-1
1000s-1
Figure 83: Graph showing temperature corresponding to Figure 29 for cocoa butter ramped at 2°C/min
from 50-18°C at a shear rate of 90, 360, 500 and 1000s-1
Clearly the temperature differences will have an effect on the α crystallization
time, but would theoretically cause a retardation of the crystallization and would certainly
not explain the more complicated crystallization behaviour seen.
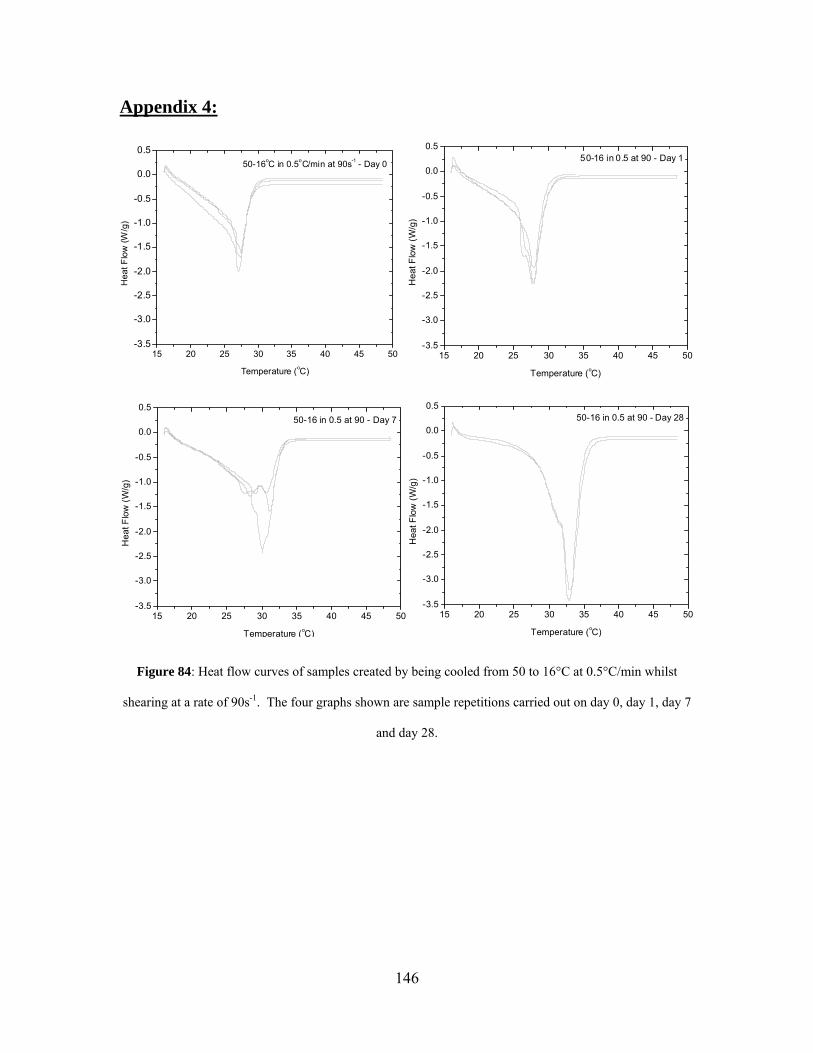
146
Appendix 4:
15 20 25 30 35 40 45 50-3.5
-3.0
-2.5
-2.0
-1.5
-1.0
-0.5
0.0
0.550-16oC in 0.5oC/min at 90s-1 - Day 0
H
eat F
low
(W/g
)
Temperature (oC)
15 20 25 30 35 40 45 50-3.5
-3.0
-2.5
-2.0
-1.5
-1.0
-0.5
0.0
0.550-16 in 0.5 at 90 - Day 1
Hea
t Flo
w (W
/g)
Temperature (oC)
15 20 25 30 35 40 45 50-3.5
-3.0
-2.5
-2.0
-1.5
-1.0
-0.5
0.0
0.550-16 in 0.5 at 90 - Day 7
Hea
t Flo
w (W
/g)
Temperature (oC)
15 20 25 30 35 40 45 50-3.5
-3.0
-2.5
-2.0
-1.5
-1.0
-0.5
0.0
0.550-16 in 0.5 at 90 - Day 28
Hea
t Flo
w (W
/g)
Temperature (oC)
Figure 84: Heat flow curves of samples created by being cooled from 50 to 16°C at 0.5°C/min whilst
shearing at a rate of 90s-1. The four graphs shown are sample repetitions carried out on day 0, day 1, day 7
and day 28.
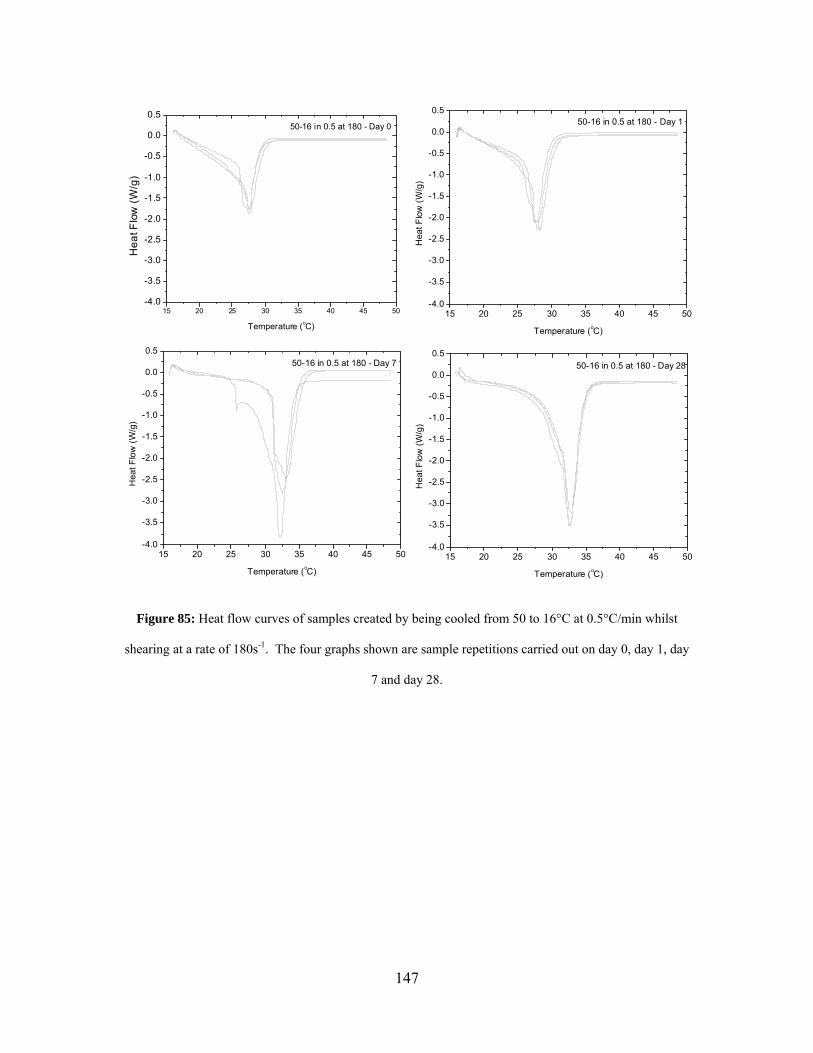
147
15 20 25 30 35 40 45 50-4.0
-3.5
-3.0
-2.5
-2.0
-1.5
-1.0
-0.5
0.0
0.550-16 in 0.5 at 180 - Day 0
Hea
t Flo
w (
W/g
)
Temperature (oC)15 20 25 30 35 40 45 50
-4.0
-3.5
-3.0
-2.5
-2.0
-1.5
-1.0
-0.5
0.0
0.550-16 in 0.5 at 180 - Day 1
Hea
t Flo
w (W
/g)
Temperature (oC)
15 20 25 30 35 40 45 50-4.0
-3.5
-3.0
-2.5
-2.0
-1.5
-1.0
-0.5
0.0
0.550-16 in 0.5 at 180 - Day 7
Hea
t Flo
w (W
/g)
Temperature (oC)
15 20 25 30 35 40 45 50-4.0
-3.5
-3.0
-2.5
-2.0
-1.5
-1.0
-0.5
0.0
0.550-16 in 0.5 at 180 - Day 28
Hea
t Flo
w (W
/g)
Temperature (oC)
Figure 85: Heat flow curves of samples created by being cooled from 50 to 16°C at 0.5°C/min whilst
shearing at a rate of 180s-1. The four graphs shown are sample repetitions carried out on day 0, day 1, day
7 and day 28.
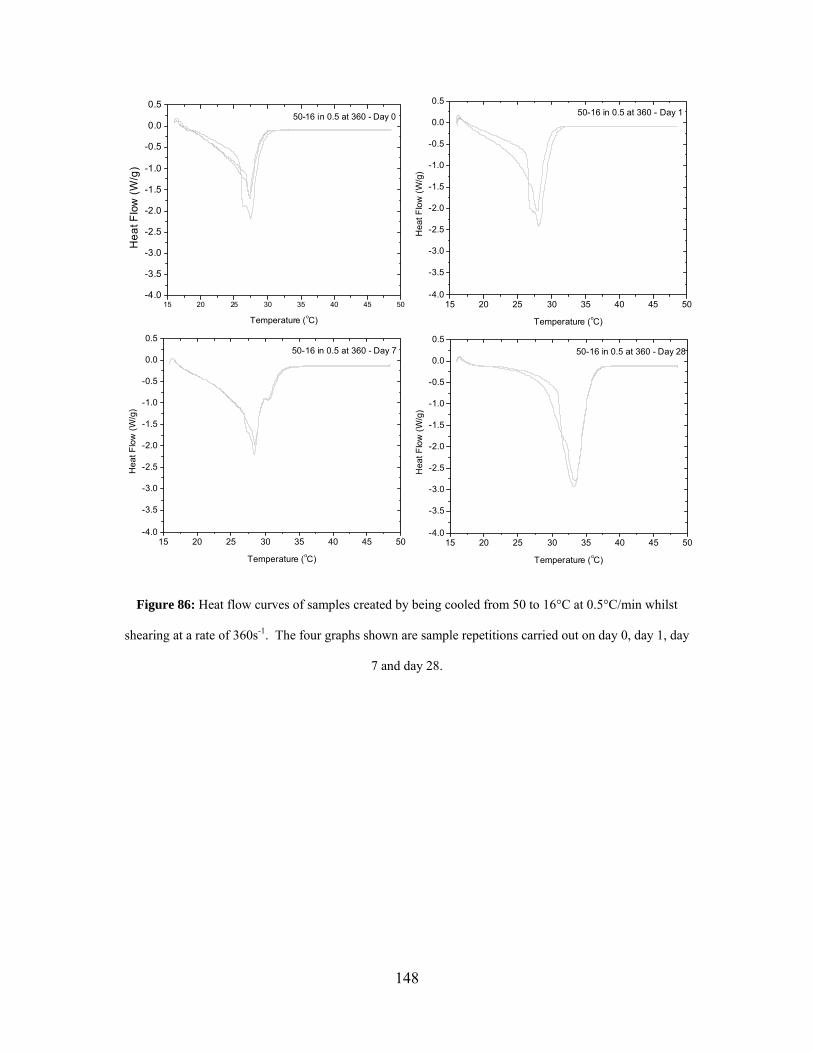
148
15 20 25 30 35 40 45 50-4.0
-3.5
-3.0
-2.5
-2.0
-1.5
-1.0
-0.5
0.0
0.550-16 in 0.5 at 360 - Day 0
Hea
t Flo
w (
W/g
)
Temperature (oC)
15 20 25 30 35 40 45 50-4.0
-3.5
-3.0
-2.5
-2.0
-1.5
-1.0
-0.5
0.0
0.550-16 in 0.5 at 360 - Day 1
Hea
t Flo
w (W
/g)
Temperature (oC)
15 20 25 30 35 40 45 50-4.0
-3.5
-3.0
-2.5
-2.0
-1.5
-1.0
-0.5
0.0
0.550-16 in 0.5 at 360 - Day 7
Hea
t Flo
w (W
/g)
Temperature (oC)
15 20 25 30 35 40 45 50-4.0
-3.5
-3.0
-2.5
-2.0
-1.5
-1.0
-0.5
0.0
0.550-16 in 0.5 at 360 - Day 28
Hea
t Flo
w (W
/g)
Temperature (oC)
Figure 86: Heat flow curves of samples created by being cooled from 50 to 16°C at 0.5°C/min whilst
shearing at a rate of 360s-1. The four graphs shown are sample repetitions carried out on day 0, day 1, day
7 and day 28.
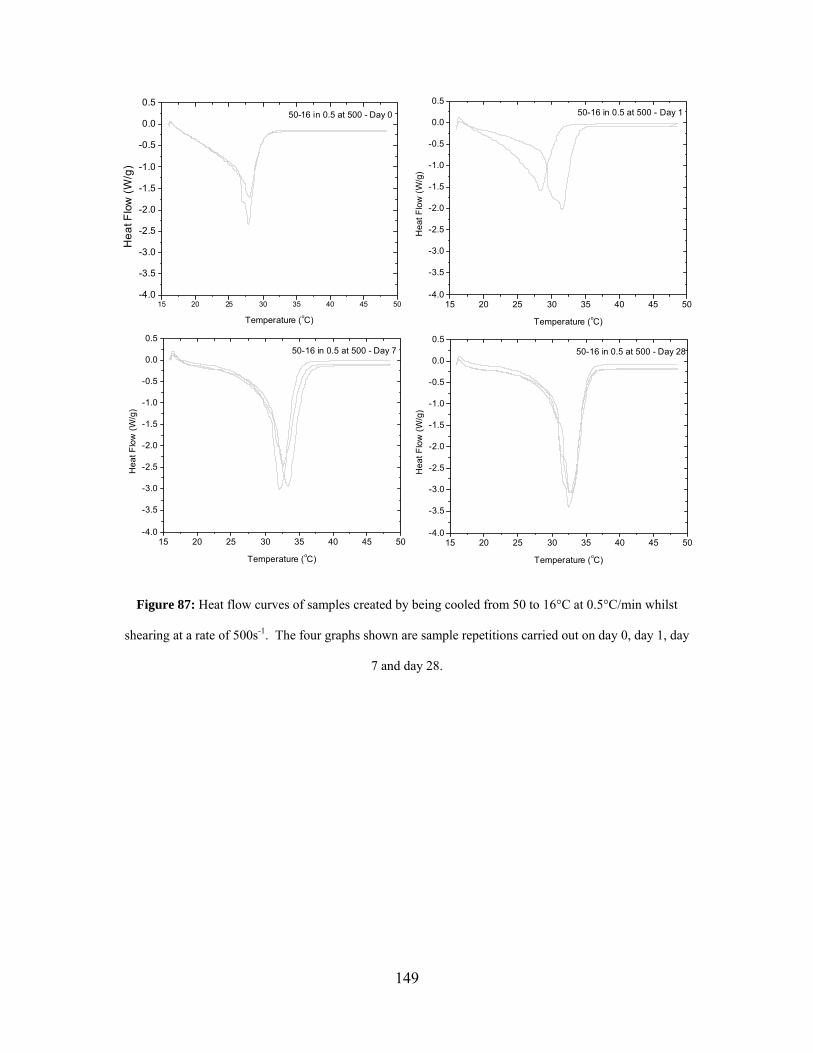
149
15 20 25 30 35 40 45 50-4.0
-3.5
-3.0
-2.5
-2.0
-1.5
-1.0
-0.5
0.0
0.550-16 in 0.5 at 500 - Day 0
Hea
t Flo
w (
W/g
)
Temperature (oC)
15 20 25 30 35 40 45 50-4.0
-3.5
-3.0
-2.5
-2.0
-1.5
-1.0
-0.5
0.0
0.550-16 in 0.5 at 500 - Day 1
Hea
t Flo
w (W
/g)
Temperature (oC)
15 20 25 30 35 40 45 50-4.0
-3.5
-3.0
-2.5
-2.0
-1.5
-1.0
-0.5
0.0
0.550-16 in 0.5 at 500 - Day 7
Hea
t Flo
w (W
/g)
Temperature (oC)
15 20 25 30 35 40 45 50-4.0
-3.5
-3.0
-2.5
-2.0
-1.5
-1.0
-0.5
0.0
0.550-16 in 0.5 at 500 - Day 28
Hea
t Flo
w (W
/g)
Temperature (oC)
Figure 87: Heat flow curves of samples created by being cooled from 50 to 16°C at 0.5°C/min whilst
shearing at a rate of 500s-1. The four graphs shown are sample repetitions carried out on day 0, day 1, day
7 and day 28.

150
15 20 25 30 35 40 45 50-4.0
-3.5
-3.0
-2.5
-2.0
-1.5
-1.0
-0.5
0.0
0.550-16 in 0.5 at 720 - Day 0
Hea
t Flo
w (
W/g
)
Temperature (oC)
15 20 25 30 35 40 45 50-4.0
-3.5
-3.0
-2.5
-2.0
-1.5
-1.0
-0.5
0.0
0.550-16 in 0.5 at 720 - Day 1
Hea
t Flo
w (W
/g)
Temperature (oC)
15 20 25 30 35 40 45 50-4.0
-3.5
-3.0
-2.5
-2.0
-1.5
-1.0
-0.5
0.0
0.550-16 in 0.5 at 720 - Day 7
Hea
t Flo
w (W
/g)
Temperature (oC)
15 20 25 30 35 40 45 50-4.0
-3.5
-3.0
-2.5
-2.0
-1.5
-1.0
-0.5
0.0
0.550-16 in 0.5 at 720 - Day 28
Hea
t Flo
w (W
/g)
Temperature (oC)
Figure 88: Heat flow curves of samples created by being cooled from 50 to 16°C at 0.5°C/min whilst
shearing at a rate of 720s-1. The four graphs shown are sample repetitions carried out on day 0, day 1, day
7 and day 28.
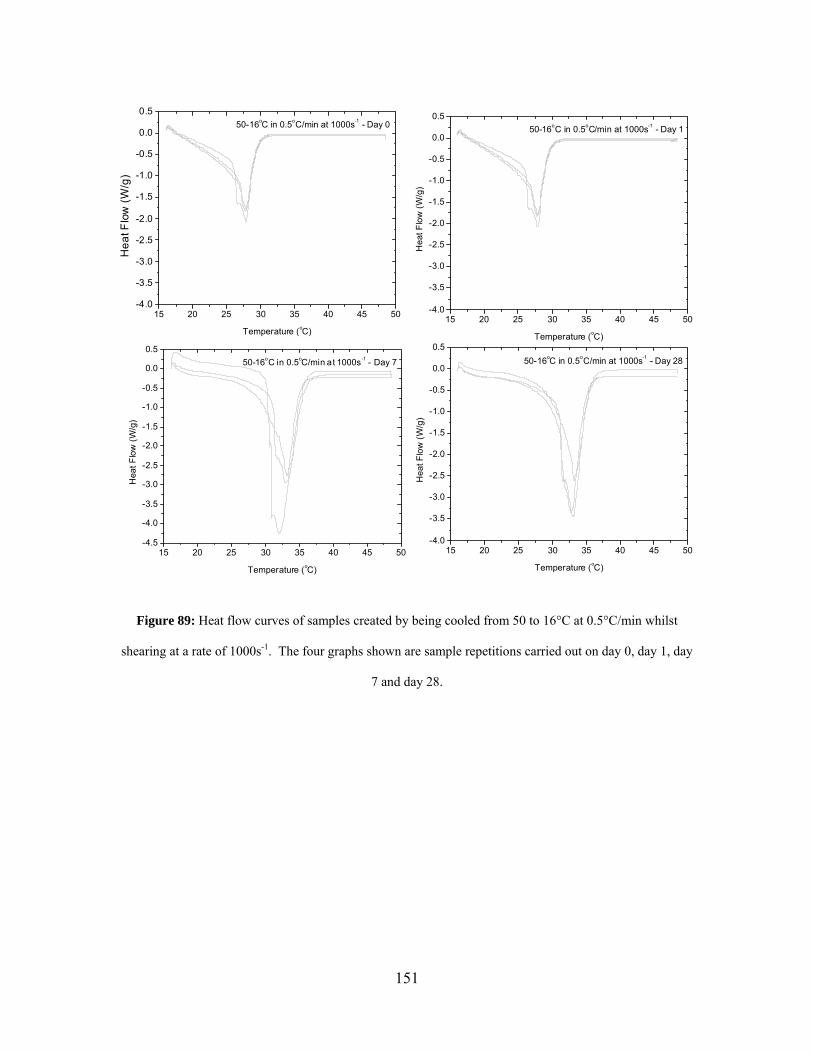
151
15 20 25 30 35 40 45 50-4.0
-3.5
-3.0
-2.5
-2.0
-1.5
-1.0
-0.5
0.0
0.550-16oC in 0.5oC/min at 1000s-1 - Day 0
Hea
t Flo
w (
W/g
)
Temperature (oC)15 20 25 30 35 40 45 50
-4.0
-3.5
-3.0
-2.5
-2.0
-1.5
-1.0
-0.5
0.0
0.550-16oC in 0.5oC/min at 1000s-1 - Day 1
Hea
t Flo
w (W
/g)
Temperature (oC)
15 20 25 30 35 40 45 50-4.5
-4.0
-3.5
-3.0
-2.5
-2.0
-1.5
-1.0
-0.5
0.0
0.550-16oC in 0.5oC/min at 1000s-1 - Day 7
Hea
t Flo
w (W
/g)
Temperature (oC)
15 20 25 30 35 40 45 50-4.0
-3.5
-3.0
-2.5
-2.0
-1.5
-1.0
-0.5
0.0
0.550-16oC in 0.5oC/min at 1000s-1 - Day 28
Hea
t Flo
w (W
/g)
Temperature (oC)
Figure 89: Heat flow curves of samples created by being cooled from 50 to 16°C at 0.5°C/min whilst
shearing at a rate of 1000s-1. The four graphs shown are sample repetitions carried out on day 0, day 1, day
7 and day 28.
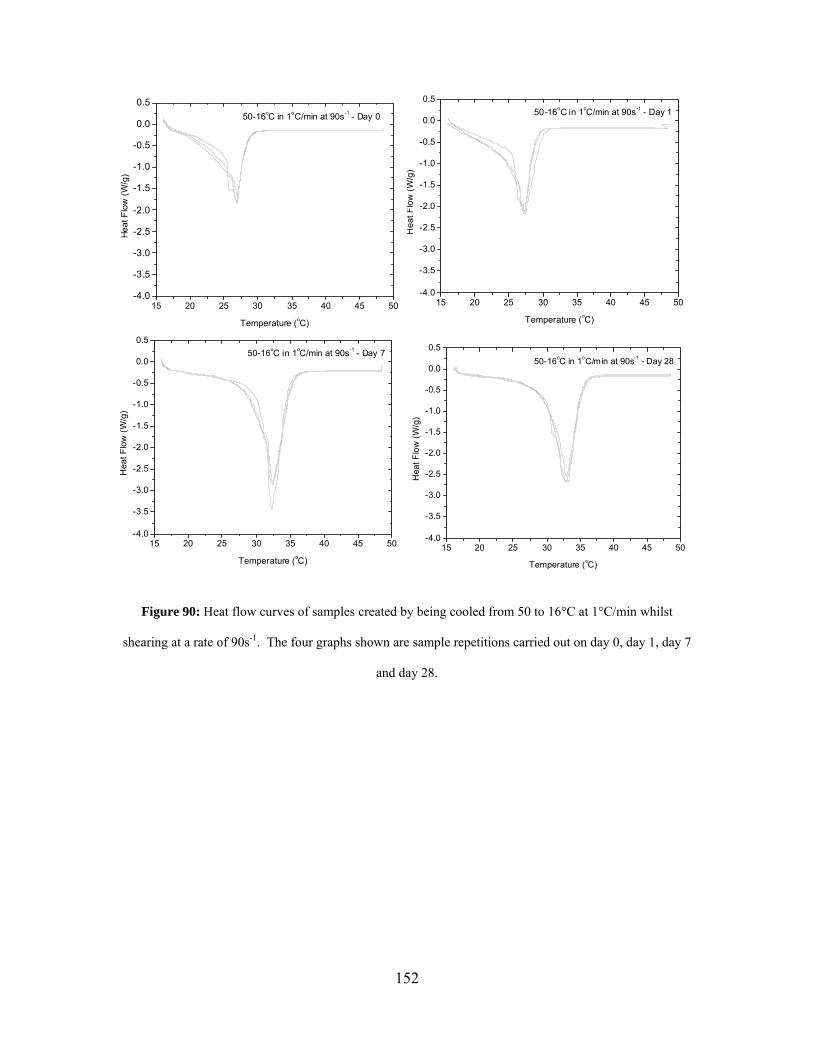
152
15 20 25 30 35 40 45 50-4.0
-3.5
-3.0
-2.5
-2.0
-1.5
-1.0
-0.5
0.0
0.550-16oC in 1oC/min at 90s-1 - Day 0
Heat
Flo
w (W
/g)
Temperature (oC)
15 20 25 30 35 40 45 50-4.0
-3.5
-3.0
-2.5
-2.0
-1.5
-1.0
-0.5
0.0
0.550-16oC in 1oC/min at 90s-1 - Day 1
Hea
t Flo
w (W
/g)
Temperature (oC)
15 20 25 30 35 40 45 50-4.0
-3.5
-3.0
-2.5
-2.0
-1.5
-1.0
-0.5
0.0
0.550-16oC in 1oC/min at 90s-1 - Day 7
Hea
t Flo
w (W
/g)
Temperature (oC)15 20 25 30 35 40 45 50
-4.0
-3.5
-3.0
-2.5
-2.0
-1.5
-1.0
-0.5
0.0
0.550-16oC in 1oC/min at 90s-1 - Day 28
Hea
t Flo
w (W
/g)
Temperature (oC)
Figure 90: Heat flow curves of samples created by being cooled from 50 to 16°C at 1°C/min whilst
shearing at a rate of 90s-1. The four graphs shown are sample repetitions carried out on day 0, day 1, day 7
and day 28.
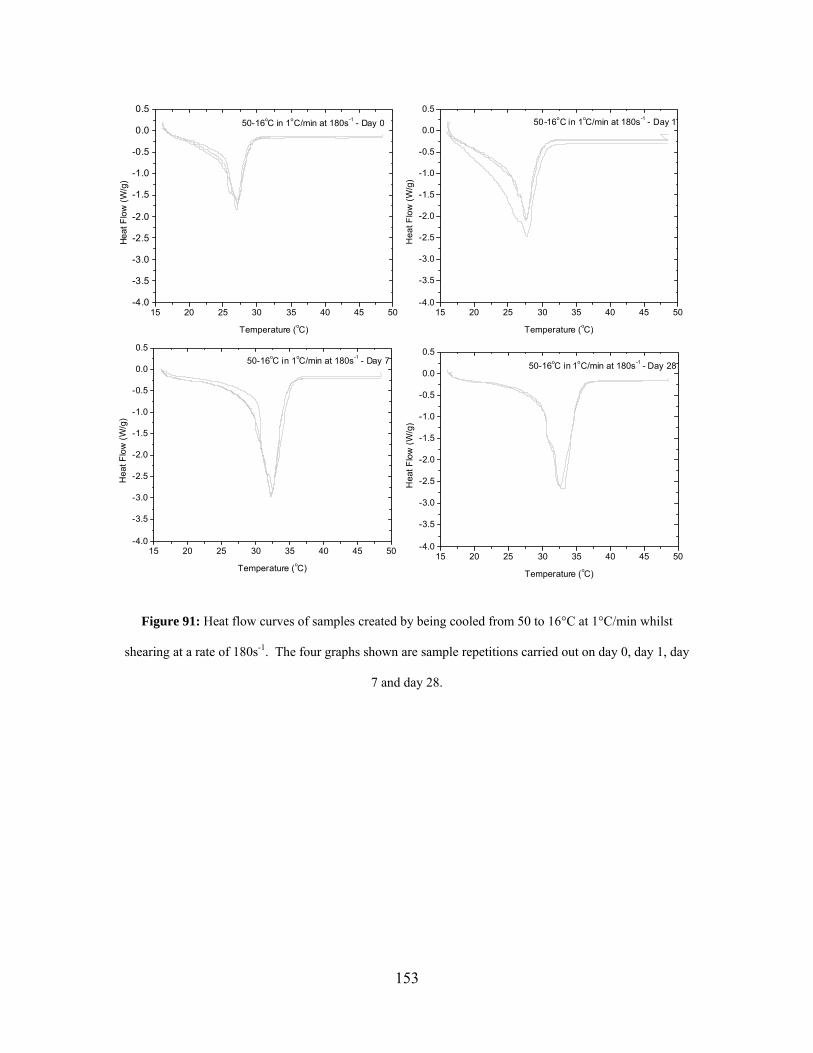
153
15 20 25 30 35 40 45 50-4.0
-3.5
-3.0
-2.5
-2.0
-1.5
-1.0
-0.5
0.0
0.550-16oC in 1oC/min at 180s-1 - Day 0
Heat
Flo
w (W
/g)
Temperature (oC)
15 20 25 30 35 40 45 50-4.0
-3.5
-3.0
-2.5
-2.0
-1.5
-1.0
-0.5
0.0
0.550-16oC in 1oC/min at 180s-1 - Day 1
Hea
t Flo
w (W
/g)
Temperature (oC)
15 20 25 30 35 40 45 50-4.0
-3.5
-3.0
-2.5
-2.0
-1.5
-1.0
-0.5
0.0
0.550-16oC in 1oC/min at 180s-1 - Day 7
Hea
t Flo
w (W
/g)
Temperature (oC)15 20 25 30 35 40 45 50
-4.0
-3.5
-3.0
-2.5
-2.0
-1.5
-1.0
-0.5
0.0
0.550-16oC in 1oC/min at 180s-1 - Day 28
Hea
t Flo
w (W
/g)
Temperature (oC)
Figure 91: Heat flow curves of samples created by being cooled from 50 to 16°C at 1°C/min whilst
shearing at a rate of 180s-1. The four graphs shown are sample repetitions carried out on day 0, day 1, day
7 and day 28.
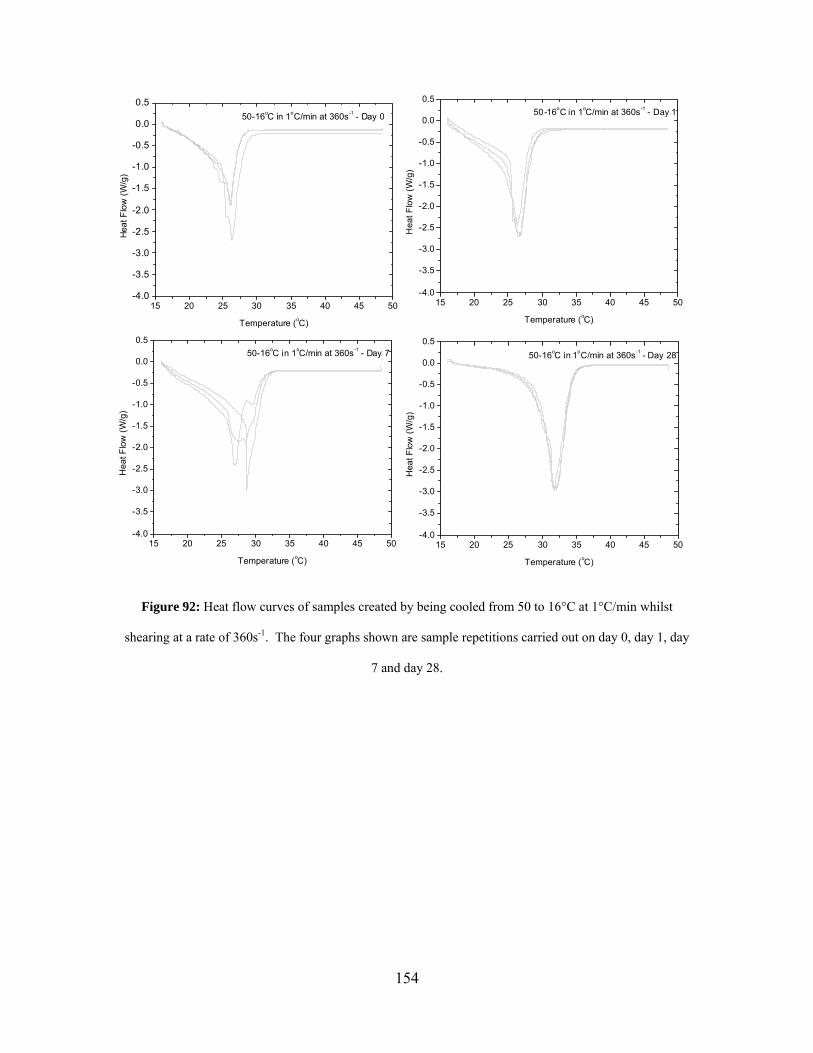
154
15 20 25 30 35 40 45 50-4.0
-3.5
-3.0
-2.5
-2.0
-1.5
-1.0
-0.5
0.0
0.550-16oC in 1oC/min at 360s-1 - Day 0
Heat
Flo
w (W
/g)
Temperature (oC)
15 20 25 30 35 40 45 50-4.0
-3.5
-3.0
-2.5
-2.0
-1.5
-1.0
-0.5
0.0
0.550-16oC in 1oC/min at 360s-1 - Day 1
Hea
t Flo
w (W
/g)
Temperature (oC)
15 20 25 30 35 40 45 50-4.0
-3.5
-3.0
-2.5
-2.0
-1.5
-1.0
-0.5
0.0
0.550-16oC in 1oC/min at 360s-1 - Day 7
Hea
t Flo
w (W
/g)
Temperature (oC)
15 20 25 30 35 40 45 50-4.0
-3.5
-3.0
-2.5
-2.0
-1.5
-1.0
-0.5
0.0
0.550-16oC in 1oC/min at 360s-1 - Day 28
Hea
t Flo
w (W
/g)
Temperature (oC)
Figure 92: Heat flow curves of samples created by being cooled from 50 to 16°C at 1°C/min whilst
shearing at a rate of 360s-1. The four graphs shown are sample repetitions carried out on day 0, day 1, day
7 and day 28.

155
15 20 25 30 35 40 45 50-4.0
-3.5
-3.0
-2.5
-2.0
-1.5
-1.0
-0.5
0.0
0.550-16oC in 1oC/min at 500s-1 - Day 0
Heat
Flo
w (W
/g)
Temperature (oC)
15 20 25 30 35 40 45 50-4.0
-3.5
-3.0
-2.5
-2.0
-1.5
-1.0
-0.5
0.0
0.550-16oC in 1oC/min at 500s-1 - Day 1
Hea
t Flo
w (W
/g)
Temperature (oC)
15 20 25 30 35 40 45 50-4.0
-3.5
-3.0
-2.5
-2.0
-1.5
-1.0
-0.5
0.0
0.550-16oC in 1oC/min at 500s-1 - Day 7
Hea
t Flo
w (W
/g)
Temperature (oC)
15 20 25 30 35 40 45 50-4.0
-3.5
-3.0
-2.5
-2.0
-1.5
-1.0
-0.5
0.0
0.550-16oC in 1oC/min at 500s-1 - Day 28
Hea
t Flo
w (W
/g)
Temperature (oC)
Figure 93: Heat flow curves of samples created by being cooled from 50 to 16°C at 1°C/min whilst
shearing at a rate of 500s-1. The four graphs shown are sample repetitions carried out on day 0, day 1, day
7 and day 28.
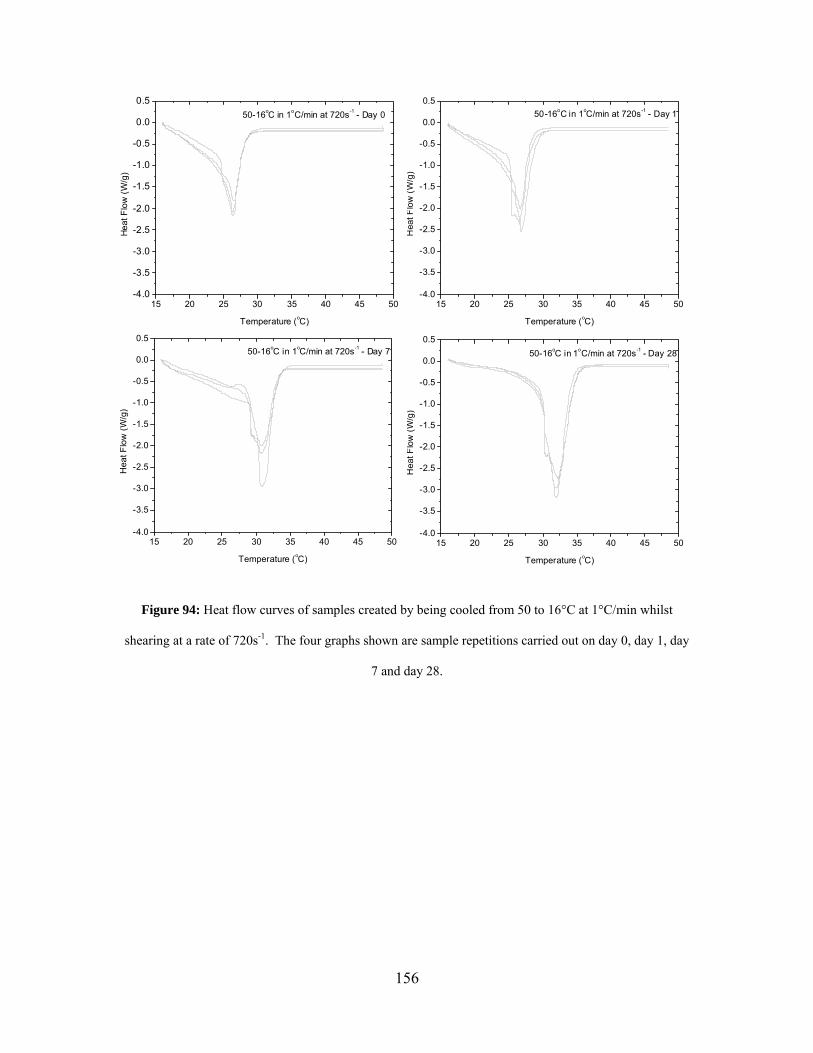
156
15 20 25 30 35 40 45 50-4.0
-3.5
-3.0
-2.5
-2.0
-1.5
-1.0
-0.5
0.0
0.550-16oC in 1oC/min at 720s-1 - Day 0
Heat
Flo
w (W
/g)
Temperature (oC)
15 20 25 30 35 40 45 50-4.0
-3.5
-3.0
-2.5
-2.0
-1.5
-1.0
-0.5
0.0
0.550-16oC in 1oC/min at 720s-1 - Day 1
Hea
t Flo
w (W
/g)
Temperature (oC)
15 20 25 30 35 40 45 50-4.0
-3.5
-3.0
-2.5
-2.0
-1.5
-1.0
-0.5
0.0
0.550-16oC in 1oC/min at 720s-1 - Day 7
Hea
t Flo
w (W
/g)
Temperature (oC)
15 20 25 30 35 40 45 50-4.0
-3.5
-3.0
-2.5
-2.0
-1.5
-1.0
-0.5
0.0
0.550-16oC in 1oC/min at 720s-1 - Day 28
Hea
t Flo
w (W
/g)
Temperature (oC)
Figure 94: Heat flow curves of samples created by being cooled from 50 to 16°C at 1°C/min whilst
shearing at a rate of 720s-1. The four graphs shown are sample repetitions carried out on day 0, day 1, day
7 and day 28.
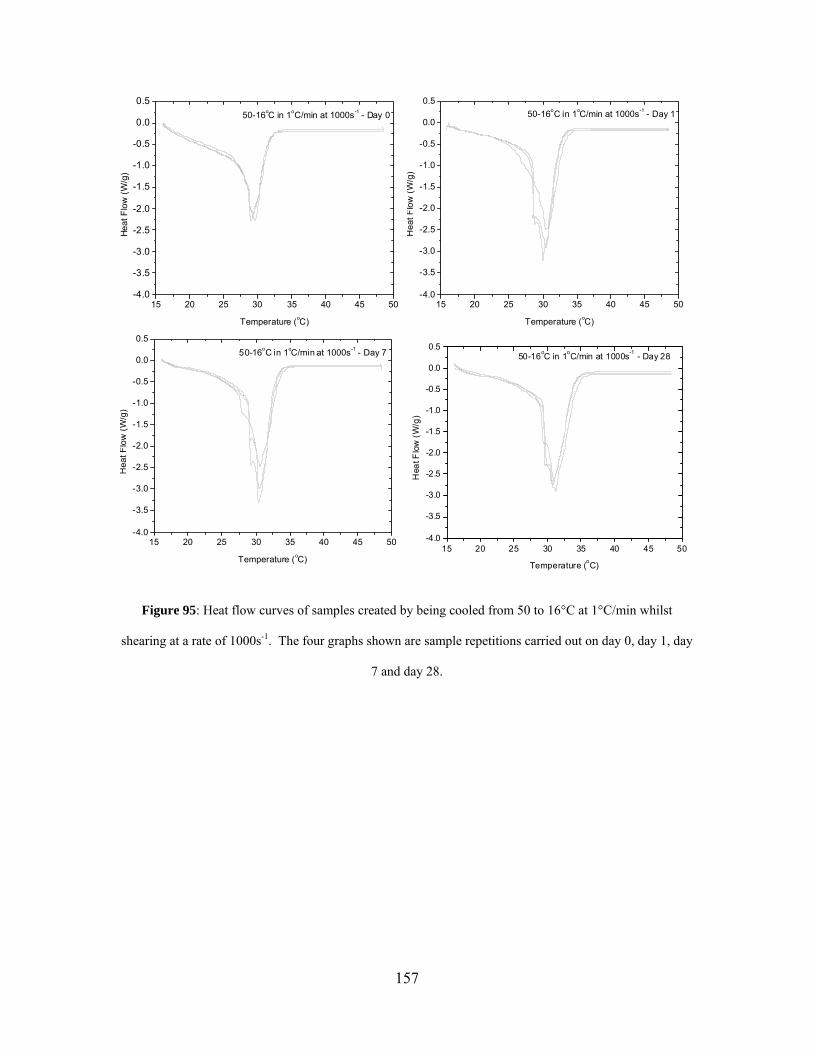
157
15 20 25 30 35 40 45 50-4.0
-3.5
-3.0
-2.5
-2.0
-1.5
-1.0
-0.5
0.0
0.550-16oC in 1oC/min at 1000s-1 - Day 0
Heat
Flo
w (W
/g)
Temperature (oC)
15 20 25 30 35 40 45 50-4.0
-3.5
-3.0
-2.5
-2.0
-1.5
-1.0
-0.5
0.0
0.550-16oC in 1oC/min at 1000s-1 - Day 1
Hea
t Flo
w (W
/g)
Temperature (oC)
15 20 25 30 35 40 45 50-4.0
-3.5
-3.0
-2.5
-2.0
-1.5
-1.0
-0.5
0.0
0.550-16oC in 1oC/min at 1000s-1 - Day 7
Hea
t Flo
w (W
/g)
Temperature (oC)15 20 25 30 35 40 45 50
-4.0
-3.5
-3.0
-2.5
-2.0
-1.5
-1.0
-0.5
0.0
0.550-16oC in 1oC/min at 1000s-1 - Day 28
Hea
t Flo
w (W
/g)
Temperature (oC)
Figure 95: Heat flow curves of samples created by being cooled from 50 to 16°C at 1°C/min whilst
shearing at a rate of 1000s-1. The four graphs shown are sample repetitions carried out on day 0, day 1, day
7 and day 28.
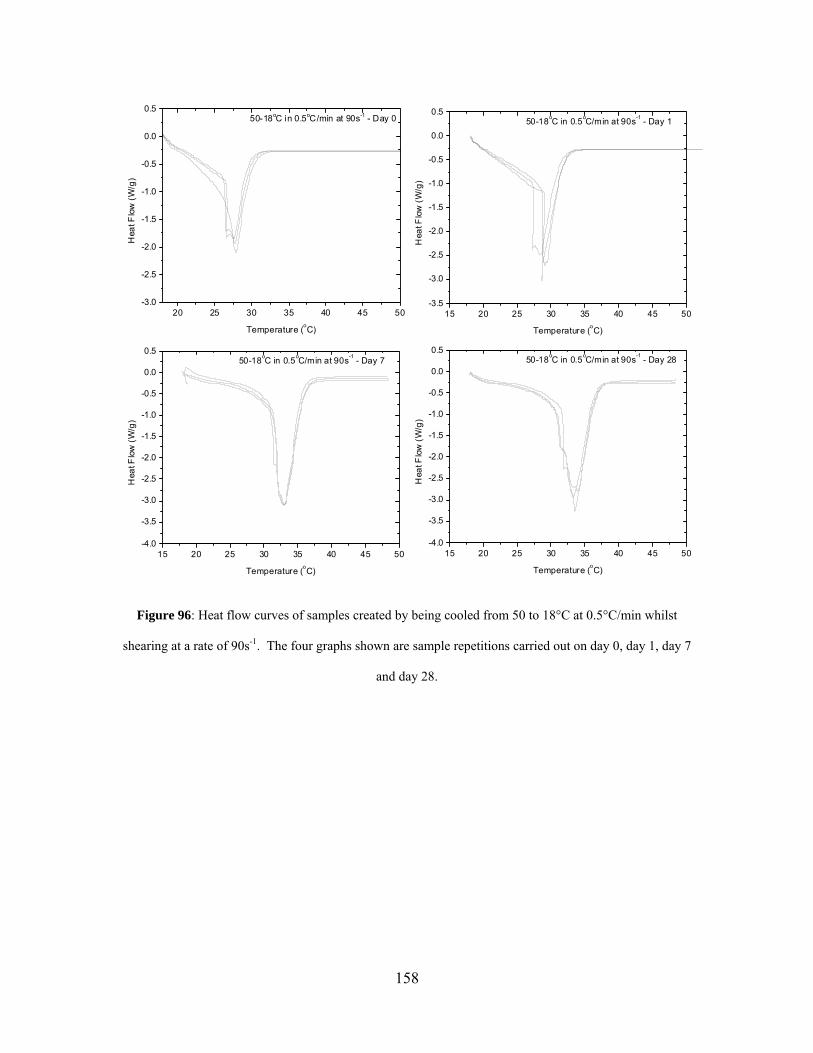
158
20 25 30 35 40 45 50-3.0
-2.5
-2.0
-1.5
-1.0
-0.5
0.0
0.550-18oC in 0.5oC/min at 90s-1 - Day 0
Hea
t Flo
w (W
/g)
Temperature (oC)
15 20 25 30 35 40 45 50-3.5
-3.0
-2.5
-2.0
-1.5
-1.0
-0.5
0.0
0.550-18oC in 0.5oC/min at 90s-1 - Day 1
Hea
t Flo
w (W
/g)
Temperature (oC)
15 20 25 30 35 40 45 50-4.0
-3.5
-3.0
-2.5
-2.0
-1.5
-1.0
-0.5
0.0
0.550-18oC in 0.5oC/min at 90s-1 - Day 7
Hea
t Flo
w (W
/g)
Temperature (oC)
15 20 25 30 35 40 45 50-4.0
-3.5
-3.0
-2.5
-2.0
-1.5
-1.0
-0.5
0.0
0.550-18oC in 0.5oC/min at 90s-1 - Day 28
Hea
t Flo
w (W
/g)
Temperature (oC)
Figure 96: Heat flow curves of samples created by being cooled from 50 to 18°C at 0.5°C/min whilst
shearing at a rate of 90s-1. The four graphs shown are sample repetitions carried out on day 0, day 1, day 7
and day 28.
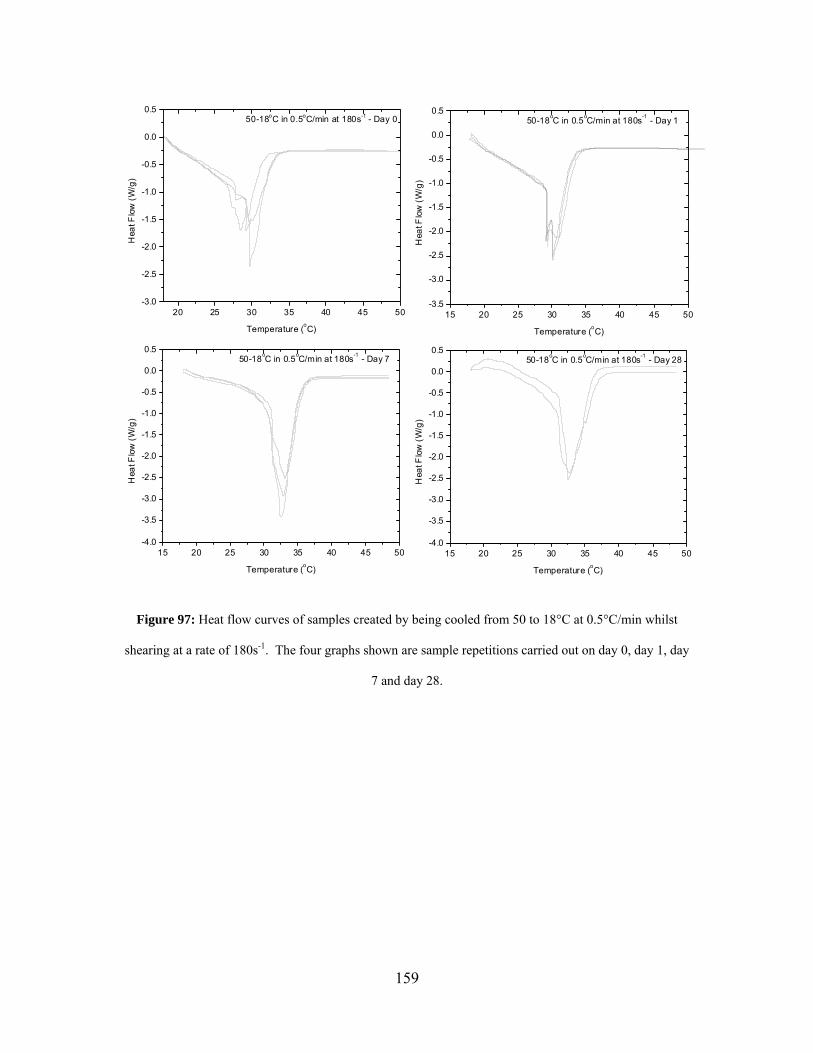
159
20 25 30 35 40 45 50-3.0
-2.5
-2.0
-1.5
-1.0
-0.5
0.0
0.550-18oC in 0.5oC/min at 180s-1 - Day 0
Hea
t Flo
w (W
/g)
Temperature (oC)15 20 25 30 35 40 45 50
-3.5
-3.0
-2.5
-2.0
-1.5
-1.0
-0.5
0.0
0.550-18oC in 0.5oC/min at 180s-1 - Day 1
Hea
t Flo
w (W
/g)
Temperature (oC)
15 20 25 30 35 40 45 50-4.0
-3.5
-3.0
-2.5
-2.0
-1.5
-1.0
-0.5
0.0
0.550-18oC in 0.5oC/min at 180s-1 - Day 7
Hea
t Flo
w (W
/g)
Temperature (oC)
15 20 25 30 35 40 45 50-4.0
-3.5
-3.0
-2.5
-2.0
-1.5
-1.0
-0.5
0.0
0.550-18oC in 0.5oC/min at 180s-1 - Day 28
Hea
t Flo
w (W
/g)
Temperature (oC)
Figure 97: Heat flow curves of samples created by being cooled from 50 to 18°C at 0.5°C/min whilst
shearing at a rate of 180s-1. The four graphs shown are sample repetitions carried out on day 0, day 1, day
7 and day 28.
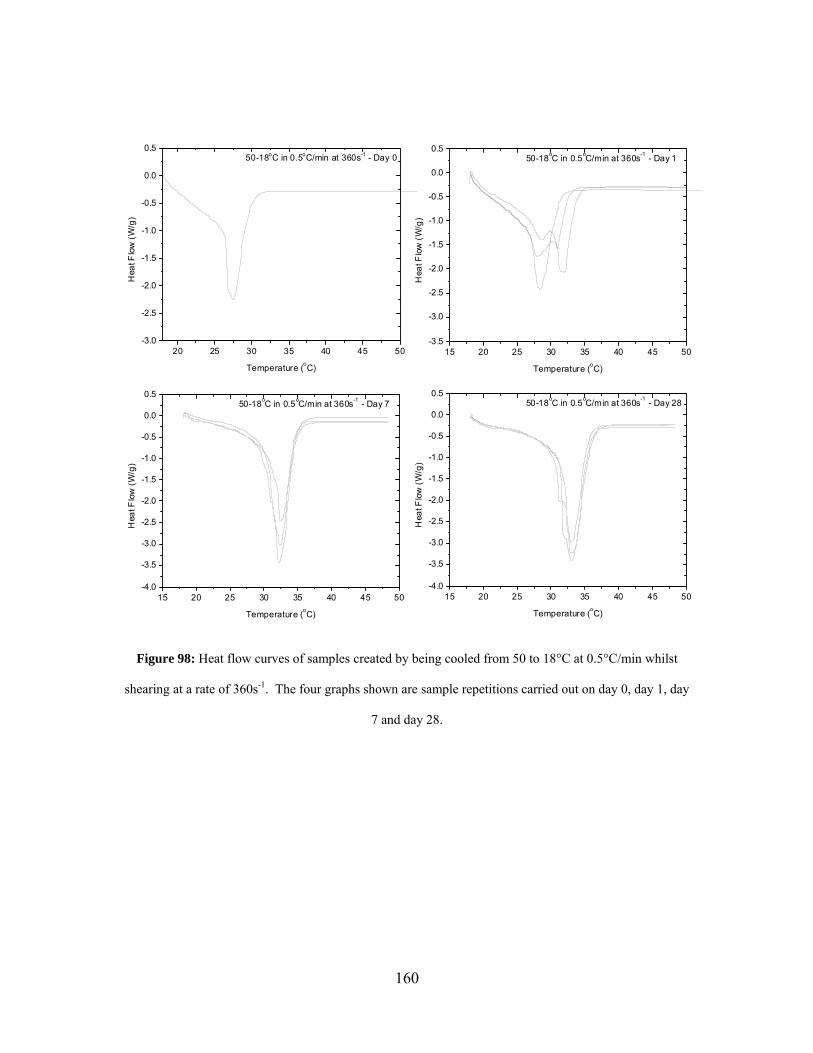
160
20 25 30 35 40 45 50-3.0
-2.5
-2.0
-1.5
-1.0
-0.5
0.0
0.550-18oC in 0.5oC/min at 360s-1 - Day 0
H
eat F
low
(W/g
)
Temperature (oC)
15 20 25 30 35 40 45 50-3.5
-3.0
-2.5
-2.0
-1.5
-1.0
-0.5
0.0
0.550-18oC in 0.5oC/min at 360s-1 - Day 1
Hea
t Flo
w (W
/g)
Temperature (oC)
15 20 25 30 35 40 45 50-4.0
-3.5
-3.0
-2.5
-2.0
-1.5
-1.0
-0.5
0.0
0.550-18oC in 0.5oC/min at 360s-1 - Day 7
Hea
t Flo
w (W
/g)
Temperature (oC)
15 20 25 30 35 40 45 50-4.0
-3.5
-3.0
-2.5
-2.0
-1.5
-1.0
-0.5
0.0
0.550-18oC in 0.5oC/min at 360s-1 - Day 28
Hea
t Flo
w (W
/g)
Temperature (oC)
Figure 98: Heat flow curves of samples created by being cooled from 50 to 18°C at 0.5°C/min whilst
shearing at a rate of 360s-1. The four graphs shown are sample repetitions carried out on day 0, day 1, day
7 and day 28.
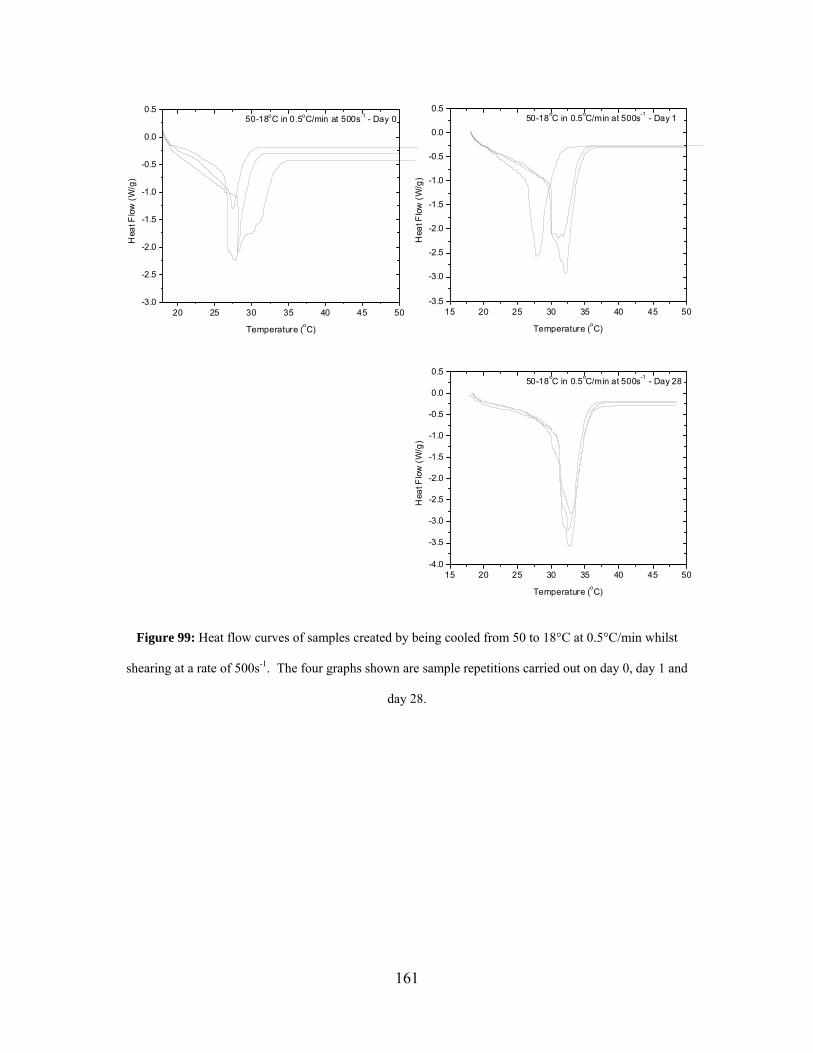
161
20 25 30 35 40 45 50-3.0
-2.5
-2.0
-1.5
-1.0
-0.5
0.0
0.550-18oC in 0.5oC/min at 500s-1 - Day 0
Hea
t Flo
w (W
/g)
Temperature (oC)
15 20 25 30 35 40 45 50-3.5
-3.0
-2.5
-2.0
-1.5
-1.0
-0.5
0.0
0.550-18oC in 0.5oC/min at 500s-1 - Day 1
Hea
t Flo
w (W
/g)
Temperature (oC)
15 20 25 30 35 40 45 50-4.0
-3.5
-3.0
-2.5
-2.0
-1.5
-1.0
-0.5
0.0
0.550-18oC in 0.5oC/min at 500s-1 - Day 28
Hea
t Flo
w (W
/g)
Temperature (oC)
Figure 99: Heat flow curves of samples created by being cooled from 50 to 18°C at 0.5°C/min whilst
shearing at a rate of 500s-1. The four graphs shown are sample repetitions carried out on day 0, day 1 and
day 28.
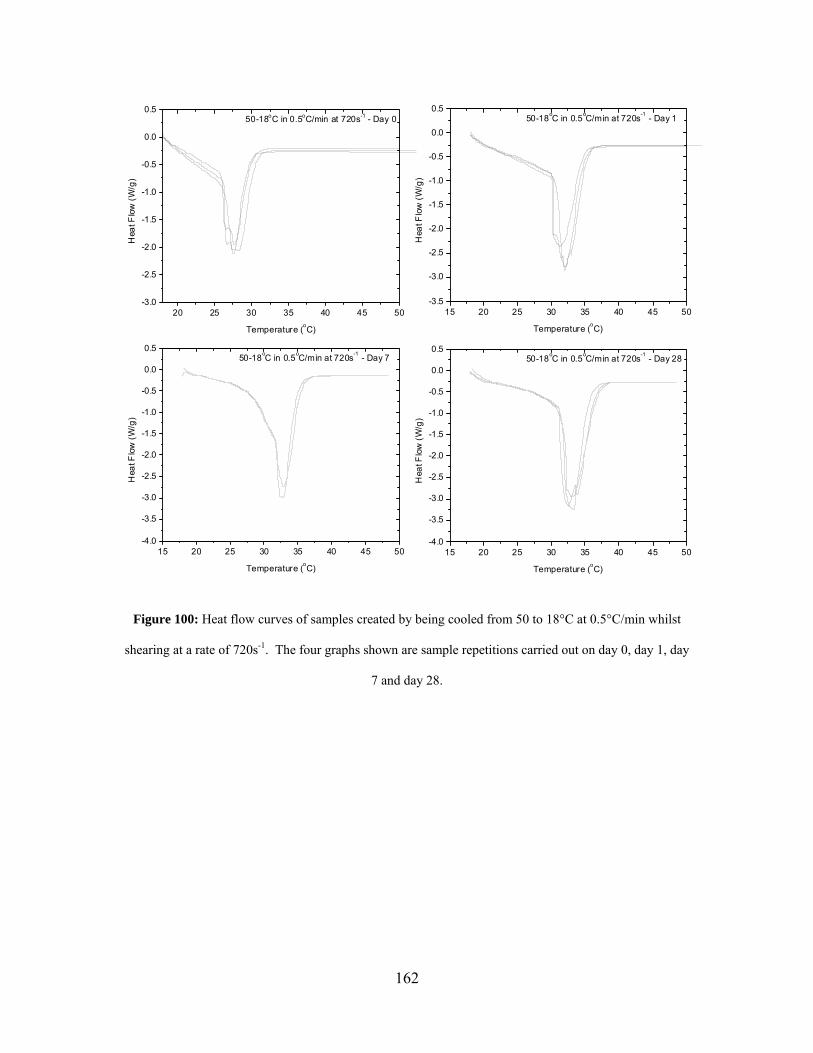
162
20 25 30 35 40 45 50-3.0
-2.5
-2.0
-1.5
-1.0
-0.5
0.0
0.550-18oC in 0.5oC/min at 720s-1 - Day 0
Hea
t Flo
w (W
/g)
Temperature (oC)
15 20 25 30 35 40 45 50-3.5
-3.0
-2.5
-2.0
-1.5
-1.0
-0.5
0.0
0.550-18oC in 0.5oC/min at 720s-1 - Day 1
Hea
t Flo
w (W
/g)
Temperature (oC)
15 20 25 30 35 40 45 50-4.0
-3.5
-3.0
-2.5
-2.0
-1.5
-1.0
-0.5
0.0
0.550-18oC in 0.5oC/min at 720s-1 - Day 7
Hea
t Flo
w (W
/g)
Temperature (oC)
15 20 25 30 35 40 45 50-4.0
-3.5
-3.0
-2.5
-2.0
-1.5
-1.0
-0.5
0.0
0.550-18oC in 0.5oC/min at 720s-1 - Day 28
Hea
t Flo
w (W
/g)
Temperature (oC)
Figure 100: Heat flow curves of samples created by being cooled from 50 to 18°C at 0.5°C/min whilst
shearing at a rate of 720s-1. The four graphs shown are sample repetitions carried out on day 0, day 1, day
7 and day 28.
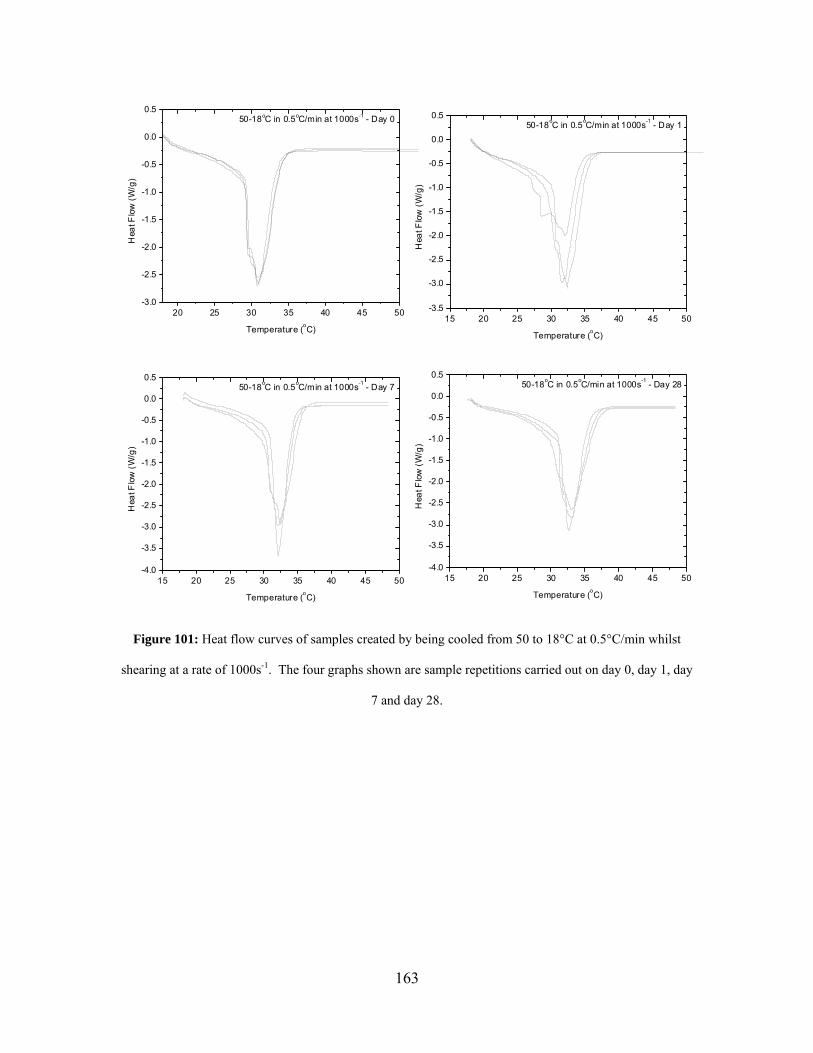
163
20 25 30 35 40 45 50-3.0
-2.5
-2.0
-1.5
-1.0
-0.5
0.0
0.550-18oC in 0.5oC/min at 1000s-1 - Day 0
Hea
t Flo
w (W
/g)
Temperature (oC)15 20 25 30 35 40 45 50
-3.5
-3.0
-2.5
-2.0
-1.5
-1.0
-0.5
0.0
0.550-18oC in 0.5oC/min at 1000s-1 - Day 1
Hea
t Flo
w (W
/g)
Temperature (oC)
15 20 25 30 35 40 45 50-4.0
-3.5
-3.0
-2.5
-2.0
-1.5
-1.0
-0.5
0.0
0.550-18oC in 0.5oC/min at 1000s-1 - Day 7
Hea
t Flo
w (W
/g)
Temperature (oC)
15 20 25 30 35 40 45 50-4.0
-3.5
-3.0
-2.5
-2.0
-1.5
-1.0
-0.5
0.0
0.550-18oC in 0.5oC/min at 1000s-1 - Day 28
Hea
t Flo
w (W
/g)
Temperature (oC)
Figure 101: Heat flow curves of samples created by being cooled from 50 to 18°C at 0.5°C/min whilst
shearing at a rate of 1000s-1. The four graphs shown are sample repetitions carried out on day 0, day 1, day
7 and day 28.
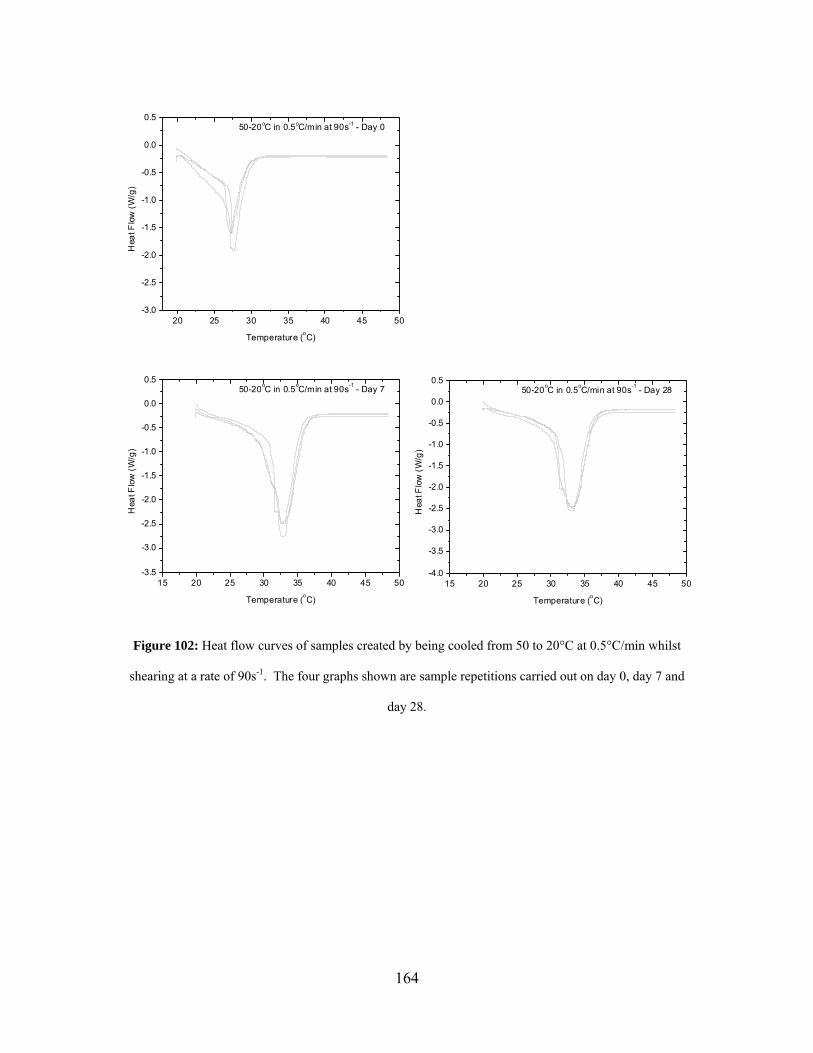
164
20 25 30 35 40 45 50-3.0
-2.5
-2.0
-1.5
-1.0
-0.5
0.0
0.550-20oC in 0.5oC/min at 90s-1 - Day 0
Hea
t Flo
w (W
/g)
Temperature (oC)
15 20 25 30 35 40 45 50-3.5
-3.0
-2.5
-2.0
-1.5
-1.0
-0.5
0.0
0.550-20oC in 0.5oC/min at 90s-1 - Day 7
Hea
t Flo
w (W
/g)
Temperature (oC)
15 20 25 30 35 40 45 50-4.0
-3.5
-3.0
-2.5
-2.0
-1.5
-1.0
-0.5
0.0
0.550-20oC in 0.5oC/min at 90s-1 - Day 28
Hea
t Flo
w (W
/g)
Temperature (oC)
Figure 102: Heat flow curves of samples created by being cooled from 50 to 20°C at 0.5°C/min whilst
shearing at a rate of 90s-1. The four graphs shown are sample repetitions carried out on day 0, day 7 and
day 28.
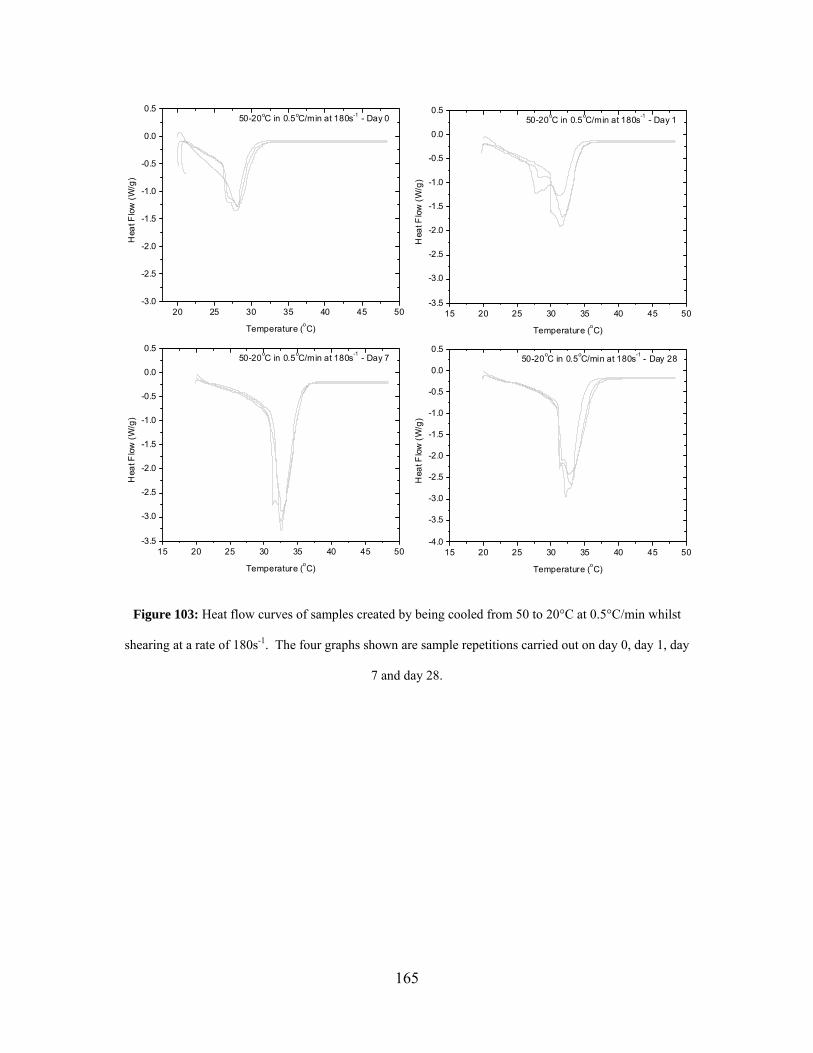
165
20 25 30 35 40 45 50-3.0
-2.5
-2.0
-1.5
-1.0
-0.5
0.0
0.550-20oC in 0.5oC/min at 180s-1 - Day 0
Hea
t Flo
w (W
/g)
Temperature (oC)
15 20 25 30 35 40 45 50-3.5
-3.0
-2.5
-2.0
-1.5
-1.0
-0.5
0.0
0.550-20oC in 0.5oC/min at 180s-1 - Day 1
Hea
t Flo
w (W
/g)
Temperature (oC)
15 20 25 30 35 40 45 50-3.5
-3.0
-2.5
-2.0
-1.5
-1.0
-0.5
0.0
0.550-20oC in 0.5oC/min at 180s-1 - Day 7
Hea
t Flo
w (W
/g)
Temperature (oC)
15 20 25 30 35 40 45 50-4.0
-3.5
-3.0
-2.5
-2.0
-1.5
-1.0
-0.5
0.0
0.550-20oC in 0.5oC/min at 180s-1 - Day 28
Hea
t Flo
w (W
/g)
Temperature (oC)
Figure 103: Heat flow curves of samples created by being cooled from 50 to 20°C at 0.5°C/min whilst
shearing at a rate of 180s-1. The four graphs shown are sample repetitions carried out on day 0, day 1, day
7 and day 28.
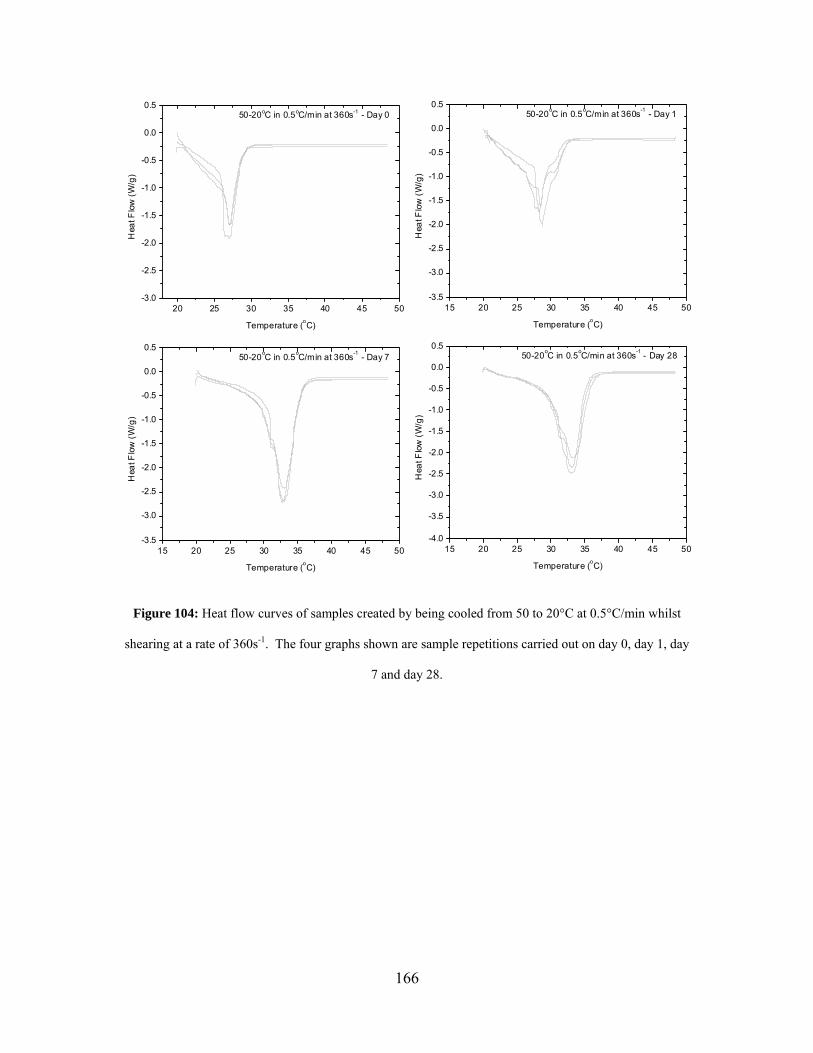
166
20 25 30 35 40 45 50-3.0
-2.5
-2.0
-1.5
-1.0
-0.5
0.0
0.550-20oC in 0.5oC/min at 360s-1 - Day 0
Hea
t Flo
w (W
/g)
Temperature (oC)
15 20 25 30 35 40 45 50-3.5
-3.0
-2.5
-2.0
-1.5
-1.0
-0.5
0.0
0.550-20oC in 0.5oC/min at 360s-1 - Day 1
Hea
t Flo
w (W
/g)
Temperature (oC)
15 20 25 30 35 40 45 50-3.5
-3.0
-2.5
-2.0
-1.5
-1.0
-0.5
0.0
0.550-20oC in 0.5oC/min at 360s-1 - Day 7
Hea
t Flo
w (W
/g)
Temperature (oC)
15 20 25 30 35 40 45 50-4.0
-3.5
-3.0
-2.5
-2.0
-1.5
-1.0
-0.5
0.0
0.550-20oC in 0.5oC/min at 360s-1 - Day 28
Hea
t Flo
w (W
/g)
Temperature (oC)
Figure 104: Heat flow curves of samples created by being cooled from 50 to 20°C at 0.5°C/min whilst
shearing at a rate of 360s-1. The four graphs shown are sample repetitions carried out on day 0, day 1, day
7 and day 28.
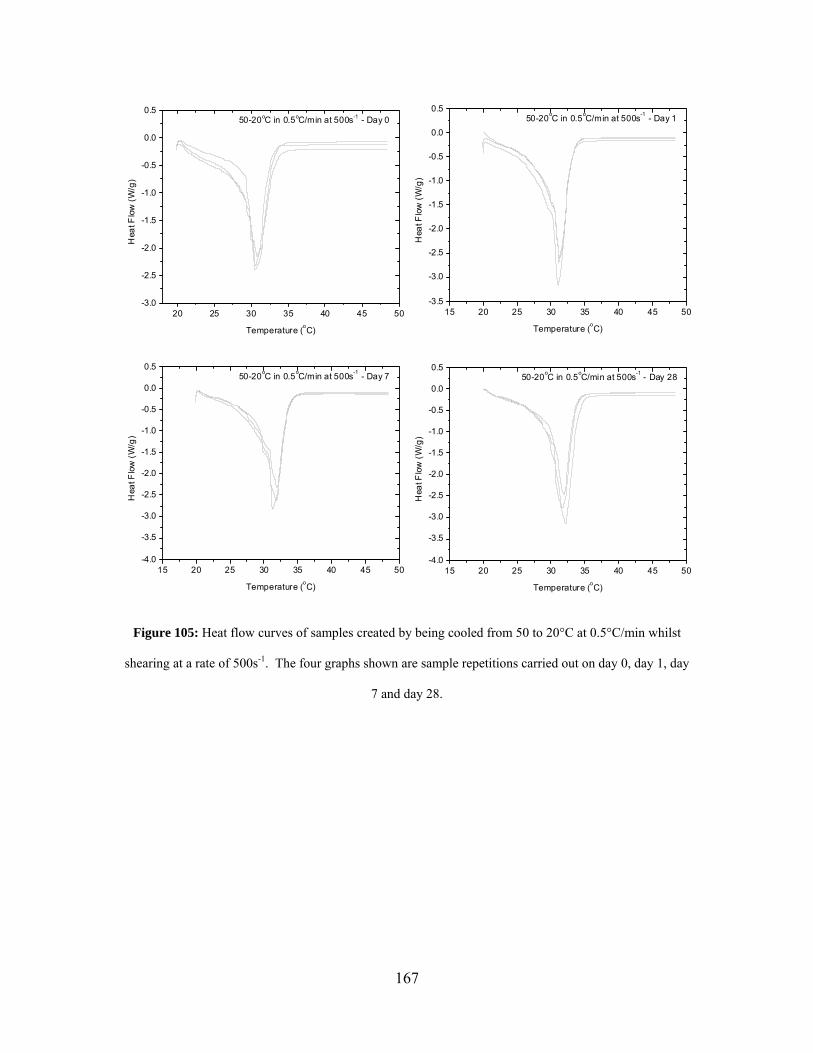
167
20 25 30 35 40 45 50-3.0
-2.5
-2.0
-1.5
-1.0
-0.5
0.0
0.550-20oC in 0.5oC/min at 500s-1 - Day 0
Hea
t Flo
w (W
/g)
Temperature (oC)
15 20 25 30 35 40 45 50-3.5
-3.0
-2.5
-2.0
-1.5
-1.0
-0.5
0.0
0.550-20oC in 0.5oC/min at 500s-1 - Day 1
Hea
t Flo
w (W
/g)
Temperature (oC)
15 20 25 30 35 40 45 50-4.0
-3.5
-3.0
-2.5
-2.0
-1.5
-1.0
-0.5
0.0
0.550-20oC in 0.5oC/min at 500s-1 - Day 7
Hea
t Flo
w (W
/g)
Temperature (oC)
15 20 25 30 35 40 45 50-4.0
-3.5
-3.0
-2.5
-2.0
-1.5
-1.0
-0.5
0.0
0.550-20oC in 0.5oC/min at 500s-1 - Day 28
Hea
t Flo
w (W
/g)
Temperature (oC)
Figure 105: Heat flow curves of samples created by being cooled from 50 to 20°C at 0.5°C/min whilst
shearing at a rate of 500s-1. The four graphs shown are sample repetitions carried out on day 0, day 1, day
7 and day 28.
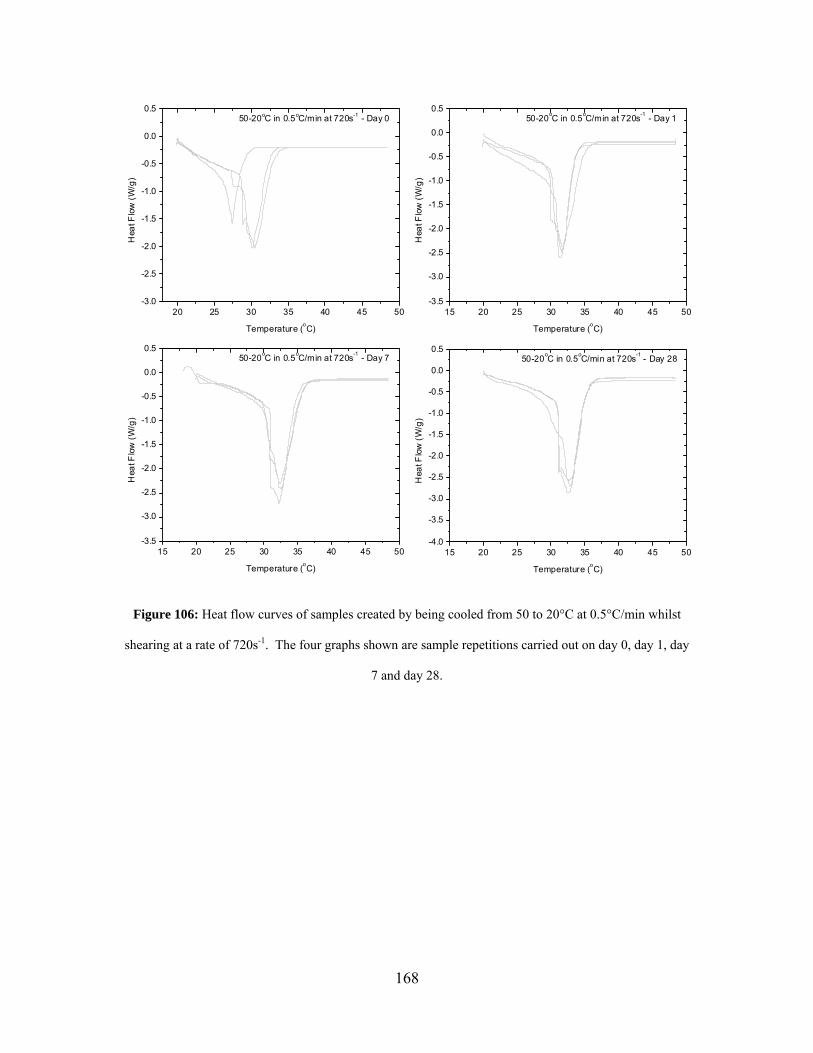
168
20 25 30 35 40 45 50-3.0
-2.5
-2.0
-1.5
-1.0
-0.5
0.0
0.550-20oC in 0.5oC/min at 720s-1 - Day 0
Hea
t Flo
w (W
/g)
Temperature (oC)
15 20 25 30 35 40 45 50-3.5
-3.0
-2.5
-2.0
-1.5
-1.0
-0.5
0.0
0.550-20oC in 0.5oC/min at 720s-1 - Day 1
Hea
t Flo
w (W
/g)
Temperature (oC)
15 20 25 30 35 40 45 50-3.5
-3.0
-2.5
-2.0
-1.5
-1.0
-0.5
0.0
0.550-20oC in 0.5oC/min at 720s-1 - Day 7
Hea
t Flo
w (W
/g)
Temperature (oC)
15 20 25 30 35 40 45 50-4.0
-3.5
-3.0
-2.5
-2.0
-1.5
-1.0
-0.5
0.0
0.550-20oC in 0.5oC/min at 720s-1 - Day 28
Hea
t Flo
w (W
/g)
Temperature (oC)
Figure 106: Heat flow curves of samples created by being cooled from 50 to 20°C at 0.5°C/min whilst
shearing at a rate of 720s-1. The four graphs shown are sample repetitions carried out on day 0, day 1, day
7 and day 28.
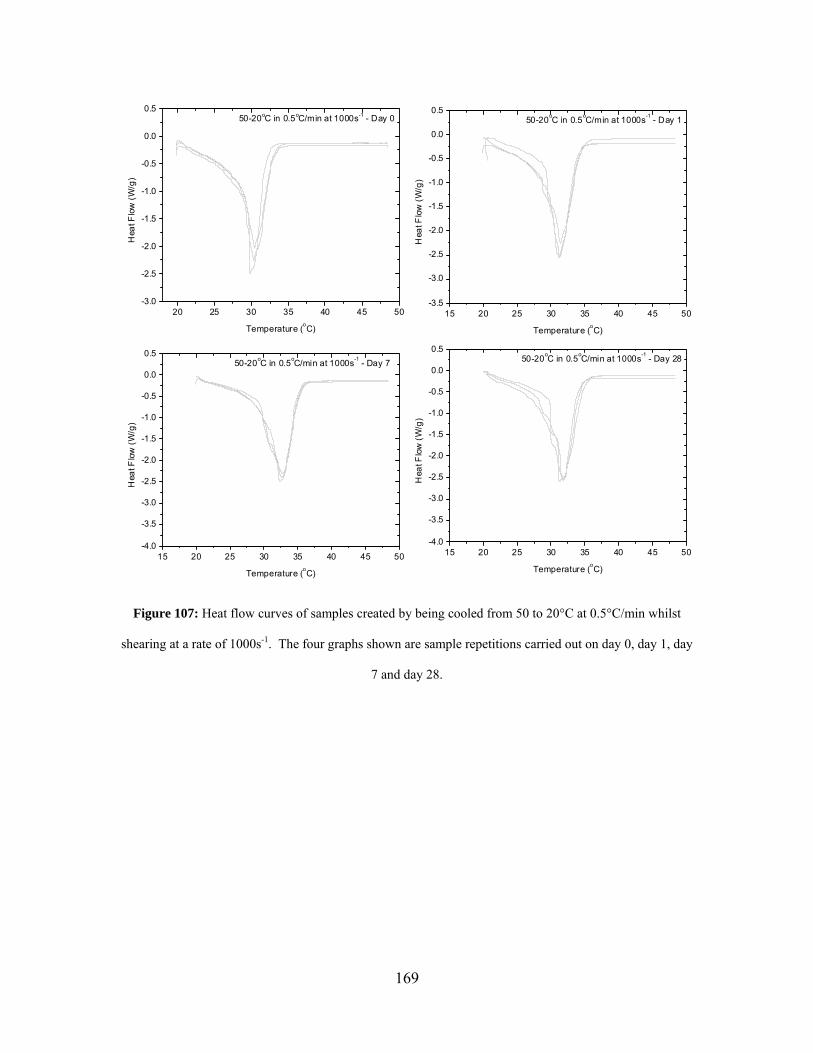
169
20 25 30 35 40 45 50-3.0
-2.5
-2.0
-1.5
-1.0
-0.5
0.0
0.550-20oC in 0.5oC/min at 1000s-1 - Day 0
Hea
t Flo
w (W
/g)
Temperature (oC)
15 20 25 30 35 40 45 50-3.5
-3.0
-2.5
-2.0
-1.5
-1.0
-0.5
0.0
0.550-20oC in 0.5oC/min at 1000s-1 - Day 1
Hea
t Flo
w (W
/g)
Temperature (oC)
15 20 25 30 35 40 45 50-4.0
-3.5
-3.0
-2.5
-2.0
-1.5
-1.0
-0.5
0.0
0.550-20oC in 0.5oC/min at 1000s-1 - Day 7
Hea
t Flo
w (W
/g)
Temperature (oC)
15 20 25 30 35 40 45 50-4.0
-3.5
-3.0
-2.5
-2.0
-1.5
-1.0
-0.5
0.0
0.550-20oC in 0.5oC/min at 1000s-1 - Day 28
Hea
t Flo
w (W
/g)
Temperature (oC)
Figure 107: Heat flow curves of samples created by being cooled from 50 to 20°C at 0.5°C/min whilst
shearing at a rate of 1000s-1. The four graphs shown are sample repetitions carried out on day 0, day 1, day
7 and day 28.
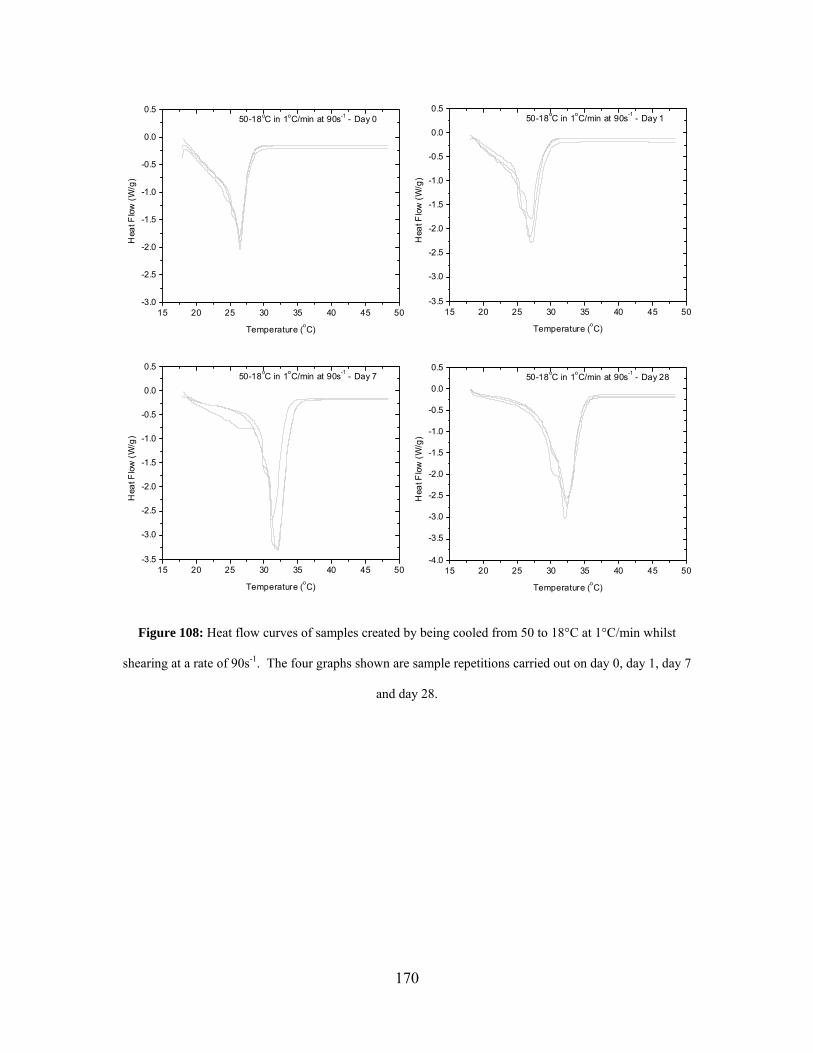
170
15 20 25 30 35 40 45 50-3.0
-2.5
-2.0
-1.5
-1.0
-0.5
0.0
0.550-18oC in 1oC/min at 90s-1 - Day 0
Hea
t Flo
w (W
/g)
Temperature (oC)
15 20 25 30 35 40 45 50-3.5
-3.0
-2.5
-2.0
-1.5
-1.0
-0.5
0.0
0.550-18oC in 1oC/min at 90s-1 - Day 1
Hea
t Flo
w (W
/g)
Temperature (oC)
15 20 25 30 35 40 45 50-3.5
-3.0
-2.5
-2.0
-1.5
-1.0
-0.5
0.0
0.550-18oC in 1oC/min at 90s-1 - Day 7
Hea
t Flo
w (W
/g)
Temperature (oC)
15 20 25 30 35 40 45 50-4.0
-3.5
-3.0
-2.5
-2.0
-1.5
-1.0
-0.5
0.0
0.550-18oC in 1oC/min at 90s-1 - Day 28
Hea
t Flo
w (W
/g)
Temperature (oC)
Figure 108: Heat flow curves of samples created by being cooled from 50 to 18°C at 1°C/min whilst
shearing at a rate of 90s-1. The four graphs shown are sample repetitions carried out on day 0, day 1, day 7
and day 28.
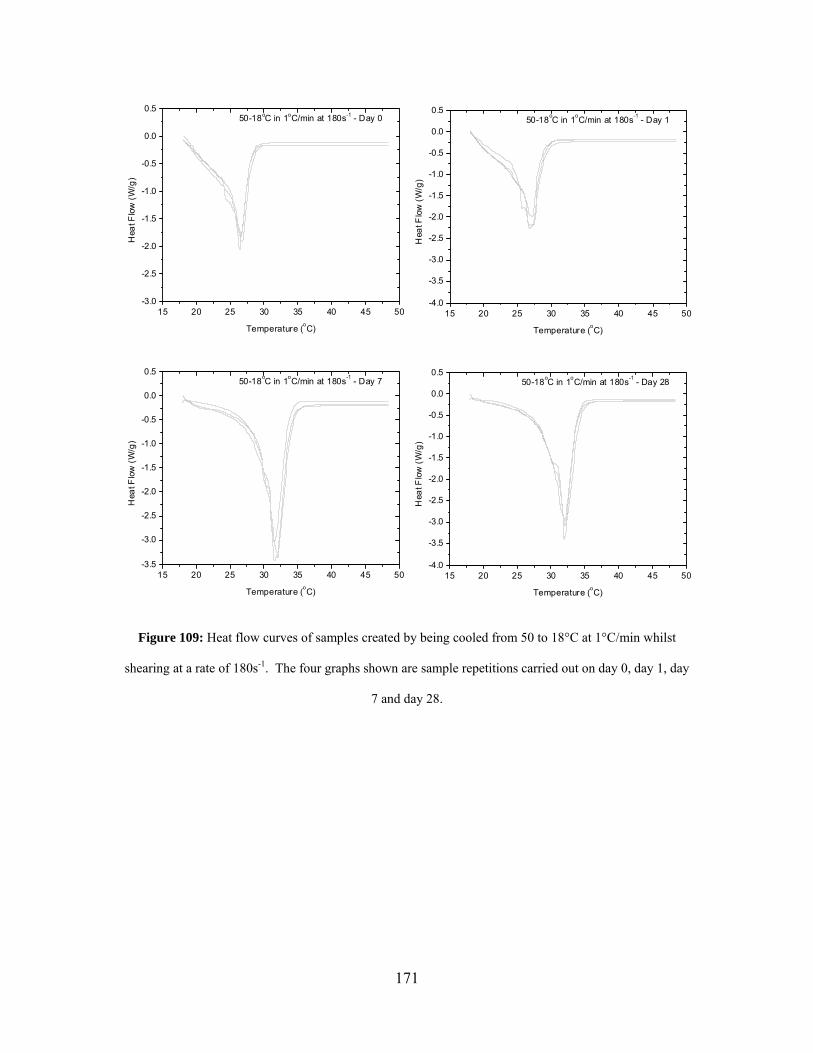
171
15 20 25 30 35 40 45 50-3.0
-2.5
-2.0
-1.5
-1.0
-0.5
0.0
0.550-18oC in 1oC/min at 180s-1 - Day 0
Hea
t Flo
w (W
/g)
Temperature (oC)
15 20 25 30 35 40 45 50-4.0
-3.5
-3.0
-2.5
-2.0
-1.5
-1.0
-0.5
0.0
0.550-18oC in 1oC/min at 180s-1 - Day 1
Hea
t Flo
w (W
/g)
Temperature (oC)
15 20 25 30 35 40 45 50-3.5
-3.0
-2.5
-2.0
-1.5
-1.0
-0.5
0.0
0.550-18oC in 1oC/min at 180s-1 - Day 7
Hea
t Flo
w (W
/g)
Temperature (oC)
15 20 25 30 35 40 45 50-4.0
-3.5
-3.0
-2.5
-2.0
-1.5
-1.0
-0.5
0.0
0.550-18oC in 1oC/min at 180s-1 - Day 28
Hea
t Flo
w (W
/g)
Temperature (oC)
Figure 109: Heat flow curves of samples created by being cooled from 50 to 18°C at 1°C/min whilst
shearing at a rate of 180s-1. The four graphs shown are sample repetitions carried out on day 0, day 1, day
7 and day 28.
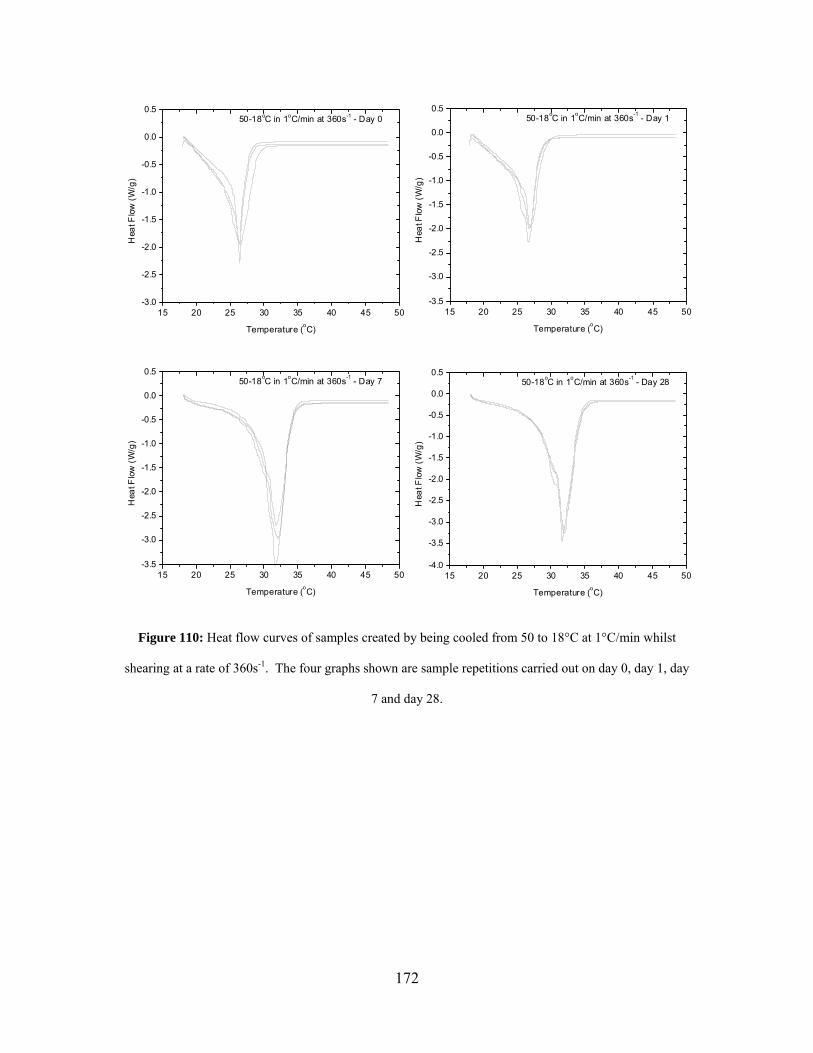
172
15 20 25 30 35 40 45 50-3.0
-2.5
-2.0
-1.5
-1.0
-0.5
0.0
0.550-18oC in 1oC/min at 360s-1 - Day 0
Hea
t Flo
w (W
/g)
Temperature (oC)
15 20 25 30 35 40 45 50-3.5
-3.0
-2.5
-2.0
-1.5
-1.0
-0.5
0.0
0.550-18oC in 1oC/min at 360s-1 - Day 1
Hea
t Flo
w (W
/g)
Temperature (oC)
15 20 25 30 35 40 45 50-3.5
-3.0
-2.5
-2.0
-1.5
-1.0
-0.5
0.0
0.550-18oC in 1oC/min at 360s-1 - Day 7
Hea
t Flo
w (W
/g)
Temperature (oC)
15 20 25 30 35 40 45 50-4.0
-3.5
-3.0
-2.5
-2.0
-1.5
-1.0
-0.5
0.0
0.550-18oC in 1oC/min at 360s-1 - Day 28
Hea
t Flo
w (W
/g)
Temperature (oC)
Figure 110: Heat flow curves of samples created by being cooled from 50 to 18°C at 1°C/min whilst
shearing at a rate of 360s-1. The four graphs shown are sample repetitions carried out on day 0, day 1, day
7 and day 28.
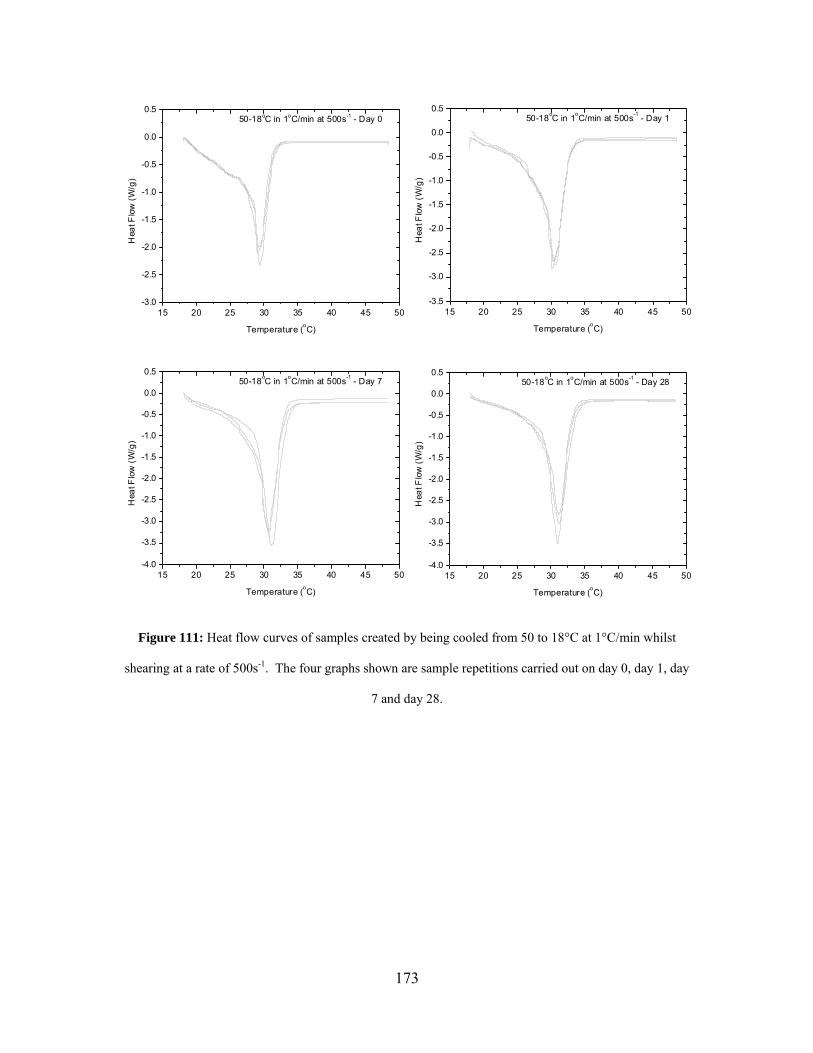
173
15 20 25 30 35 40 45 50-3.0
-2.5
-2.0
-1.5
-1.0
-0.5
0.0
0.550-18oC in 1oC/min at 500s-1 - Day 0
Hea
t Flo
w (W
/g)
Temperature (oC)
15 20 25 30 35 40 45 50-3.5
-3.0
-2.5
-2.0
-1.5
-1.0
-0.5
0.0
0.550-18oC in 1oC/min at 500s-1 - Day 1
Hea
t Flo
w (W
/g)
Temperature (oC)
15 20 25 30 35 40 45 50-4.0
-3.5
-3.0
-2.5
-2.0
-1.5
-1.0
-0.5
0.0
0.550-18oC in 1oC/min at 500s-1 - Day 7
Hea
t Flo
w (W
/g)
Temperature (oC)
15 20 25 30 35 40 45 50-4.0
-3.5
-3.0
-2.5
-2.0
-1.5
-1.0
-0.5
0.0
0.550-18oC in 1oC/min at 500s-1 - Day 28
Hea
t Flo
w (W
/g)
Temperature (oC)
Figure 111: Heat flow curves of samples created by being cooled from 50 to 18°C at 1°C/min whilst
shearing at a rate of 500s-1. The four graphs shown are sample repetitions carried out on day 0, day 1, day
7 and day 28.

174
15 20 25 30 35 40 45 50-3.0
-2.5
-2.0
-1.5
-1.0
-0.5
0.0
0.550-18oC in 1oC/min at 720s-1 - Day 0
Hea
t Flo
w (W
/g)
Temperature (oC)
15 20 25 30 35 40 45 50-3.5
-3.0
-2.5
-2.0
-1.5
-1.0
-0.5
0.0
0.550-18oC in 1oC/min at 720s-1 - Day 1
Hea
t Flo
w (W
/g)
Temperature (oC)
15 20 25 30 35 40 45 50-4.0
-3.5
-3.0
-2.5
-2.0
-1.5
-1.0
-0.5
0.0
0.550-18oC in 1oC/min at 720s-1 - Day 7
Hea
t Flo
w (W
/g)
Temperature (oC)
15 20 25 30 35 40 45 50-4.0
-3.5
-3.0
-2.5
-2.0
-1.5
-1.0
-0.5
0.0
0.550-18oC in 1oC/min at 720s-1 - Day 28
Hea
t Flo
w (W
/g)
Temperature (oC)
Figure 112: Heat flow curves of samples created by being cooled from 50 to 18°C at 1°C/min whilst
shearing at a rate of 720s-1. The four graphs shown are sample repetitions carried out on day 0, day 1, day
7 and day 28.
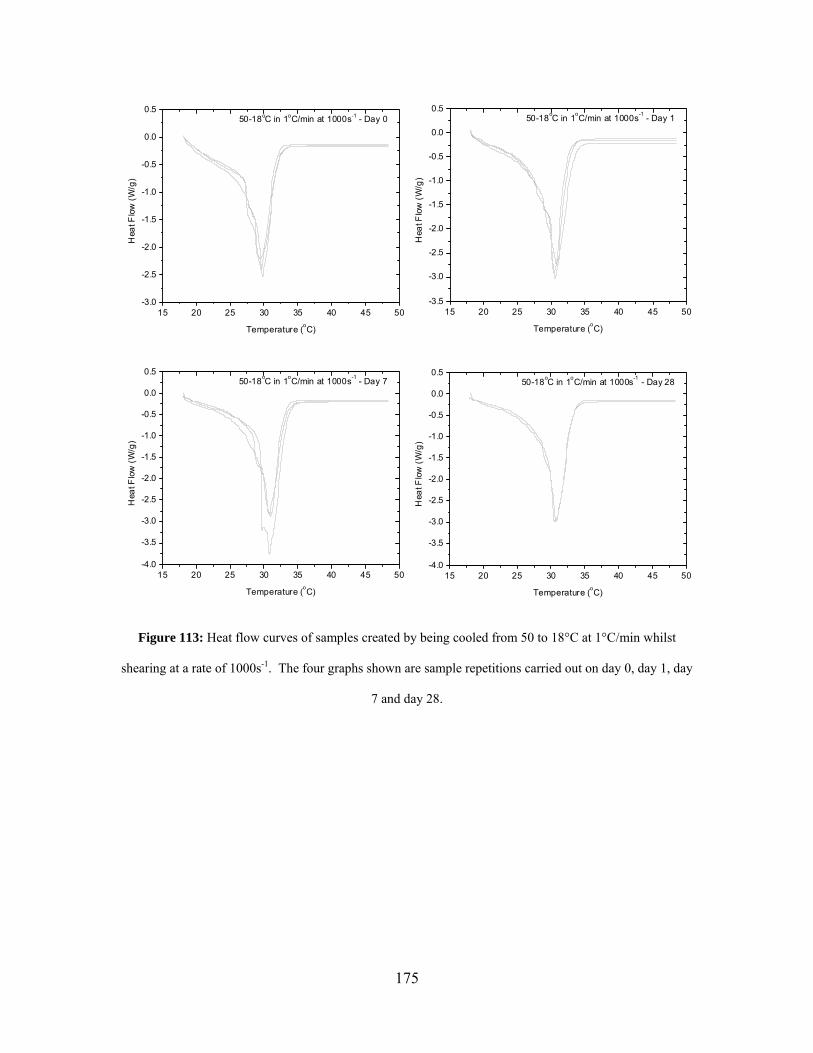
175
15 20 25 30 35 40 45 50-3.0
-2.5
-2.0
-1.5
-1.0
-0.5
0.0
0.550-18oC in 1oC/min at 1000s-1 - Day 0
Hea
t Flo
w (W
/g)
Temperature (oC)
15 20 25 30 35 40 45 50-3.5
-3.0
-2.5
-2.0
-1.5
-1.0
-0.5
0.0
0.550-18oC in 1oC/min at 1000s-1 - Day 1
Hea
t Flo
w (W
/g)
Temperature (oC)
15 20 25 30 35 40 45 50-4.0
-3.5
-3.0
-2.5
-2.0
-1.5
-1.0
-0.5
0.0
0.550-18oC in 1oC/min at 1000s-1 - Day 7
Hea
t Flo
w (W
/g)
Temperature (oC)
15 20 25 30 35 40 45 50-4.0
-3.5
-3.0
-2.5
-2.0
-1.5
-1.0
-0.5
0.0
0.550-18oC in 1oC/min at 1000s-1 - Day 28
Hea
t Flo
w (W
/g)
Temperature (oC)
Figure 113: Heat flow curves of samples created by being cooled from 50 to 18°C at 1°C/min whilst
shearing at a rate of 1000s-1. The four graphs shown are sample repetitions carried out on day 0, day 1, day
7 and day 28.
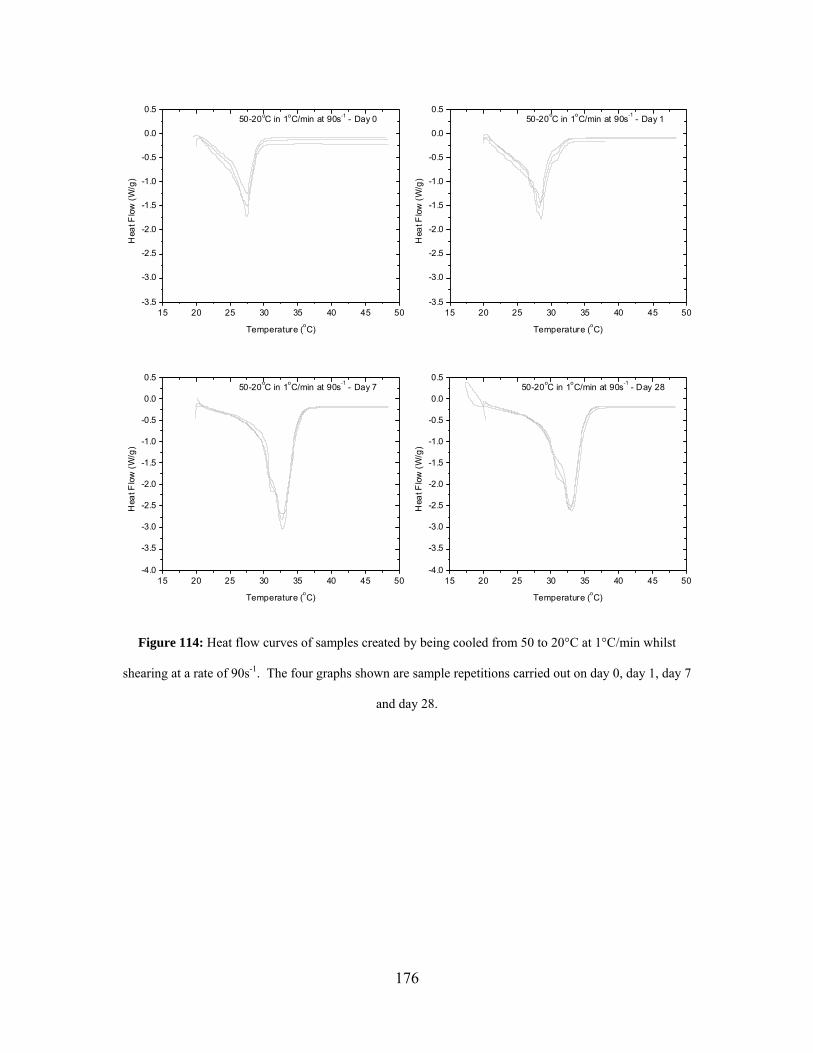
176
15 20 25 30 35 40 45 50-3.5
-3.0
-2.5
-2.0
-1.5
-1.0
-0.5
0.0
0.550-20oC in 1oC/min at 90s-1 - Day 0
Hea
t Flo
w (W
/g)
Temperature (oC)
15 20 25 30 35 40 45 50-3.5
-3.0
-2.5
-2.0
-1.5
-1.0
-0.5
0.0
0.550-20oC in 1oC/min at 90s-1 - Day 1
Hea
t Flo
w (W
/g)
Temperature (oC)
15 20 25 30 35 40 45 50-4.0
-3.5
-3.0
-2.5
-2.0
-1.5
-1.0
-0.5
0.0
0.550-20oC in 1oC/min at 90s-1 - Day 7
Hea
t Flo
w (W
/g)
Temperature (oC)
15 20 25 30 35 40 45 50-4.0
-3.5
-3.0
-2.5
-2.0
-1.5
-1.0
-0.5
0.0
0.550-20oC in 1oC/min at 90s-1 - Day 28
Hea
t Flo
w (W
/g)
Temperature (oC)
Figure 114: Heat flow curves of samples created by being cooled from 50 to 20°C at 1°C/min whilst
shearing at a rate of 90s-1. The four graphs shown are sample repetitions carried out on day 0, day 1, day 7
and day 28.
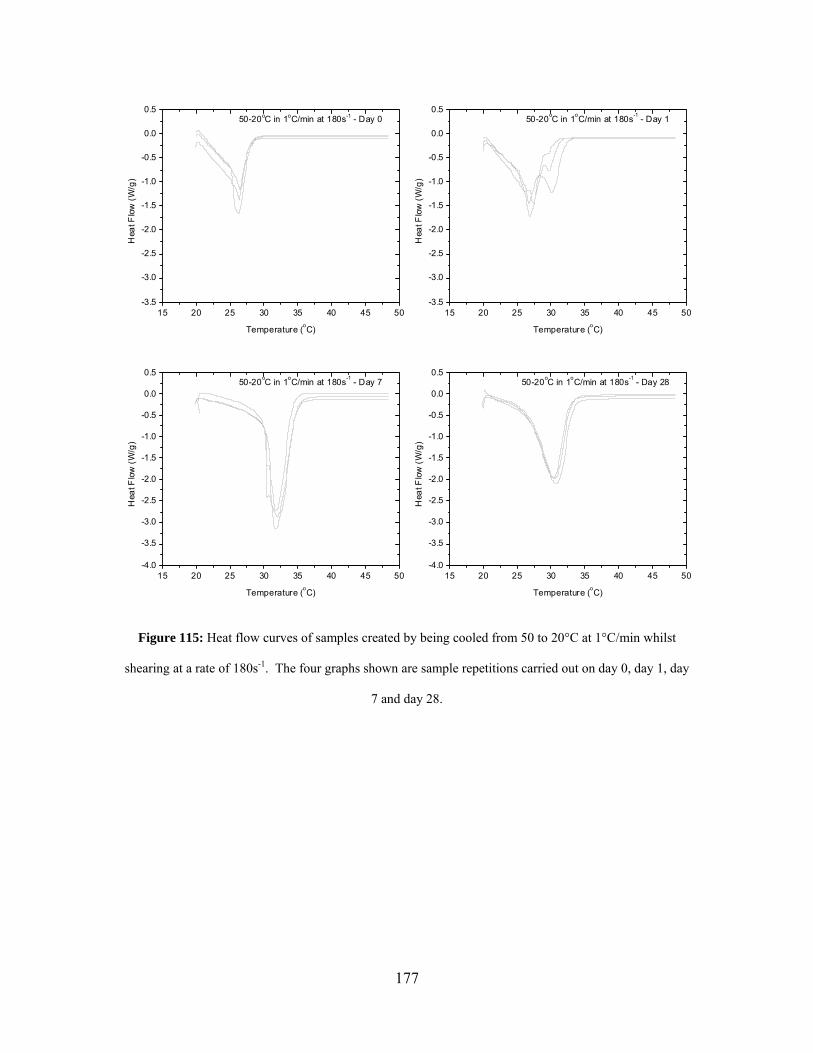
177
15 20 25 30 35 40 45 50-3.5
-3.0
-2.5
-2.0
-1.5
-1.0
-0.5
0.0
0.550-20oC in 1oC/min at 180s-1 - Day 0
Hea
t Flo
w (W
/g)
Temperature (oC)
15 20 25 30 35 40 45 50-3.5
-3.0
-2.5
-2.0
-1.5
-1.0
-0.5
0.0
0.550-20oC in 1oC/min at 180s-1 - Day 1
Hea
t Flo
w (W
/g)
Temperature (oC)
15 20 25 30 35 40 45 50-4.0
-3.5
-3.0
-2.5
-2.0
-1.5
-1.0
-0.5
0.0
0.550-20oC in 1oC/min at 180s-1 - Day 7
Hea
t Flo
w (W
/g)
Temperature (oC)
15 20 25 30 35 40 45 50-4.0
-3.5
-3.0
-2.5
-2.0
-1.5
-1.0
-0.5
0.0
0.550-20oC in 1oC/min at 180s-1 - Day 28
Hea
t Flo
w (W
/g)
Temperature (oC)
Figure 115: Heat flow curves of samples created by being cooled from 50 to 20°C at 1°C/min whilst
shearing at a rate of 180s-1. The four graphs shown are sample repetitions carried out on day 0, day 1, day
7 and day 28.

178
15 20 25 30 35 40 45 50-3.5
-3.0
-2.5
-2.0
-1.5
-1.0
-0.5
0.0
0.550-20oC in 1oC/min at 360s-1 - Day 0
Hea
t Flo
w (W
/g)
Temperature (oC)
15 20 25 30 35 40 45 50-3.5
-3.0
-2.5
-2.0
-1.5
-1.0
-0.5
0.0
0.550-20oC in 1oC/min at 360s-1 - Day 1
Hea
t Flo
w (W
/g)
Temperature (oC)
15 20 25 30 35 40 45 50-4.0
-3.5
-3.0
-2.5
-2.0
-1.5
-1.0
-0.5
0.0
0.550-20oC in 1oC/min at 360s-1 - Day 7
Hea
t Flo
w (W
/g)
Temperature (oC)
15 20 25 30 35 40 45 50-4.0
-3.5
-3.0
-2.5
-2.0
-1.5
-1.0
-0.5
0.0
0.550-20oC in 1oC/min at 360s-1 - Day 28
Hea
t Flo
w (W
/g)
Temperature (oC)
Figure 116: Heat flow curves of samples created by being cooled from 50 to 20°C at 1°C/min whilst
shearing at a rate of 360s-1. The four graphs shown are sample repetitions carried out on day 0, day 1, day
7 and day 28.
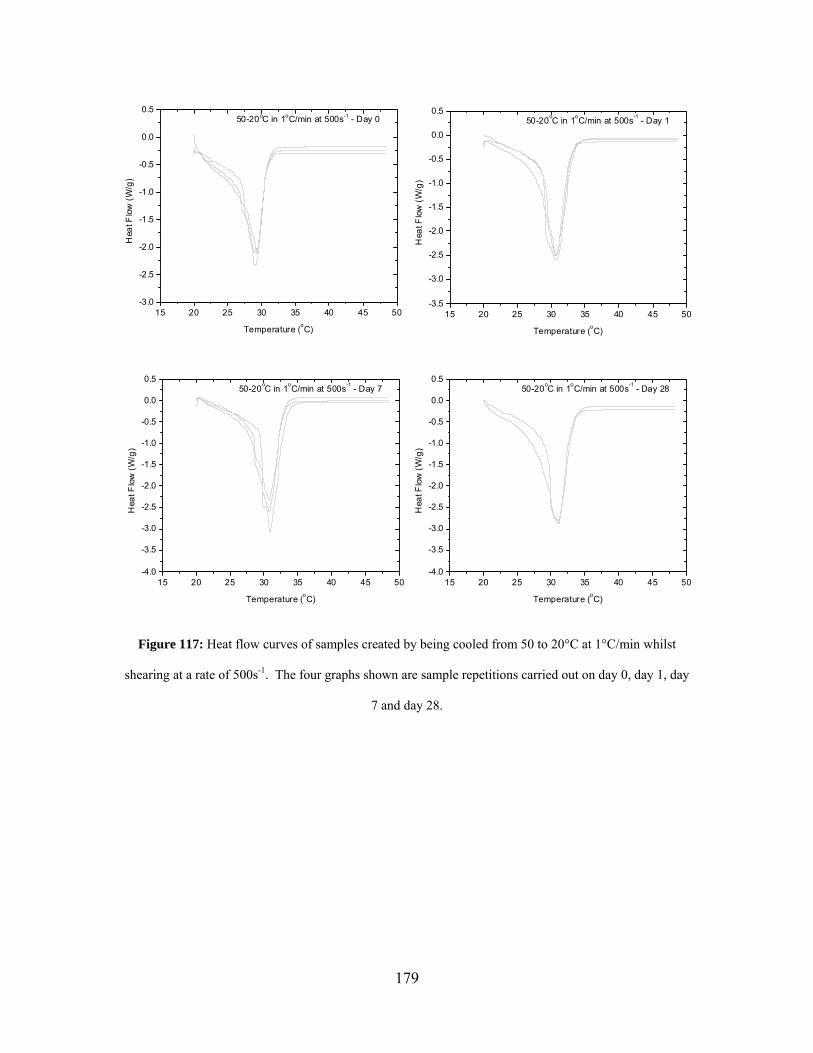
179
15 20 25 30 35 40 45 50-3.0
-2.5
-2.0
-1.5
-1.0
-0.5
0.0
0.550-20oC in 1oC/min at 500s-1 - Day 0
Hea
t Flo
w (W
/g)
Temperature (oC)
15 20 25 30 35 40 45 50-3.5
-3.0
-2.5
-2.0
-1.5
-1.0
-0.5
0.0
0.550-20oC in 1oC/min at 500s-1 - Day 1
Hea
t Flo
w (W
/g)
Temperature (oC)
15 20 25 30 35 40 45 50-4.0
-3.5
-3.0
-2.5
-2.0
-1.5
-1.0
-0.5
0.0
0.550-20oC in 1oC/min at 500s-1 - Day 7
Hea
t Flo
w (W
/g)
Temperature (oC)
15 20 25 30 35 40 45 50-4.0
-3.5
-3.0
-2.5
-2.0
-1.5
-1.0
-0.5
0.0
0.550-20oC in 1oC/min at 500s-1 - Day 28
Hea
t Flo
w (W
/g)
Temperature (oC)
Figure 117: Heat flow curves of samples created by being cooled from 50 to 20°C at 1°C/min whilst
shearing at a rate of 500s-1. The four graphs shown are sample repetitions carried out on day 0, day 1, day
7 and day 28.
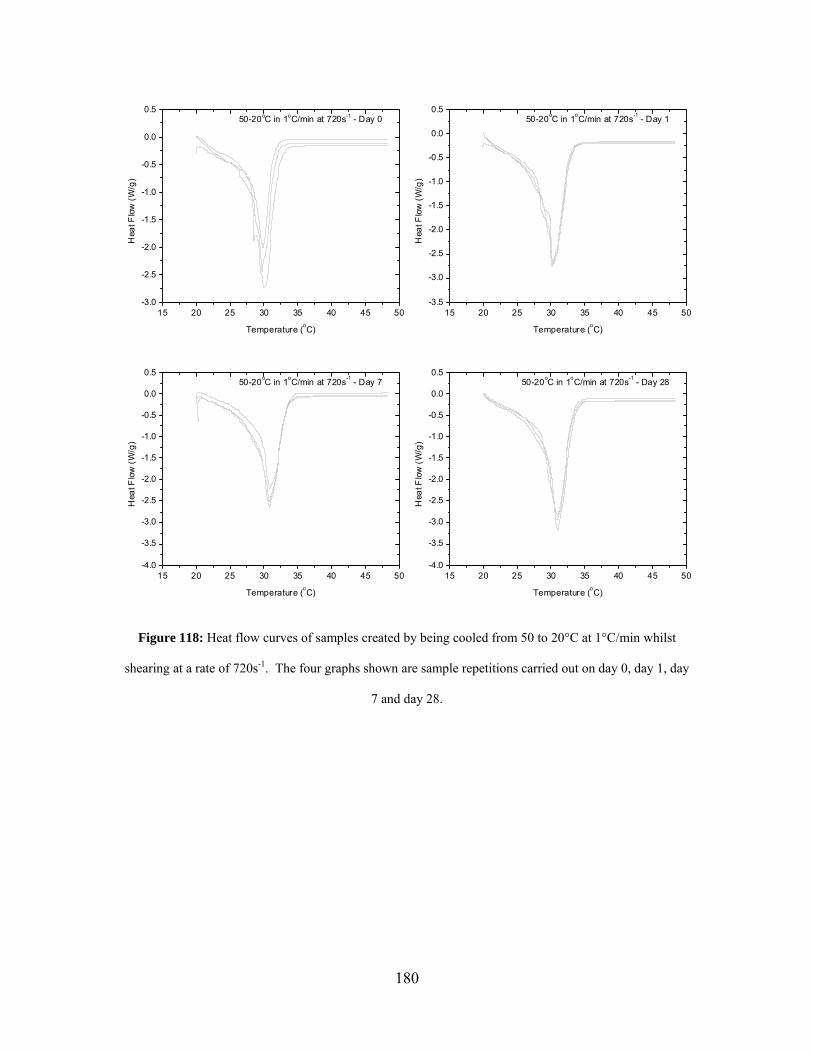
180
15 20 25 30 35 40 45 50-3.0
-2.5
-2.0
-1.5
-1.0
-0.5
0.0
0.550-20oC in 1oC/min at 720s-1 - Day 0
Hea
t Flo
w (W
/g)
Temperature (oC)
15 20 25 30 35 40 45 50-3.5
-3.0
-2.5
-2.0
-1.5
-1.0
-0.5
0.0
0.550-20oC in 1oC/min at 720s-1 - Day 1
Hea
t Flo
w (W
/g)
Temperature (oC)
15 20 25 30 35 40 45 50-4.0
-3.5
-3.0
-2.5
-2.0
-1.5
-1.0
-0.5
0.0
0.550-20oC in 1oC/min at 720s-1 - Day 7
Hea
t Flo
w (W
/g)
Temperature (oC)
15 20 25 30 35 40 45 50-4.0
-3.5
-3.0
-2.5
-2.0
-1.5
-1.0
-0.5
0.0
0.550-20oC in 1oC/min at 720s-1 - Day 28
Hea
t Flo
w (W
/g)
Temperature (oC)
Figure 118: Heat flow curves of samples created by being cooled from 50 to 20°C at 1°C/min whilst
shearing at a rate of 720s-1. The four graphs shown are sample repetitions carried out on day 0, day 1, day
7 and day 28.
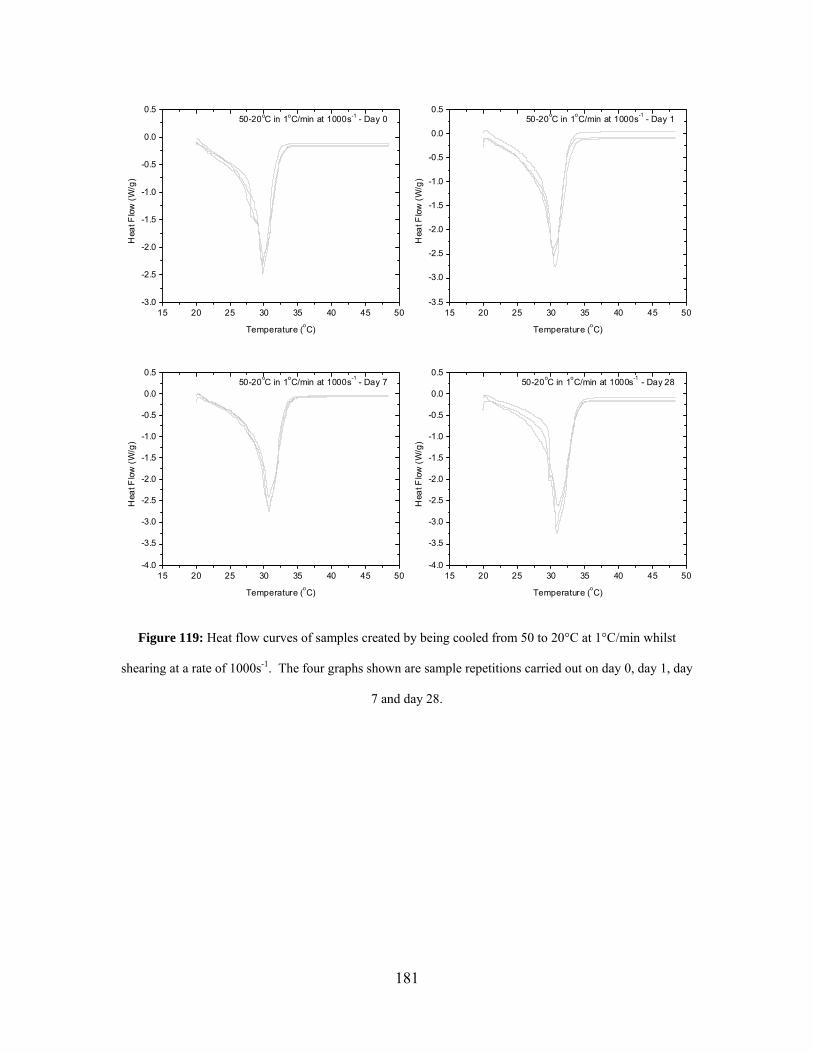
181
15 20 25 30 35 40 45 50-3.0
-2.5
-2.0
-1.5
-1.0
-0.5
0.0
0.550-20oC in 1oC/min at 1000s-1 - Day 0
Hea
t Flo
w (W
/g)
Temperature (oC)
15 20 25 30 35 40 45 50-3.5
-3.0
-2.5
-2.0
-1.5
-1.0
-0.5
0.0
0.550-20oC in 1oC/min at 1000s-1 - Day 1
Hea
t Flo
w (W
/g)
Temperature (oC)
15 20 25 30 35 40 45 50-4.0
-3.5
-3.0
-2.5
-2.0
-1.5
-1.0
-0.5
0.0
0.550-20oC in 1oC/min at 1000s-1 - Day 7
Hea
t Flo
w (W
/g)
Temperature (oC)
15 20 25 30 35 40 45 50-4.0
-3.5
-3.0
-2.5
-2.0
-1.5
-1.0
-0.5
0.0
0.550-20oC in 1oC/min at 1000s-1 - Day 28
Hea
t Flo
w (W
/g)
Temperature (oC)
Figure 119: Heat flow curves of samples created by being cooled from 50 to 20°C at 1°C/min whilst
shearing at a rate of 1000s-1. The four graphs shown are sample repetitions carried out on day 0, day 1, day
7 and day 28.
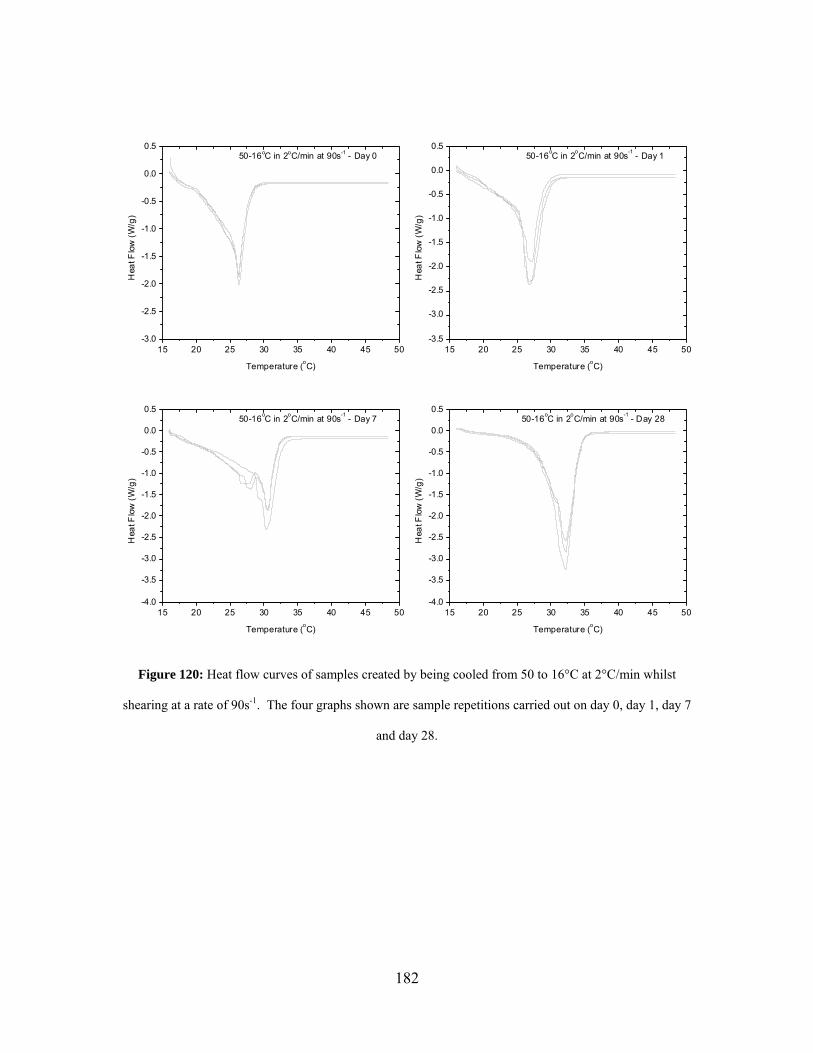
182
15 20 25 30 35 40 45 50-3.0
-2.5
-2.0
-1.5
-1.0
-0.5
0.0
0.550-16oC in 2oC/min at 90s-1 - Day 0
H
eat F
low
(W/g
)
Temperature (oC)
15 20 25 30 35 40 45 50-3.5
-3.0
-2.5
-2.0
-1.5
-1.0
-0.5
0.0
0.550-16oC in 2oC/min at 90s-1 - Day 1
Hea
t Flo
w (W
/g)
Temperature (oC)
15 20 25 30 35 40 45 50-4.0
-3.5
-3.0
-2.5
-2.0
-1.5
-1.0
-0.5
0.0
0.550-16oC in 2oC/min at 90s-1 - Day 7
Hea
t Flo
w (W
/g)
Temperature (oC)
15 20 25 30 35 40 45 50-4.0
-3.5
-3.0
-2.5
-2.0
-1.5
-1.0
-0.5
0.0
0.550-16oC in 2oC/min at 90s-1 - Day 28
Hea
t Flo
w (W
/g)
Temperature (oC)
Figure 120: Heat flow curves of samples created by being cooled from 50 to 16°C at 2°C/min whilst
shearing at a rate of 90s-1. The four graphs shown are sample repetitions carried out on day 0, day 1, day 7
and day 28.
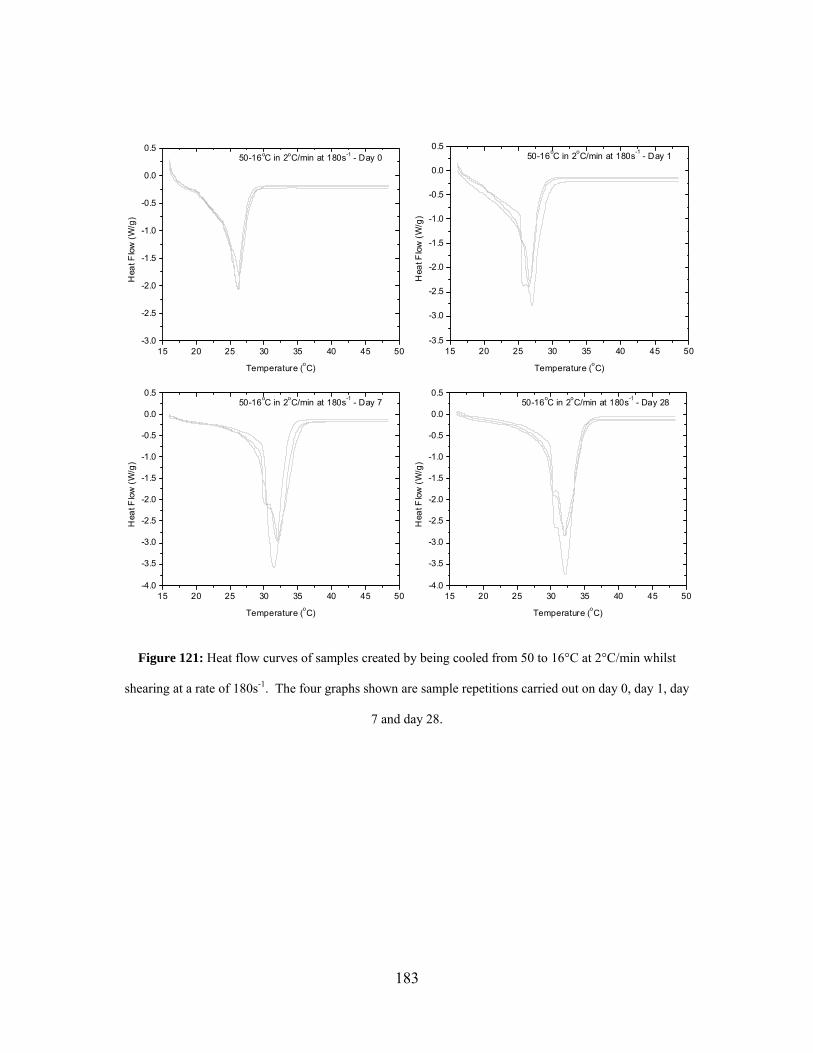
183
15 20 25 30 35 40 45 50-3.0
-2.5
-2.0
-1.5
-1.0
-0.5
0.0
0.550-16oC in 2oC/min at 180s-1 - Day 0
H
eat F
low
(W/g
)
Temperature (oC)
15 20 25 30 35 40 45 50-3.5
-3.0
-2.5
-2.0
-1.5
-1.0
-0.5
0.0
0.550-16oC in 2oC/min at 180s-1 - Day 1
Hea
t Flo
w (W
/g)
Temperature (oC)
15 20 25 30 35 40 45 50-4.0
-3.5
-3.0
-2.5
-2.0
-1.5
-1.0
-0.5
0.0
0.550-16oC in 2oC/min at 180s-1 - Day 7
Hea
t Flo
w (W
/g)
Temperature (oC)
15 20 25 30 35 40 45 50-4.0
-3.5
-3.0
-2.5
-2.0
-1.5
-1.0
-0.5
0.0
0.550-16oC in 2oC/min at 180s-1 - Day 28
Hea
t Flo
w (W
/g)
Temperature (oC)
Figure 121: Heat flow curves of samples created by being cooled from 50 to 16°C at 2°C/min whilst
shearing at a rate of 180s-1. The four graphs shown are sample repetitions carried out on day 0, day 1, day
7 and day 28.
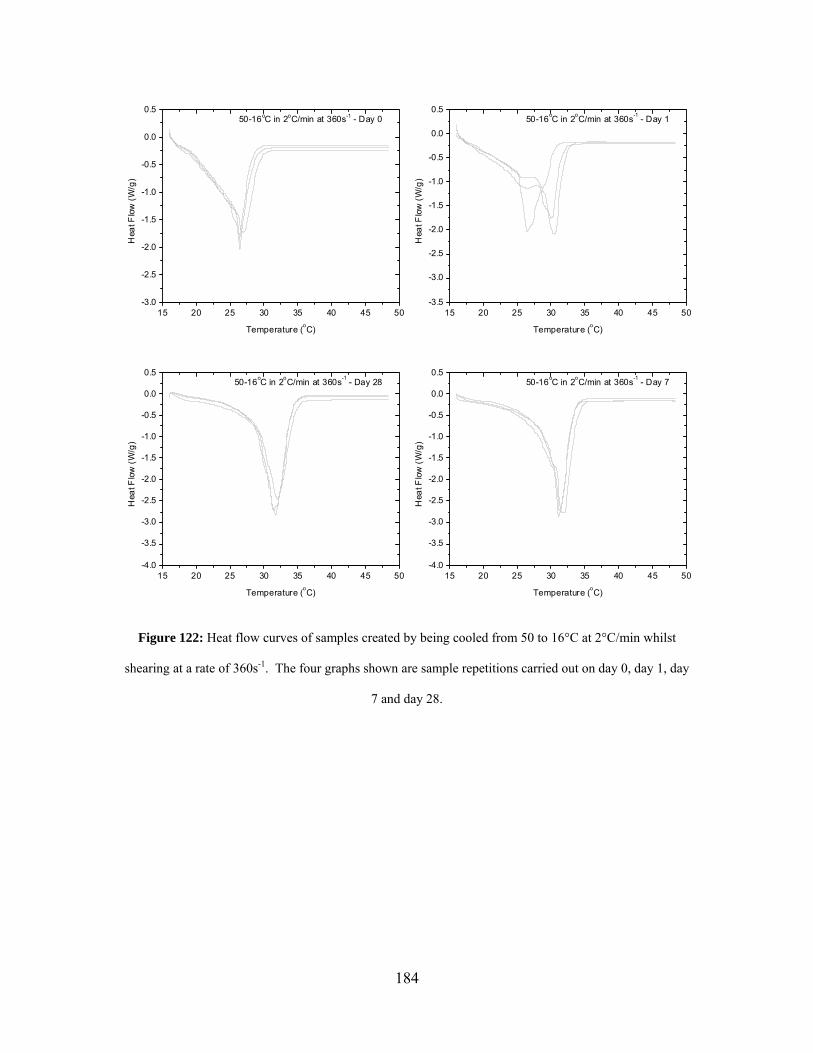
184
15 20 25 30 35 40 45 50-3.0
-2.5
-2.0
-1.5
-1.0
-0.5
0.0
0.550-16oC in 2oC/min at 360s-1 - Day 0
Hea
t Flo
w (W
/g)
Temperature (oC)
15 20 25 30 35 40 45 50-3.5
-3.0
-2.5
-2.0
-1.5
-1.0
-0.5
0.0
0.550-16oC in 2oC/min at 360s-1 - Day 1
Hea
t Flo
w (W
/g)
Temperature (oC)
15 20 25 30 35 40 45 50-4.0
-3.5
-3.0
-2.5
-2.0
-1.5
-1.0
-0.5
0.0
0.550-16oC in 2oC/min at 360s-1 - Day 28
Hea
t Flo
w (W
/g)
Temperature (oC)
15 20 25 30 35 40 45 50-4.0
-3.5
-3.0
-2.5
-2.0
-1.5
-1.0
-0.5
0.0
0.550-16oC in 2oC/min at 360s-1 - Day 7
Hea
t Flo
w (W
/g)
Temperature (oC)
Figure 122: Heat flow curves of samples created by being cooled from 50 to 16°C at 2°C/min whilst
shearing at a rate of 360s-1. The four graphs shown are sample repetitions carried out on day 0, day 1, day
7 and day 28.
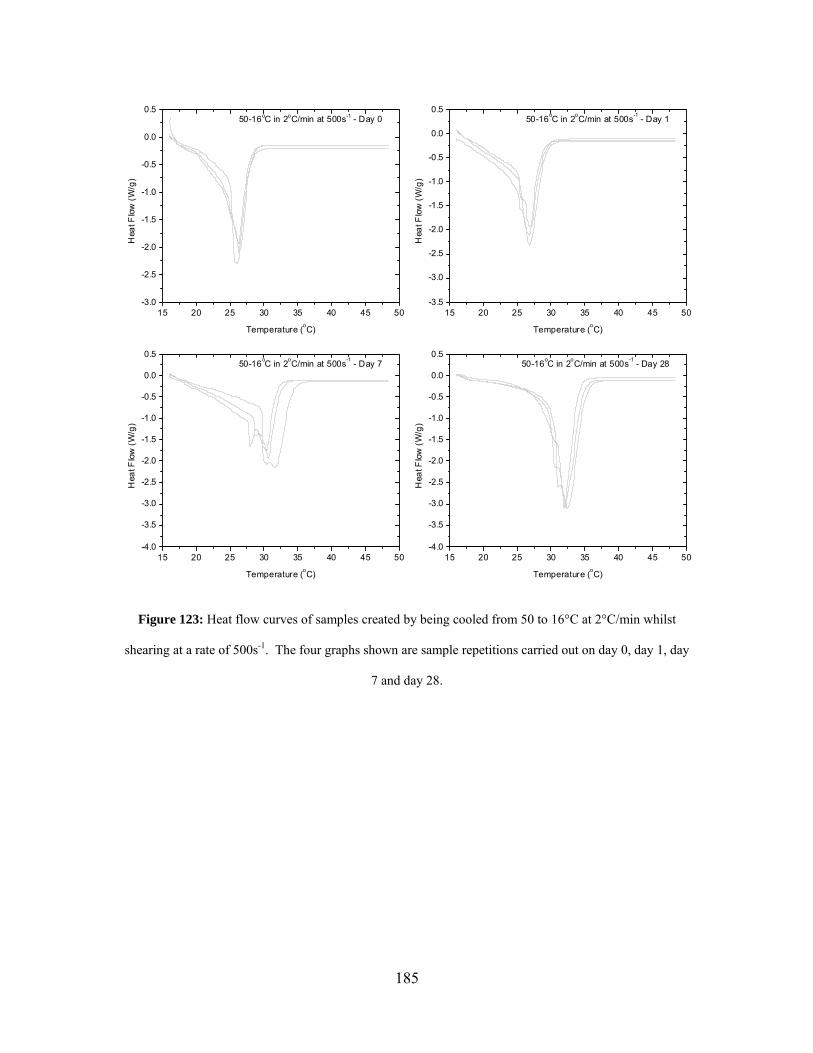
185
15 20 25 30 35 40 45 50-3.0
-2.5
-2.0
-1.5
-1.0
-0.5
0.0
0.550-16oC in 2oC/min at 500s-1 - Day 0
Hea
t Flo
w (W
/g)
Temperature (oC)
15 20 25 30 35 40 45 50-3.5
-3.0
-2.5
-2.0
-1.5
-1.0
-0.5
0.0
0.550-16oC in 2oC/min at 500s-1 - Day 1
Hea
t Flo
w (W
/g)
Temperature (oC)
15 20 25 30 35 40 45 50-4.0
-3.5
-3.0
-2.5
-2.0
-1.5
-1.0
-0.5
0.0
0.550-16oC in 2oC/min at 500s-1 - Day 7
Hea
t Flo
w (W
/g)
Temperature (oC)
15 20 25 30 35 40 45 50-4.0
-3.5
-3.0
-2.5
-2.0
-1.5
-1.0
-0.5
0.0
0.550-16oC in 2oC/min at 500s-1 - Day 28
Hea
t Flo
w (W
/g)
Temperature (oC)
Figure 123: Heat flow curves of samples created by being cooled from 50 to 16°C at 2°C/min whilst
shearing at a rate of 500s-1. The four graphs shown are sample repetitions carried out on day 0, day 1, day
7 and day 28.
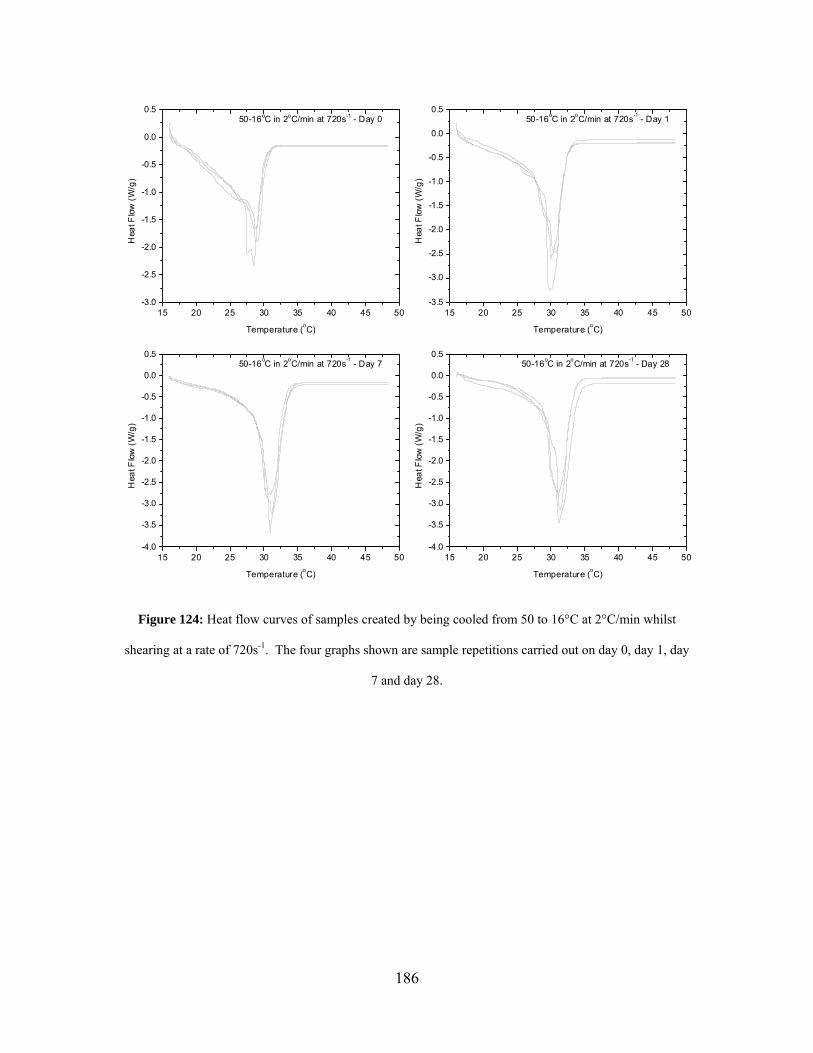
186
15 20 25 30 35 40 45 50-3.0
-2.5
-2.0
-1.5
-1.0
-0.5
0.0
0.550-16oC in 2oC/min at 720s-1 - Day 0
Hea
t Flo
w (W
/g)
Temperature (oC)
15 20 25 30 35 40 45 50-3.5
-3.0
-2.5
-2.0
-1.5
-1.0
-0.5
0.0
0.550-16oC in 2oC/min at 720s-1 - Day 1
Hea
t Flo
w (W
/g)
Temperature (oC)
15 20 25 30 35 40 45 50-4.0
-3.5
-3.0
-2.5
-2.0
-1.5
-1.0
-0.5
0.0
0.550-16oC in 2oC/min at 720s-1 - Day 7
Hea
t Flo
w (W
/g)
Temperature (oC)
15 20 25 30 35 40 45 50-4.0
-3.5
-3.0
-2.5
-2.0
-1.5
-1.0
-0.5
0.0
0.550-16oC in 2oC/min at 720s-1 - Day 28
Hea
t Flo
w (W
/g)
Temperature (oC)
Figure 124: Heat flow curves of samples created by being cooled from 50 to 16°C at 2°C/min whilst
shearing at a rate of 720s-1. The four graphs shown are sample repetitions carried out on day 0, day 1, day
7 and day 28.

187
15 20 25 30 35 40 45 50-3.0
-2.5
-2.0
-1.5
-1.0
-0.5
0.0
0.550-16oC in 2oC/min at 1000s-1 - Day 0
Hea
t Flo
w (W
/g)
Temperature (oC)
15 20 25 30 35 40 45 50-3.5
-3.0
-2.5
-2.0
-1.5
-1.0
-0.5
0.0
0.550-16oC in 2oC/min at 1000s-1 - Day 1
Hea
t Flo
w (W
/g)
Temperature (oC)
15 20 25 30 35 40 45 50-4.0
-3.5
-3.0
-2.5
-2.0
-1.5
-1.0
-0.5
0.0
0.550-16oC in 2oC/min at 1000s-1 - Day 7
Hea
t Flo
w (W
/g)
Temperature (oC)
15 20 25 30 35 40 45 50-4.0
-3.5
-3.0
-2.5
-2.0
-1.5
-1.0
-0.5
0.0
0.550-16oC in 2oC/min at 1000s-1 - Day 28
Hea
t Flo
w (W
/g)
Temperature (oC)
Figure 125: Heat flow curves of samples created by being cooled from 50 to 16°C at 2°C/min whilst
shearing at a rate of 1000s-1. The four graphs shown are sample repetitions carried out on day 0, day 1, day
7 and day 28.
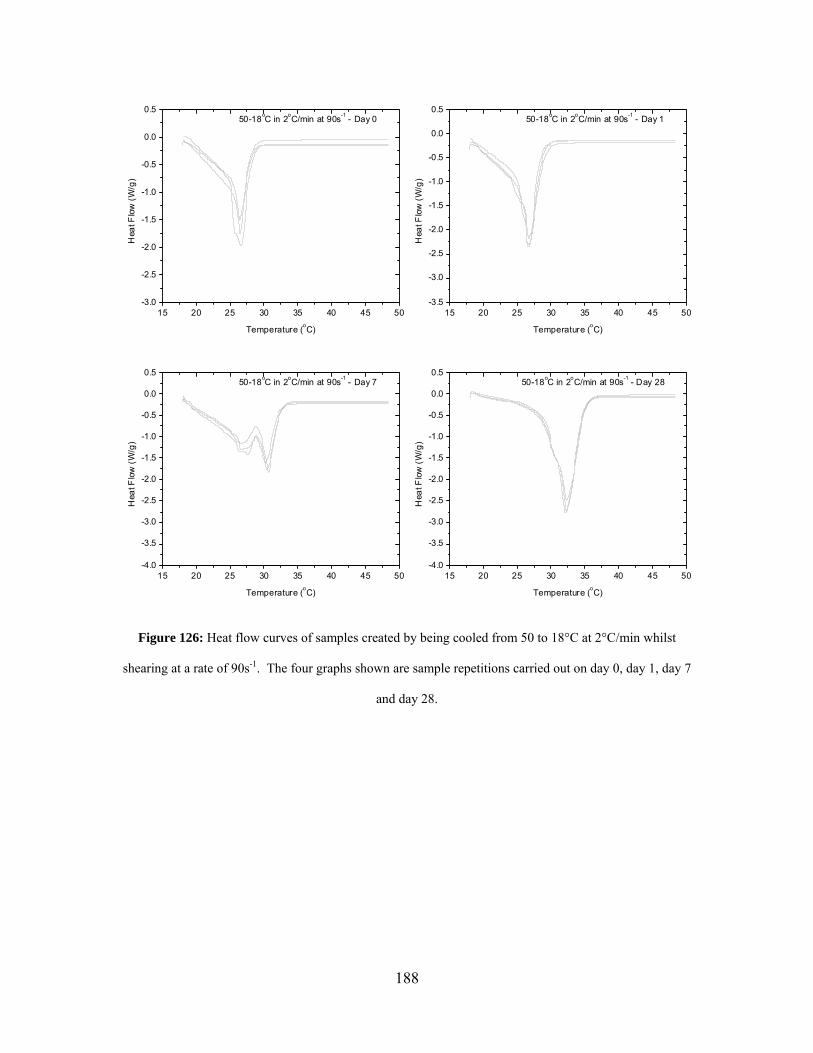
188
15 20 25 30 35 40 45 50-3.0
-2.5
-2.0
-1.5
-1.0
-0.5
0.0
0.550-18oC in 2oC/min at 90s-1 - Day 0
Hea
t Flo
w (W
/g)
Temperature (oC)
15 20 25 30 35 40 45 50-3.5
-3.0
-2.5
-2.0
-1.5
-1.0
-0.5
0.0
0.550-18oC in 2oC/min at 90s-1 - Day 1
Hea
t Flo
w (W
/g)
Temperature (oC)
15 20 25 30 35 40 45 50-4.0
-3.5
-3.0
-2.5
-2.0
-1.5
-1.0
-0.5
0.0
0.550-18oC in 2oC/min at 90s-1 - Day 7
Hea
t Flo
w (W
/g)
Temperature (oC)
15 20 25 30 35 40 45 50-4.0
-3.5
-3.0
-2.5
-2.0
-1.5
-1.0
-0.5
0.0
0.550-18oC in 2oC/min at 90s-1 - Day 28
Hea
t Flo
w (W
/g)
Temperature (oC)
Figure 126: Heat flow curves of samples created by being cooled from 50 to 18°C at 2°C/min whilst
shearing at a rate of 90s-1. The four graphs shown are sample repetitions carried out on day 0, day 1, day 7
and day 28.
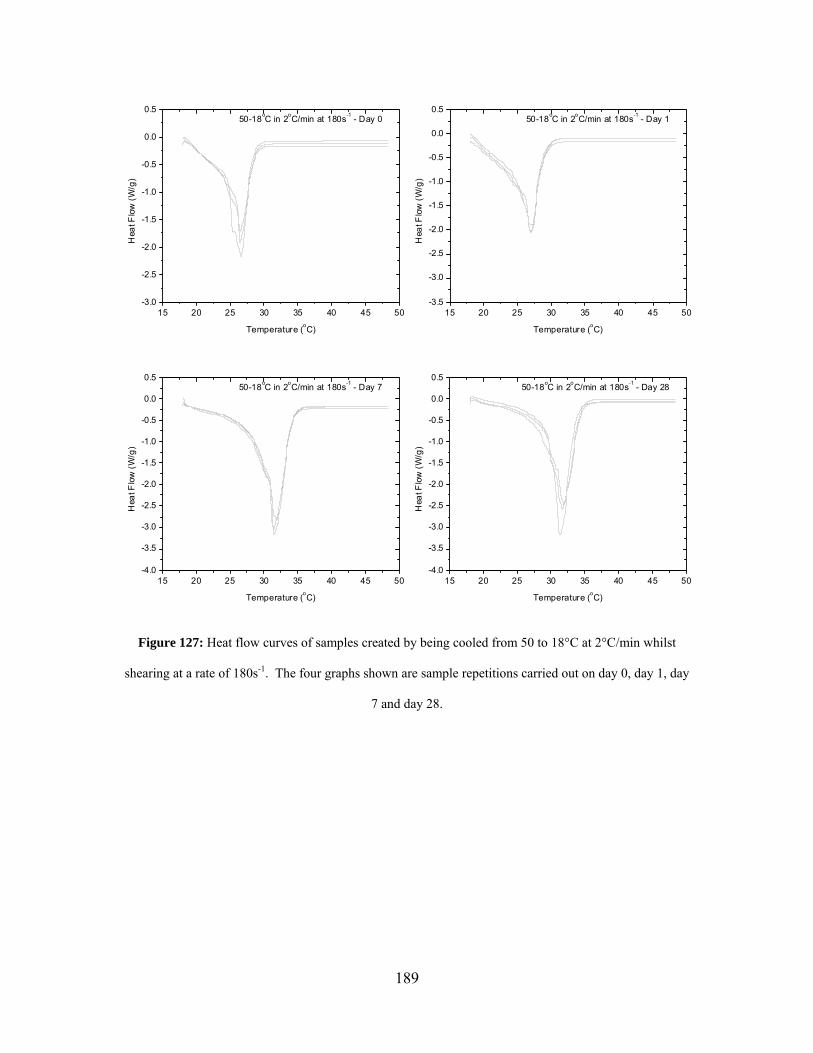
189
15 20 25 30 35 40 45 50-3.0
-2.5
-2.0
-1.5
-1.0
-0.5
0.0
0.550-18oC in 2oC/min at 180s-1 - Day 0
Hea
t Flo
w (W
/g)
Temperature (oC)
15 20 25 30 35 40 45 50-3.5
-3.0
-2.5
-2.0
-1.5
-1.0
-0.5
0.0
0.550-18oC in 2oC/min at 180s-1 - Day 1
Hea
t Flo
w (W
/g)
Temperature (oC)
15 20 25 30 35 40 45 50-4.0
-3.5
-3.0
-2.5
-2.0
-1.5
-1.0
-0.5
0.0
0.550-18oC in 2oC/min at 180s-1 - Day 7
Hea
t Flo
w (W
/g)
Temperature (oC)
15 20 25 30 35 40 45 50-4.0
-3.5
-3.0
-2.5
-2.0
-1.5
-1.0
-0.5
0.0
0.550-18oC in 2oC/min at 180s-1 - Day 28
Hea
t Flo
w (W
/g)
Temperature (oC)
Figure 127: Heat flow curves of samples created by being cooled from 50 to 18°C at 2°C/min whilst
shearing at a rate of 180s-1. The four graphs shown are sample repetitions carried out on day 0, day 1, day
7 and day 28.

190
15 20 25 30 35 40 45 50-3.0
-2.5
-2.0
-1.5
-1.0
-0.5
0.0
0.550-18oC in 2oC/min at 360s-1 - Day 0
Hea
t Flo
w (W
/g)
Temperature (oC)
15 20 25 30 35 40 45 50-3.5
-3.0
-2.5
-2.0
-1.5
-1.0
-0.5
0.0
0.550-18oC in 2oC/min at 360s-1 - Day 1
Hea
t Flo
w (W
/g)
Temperature (oC)
15 20 25 30 35 40 45 50-4.0
-3.5
-3.0
-2.5
-2.0
-1.5
-1.0
-0.5
0.0
0.550-18oC in 2oC/min at 360s-1 - Day 7
Hea
t Flo
w (W
/g)
Temperature (oC)
15 20 25 30 35 40 45 50-4.0
-3.5
-3.0
-2.5
-2.0
-1.5
-1.0
-0.5
0.0
0.550-18oC in 2oC/min at 360s-1 - Day 28
Hea
t Flo
w (W
/g)
Temperature (oC)
Figure 128: Heat flow curves of samples created by being cooled from 50 to 18°C at 2°C/min whilst
shearing at a rate of 360s-1. The four graphs shown are sample repetitions carried out on day 0, day 1, day
7 and day 28.

191
15 20 25 30 35 40 45 50-3.0
-2.5
-2.0
-1.5
-1.0
-0.5
0.0
0.550-18oC in 2oC/min at 500s-1 - Day 0
Hea
t Flo
w (W
/g)
Temperature (oC)
15 20 25 30 35 40 45 50-3.5
-3.0
-2.5
-2.0
-1.5
-1.0
-0.5
0.0
0.550-18oC in 2oC/min at 500s-1 - Day 1
Hea
t Flo
w (W
/g)
Temperature (oC)
15 20 25 30 35 40 45 50-4.0
-3.5
-3.0
-2.5
-2.0
-1.5
-1.0
-0.5
0.0
0.550-18oC in 2oC/min at 500s-1 - Day 7
Hea
t Flo
w (W
/g)
Temperature (oC)
15 20 25 30 35 40 45 50-4.0
-3.5
-3.0
-2.5
-2.0
-1.5
-1.0
-0.5
0.0
0.550-18oC in 2oC/min at 500s-1 - Day 28
Hea
t Flo
w (W
/g)
Temperature (oC)
Figure 129: Heat flow curves of samples created by being cooled from 50 to 18°C at 2°C/min whilst
shearing at a rate of 500s-1. The four graphs shown are sample repetitions carried out on day 0, day 1, day
7 and day 28.

192
15 20 25 30 35 40 45 50-3.0
-2.5
-2.0
-1.5
-1.0
-0.5
0.0
0.550-18oC in 2oC/min at 720s-1 - Day 0
Hea
t Flo
w (W
/g)
Temperature (oC)
15 20 25 30 35 40 45 50-3.5
-3.0
-2.5
-2.0
-1.5
-1.0
-0.5
0.0
0.550-18oC in 2oC/min at 720s-1 - Day 1
Hea
t Flo
w (W
/g)
Temperature (oC)
15 20 25 30 35 40 45 50-4.0
-3.5
-3.0
-2.5
-2.0
-1.5
-1.0
-0.5
0.0
0.550-18oC in 2oC/min at 720s-1 - Day 7
Hea
t Flo
w (W
/g)
Temperature (oC)
15 20 25 30 35 40 45 50-4.0
-3.5
-3.0
-2.5
-2.0
-1.5
-1.0
-0.5
0.0
0.550-18oC in 2oC/min at 720s-1 - Day 28
Hea
t Flo
w (W
/g)
Temperature (oC)
Figure 130: Heat flow curves of samples created by being cooled from 50 to 18°C at 2°C/min whilst
shearing at a rate of 720s-1. The four graphs shown are sample repetitions carried out on day 0, day 1, day
7 and day 28.
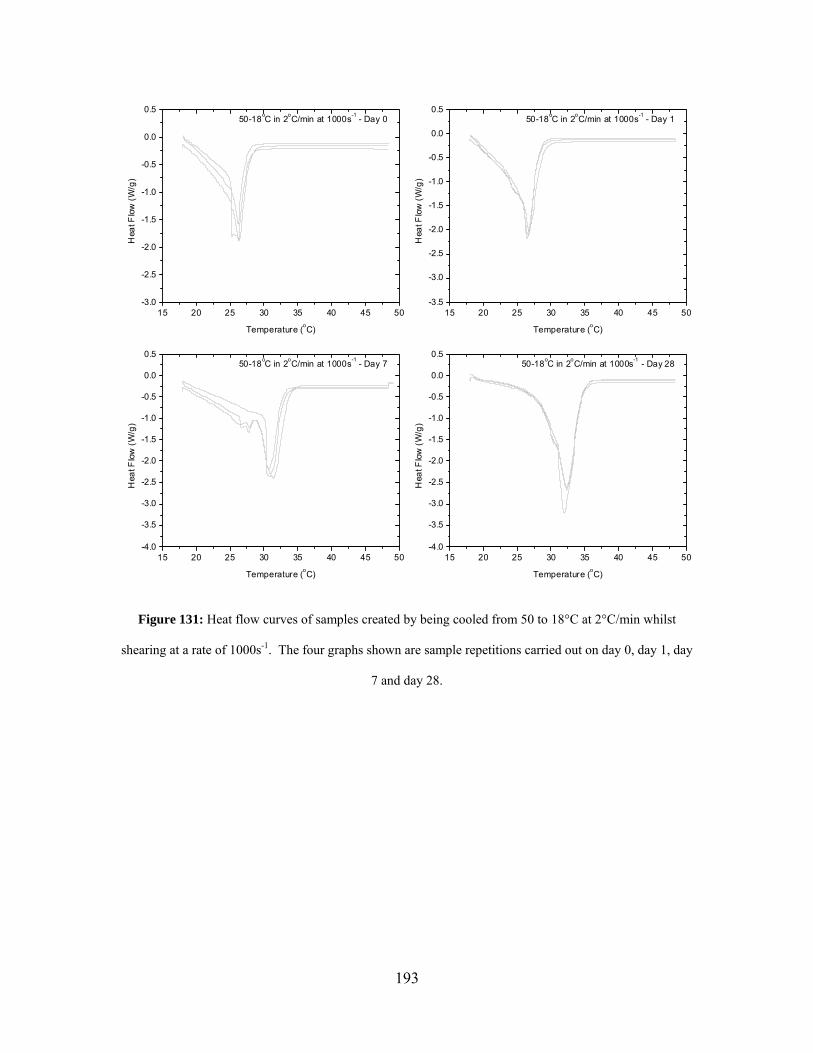
193
15 20 25 30 35 40 45 50-3.0
-2.5
-2.0
-1.5
-1.0
-0.5
0.0
0.550-18oC in 2oC/min at 1000s-1 - Day 0
Hea
t Flo
w (W
/g)
Temperature (oC)
15 20 25 30 35 40 45 50-3.5
-3.0
-2.5
-2.0
-1.5
-1.0
-0.5
0.0
0.550-18oC in 2oC/min at 1000s-1 - Day 1
Hea
t Flo
w (W
/g)
Temperature (oC)
15 20 25 30 35 40 45 50-4.0
-3.5
-3.0
-2.5
-2.0
-1.5
-1.0
-0.5
0.0
0.550-18oC in 2oC/min at 1000s-1 - Day 7
Hea
t Flo
w (W
/g)
Temperature (oC)
15 20 25 30 35 40 45 50-4.0
-3.5
-3.0
-2.5
-2.0
-1.5
-1.0
-0.5
0.0
0.550-18oC in 2oC/min at 1000s-1 - Day 28
Hea
t Flo
w (W
/g)
Temperature (oC)
Figure 131: Heat flow curves of samples created by being cooled from 50 to 18°C at 2°C/min whilst
shearing at a rate of 1000s-1. The four graphs shown are sample repetitions carried out on day 0, day 1, day
7 and day 28.

194
15 20 25 30 35 40 45 50-3.5
-3.0
-2.5
-2.0
-1.5
-1.0
-0.5
0.0
0.550-20oC in 2oC/min at 90s-1 - Day 0
Hea
t Flo
w (W
/g)
Temperature (oC)
15 20 25 30 35 40 45 50-3.5
-3.0
-2.5
-2.0
-1.5
-1.0
-0.5
0.0
0.550-20oC in 2oC/min at 90s-1 - Day 1
Hea
t Flo
w (W
/g)
Temperature (oC)
15 20 25 30 35 40 45 50-4.0
-3.5
-3.0
-2.5
-2.0
-1.5
-1.0
-0.5
0.0
0.550-20oC in 2oC/min at 90s-1 - Day 7
Hea
t Flo
w (W
/g)
Temperature (oC)
15 20 25 30 35 40 45 50-4.0
-3.5
-3.0
-2.5
-2.0
-1.5
-1.0
-0.5
0.0
0.550-20oC in 2oC/min at 90s-1 - Day 28
Hea
t Flo
w (W
/g)
Temperature (oC)
Figure 132: Heat flow curves of samples created by being cooled from 50 to 20°C at 2°C/min whilst
shearing at a rate of 90s-1. The four graphs shown are sample repetitions carried out on day 0, day 1, day 7
and day 28.
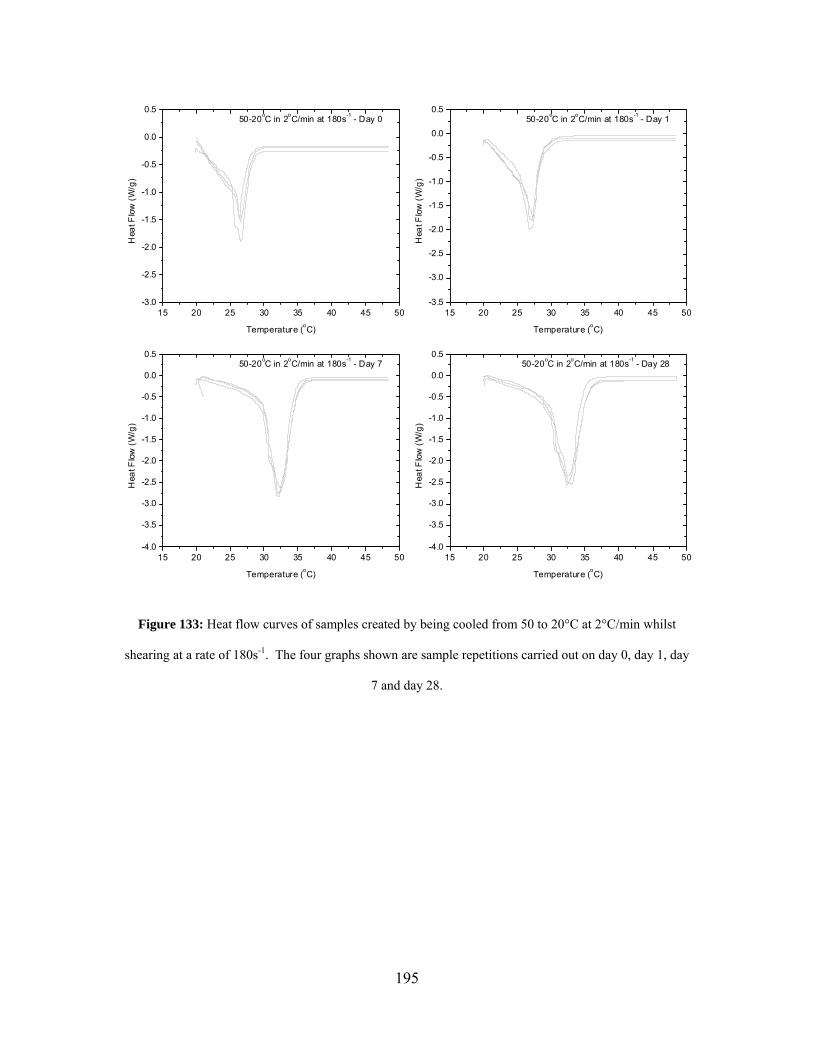
195
15 20 25 30 35 40 45 50-3.0
-2.5
-2.0
-1.5
-1.0
-0.5
0.0
0.550-20oC in 2oC/min at 180s-1 - Day 0
Hea
t Flo
w (W
/g)
Temperature (oC)
15 20 25 30 35 40 45 50-3.5
-3.0
-2.5
-2.0
-1.5
-1.0
-0.5
0.0
0.550-20oC in 2oC/min at 180s-1 - Day 1
Hea
t Flo
w (W
/g)
Temperature (oC)
15 20 25 30 35 40 45 50-4.0
-3.5
-3.0
-2.5
-2.0
-1.5
-1.0
-0.5
0.0
0.550-20oC in 2oC/min at 180s-1 - Day 7
Hea
t Flo
w (W
/g)
Temperature (oC)
15 20 25 30 35 40 45 50-4.0
-3.5
-3.0
-2.5
-2.0
-1.5
-1.0
-0.5
0.0
0.550-20oC in 2oC/min at 180s-1 - Day 28
Hea
t Flo
w (W
/g)
Temperature (oC)
Figure 133: Heat flow curves of samples created by being cooled from 50 to 20°C at 2°C/min whilst
shearing at a rate of 180s-1. The four graphs shown are sample repetitions carried out on day 0, day 1, day
7 and day 28.
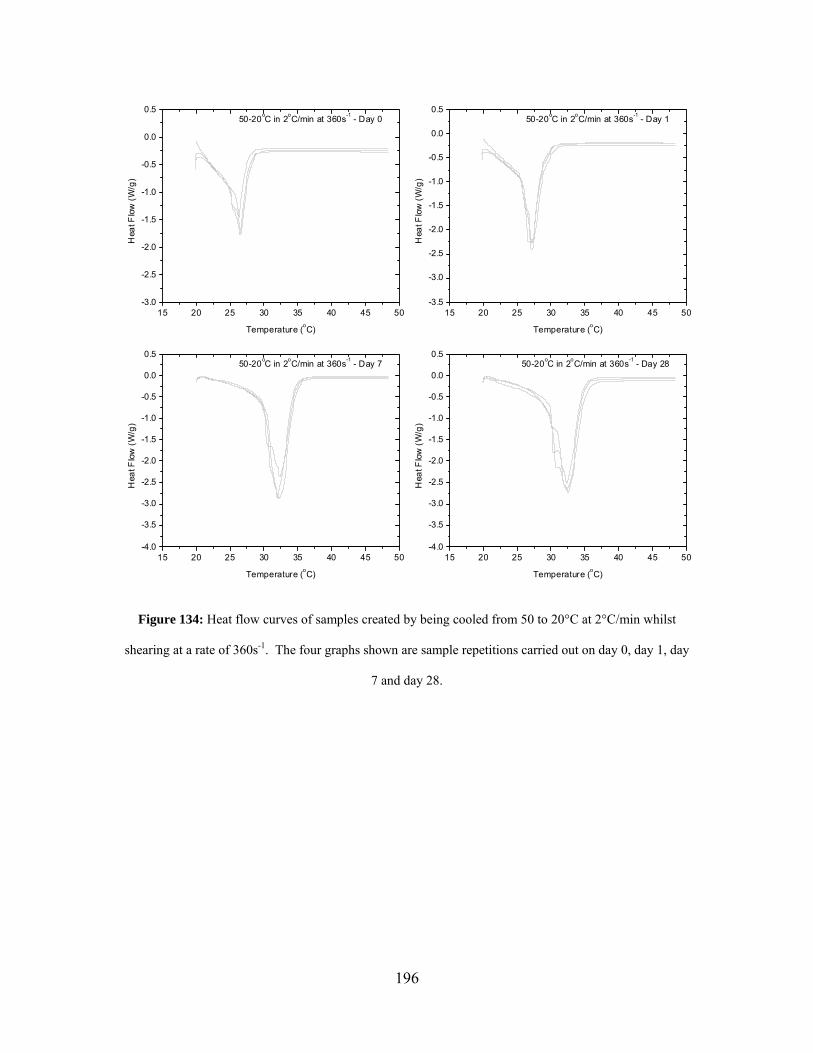
196
15 20 25 30 35 40 45 50-3.0
-2.5
-2.0
-1.5
-1.0
-0.5
0.0
0.550-20oC in 2oC/min at 360s-1 - Day 0
Hea
t Flo
w (W
/g)
Temperature (oC)
15 20 25 30 35 40 45 50-3.5
-3.0
-2.5
-2.0
-1.5
-1.0
-0.5
0.0
0.550-20oC in 2oC/min at 360s-1 - Day 1
Hea
t Flo
w (W
/g)
Temperature (oC)
15 20 25 30 35 40 45 50-4.0
-3.5
-3.0
-2.5
-2.0
-1.5
-1.0
-0.5
0.0
0.550-20oC in 2oC/min at 360s-1 - Day 7
Hea
t Flo
w (W
/g)
Temperature (oC)
15 20 25 30 35 40 45 50-4.0
-3.5
-3.0
-2.5
-2.0
-1.5
-1.0
-0.5
0.0
0.550-20oC in 2oC/min at 360s-1 - Day 28
Hea
t Flo
w (W
/g)
Temperature (oC)
Figure 134: Heat flow curves of samples created by being cooled from 50 to 20°C at 2°C/min whilst
shearing at a rate of 360s-1. The four graphs shown are sample repetitions carried out on day 0, day 1, day
7 and day 28.

197
15 20 25 30 35 40 45 50-3.0
-2.5
-2.0
-1.5
-1.0
-0.5
0.0
0.550-20oC in 2oC/min at 500s-1 - Day 0
Hea
t Flo
w (W
/g)
Temperature (oC)
15 20 25 30 35 40 45 50-3.5
-3.0
-2.5
-2.0
-1.5
-1.0
-0.5
0.0
0.550-20oC in 2oC/min at 500s-1 - Day 1
Hea
t Flo
w (W
/g)
Temperature (oC)
15 20 25 30 35 40 45 50-4.0
-3.5
-3.0
-2.5
-2.0
-1.5
-1.0
-0.5
0.0
0.550-20oC in 2oC/min at 500s-1 - Day 7
Hea
t Flo
w (W
/g)
Temperature (oC)
15 20 25 30 35 40 45 50-4.0
-3.5
-3.0
-2.5
-2.0
-1.5
-1.0
-0.5
0.0
0.550-20oC in 2oC/min at 500s-1 - Day 28
Hea
t Flo
w (W
/g)
Temperature (oC)
Figure 135: Heat flow curves of samples created by being cooled from 50 to 20°C at 2°C/min whilst
shearing at a rate of 500s-1. The four graphs shown are sample repetitions carried out on day 0, day 1, day
7 and day 28.
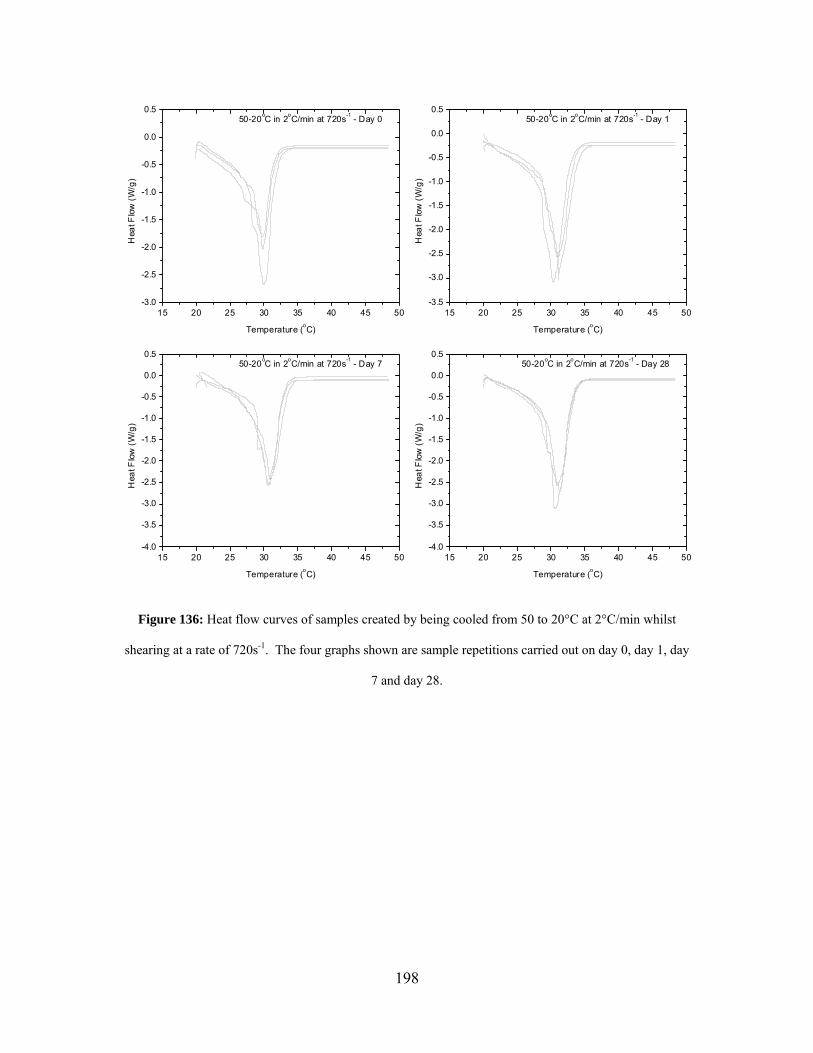
198
15 20 25 30 35 40 45 50-3.0
-2.5
-2.0
-1.5
-1.0
-0.5
0.0
0.550-20oC in 2oC/min at 720s-1 - Day 0
Hea
t Flo
w (W
/g)
Temperature (oC)
15 20 25 30 35 40 45 50-3.5
-3.0
-2.5
-2.0
-1.5
-1.0
-0.5
0.0
0.550-20oC in 2oC/min at 720s-1 - Day 1
Hea
t Flo
w (W
/g)
Temperature (oC)
15 20 25 30 35 40 45 50-4.0
-3.5
-3.0
-2.5
-2.0
-1.5
-1.0
-0.5
0.0
0.550-20oC in 2oC/min at 720s-1 - Day 7
Hea
t Flo
w (W
/g)
Temperature (oC)
15 20 25 30 35 40 45 50-4.0
-3.5
-3.0
-2.5
-2.0
-1.5
-1.0
-0.5
0.0
0.550-20oC in 2oC/min at 720s-1 - Day 28
Hea
t Flo
w (W
/g)
Temperature (oC)
Figure 136: Heat flow curves of samples created by being cooled from 50 to 20°C at 2°C/min whilst
shearing at a rate of 720s-1. The four graphs shown are sample repetitions carried out on day 0, day 1, day
7 and day 28.
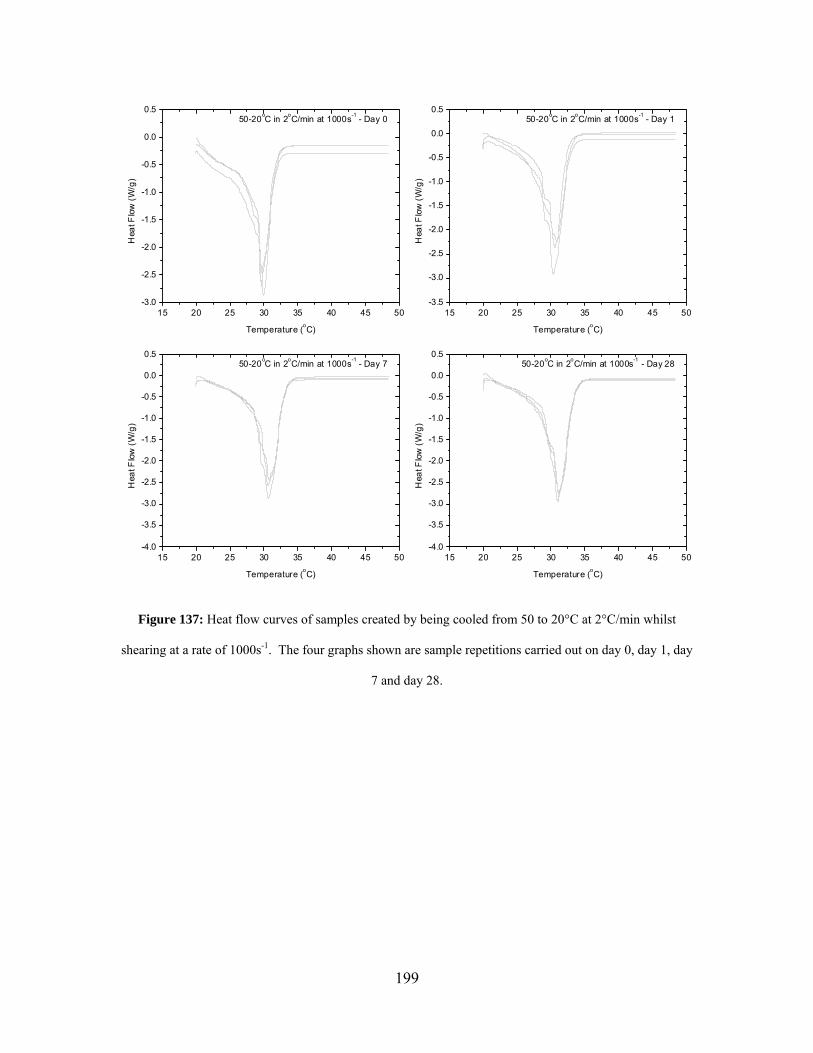
199
15 20 25 30 35 40 45 50-3.0
-2.5
-2.0
-1.5
-1.0
-0.5
0.0
0.550-20oC in 2oC/min at 1000s-1 - Day 0
Hea
t Flo
w (W
/g)
Temperature (oC)
15 20 25 30 35 40 45 50-3.5
-3.0
-2.5
-2.0
-1.5
-1.0
-0.5
0.0
0.550-20oC in 2oC/min at 1000s-1 - Day 1
Hea
t Flo
w (W
/g)
Temperature (oC)
15 20 25 30 35 40 45 50-4.0
-3.5
-3.0
-2.5
-2.0
-1.5
-1.0
-0.5
0.0
0.550-20oC in 2oC/min at 1000s-1 - Day 7
Hea
t Flo
w (W
/g)
Temperature (oC)
15 20 25 30 35 40 45 50-4.0
-3.5
-3.0
-2.5
-2.0
-1.5
-1.0
-0.5
0.0
0.550-20oC in 2oC/min at 1000s-1 - Day 28
Hea
t Flo
w (W
/g)
Temperature (oC)
Figure 137: Heat flow curves of samples created by being cooled from 50 to 20°C at 2°C/min whilst
shearing at a rate of 1000s-1. The four graphs shown are sample repetitions carried out on day 0, day 1, day
7 and day 28.
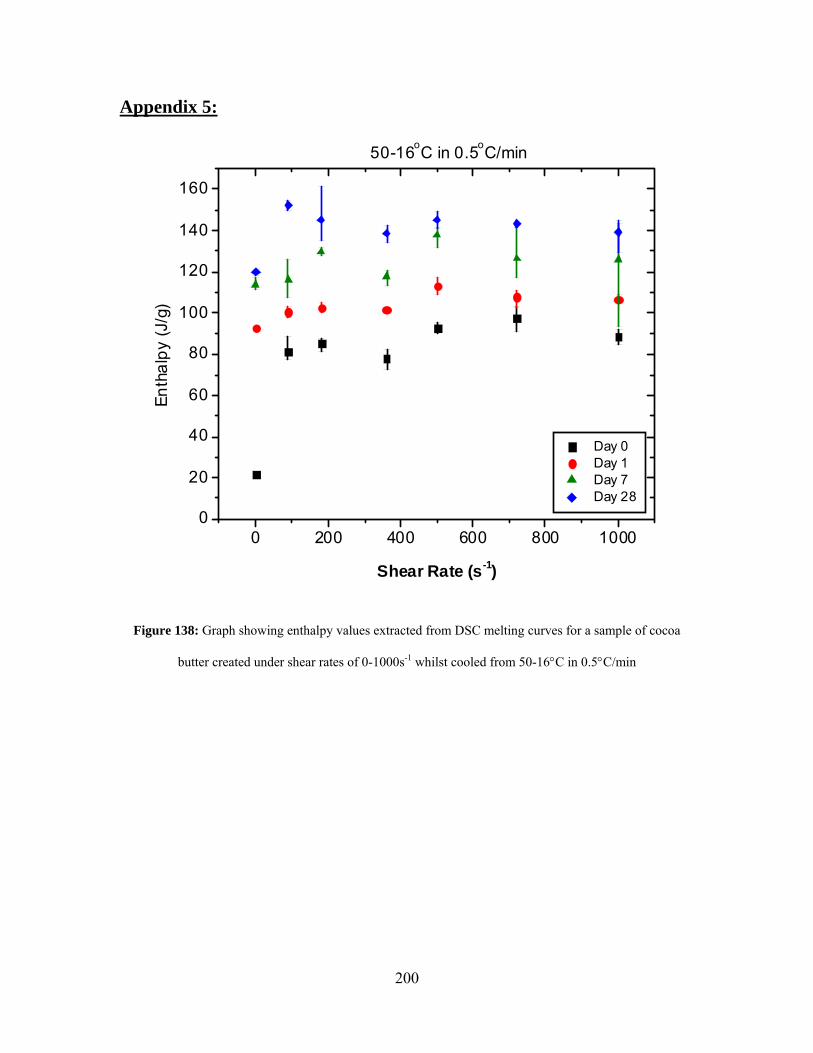
200
Appendix 5:
0 200 400 600 800 10000
20
40
60
80
100
120
140
160
50-16oC in 0.5oC/minEn
thal
py (J
/g)
Shear Rate (s-1)
Day 0 Day 1 Day 7 Day 28
Figure 138: Graph showing enthalpy values extracted from DSC melting curves for a sample of cocoa
butter created under shear rates of 0-1000s-1 whilst cooled from 50-16°C in 0.5°C/min
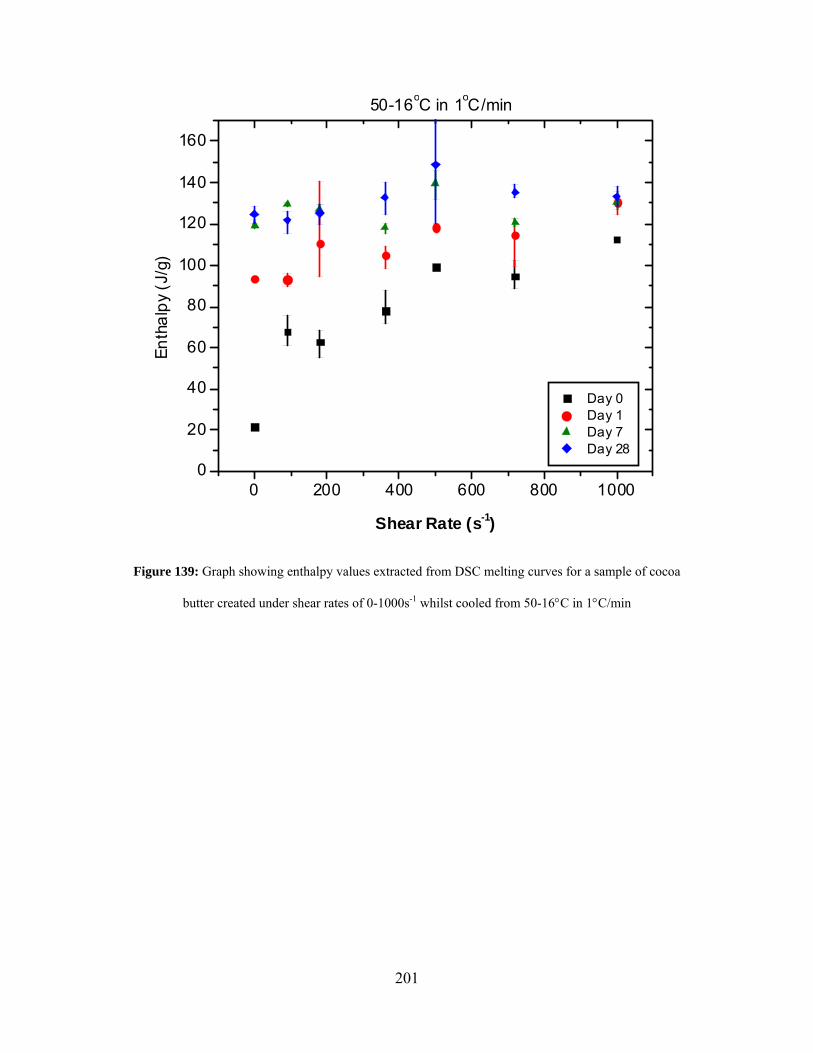
201
0 200 400 600 800 10000
20
40
60
80
100
120
140
160
50-16oC in 1oC/min
Enth
alpy
(J/g
)
Shear Rate (s-1)
Day 0 Day 1 Day 7 Day 28
Figure 139: Graph showing enthalpy values extracted from DSC melting curves for a sample of cocoa
butter created under shear rates of 0-1000s-1 whilst cooled from 50-16°C in 1°C/min
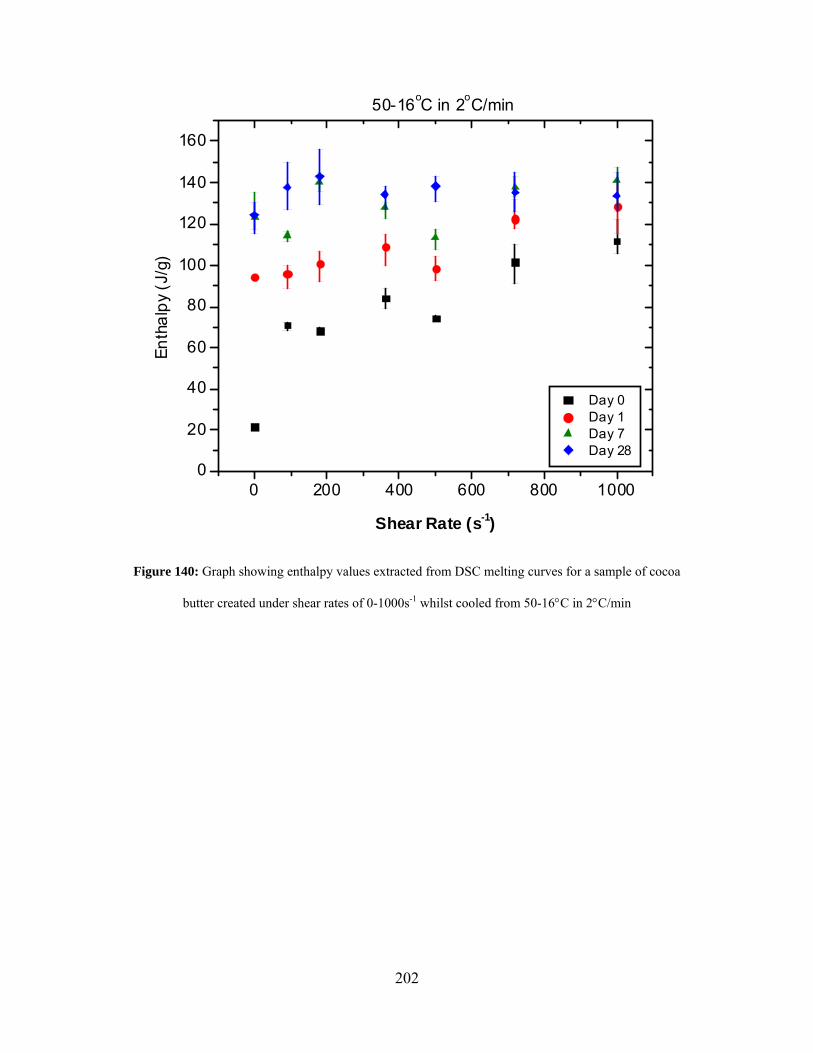
202
0 200 400 600 800 10000
20
40
60
80
100
120
140
160
50-16oC in 2oC/min
Enth
alpy
(J/g
)
Shear Rate (s-1)
Day 0 Day 1 Day 7 Day 28
Figure 140: Graph showing enthalpy values extracted from DSC melting curves for a sample of cocoa
butter created under shear rates of 0-1000s-1 whilst cooled from 50-16°C in 2°C/min
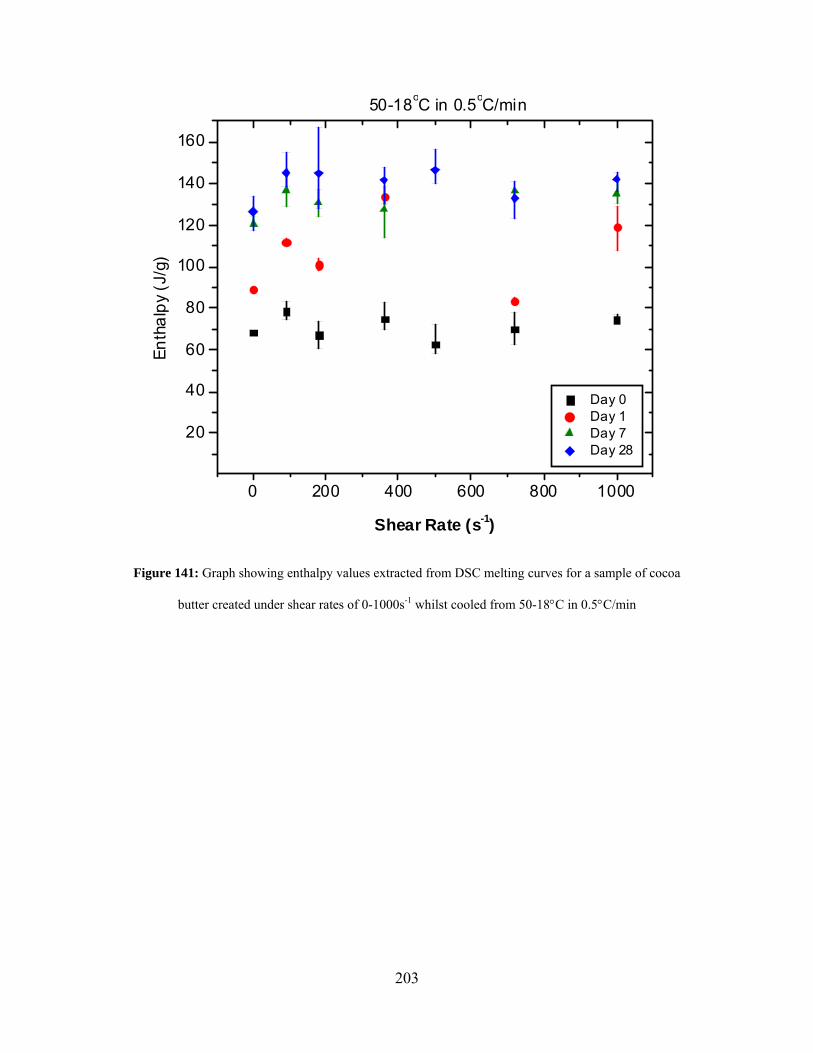
203
0 200 400 600 800 1000
20
40
60
80
100
120
140
160
50-18oC in 0.5oC/min
Enth
alpy
(J/g
)
Shear Rate (s-1)
Day 0 Day 1 Day 7 Day 28
Figure 141: Graph showing enthalpy values extracted from DSC melting curves for a sample of cocoa
butter created under shear rates of 0-1000s-1 whilst cooled from 50-18°C in 0.5°C/min
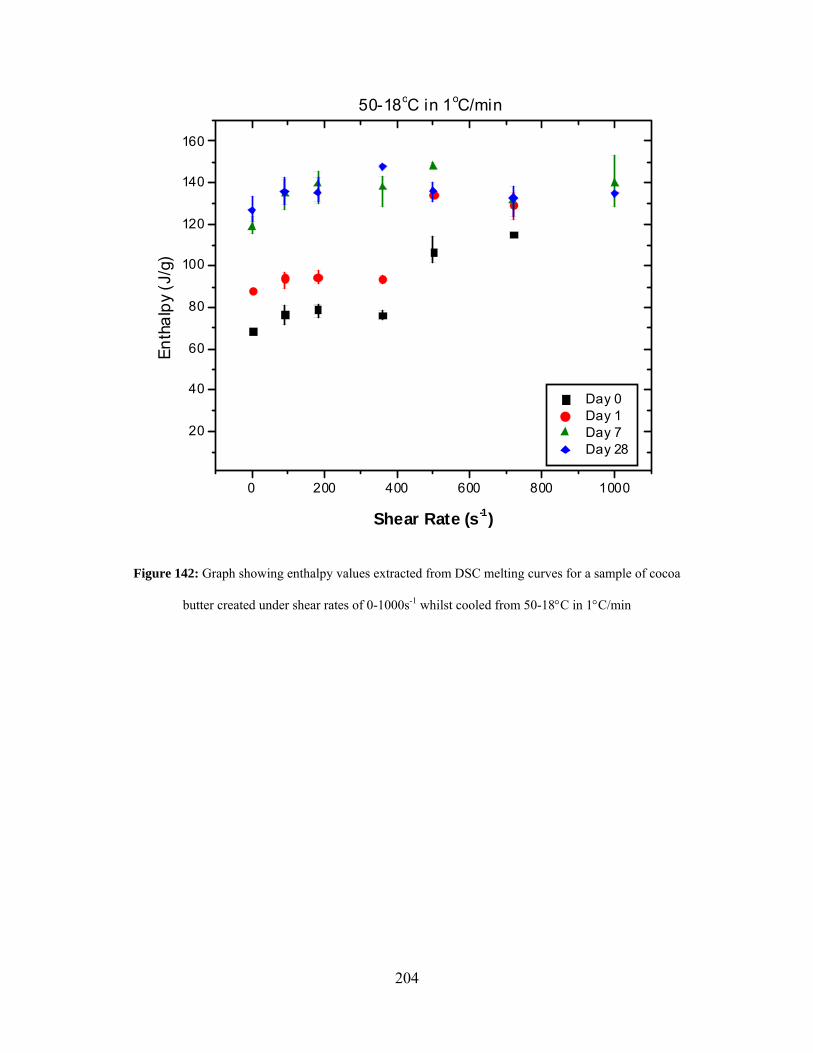
204
0 200 400 600 800 1000
20
40
60
80
100
120
140
160
50-18oC in 1oC/min
Enth
alpy
(J/g
)
Shear Rate (s-1)
Day 0 Day 1 Day 7 Day 28
Figure 142: Graph showing enthalpy values extracted from DSC melting curves for a sample of cocoa
butter created under shear rates of 0-1000s-1 whilst cooled from 50-18°C in 1°C/min
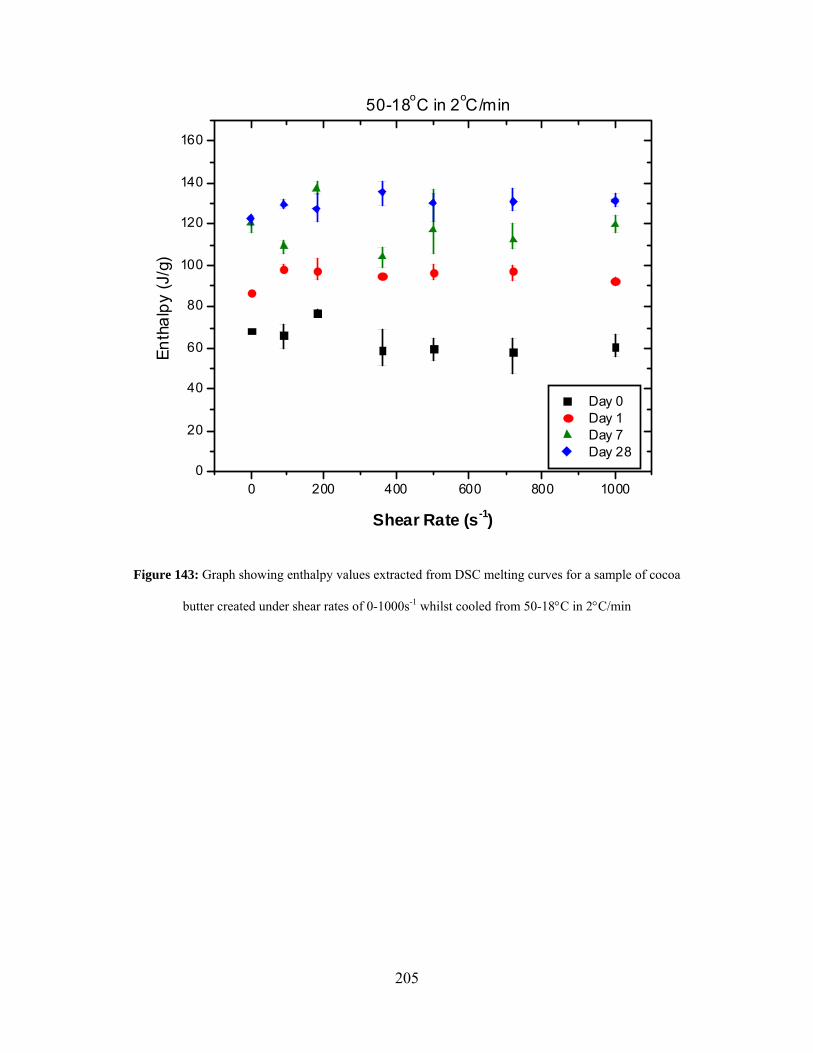
205
0 200 400 600 800 10000
20
40
60
80
100
120
140
160
50-18oC in 2oC/min
Enth
alpy
(J/g
)
Shear Rate (s-1)
Day 0 Day 1 Day 7 Day 28
Figure 143: Graph showing enthalpy values extracted from DSC melting curves for a sample of cocoa
butter created under shear rates of 0-1000s-1 whilst cooled from 50-18°C in 2°C/min
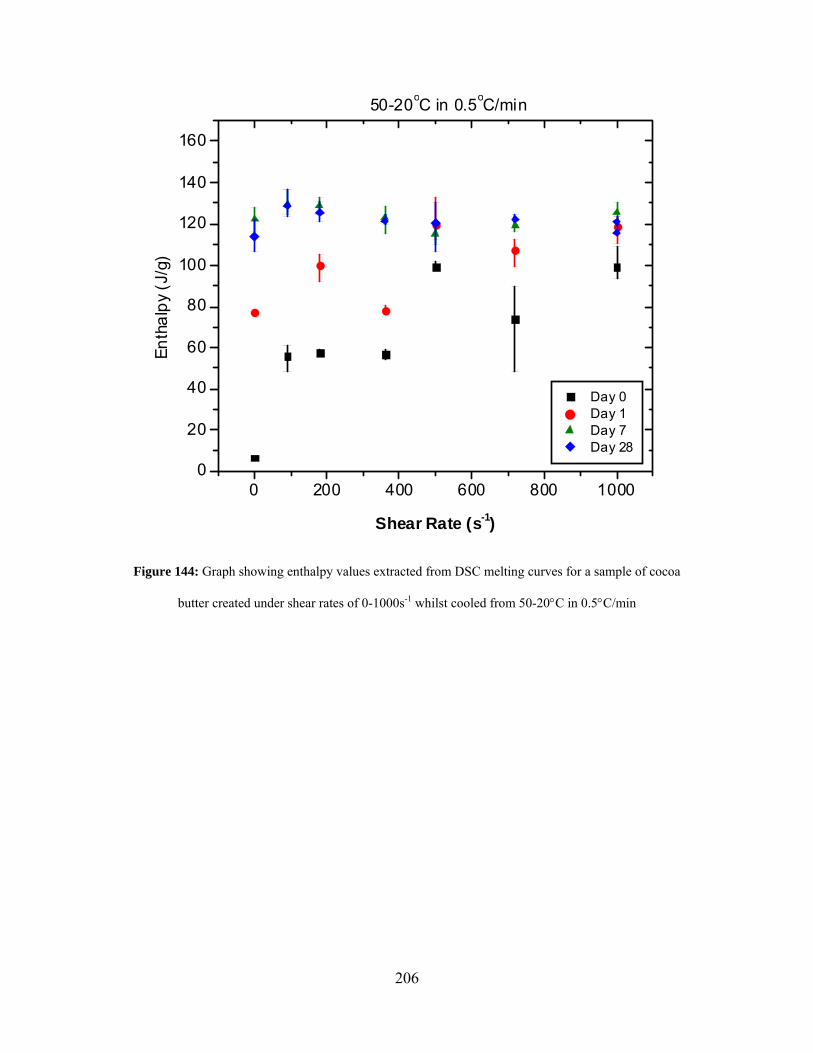
206
0 200 400 600 800 10000
20
40
60
80
100
120
140
160
50-20oC in 0.5oC/min
Enth
alpy
(J/g
)
Shear Rate (s-1)
Day 0 Day 1 Day 7 Day 28
Figure 144: Graph showing enthalpy values extracted from DSC melting curves for a sample of cocoa
butter created under shear rates of 0-1000s-1 whilst cooled from 50-20°C in 0.5°C/min
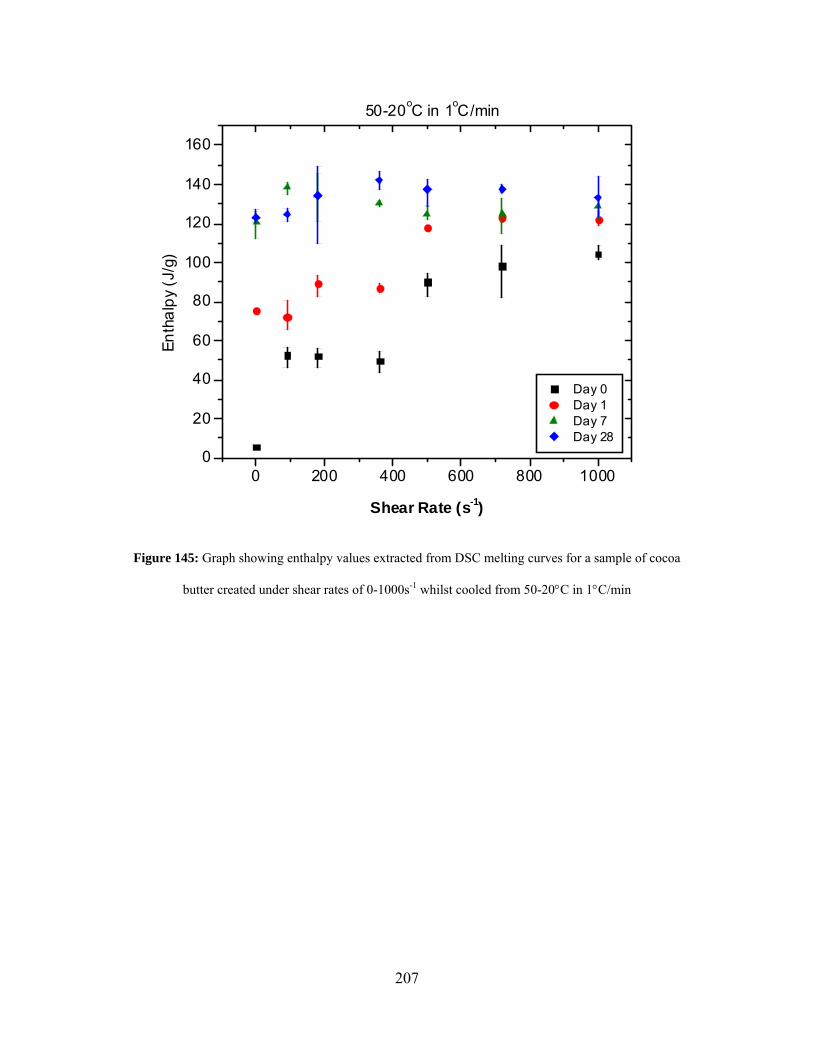
207
0 200 400 600 800 10000
20
40
60
80
100
120
140
160
50-20oC in 1oC/min
Enth
alpy
(J/g
)
Shear Rate (s-1)
Day 0 Day 1 Day 7 Day 28
Figure 145: Graph showing enthalpy values extracted from DSC melting curves for a sample of cocoa
butter created under shear rates of 0-1000s-1 whilst cooled from 50-20°C in 1°C/min
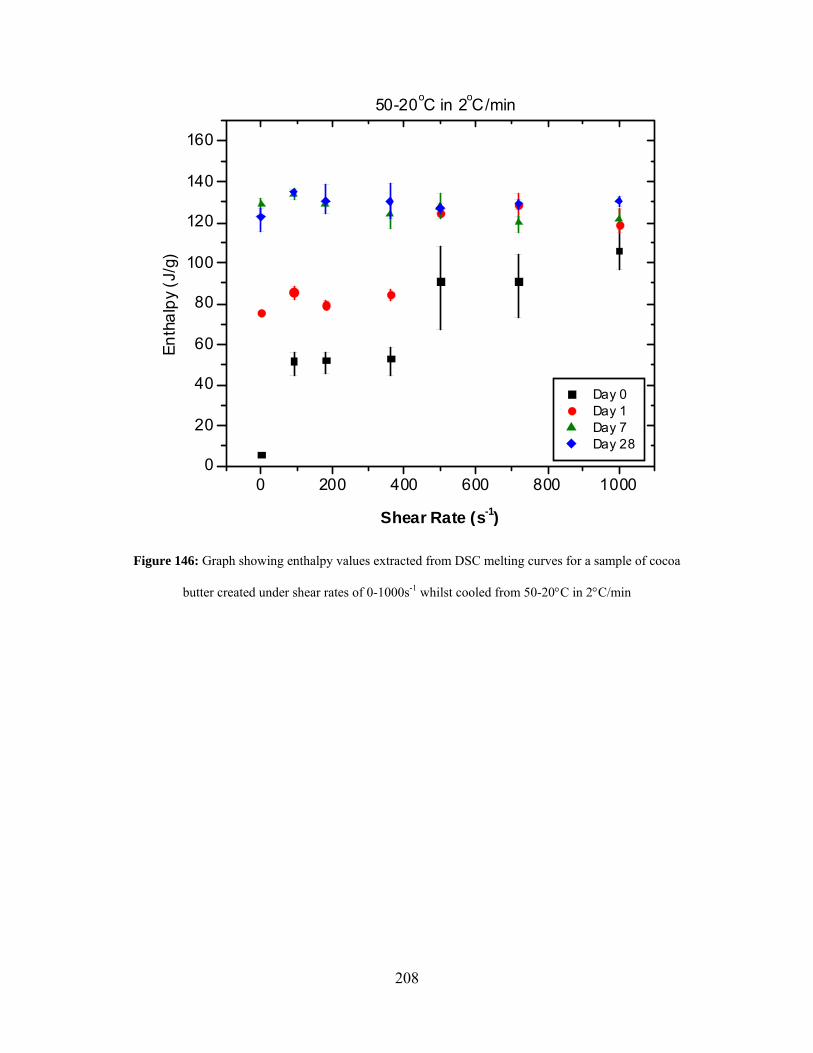
208
0 200 400 600 800 10000
20
40
60
80
100
120
140
160
50-20oC in 2oC/min
Enth
alpy
(J/g
)
Shear Rate (s-1)
Day 0 Day 1 Day 7 Day 28
Figure 146: Graph showing enthalpy values extracted from DSC melting curves for a sample of cocoa
butter created under shear rates of 0-1000s-1 whilst cooled from 50-20°C in 2°C/min
209
References
1. Guthrie, S.E. and S.H.J. Idziak, Split rheometer Couette attachment to enable
sample extraction. Review of Scientific Instruments, 2005. 76(2): p. 026110-1 - 026110-3.
2. Vaeck, S.V., Die Polymorphie (Vielgestaltigkeit) einiger Naturfette. International Chocolate Review, 1951. 6: p. 100-113.
3. Giddey, C. and E. Clerc, Polymorphism of Cocoa Butter and its Importance in the Chocolate Industry. International Chocolate Review, 1961. 16: p. 548-554.
4. Wille, R.L. and E.S. Lutton, Polymorphism of Cocoa Butter. Journal of the American Oil Chemists Society, 1966. 43(8): p. 491-496.
5. Witzel, H. and K. Becker, Crystalline Structure of Cocoa Butter. Fette Seifen Anstrichmittel, 1969. 71(6): p. 507-516.
6. Riiner, U., Investigation of the Polymorphism of Fats and Oils by Temperature Programmed X-Ray Diffraction. Lebensmittel-Wissenschaft & Technologie, 1970. 3(6): p. 101-106.
7. Chapman, G.M., E.E. Akehurst, and W.B. Wright, Cocoa Butter and Confectionery Fats - Studies Using Programmed Temperature X-Ray Diffraction and Differential Scanning Calorimetry. Journal of the American Oil Chemists Society, 1971. 48(12): p. 824-830.
8. Beckett, S.T., The Science of Chocolate. 2000, Cambridge, UK: Royal Society of Chemistry.
9. MacMillan, S.D., et al., In situ small angle x-ray scattering (SAXS) studies of polymorphism with the associated crystallization of cocoa butter fat using shearing conditions. Crystal Growth & Design, 2002. 2: p. 221-226.
10. Mazzanti, G., et al., Orientation and phase transitions of fat crystals under shear. Crystal Growth & Design, 2003. 3(5): p. 721-725.
11. Mazzanti, G., et al., Novel shear-induced phases in cocoa butter. Crystal Growth & Design, 2004. 4(3): p. 409-411.
12. Stapley, A.G.F., H. Tewkesbury, and P.J. Fryer, The effects of shear and temperature history on the crystallization of chocolate. Journal of the American Oil Chemists Society, 1999. 76(6): p. 677-685.
13. Ziegleder, G., Verbessertes Kristallisationsverhalten von Kakaobutter unter dem Einfluss eines Schergefalles. ZFL, 1985. 6: p. 412-416.
14. Bolliger, S., et al., Comparison of precrystallization of chocolate. Journal of Food Engineering, 1998. 35(3): p. 281-297.
15. Bolliger, S., Y.T. Zeng, and E.J. Windhab, In-line measurement of tempered cocoa butter and chocolate by means of near-infrared spectroscopy. Journal of the American Oil Chemists Society, 1999. 76(6): p. 659-667.
16. Toro-Vazquez, J.F., et al., Rheometry and polymorphism of cocoa butter during crystallization under static and stirring conditions. Journal of the American Oil Chemists Society, 2004. 81(2): p. 195-202.
17. Dhonsi, D. and A.G.F. Stapley, The effect of shear rate, temperature, sugar and emulsifier on the tempering of cocoa butter. Journal of Food Engineering, 2006. 77: p. 936-942.
210
18. Sonwai, S. and M.R. Mackley, The Effect of Shear on the Crystallization of Cocoa Butter. JAOCS, 2006. 83(7): p. 583-596.
19. Welmans, P., Pharm. Ztg., 1900. 45: p. 959. 20. Vaeck, S.V., Cocoa Butter and Fat Bloom. Manufacturing Confectioner, 1960.
40: p. 35-46, 71-74. 21. Duffy, P., On certain Isomeric Transformations of Fats. Journal of the Chemical
Society, 1852. 5(3): p. 197-210. 22. Sato, K., Crystallization behavior of fats and lipids - a review. Chemical
Engineering Science, 2001. 56: p. 2255-2265. 23. van Mechelen, J.B., R. Peschar, and H. Schenk, Structure of mono-unsaturated
tracylglycerols. II. The β2 polymorph. Acta Crystallographica Section B, 2006. 62(6): p. 1131-1138.
24. van Mechelen, J.B., R. Peschar, and H. Schenk, Structures of mono-unsaturated triacylglycerols. I. The β1 polymorph. Acta Crystallographica Section B, 2006. 62(6): p. 1121-1130.
25. Mazzanti, G., X-Ray Diffraction Study on the Crystallization of Fats Under Shear, in Food Science. 2004, University of Guelph: Guelph. p. 233.
26. Huyghebaert, A. and H. Hendrickx, Polymorphism of Cocoa Butter, shown by Differential Scanning Calorimetry. Lebensmittel-Wissenschaft & Technologie, 1971. 79: p. 59-63.
27. Lovegren, N.V., M.S. Gray, and R.O. Feuge, Polymorphic Changes in Mixtures of Confectionery Fats. Journal of the American Oil Chemists Society, 1976. 53(2): p. 83-88.
28. Hicklin, J.D., G.G. Jewell, and J.F. Heathcock, Combining Microscopy and Physical Techniques in the Study of Cocoa Butter Polymorphs and Vegetable Fat Blends. Food Microstructure, 1985. 4: p. 241-248.
29. Loisel, C., et al., Phase transitions and polymorphism of cocoa butter. Journal of the American Oil Chemists Society, 1998. 75(4): p. 425-439.
30. Merken, G.V. and S.V. Vaeck, A Study of the polymorphism of cocoa butter by means of DSC calorimetry. Lebensmittel-Wissenschaft & Technologie, 1980. 13: p. 314-317.
31. Schlichter-Aronhime, J. and N. Garti, Solidification and Polymorphism in Cocoa Butter and the Blooming Problem, in Crystallization and Polymorphism of Fats and Fatty Acids, K. Sato, Editor. 1988, Marcel Dekker, Inc.: New York. p. 363-393.
32. Schlichter-Aronhime, J., S. Sarig, and N. Garti, Reconsideration of Polymorphic Transformations in Cocoa Butter Using the DSC. Journal of the American Oil Chemists Society, 1988. 65(7): p. 1140-1143.
33. van Langevelde, A., et al., Cocoa-butter long spacings and the memory effect. Journal of the American Oil Chemists Society, 2001. 78(9): p. 911-918.
34. van Malssen, K., et al., Phase behavior and extended phase scheme of static cocoa butter investigated with real-time X-ray powder diffraction. Journal of the American Oil Chemists Society, 1999. 76(6): p. 669-676.
35. van Malssen, K.F., et al., Real-time X-ray powder diffraction investigations on cocoa butter. III. Direct β− crystallization of cocoa butter: Occurence of a
211
memory effect. Journal of the American Oil Chemists Society, 1996. 73: p. 1225-1230.
36. van Malssen, K.F., R. Peschar, and H. Schenk, Real-time X-ray powder diffraction investigations on cocoa butter. I. Temperature-dependent crystallization behavior. Journal of the American Oil Chemists Society, 1996. 73: p. 1209-1251.
37. Davis, T.R. and P.S. Dimick, Isolation and Thermal Characterization of High-Melting Seed Crystals Formed During Cocoa Butter Solidification. Journal of the American Oil Chemists Society, 1989. 66(10): p. 1488-1493.
38. Merken, G.V., S.V. Vaeck, and D. Dewulf, Determination of the Technological Properties of Cocoa Butter by Means of Differential Scanning Calorimetry. Lebensmittel-Wissenschaft & Technologie, 1982. 15(4): p. 195-198.
39. Narine, S.S. and A.G. Marangoni, Fractal Nature of Fat Crystal Networks. Physical Review E, 1999. 59(2): p. 1908-1920.
40. Spigno, G., C. Pagella, and D.M. De Faveri, DSC characterisation of cocoa butter polymorphs. Italian Journal of Food Science, 2001. 13(3): p. 275-284.
41. Marangoni, A.G. and S.E. McGauley, Relationship between crystallization behavior and structure in cocoa butter. Crystal Growth & Design, 2003. 3(1): p. 95-108.
42. Chaiseri, S. and P.S. Dimick, Dynamic Crystallization of Cocoa Butter. II. Morphological, Thermal, and Chemical Characteristics During Crystal Growth. Journal of the American Oil Chemists Society, 1995. 72(12): p. 1497-1504.
43. Cebula, D.J. and G. Ziegleder, Studies of Bloom Formation Using X-Ray-Diffraction from Chocolates after Long-Term Storage. Fett Wissenschaft Technologie-Fat Science Technology, 1993. 95(9): p. 340-343.
44. Marangoni, A. and S.E. McGauley, Relationship between Crystallization Behavior and Structure in Cocoa Butter. Crystal Growth & Design, 2003. 3(1): p. 95-108.
45. van Langevelde, A., et al., Effect of temperature on recrystallization behavior of cocoa butter. Journal of the American Oil Chemists Society, 2001. 78(9): p. 919-925.
46. van Gelder, R.N.M.R., et al., Crystallization and Polymorphism in Cocoa Butter Fat: In-situ Studies Using Synchrotron Radiation X-Ray Diffraction, in Crystal Growth of Organic Materials, P. Meenan, Editor. 1996, American Chemical Society: Washington, DC. p. 209-215.
47. Manning, D.M. and P.S. Dimick, Crystal Morphology of Cocoa Butter. Food Microstructure, 1985. 4: p. 249-265.
48. Forsterling, G., et al., New Understandings about the Crystal Structure of Cocoa Butter. Fette Seifen Anstrichmittel, 1981. 83(7): p. 249-254.
49. Bricknell, J. and R.W. Hartel, Relation of Fat Bloom in Chocolate to Polymorphic Transition of Cocoa Butter. Journal of the American Oil Chemists Society, 1998. 75(11): p. 1609-1615.
50. Adenier, H., et al., Le blanchiment gras I. Observations et commentaires. Chocolaterie Confiserie de France, 1975. 315: p. 7-14.
212
51. Schlichter-Aronhime, J., N. Garti, and S. Sarig, The Bleaching of Chocolate Relating to Polymorphism of Cocoa Butter. Industrie alimentari, 1984. 23(11): p. 871-877.
52. Chaiseri, S. and P.S. Dimick, Dynamic crystallization of cocoa butter .1. Characterization of simple lipids in rapid- and slow-nucleating cocoa butters and their seed crystals. Journal of the American Oil Chemists Society, 1995. 72(12): p. 1491-1986.
53. Savage, C.M. and P.S. Dimick, Influence of Phospholipids During Crystallization of Hard and Soft Cocoa Butters. The Manufacturing Confectioner, 1995. 75: p. 127-132.
54. Brunello, N., S.E. McGauley, and A. Marangoni, Mechanical Properties of cocoa butter in relation to its crystallization behavior and microstructure. Lebensmittel-Wissenschaft & Technologie, 2003. 36: p. 525-532.
55. Walter, P. and P. Cornillon, Influence of Thermal Conditions and Presence of Additives on Fat Bloom in Chocolate. Journal of the American Oil Chemists Society, 2001. 78(9): p. 927-932.
56. Keller, G., et al., Investigation of the complex thermal behavior of fats - Combined DSC and X-ray diffraction techniques. Journal of Thermal Analysis, 1996. 47(5): p. 1545-1565.
57. Arruda, D.H. and P.S. Dimick, Phospholipid Composition of Lipid Seed Crystal Isolates from Ivory Coast Cocoa Butter. Journal of the American Oil Chemists Society, 1991. 68(6): p. 385-390.
58. Hachiya, I., T. Koyano, and K. Sato, Seeding Effects on Crystallization Behavior of Cocoa Butter. Agricultural and Biological Chemistry, 1989. 53(2): p. 327-332.
59. Hindle, S.A., M.J.W. Povey, and K.W. Smith, Characterizing cocoa-butter seed crystals by the oil-in-water emulsion crystallization method. Journal of the American Oil Chemists Society, 2002. 79(10): p. 993-1002.
60. Koyano, T., I. Hachiya, and K. Sato, Fat Polymorphism and Crystal Seeding Effects on Fat Bloom Stability of Dark Chocolate. Food Structure, 1990. 9(3): p. 231-240.
61. Davis, T.R. and P.S. Dimick, Lipid-Composition of High-Melting Seed Crystals Formed During Cocoa Butter Solidification. Journal of the American Oil Chemists Society, 1989. 66(10): p. 1494-1498.
62. Feuge, R.O., et al., Tempering Triglycerides by Mechanical Working. Journal of the American Oil Chemists Society, 1962. 39(7): p. 310-&.
63. MacMillan, S.D., et al., Identification of the initial nucleating form involved in the thermal processing of cocoa butter fat as examined using wide angle X-ray scattering (WAXS). Crystal Growth & Design, 2003. 3(2): p. 117-119.
64. Ziegleder, G., Vorkristallisation von Schokoladen. Susswaren, 1993. 1-2: p. 54-58.
65. Windhab, E., E. Niediek, A,, and L. Rolfes, Tieftemperature-Scherkristallisation. Susswaren, 1993. 3: p. 32-37.
66. Mazzanti, G., et al., A conceptual model for shear-induced phase behavior in crystallizing cocoa butter. Crystal Growth & Design, 2007. 7(7): p. 1230-1241.
213
67. Higaki, K., et al., Effects of ultrasonic irradiation on crystallization behavior of tripalmitoylglycerol and cocoa butter. Journal of the American Oil Chemists Society, 2001. 78(5): p. 513-518.
68. Dimick, P.S. and D.M. Manning, Thermal and Compositional Properties of Cocoa Butter During Static Crystallization. Journal of the American Oil Chemists Society, 1987. 64(12): p. 1663-1669.
69. Narine, S.S. and A.G. Marangoni, Relating the structure of fat crystal networks to mechanical properties : a review. Food Research International, 1999. 32(4): p. 227-248.
70. Hodge, S.M. and D. Rousseau, Fat bloom formation and characterization in milk chocolate observed by atomic force microscopy. Journal of the American Oil Chemists Society, 2002. 79(11): p. 1115-1121.
71. Tietz, R.A. and R.W. Hartel, Effects of minor lipids on crystallization of milk fat-cocoa butter blends and bloom formation in chocolate. Journal of the American Oil Chemists Society, 2000. 77(7): p. 763-771.
72. Vaeck, S.V., Kakaobutter und Fettreif. International Chocolate Review, 1961. 16: p. 442-459.
73. Vaeck, S.V., Uber Kakaobutter und den Fettreif von Kakao-Erzeugnissen. Fette Seifen Anstrichmittel, 1960. 62(8): p. 709-722.
74. Brunello, N., The Rheology of Cocoa Butter in Relation to its Crystallization Behaviour and Microstructure, in Department of Food Science. 2002, University of Guelph: Guelph. p. 128.
75. Narine, S.S. and A.G. Marangoni, Relating structure of fat crystal networks to mechanical properties: a review. Food Research International, 1999. 32(4): p. 227-248.
76. Narine, S.S. and A.G. Marangoni, Mechanical and structural model of fractal networks of fat crystals at low deformations. Physical Review E, 1999. 60(6): p. 6991-7000.
77. deMan, J.M., Relationship amoung chemical, physical and textural properties of fats, in Physical properties of fats, oils and emulsions, N. Widlak, Editor. 1999, AOCS Press: Champaign, IL USA. p. 79-95.
78. deMan, J.M., Texture of fats and fat products, in Rheology and texture in food quality, D.W. Stanley, Editor. 1976, AVI Press: Westport, CT. p. 355-381.
79. Campos, R., S.S. Narine, and A.G. Marangoni, Effect of cooling rate on the structure and mechanical properties of milk fat and lard. Food Research International, 2002. 35(10): p. 971-981.
80. Hohne, G.W.H., W.F. Hemminger, and H.-J. Flammersheim, Differential Scanning Calorimetry. 2nd ed. 2003, Berlin Heidelberg New York: Springer-Verlag. 298.
81. Höhne, G., Differential scanning calorimetry : an introduction for practitioners. 2nd rev. and enl. ed. ed. 2003, New York: Springer. 298.
82. Fang, T.N., et al., Rheological Behaviour of Cocoa Dispersions. Journal of Texture Studies, 1995. 26(2): p. 203-215.
83. Olhero, S.M. and J.M.F. Ferreira, Influence of particle size distribution on rheology and particle packing of silica-based suspensions. Powder Technology, 2004. 139(1): p. 69-75.
214
84. Guthrie, S.E., G. Mazzanti, and S.H.J. Idziak, X-ray phase identification of chocolate is possible without the removal of sugar. European Journal of Lipid Science and Technology, 2005. 107(9): p. 656-659.
85. Press, W.H., et al., Numerical recipes example book (C). 2nd ed. 1992, Cambridge, England: Cambridge University Press.
86. Rabinovich, M.K., V.G. Kudryashov, and M.V. Markushev, Effect of grain size on the structural strength of the aluminum alloy AMg6. Metal Science and Heat Treatment, 1988. 30(8): p. 609-612.
87. Kirchner, H.P. and R.M. Gruver, Strength-Anisotropy-Grain Size Relations in Ceramic Oxides. Journal of the American Ceramic Society, 1970. 53(5): p. 232-236.
88. Matsuo, Y., et al., Magnetic properties and mechanical strength of MnZn ferrite. IEEE Transactions on Magnetics, 2001. 37(4): p. 2369-2372.