Embed Size (px)
Citation preview
This document consists of 17 printed pages and 3 blank pages.
IB15 11_0652_61/3RP © UCLES 2015 [Turn over
*7401412604*
Cambridge International Examinations Cambridge International General Certificate of Secondary Education
PHYSICAL SCIENCE 0652/61
Paper 6 Alternative to Practical October/November 2015
1 hour
Candidates answer on the Question Paper.
No Additional Materials are required.
READ THESE INSTRUCTIONS FIRST Write your Centre number, candidate number and name on all the work you hand in. Write in dark blue or black pen. You may use an HB pencil for any diagrams or graphs. Do not use staples, paper clips, glue or correction fluid. DO NOT WRITE IN ANY BARCODES. Answer all questions. Electronic calculators may be used. You may lose marks if you do not show your working or if you do not use appropriate units. At the end of the examination, fasten all your work securely together. The number of marks is given in brackets [ ] at the end of each question or part question.
2
© UCLES 2015 0652/61/O/N/15
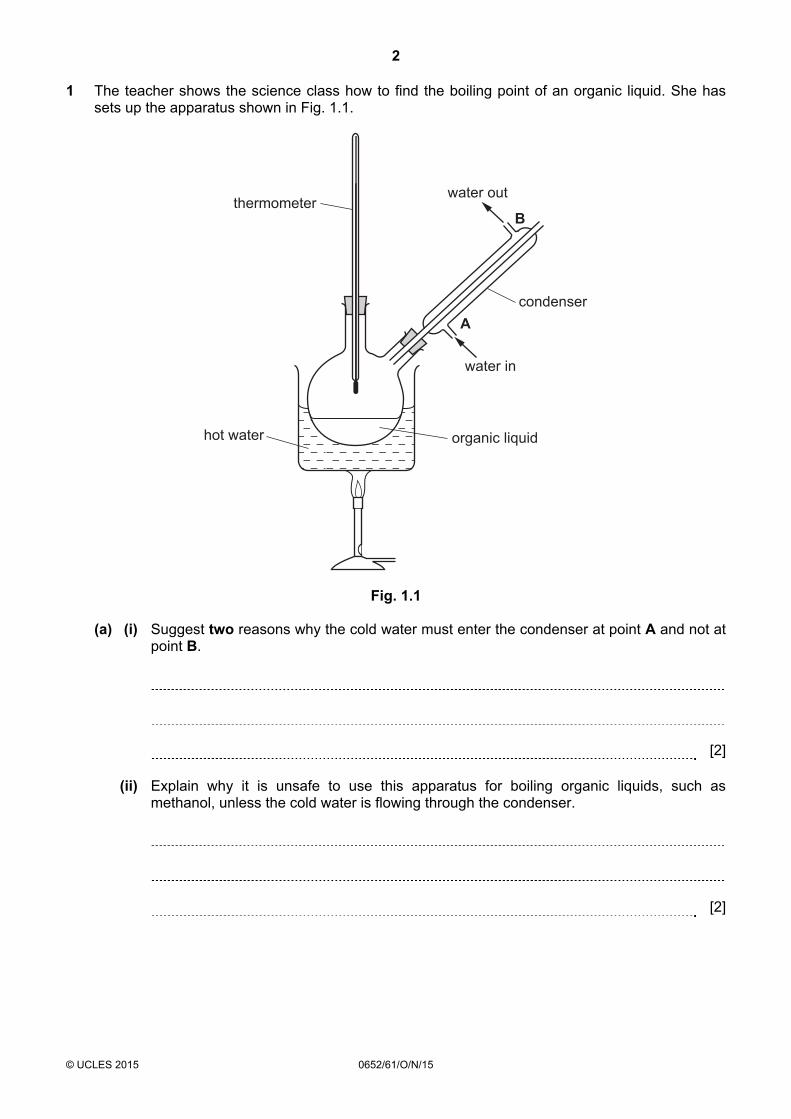
1 The teacher shows the science class how to find the boiling point of an organic liquid. She has sets up the apparatus shown in Fig. 1.1.
water in
water out
condenser
thermometer
hot water organic liquid
A
B
Fig. 1.1 (a) (i) Suggest two reasons why the cold water must enter the condenser at point A and not at
point B.
[2] (ii) Explain why it is unsafe to use this apparatus for boiling organic liquids, such as
methanol, unless the cold water is flowing through the condenser.
[2]
3
© UCLES 2015 0652/61/O/N/15 [Turn over
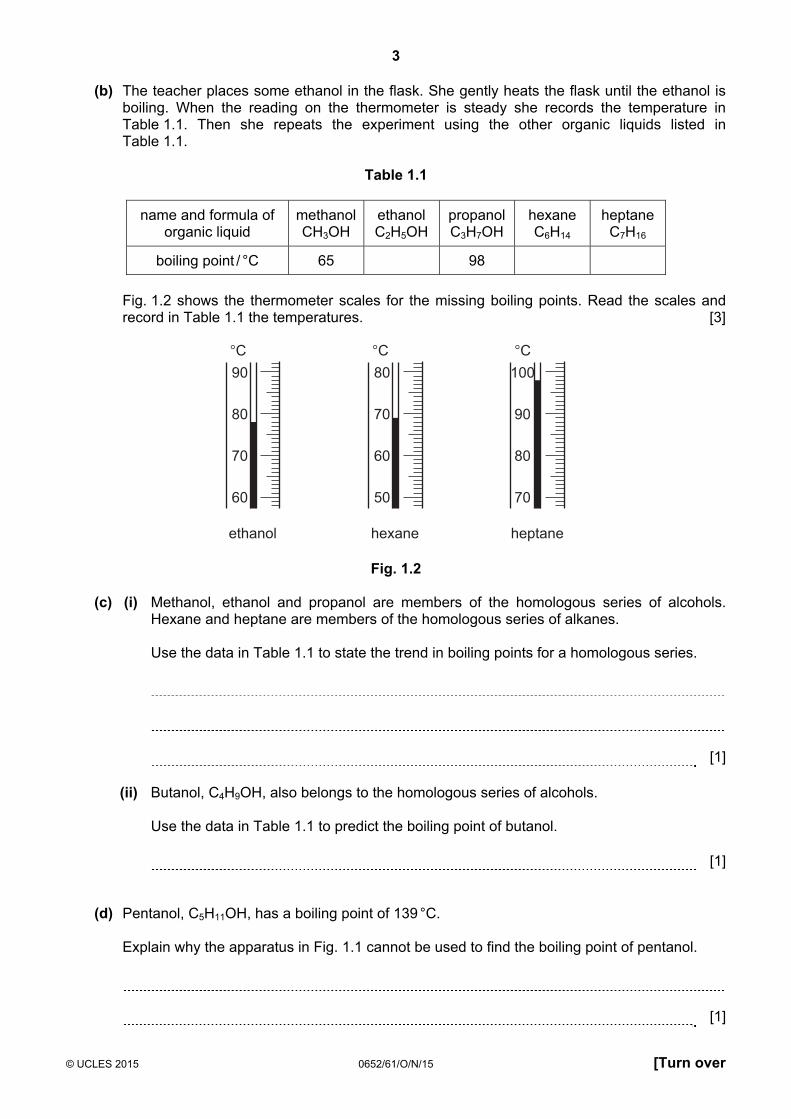
(b) The teacher places some ethanol in the flask. She gently heats the flask until the ethanol is boiling. When the reading on the thermometer is steady she records the temperature in Table 1.1. Then she repeats the experiment using the other organic liquids listed in Table 1.1.
Table 1.1
name and formula of
organic liquid methanol CH3OH
ethanol C2H5OH
propanol C3H7OH
hexane C6H14
heptane C7H16
boiling point / °C 65 98 Fig. 1.2 shows the thermometer scales for the missing boiling points. Read the scales and
record in Table 1.1 the temperatures. [3]
90
80
70
60
°C
ethanol
80
70
60
50
°C
hexane
100
90
80
70
°C
heptane
Fig. 1.2 (c) (i) Methanol, ethanol and propanol are members of the homologous series of alcohols.
Hexane and heptane are members of the homologous series of alkanes. Use the data in Table 1.1 to state the trend in boiling points for a homologous series.
[1] (ii) Butanol, C4H9OH, also belongs to the homologous series of alcohols. Use the data in Table 1.1 to predict the boiling point of butanol.
[1] (d) Pentanol, C5H11OH, has a boiling point of 139 °C. Explain why the apparatus in Fig. 1.1 cannot be used to find the boiling point of pentanol.
[1]
4
© UCLES 2015 0652/61/O/N/15
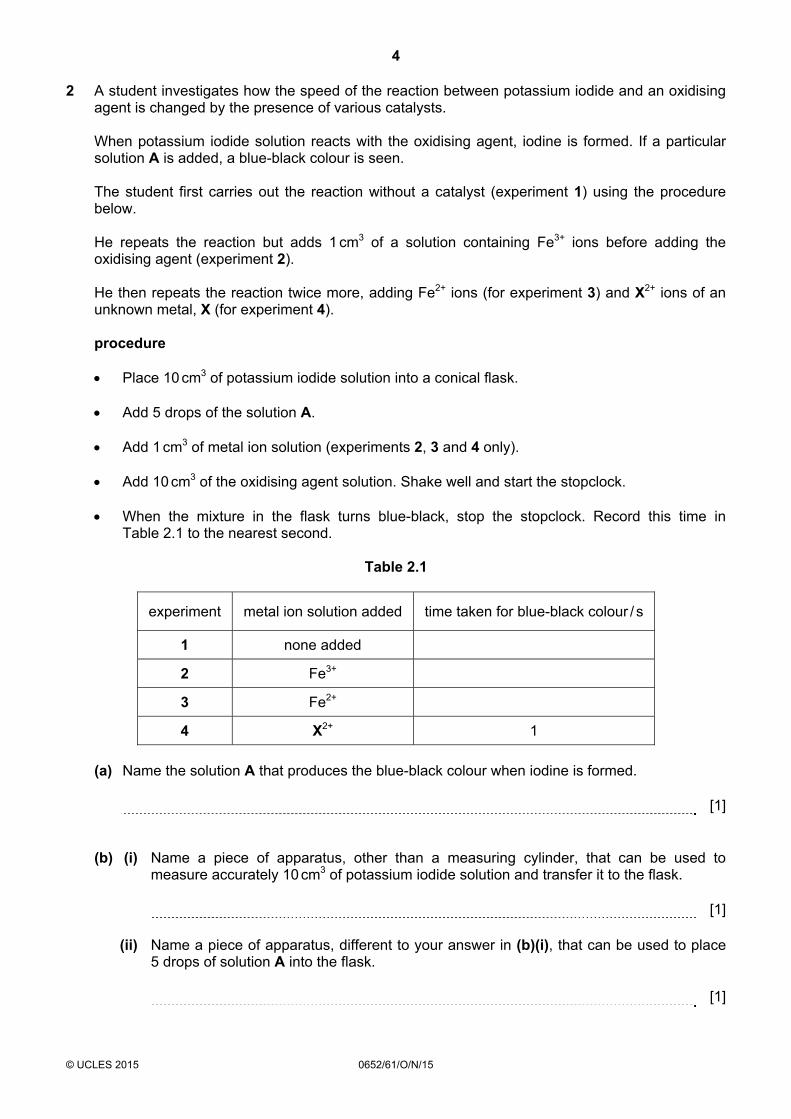
2 A student investigates how the speed of the reaction between potassium iodide and an oxidising agent is changed by the presence of various catalysts.
When potassium iodide solution reacts with the oxidising agent, iodine is formed. If a particular
solution A is added, a blue-black colour is seen. The student first carries out the reaction without a catalyst (experiment 1) using the procedure
below. He repeats the reaction but adds 1 cm3 of a solution containing Fe3+ ions before adding the
oxidising agent (experiment 2). He then repeats the reaction twice more, adding Fe2+ ions (for experiment 3) and X2+ ions of an
unknown metal, X (for experiment 4). procedure
• Place 10 cm3 of potassium iodide solution into a conical flask.
• Add 5 drops of the solution A.
• Add 1 cm3 of metal ion solution (experiments 2, 3 and 4 only).
• Add 10 cm3 of the oxidising agent solution. Shake well and start the stopclock.
• When the mixture in the flask turns blue-black, stop the stopclock. Record this time in Table 2.1 to the nearest second.
Table 2.1
experiment metal ion solution added time taken for blue-black colour / s
1 none added
2 Fe3+
3 Fe2+
4 X2+ 1 (a) Name the solution A that produces the blue-black colour when iodine is formed.
[1] (b) (i) Name a piece of apparatus, other than a measuring cylinder, that can be used to
measure accurately 10 cm3 of potassium iodide solution and transfer it to the flask.
[1] (ii) Name a piece of apparatus, different to your answer in (b)(i), that can be used to place
5 drops of solution A into the flask.
[1]
5
© UCLES 2015 0652/61/O/N/15 [Turn over
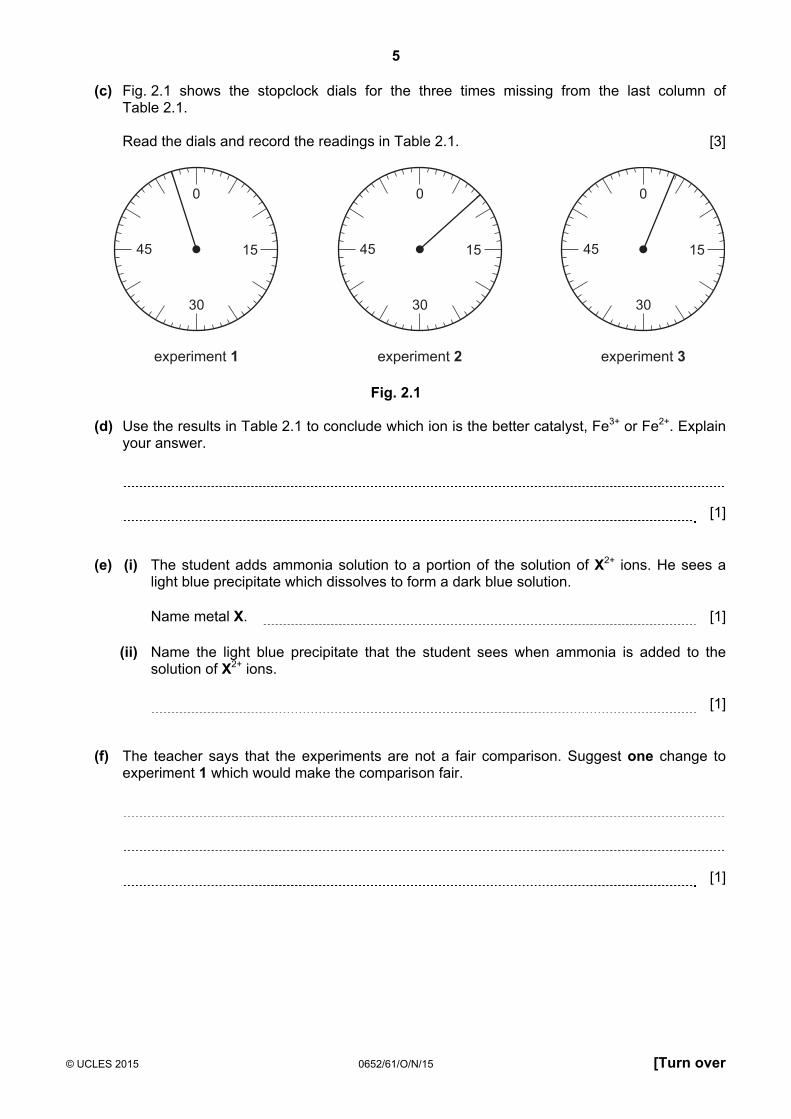
(c) Fig. 2.1 shows the stopclock dials for the three times missing from the last column of Table 2.1.
Read the dials and record the readings in Table 2.1. [3]
0
15
30
45
experiment 3
0
15
30
45
experiment 2
0
15
30
45
experiment 1
Fig. 2.1 (d) Use the results in Table 2.1 to conclude which ion is the better catalyst, Fe3+ or Fe2+. Explain
your answer.
[1] (e) (i) The student adds ammonia solution to a portion of the solution of X2+ ions. He sees a
light blue precipitate which dissolves to form a dark blue solution.
Name metal X. [1] (ii) Name the light blue precipitate that the student sees when ammonia is added to the
solution of X2+ ions.
[1] (f) The teacher says that the experiments are not a fair comparison. Suggest one change to
experiment 1 which would make the comparison fair.
[1]
6
© UCLES 2015 0652/61/O/N/15
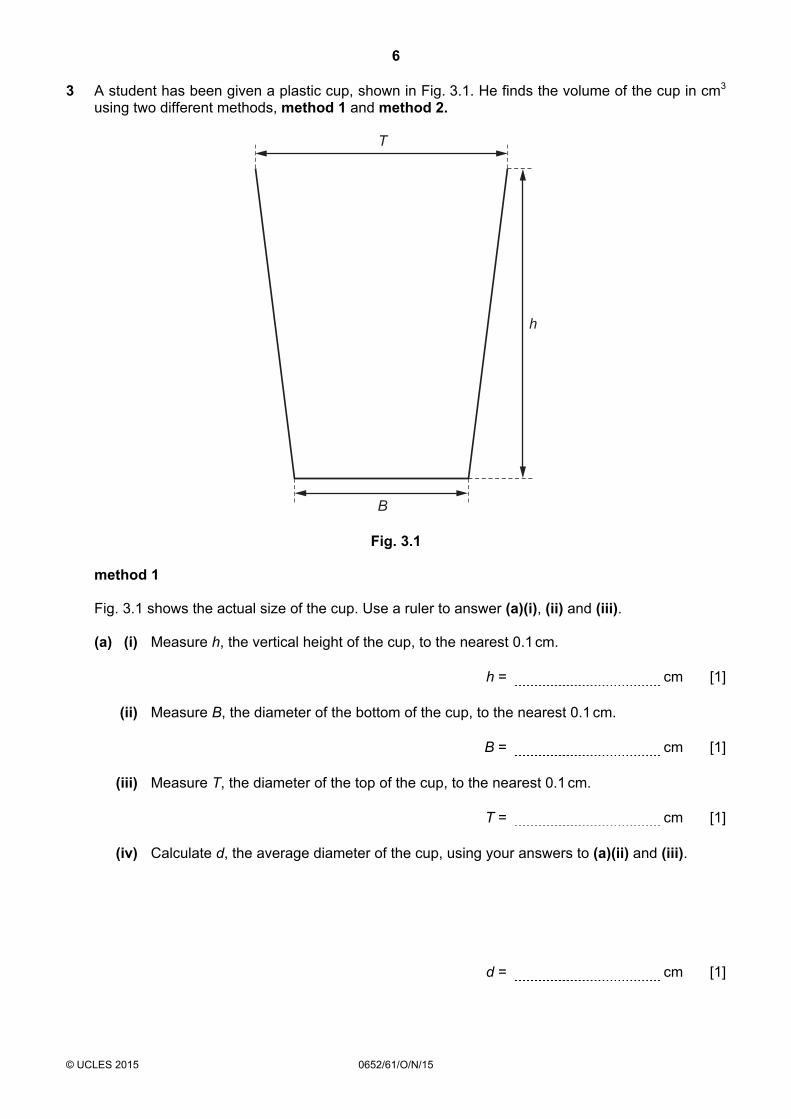
3 A student has been given a plastic cup, shown in Fig. 3.1. He finds the volume of the cup in cm3 using two different methods, method 1 and method 2.
T
B
h
Fig. 3.1 method 1 Fig. 3.1 shows the actual size of the cup. Use a ruler to answer (a)(i), (ii) and (iii). (a) (i) Measure h, the vertical height of the cup, to the nearest 0.1 cm.
h = cm [1] (ii) Measure B, the diameter of the bottom of the cup, to the nearest 0.1 cm.
B = cm [1] (iii) Measure T, the diameter of the top of the cup, to the nearest 0.1 cm.
T = cm [1] (iv) Calculate d, the average diameter of the cup, using your answers to (a)(ii) and (iii).
d = cm [1]
7
© UCLES 2015 0652/61/O/N/15 [Turn over
(v) Calculate V1, the volume of the cup, to the nearest cm3, using the equation
V1 = πd2
4h
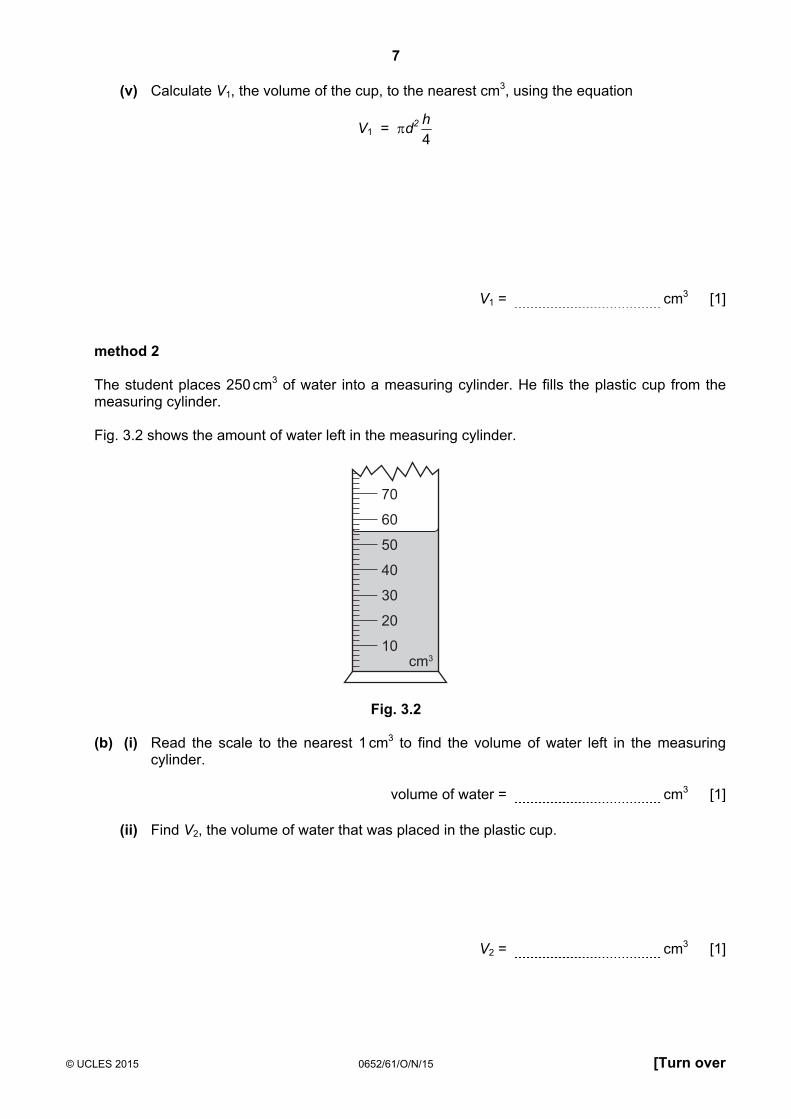
V1 = cm3 [1] method 2 The student places 250 cm3 of water into a measuring cylinder. He fills the plastic cup from the
measuring cylinder. Fig. 3.2 shows the amount of water left in the measuring cylinder.
70
60
50
40
30
20
10cm3
Fig. 3.2 (b) (i) Read the scale to the nearest 1 cm3 to find the volume of water left in the measuring
cylinder.
volume of water = cm3 [1] (ii) Find V2, the volume of water that was placed in the plastic cup.
V2 = cm3 [1]
8
© UCLES 2015 0652/61/O/N/15
(c) The student thinks that method 2 is less accurate than method 1. Suggest two sources of inaccuracy in method 2.
1
2
[2] (d) Another student finds the mass in grams of the empty plastic cup. Then he finds its mass
when it is full of water. Explain how he can use these two masses to find the volume of water in the cup.
[1]

9
© UCLES 2015 0652/61/O/N/15 [Turn over
Please turn over for Question 4.
10
© UCLES 2015 0652/61/O/N/15
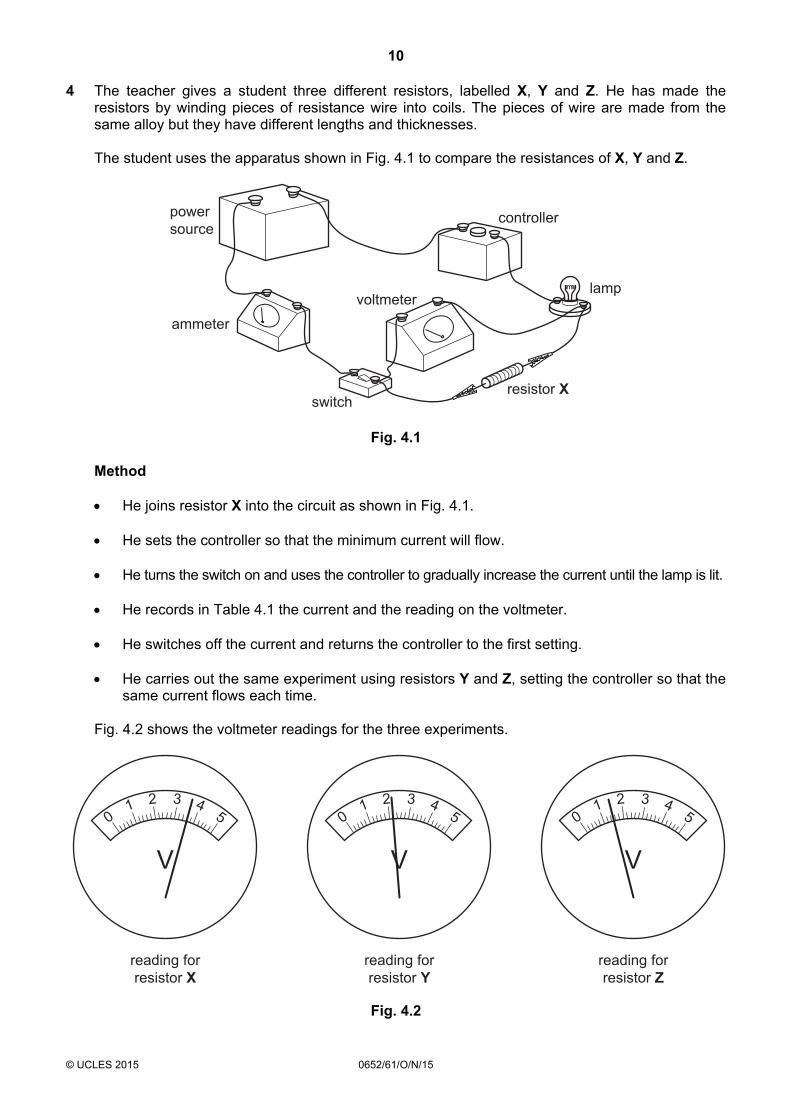
4 The teacher gives a student three different resistors, labelled X, Y and Z. He has made the resistors by winding pieces of resistance wire into coils. The pieces of wire are made from the same alloy but they have different lengths and thicknesses.
The student uses the apparatus shown in Fig. 4.1 to compare the resistances of X, Y and Z.
ammeter
powersource
controller
switch
lampvoltmeter
resistor X
Fig. 4.1
Method
• He joins resistor X into the circuit as shown in Fig. 4.1.
• He sets the controller so that the minimum current will flow.
• He turns the switch on and uses the controller to gradually increase the current until the lamp is lit.
• He records in Table 4.1 the current and the reading on the voltmeter.
• He switches off the current and returns the controller to the first setting.
• He carries out the same experiment using resistors Y and Z, setting the controller so that the same current flows each time.
Fig. 4.2 shows the voltmeter readings for the three experiments.
501 2 3 4
V
reading forresistor Z
501 2 3 4
V
reading forresistor Y
501 2 3 4
V
reading forresistor X
Fig. 4.2
11
© UCLES 2015 0652/61/O/N/15 [Turn over
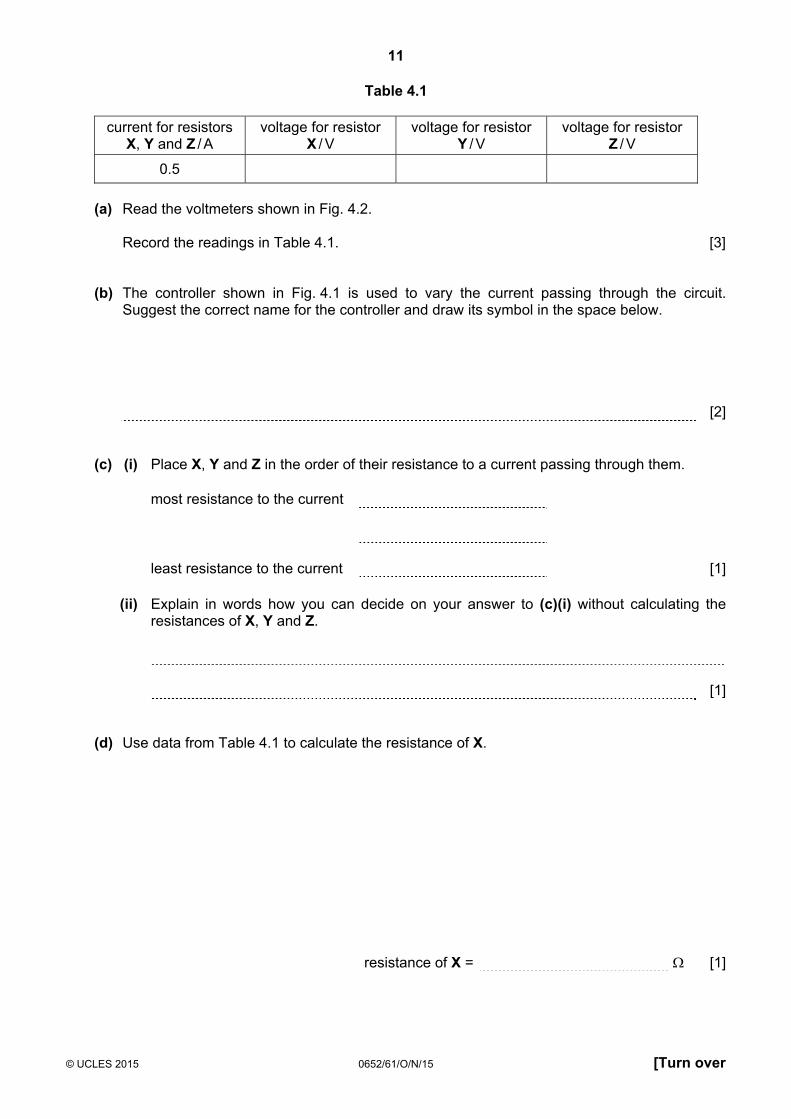
Table 4.1
current for resistors X, Y and Z / A
voltage for resistor X / V
voltage for resistor Y / V
voltage for resistor Z / V
0.5 (a) Read the voltmeters shown in Fig. 4.2. Record the readings in Table 4.1. [3] (b) The controller shown in Fig. 4.1 is used to vary the current passing through the circuit.
Suggest the correct name for the controller and draw its symbol in the space below.
[2] (c) (i) Place X, Y and Z in the order of their resistance to a current passing through them.
most resistance to the current
least resistance to the current [1] (ii) Explain in words how you can decide on your answer to (c)(i) without calculating the
resistances of X, Y and Z.
[1] (d) Use data from Table 4.1 to calculate the resistance of X.
resistance of X = Ω [1]
12
© UCLES 2015 0652/61/O/N/15
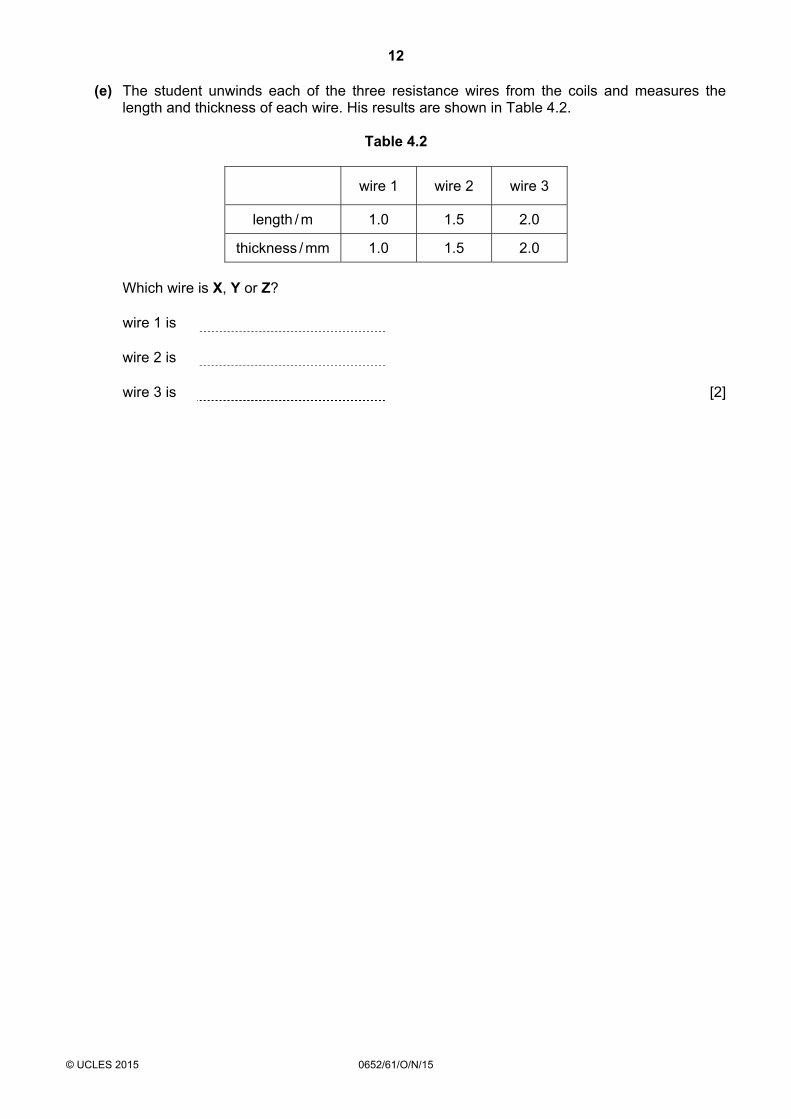
(e) The student unwinds each of the three resistance wires from the coils and measures the length and thickness of each wire. His results are shown in Table 4.2.
Table 4.2
wire 1 wire 2 wire 3
length / m 1.0 1.5 2.0
thickness / mm 1.0 1.5 2.0 Which wire is X, Y or Z?
wire 1 is
wire 2 is
wire 3 is [2]
13
© UCLES 2015 0652/61/O/N/15 [Turn over
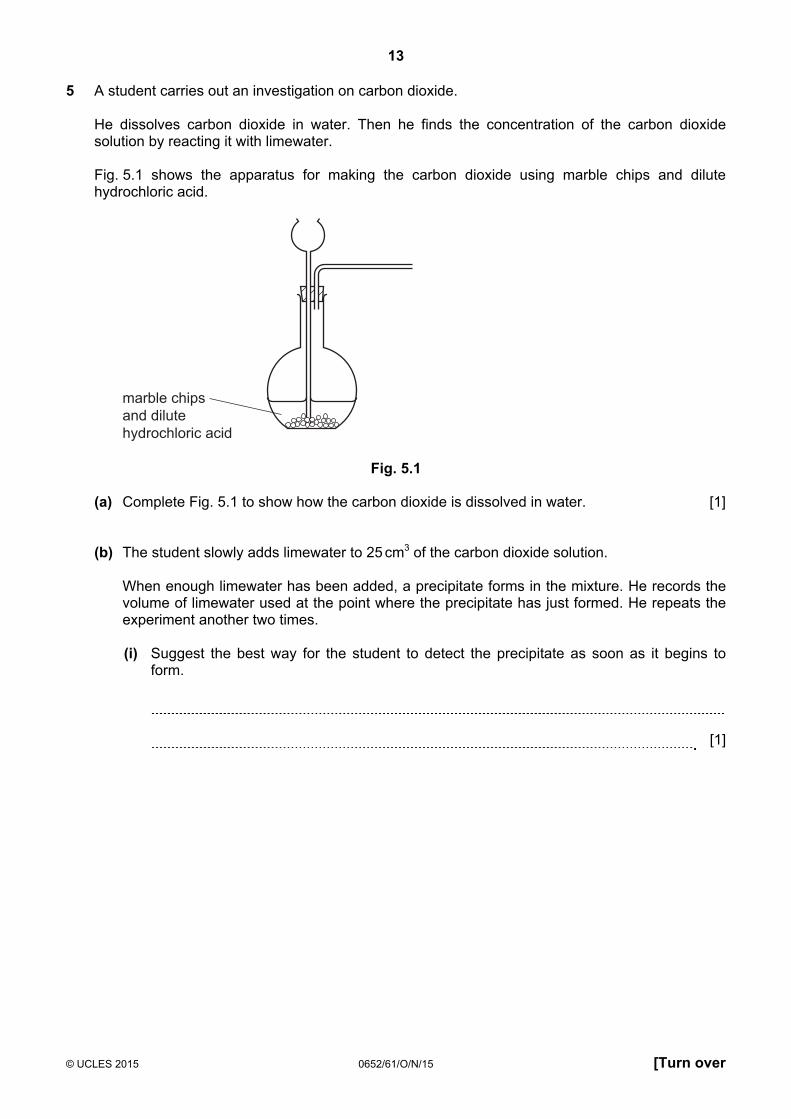
5 A student carries out an investigation on carbon dioxide. He dissolves carbon dioxide in water. Then he finds the concentration of the carbon dioxide
solution by reacting it with limewater. Fig. 5.1 shows the apparatus for making the carbon dioxide using marble chips and dilute
hydrochloric acid.
marble chipsand dilutehydrochloric acid
Fig. 5.1
(a) Complete Fig. 5.1 to show how the carbon dioxide is dissolved in water. [1] (b) The student slowly adds limewater to 25 cm3 of the carbon dioxide solution. When enough limewater has been added, a precipitate forms in the mixture. He records the
volume of limewater used at the point where the precipitate has just formed. He repeats the experiment another two times.
(i) Suggest the best way for the student to detect the precipitate as soon as it begins to
form.
[1]
14
© UCLES 2015 0652/61/O/N/15
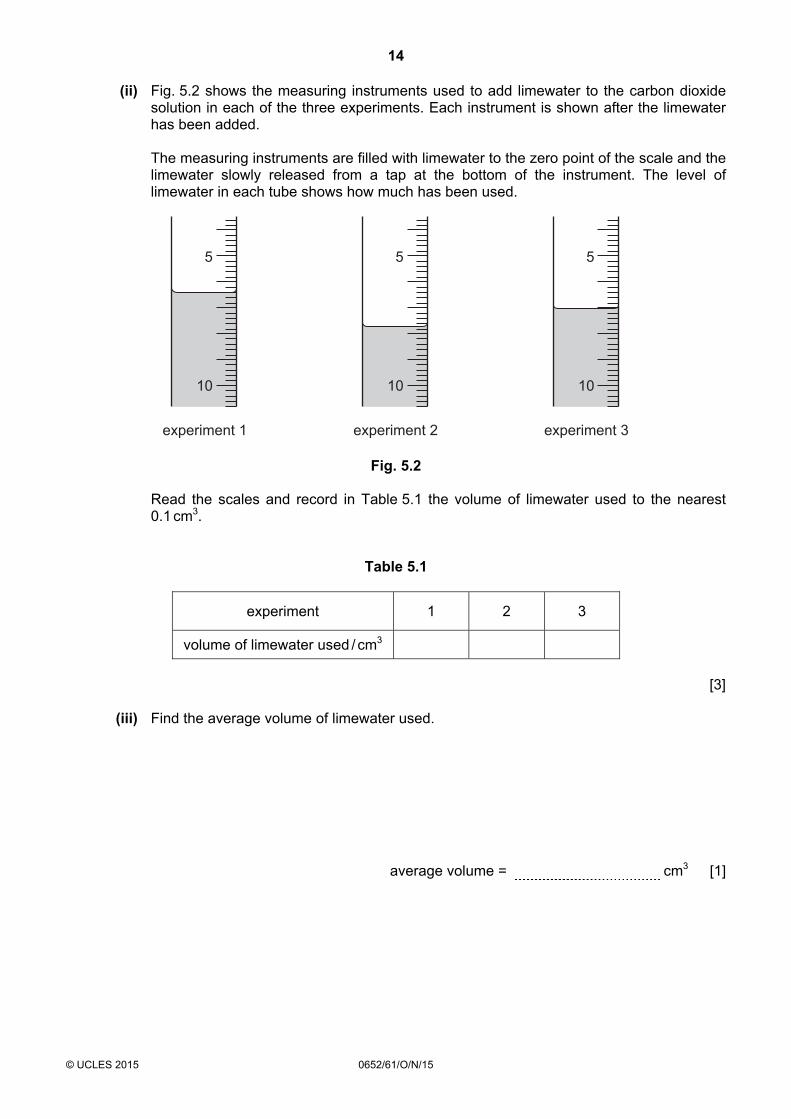
(ii) Fig. 5.2 shows the measuring instruments used to add limewater to the carbon dioxide solution in each of the three experiments. Each instrument is shown after the limewater has been added.
The measuring instruments are filled with limewater to the zero point of the scale and the
limewater slowly released from a tap at the bottom of the instrument. The level of limewater in each tube shows how much has been used.
5
10
experiment 1
5
10
experiment 2
5
10
experiment 3
Fig. 5.2 Read the scales and record in Table 5.1 the volume of limewater used to the nearest
0.1 cm3.
Table 5.1
experiment 1 2 3
volume of limewater used / cm3 [3] (iii) Find the average volume of limewater used.
average volume = cm3 [1]
15
© UCLES 2015 0652/61/O/N/15 [Turn over
(c) Calculate the concentration of the carbon dioxide solution. Use the formula shown below.
concentration of carbon dioxide solution = solutiondioxidecarbonofvolume
dm/mol0.015limewaterofvolumeaverage 3×
concentration of carbon dioxide solution = mol / dm3 [2] (d) A solution of carbon dioxide in water is slightly acidic. Limewater is alkaline. An indicator may be used in this experiment instead of looking for the precipitate. Suggest a suitable indicator to add to the carbon dioxide solution. State the colour change
when enough limewater has been added to react with all of the carbon dioxide solution.
indicator
colour change to [2]
16
© UCLES 2015 0652/61/O/N/15
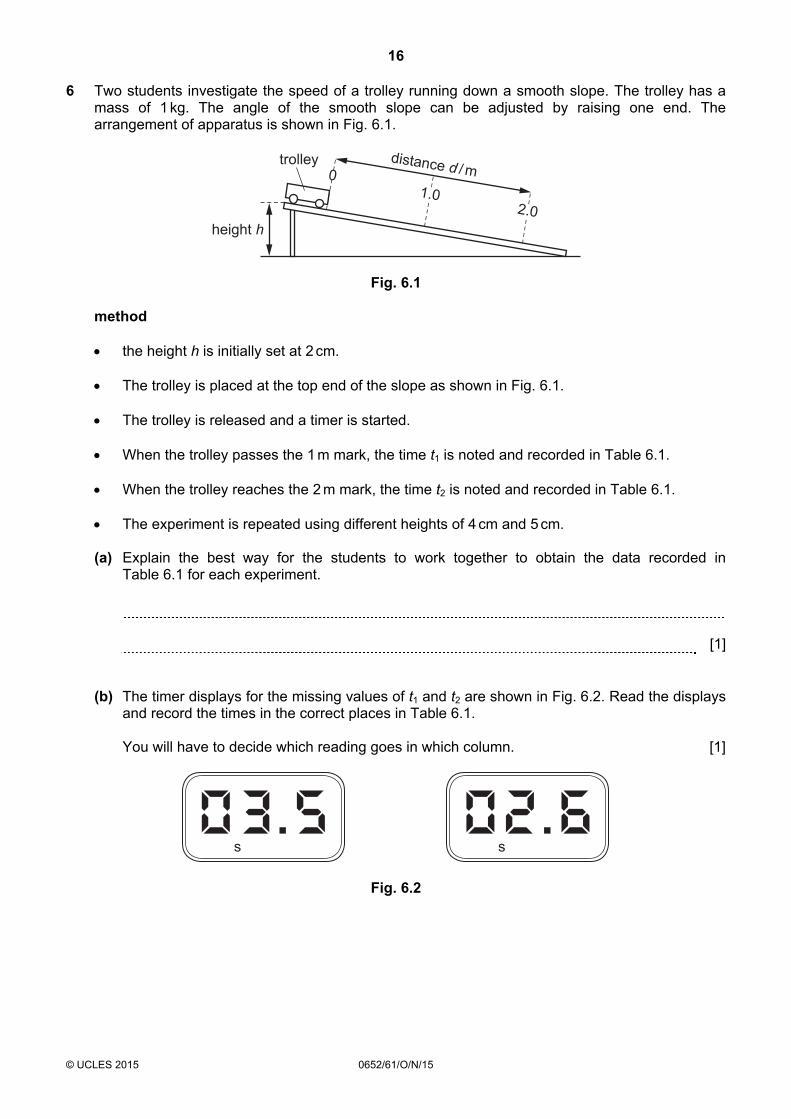
6 Two students investigate the speed of a trolley running down a smooth slope. The trolley has a mass of 1 kg. The angle of the smooth slope can be adjusted by raising one end. The arrangement of apparatus is shown in Fig. 6.1.
height h
trolley0
1.02.0
distance d / m
Fig. 6.1 method
• the height h is initially set at 2 cm.
• The trolley is placed at the top end of the slope as shown in Fig. 6.1.
• The trolley is released and a timer is started.
• When the trolley passes the 1 m mark, the time t1 is noted and recorded in Table 6.1.
• When the trolley reaches the 2 m mark, the time t2 is noted and recorded in Table 6.1.
• The experiment is repeated using different heights of 4 cm and 5 cm. (a) Explain the best way for the students to work together to obtain the data recorded in
Table 6.1 for each experiment.
[1] (b) The timer displays for the missing values of t1 and t2 are shown in Fig. 6.2. Read the displays
and record the times in the correct places in Table 6.1. You will have to decide which reading goes in which column. [1]
s s
Fig. 6.2
17
© UCLES 2015 0652/61/O/N/15 [Turn over
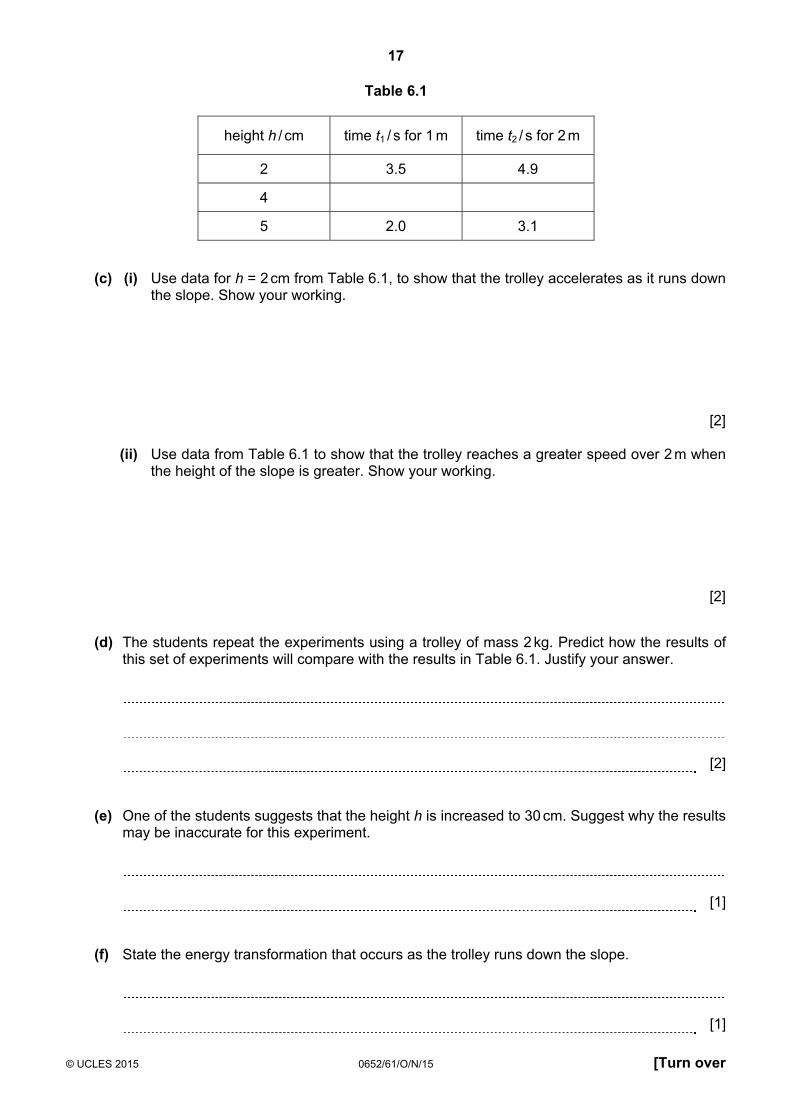
Table 6.1
height h / cm time t1 / s for 1 m time t2 / s for 2 m
2 3.5 4.9
4
5 2.0 3.1 (c) (i) Use data for h = 2 cm from Table 6.1, to show that the trolley accelerates as it runs down
the slope. Show your working.
[2] (ii) Use data from Table 6.1 to show that the trolley reaches a greater speed over 2 m when
the height of the slope is greater. Show your working.
[2] (d) The students repeat the experiments using a trolley of mass 2 kg. Predict how the results of
this set of experiments will compare with the results in Table 6.1. Justify your answer.
[2] (e) One of the students suggests that the height h is increased to 30 cm. Suggest why the results
may be inaccurate for this experiment.
[1] (f) State the energy transformation that occurs as the trolley runs down the slope.
[1]

18
© UCLES 2015 0652/61/O/N/15
BLANK PAGE

19
© UCLES 2015 0652/61/O/N/15
BLANK PAGE
20
Permission to reproduce items where third-party owned material protected by copyright is included has been sought and cleared where possible. Every reasonable effort has been made by the publisher (UCLES) to trace copyright holders, but if any items requiring clearance have unwittingly been included, the publisher will be pleased to make amends at the earliest possible opportunity. To avoid the issue of disclosure of answer-related information to candidates, all copyright acknowledgements are reproduced online in the Cambridge International Examinations Copyright Acknowledgements Booklet. This is produced for each series of examinations and is freely available to download at www.cie.org.uk after the live examination series. Cambridge International Examinations is part of the Cambridge Assessment Group. Cambridge Assessment is the brand name of University of Cambridge Local Examinations Syndicate (UCLES), which is itself a department of the University of Cambridge. © UCLES 2015 0652/61/O/N/15
BLANK PAGE