Embed Size (px)
Citation preview
The University of the State of New York
REGENTS HIGH SCHOOL EXAMINATION
PHYSICAL SETTING
EARTH SCIENCEWednesday, June 22, 2005 — 9:15 a.m. to 12:15 p.m., only
This is a test of your knowledge of Earth science. Use that knowledge to answerall questions in this examination. Some questions may require the use of the EarthScience Reference Tables. The Earth Science Reference Tables are supplied separately.Be certain you have a copy of the 2001 edition of these reference tables before youbegin the examination.
Your answer sheet for Part A and Part B–1 is the last page of this examinationbooklet. Turn to the last page and fold it along the perforations. Then, slowly andcarefully, tear off your answer sheet and fill in the heading.
The answers to the questions in Part B–2 and Part C are to be written in yourseparate answer booklet. Be sure to fill in the heading on the front of your answerbooklet.
You are to answer all questions in all parts of this examination according to thedirections provided in the examination booklet. Record your answers to the Part Aand Part B–1 multiple-choice questions on your separate answer sheet. Write youranswers to the Part B–2 and Part C questions in your answer booklet. All work shouldbe written in pen, except for graphs and drawings, which should be done in pencil.You may use scrap paper to work out the answers to the questions, but be sure torecord all your answers on your separate answer sheet and in your answer booklet.
When you have completed the examination, you must sign the statement printedat the end of your separate answer sheet, indicating that you had no unlawfulknowledge of the questions or answers prior to the examination and that you haveneither given nor received assistance in answering any of the questions during theexamination. Your answer sheet and answer booklet cannot be accepted if you fail tosign this declaration.
Notice. . .
A four-function or scientific calculator and a copy of the 2001 Earth Science Reference Tablesmust be available for you to use while taking this examination.
The use of any communications device is strictly prohibited when taking thisexamination. If you use any communications device, no matter how briefly, yourexamination will be invalidated and no score will be calculated for you.
DO NOT OPEN THIS EXAMINATION BOOKLET UNTIL THE SIGNAL IS GIVEN.
PS/EARTH SCIENCEPS/EARTH SCIENCE
P.S./E. Sci.–June ’05 [2]
Part A
Answer all questions in this part.
Directions (1–35): For each statement or question, write on your separate answer sheet the number of theword or expression that, of those given, best completes the statement or answers the question. Some questionsmay require the use of the Earth Science Reference Tables.
1 Which list of three planets and Earth’s Moon isarranged in order of increasing equatorial dia-meter?(1) Earth’s Moon, Pluto, Mars, Mercury(2) Pluto, Earth’s Moon, Mercury, Mars(3) Mercury, Mars, Earth’s Moon, Pluto(4) Mars, Mercury, Pluto, Earth’s Moon
2 If Earth’s axis were tilted 35° instead of 23.5°, theaverage temperatures in New York State wouldmost likely(1) decrease in both summer and winter(2) decrease in summer and increase in winter(3) increase in summer and decrease in winter (4) increase in both summer and winter
3 Which star has a higher luminosity and a lowertemperature than the Sun?(1) Rigel (3) Alpha Centauri(2) Barnard’s Star (4) Aldebaran
4 Starlight from distant galaxies provides evidencethat the universe is expanding because thisstarlight shows a shift in wavelength toward the (1) red-light end of the visible spectrum(2) blue-light end of the visible spectrum(3) ultraviolet-ray end of the electromagnetic
spectrum(4) gamma-ray end of the electromagnetic spec-
trum
5 On which day of the year would the intensity ofinsolation at Kingston, New York, most likely begreatest? (1) March 21 (3) September 23(2) June 21 (4) December 21
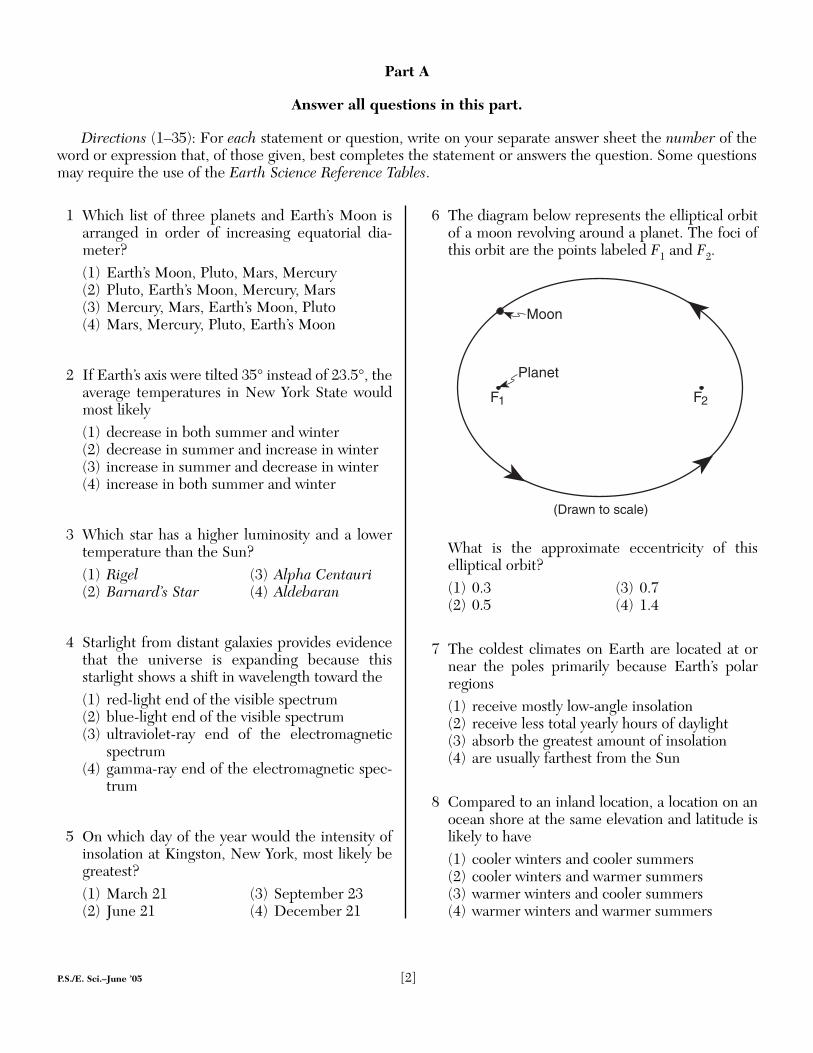
6 The diagram below represents the elliptical orbitof a moon revolving around a planet. The foci ofthis orbit are the points labeled F1 and F2.
What is the approximate eccentricity of this elliptical orbit?(1) 0.3 (3) 0.7(2) 0.5 (4) 1.4
7 The coldest climates on Earth are located at ornear the poles primarily because Earth’s polarregions(1) receive mostly low-angle insolation(2) receive less total yearly hours of daylight(3) absorb the greatest amount of insolation(4) are usually farthest from the Sun
8 Compared to an inland location, a location on anocean shore at the same elevation and latitude islikely to have(1) cooler winters and cooler summers(2) cooler winters and warmer summers(3) warmer winters and cooler summers(4) warmer winters and warmer summers
(Drawn to scale)
Moon
Planet
F1 F2
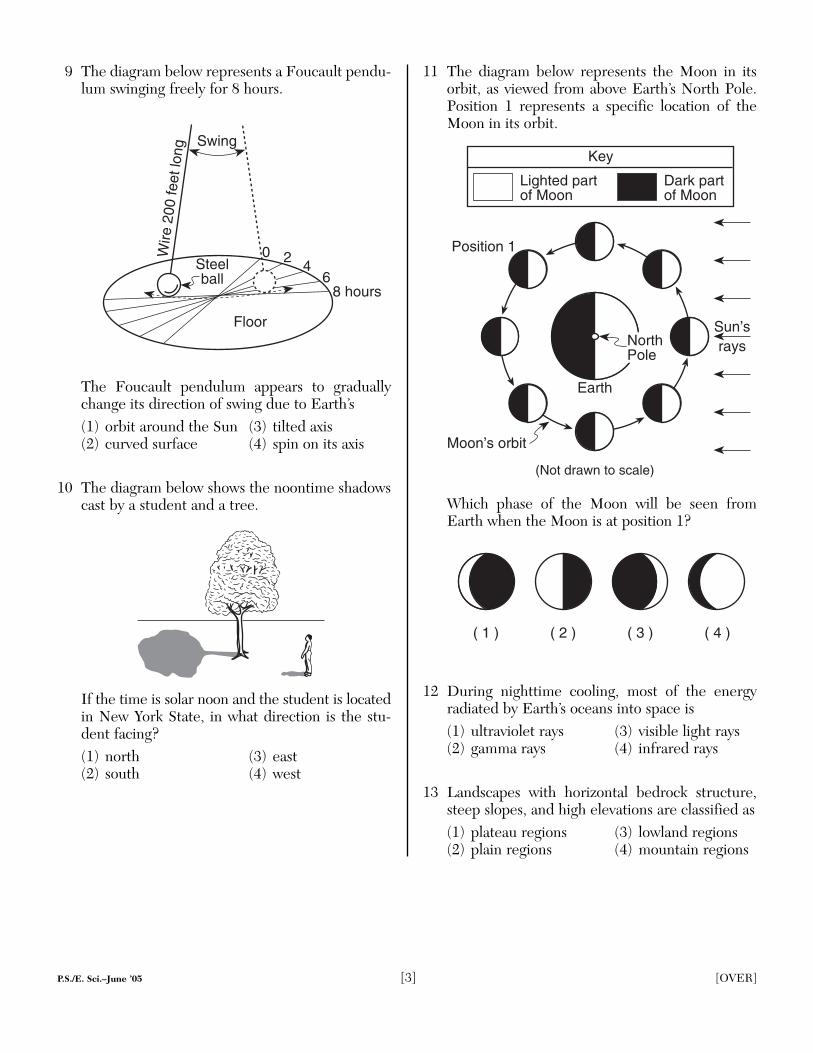
9 The diagram below represents a Foucault pendu-lum swinging freely for 8 hours.
The Foucault pendulum appears to graduallychange its direction of swing due to Earth’s(1) orbit around the Sun (3) tilted axis(2) curved surface (4) spin on its axis
10 The diagram below shows the noontime shadowscast by a student and a tree.
If the time is solar noon and the student is locatedin New York State, in what direction is the stu-dent facing?(1) north (3) east(2) south (4) west
11 The diagram below represents the Moon in itsorbit, as viewed from above Earth’s North Pole.Position 1 represents a specific location of theMoon in its orbit.
Which phase of the Moon will be seen fromEarth when the Moon is at position 1?
12 During nighttime cooling, most of the energyradiated by Earth’s oceans into space is (1) ultraviolet rays (3) visible light rays(2) gamma rays (4) infrared rays
13 Landscapes with horizontal bedrock structure,steep slopes, and high elevations are classified as(1) plateau regions (3) lowland regions(2) plain regions (4) mountain regions
( 1 ) ( 2 ) ( 3 ) ( 4 )
Position 1
Moon’s orbit
NorthPole
(Not drawn to scale)
Earth
Sun’srays
Lighted partof Moon
Dark partof Moon
KeySwing
Wire
200
feet
long
Floor
0 24
68 hours
Steelball
P.S./E. Sci.–June ’05 [3] [OVER]
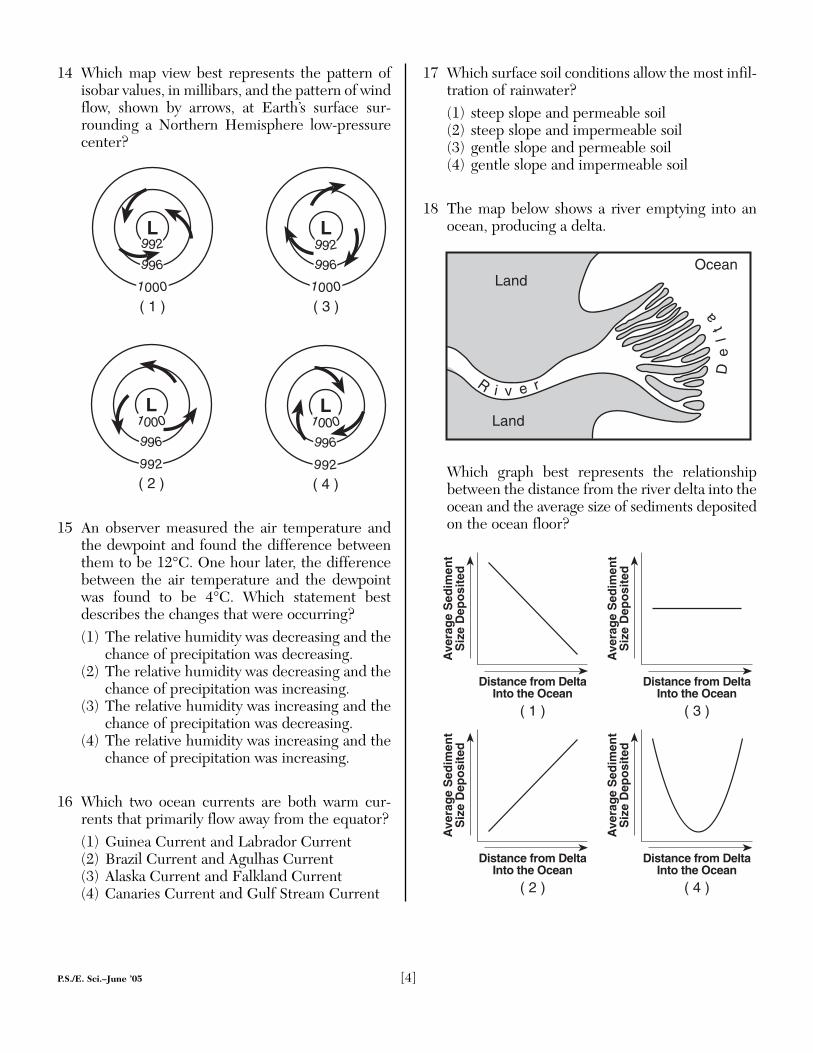
14 Which map view best represents the pattern ofisobar values, in millibars, and the pattern of windflow, shown by arrows, at Earth’s surface sur-rounding a Northern Hemisphere low-pressurecenter?
15 An observer measured the air temperature andthe dewpoint and found the difference betweenthem to be 12°C. One hour later, the differencebetween the air temperature and the dewpointwas found to be 4°C. Which statement bestdescribes the changes that were occurring?(1) The relative humidity was decreasing and the
chance of precipitation was decreasing.(2) The relative humidity was decreasing and the
chance of precipitation was increasing.(3) The relative humidity was increasing and the
chance of precipitation was decreasing.(4) The relative humidity was increasing and the
chance of precipitation was increasing.
16 Which two ocean currents are both warm cur-rents that primarily flow away from the equator?(1) Guinea Current and Labrador Current(2) Brazil Current and Agulhas Current(3) Alaska Current and Falkland Current(4) Canaries Current and Gulf Stream Current
17 Which surface soil conditions allow the most infil-tration of rainwater? (1) steep slope and permeable soil(2) steep slope and impermeable soil(3) gentle slope and permeable soil(4) gentle slope and impermeable soil
18 The map below shows a river emptying into anocean, producing a delta.
Which graph best represents the relationshipbetween the distance from the river delta into theocean and the average size of sediments depositedon the ocean floor?
( 1 )
Ave
rag
e S
edim
ent
Siz
e D
epo
site
d
Distance from DeltaInto the Ocean
( 2 )
Ave
rag
e S
edim
ent
Siz
e D
epo
site
d
Distance from DeltaInto the Ocean
( 3 )
Ave
rag
e S
edim
ent
Siz
e D
epo
site
d
Distance from DeltaInto the Ocean
( 4 )
Ave
rag
e S
edim
ent
Siz
e D
epo
site
d
Distance from DeltaInto the Ocean
Land
Land
R i v e r
De
lt
a
Ocean
L
1000
( 3 )
996
992L
1000
( 1 )
996
992
L
992
( 2 )
996
1000L
992
( 4 )
996
1000
P.S./E. Sci.–June ’05 [4]
P.S./E. Sci.–June ’05 [5] [OVER]
19 Which process could lead directly to the forma-tion of pumice rock?(1) precipitation of minerals from evaporating
seawater (2) metamorphism of unmelted rock material(3) deposition of quartz sand(4) explosive eruption of lava from a volcano
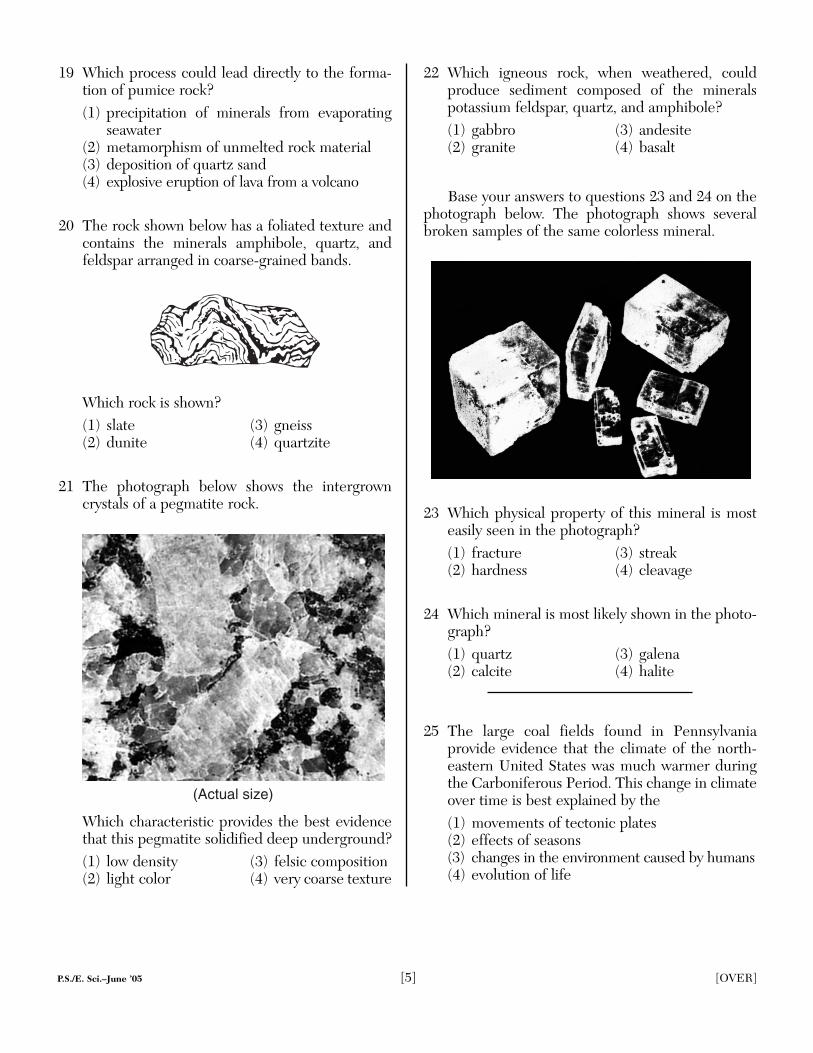
20 The rock shown below has a foliated texture andcontains the minerals amphibole, quartz, andfeldspar arranged in coarse-grained bands.
Which rock is shown?(1) slate (3) gneiss(2) dunite (4) quartzite
21 The photograph below shows the intergrowncrystals of a pegmatite rock.
Which characteristic provides the best evidencethat this pegmatite solidified deep underground?(1) low density (3) felsic composition(2) light color (4) very coarse texture
22 Which igneous rock, when weathered, could produce sediment composed of the mineralspotassium feldspar, quartz, and amphibole?(1) gabbro (3) andesite(2) granite (4) basalt
Base your answers to questions 23 and 24 on thephotograph below. The photograph shows severalbroken samples of the same colorless mineral.
23 Which physical property of this mineral is mosteasily seen in the photograph?(1) fracture (3) streak (2) hardness (4) cleavage
24 Which mineral is most likely shown in the photo-graph?(1) quartz (3) galena(2) calcite (4) halite
25 The large coal fields found in Pennsylvania provide evidence that the climate of the north-eastern United States was much warmer duringthe Carboniferous Period. This change in climateover time is best explained by the(1) movements of tectonic plates(2) effects of seasons(3) changes in the environment caused by humans(4) evolution of life
(Actual size)
P.S./E. Sci.–June ’05 [6]
26 What is the inferred temperature at the boundarybetween Earth’s stiffer mantle and outer core?(1) 2,500°C (3) 5,000°C(2) 4,500°C (4) 6,200°C
27 Which color of the visible spectrum has the shortest wavelength?(1) violet (3) yellow(2) blue (4) red
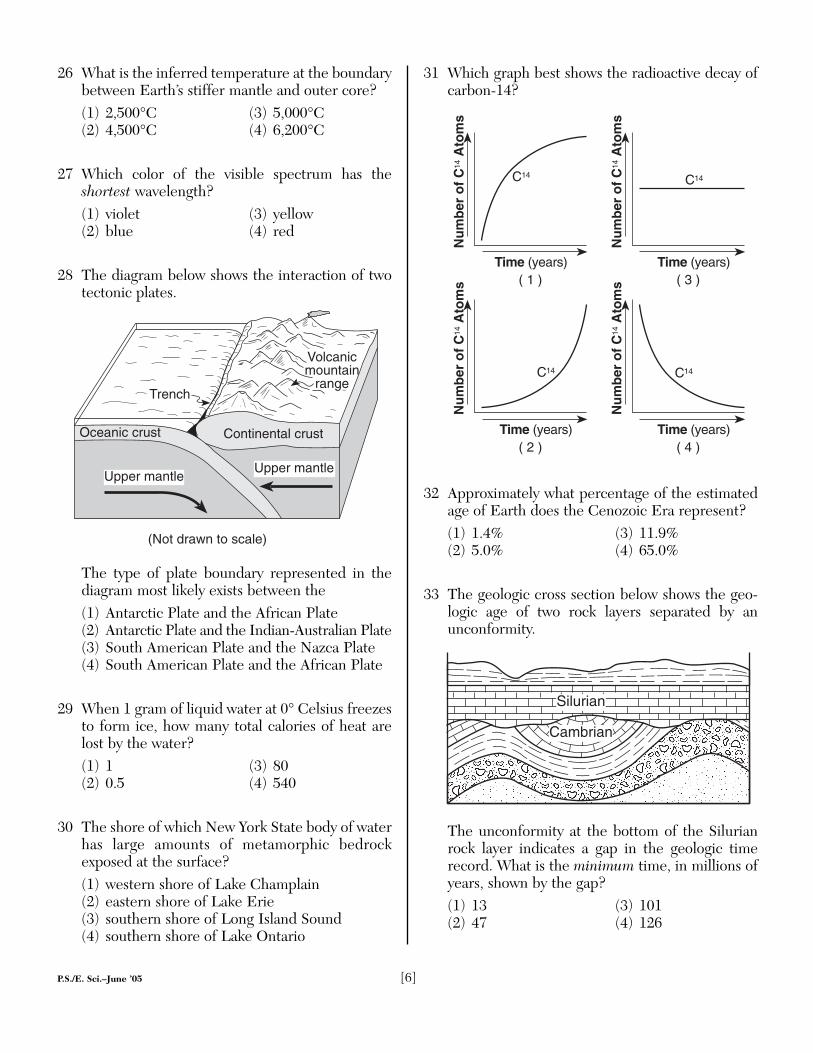
28 The diagram below shows the interaction of twotectonic plates.
The type of plate boundary represented in thediagram most likely exists between the(1) Antarctic Plate and the African Plate(2) Antarctic Plate and the Indian-Australian Plate(3) South American Plate and the Nazca Plate(4) South American Plate and the African Plate
29 When 1 gram of liquid water at 0° Celsius freezesto form ice, how many total calories of heat arelost by the water?(1) 1 (3) 80 (2) 0.5 (4) 540
30 The shore of which New York State body of waterhas large amounts of metamorphic bedrockexposed at the surface? (1) western shore of Lake Champlain(2) eastern shore of Lake Erie(3) southern shore of Long Island Sound(4) southern shore of Lake Ontario
31 Which graph best shows the radioactive decay ofcarbon-14?
32 Approximately what percentage of the estimatedage of Earth does the Cenozoic Era represent?(1) 1.4% (3) 11.9%(2) 5.0% (4) 65.0%
33 The geologic cross section below shows the geo-logic age of two rock layers separated by anunconformity.
The unconformity at the bottom of the Silurianrock layer indicates a gap in the geologic timerecord. What is the minimum time, in millions ofyears, shown by the gap?(1) 13 (3) 101(2) 47 (4) 126
Silurian
Cambrian
Nu
mb
er o
f C
14 A
tom
s
Time (years)( 1 )
Nu
mb
er o
f C
14 A
tom
s
Time (years)( 3 )
Nu
mb
er o
f C
14 A
tom
s
Time (years)( 2 )
Nu
mb
er o
f C
14 A
tom
s
Time (years)( 4 )
C14 C14
C14 C14
(Not drawn to scale)
Oceanic crust
Upper mantle
Volcanicmountain
range
Upper mantle
Trench
Continental crust
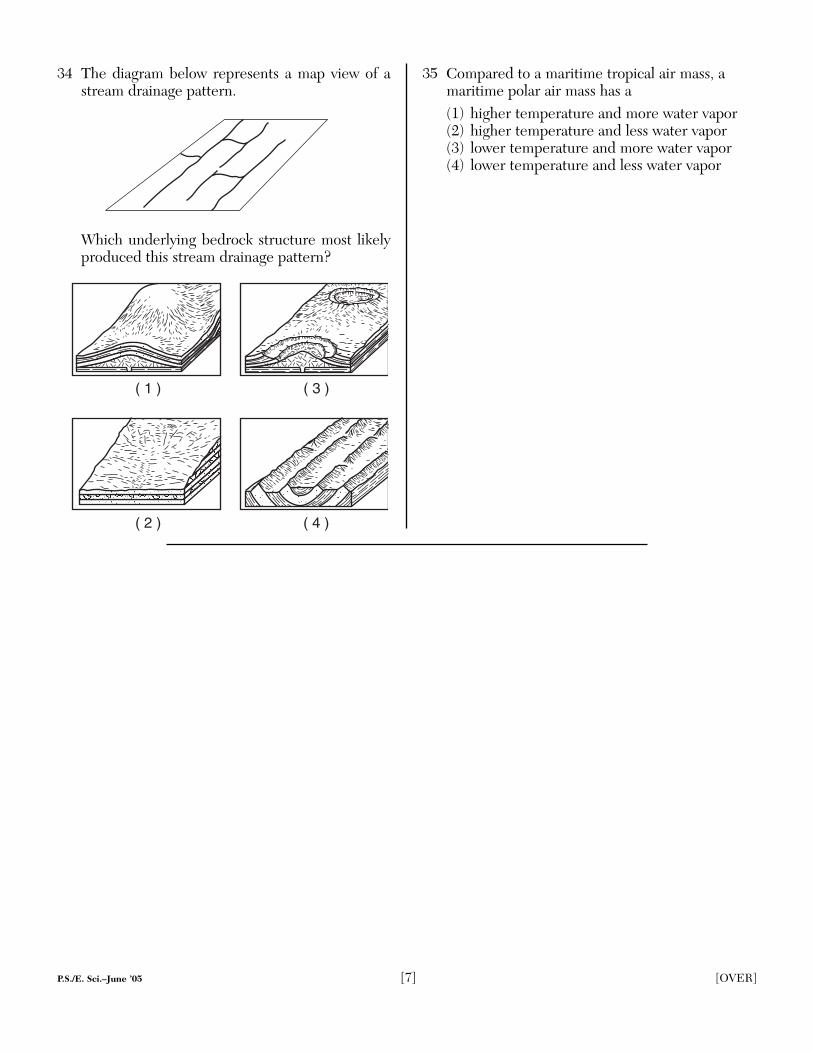
34 The diagram below represents a map view of astream drainage pattern.
Which underlying bedrock structure most likelyproduced this stream drainage pattern?
35 Compared to a maritime tropical air mass, amaritime polar air mass has a(1) higher temperature and more water vapor(2) higher temperature and less water vapor(3) lower temperature and more water vapor(4) lower temperature and less water vapor
( 4 )( 2 )
( 3 )( 1 )
P.S./E. Sci.–June ’05 [7] [OVER]
P.S./E. Sci.–June ’05 [8]
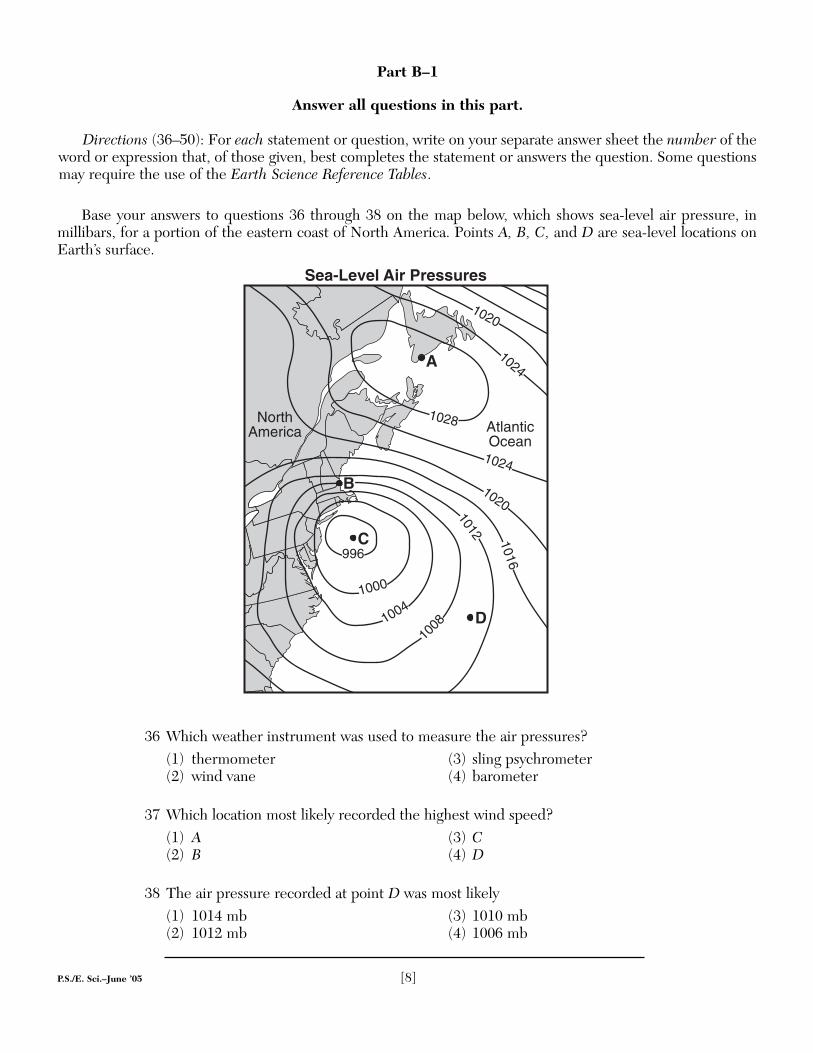
Base your answers to questions 36 through 38 on the map below, which shows sea-level air pressure, in millibars, for a portion of the eastern coast of North America. Points A, B, C, and D are sea-level locations onEarth’s surface.
36 Which weather instrument was used to measure the air pressures?(1) thermometer (3) sling psychrometer(2) wind vane (4) barometer
37 Which location most likely recorded the highest wind speed?(1) A (3) C(2) B (4) D
38 The air pressure recorded at point D was most likely(1) 1014 mb (3) 1010 mb(2) 1012 mb (4) 1006 mb
NorthAmerica Atlantic
Ocean
B
A
C
D
1024
1028
1024
1020
1020
1016
1012
10081004
1000
996
Sea-Level Air Pressures
Part B–1
Answer all questions in this part.
Directions (36–50): For each statement or question, write on your separate answer sheet the number of theword or expression that, of those given, best completes the statement or answers the question. Some questionsmay require the use of the Earth Science Reference Tables.
Base your answers to questions 39 through 41 on the newspaper article shown below and on your knowledge of Earth science.
Fossilized Jellyfish Found in Wisconsin
Fossil hunters have unearthed the largest collection of fossilized jellyfish ever discovered, including the largest fossilized jellyfish ever found.
The remains of soft-bodied animals such as jellyfish are relatively rare because theydon’t have bones, fossil dealer Dan Damrow, James W. Hagadorn of the California Instituteof Technology and Robert H. Dott Jr. of the University of Wisconsin at Madison noted indescribing the find in the journal Geology.
About a half-billion years ago, during the Cambrian period, the quarry in Mosinee,Wis., where the deposits were found was a small lagoon. The jellyfish apparently died whenthey were washed up by a freak tide or storm, the researchers said. The jellyfish remainswere probably preserved because of a lack of erosion from sea water and wind, and a lackof scavengers, the researchers concluded.
“It is very rare to discover a deposit which contains an entire stranding event of jelly-fish,” Hagadorn said. “These jellyfish are not just large for the Cambrian, but are the largestjellyfish in the entire fossil record.”
Washington Post, January 2002
39 These fossilized jellyfish were most likely discovered in which type of rock?(1) sandstone (3) pumice(2) granite (4) slate
40 Which two marine organisms most likely lived at the same time as these jellyfish?(1) crinoids and dinosaurs (3) brachiopods and gastropods(2) ammonoids and placoderm fish (4) amphibians and eurypterids
41 Which evidence would lead scientists to suspect that a tide or storm had washed upthese jellyfish on a beach?(1) Primitive life existed on land 500 million years ago.(2) The rock containing the jellyfish fossils has distorted crystal structure.(3) Treeroot fossils appear to have been pitted and folded.(4) Large ripple marks were found in the fossil-containing rock layers.
P.S./E. Sci.–June ’05 [9] [OVER]
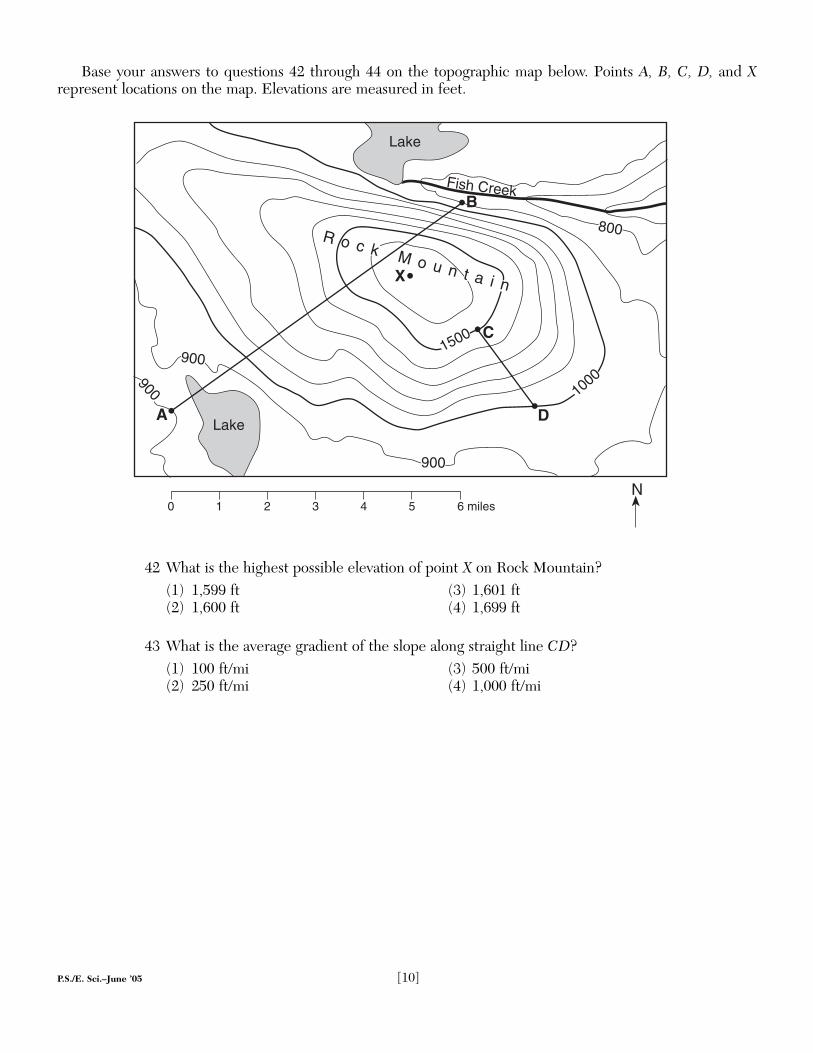
Base your answers to questions 42 through 44 on the topographic map below. Points A, B, C, D, and Xrepresent locations on the map. Elevations are measured in feet.
42 What is the highest possible elevation of point X on Rock Mountain?(1) 1,599 ft (3) 1,601 ft (2) 1,600 ft (4) 1,699 ft
43 What is the average gradient of the slope along straight line CD?(1) 100 ft/mi (3) 500 ft/mi(2) 250 ft/mi (4) 1,000 ft/mi
BFish Creek
1500
A1000
900
C
D
Lake
Lake
X
0 1 2 3 4 5 6 milesN
800
900
900
R o c k M o u n t a i n
P.S./E. Sci.–June ’05 [10]
P.S./E. Sci.–June ’05 [11] [OVER]
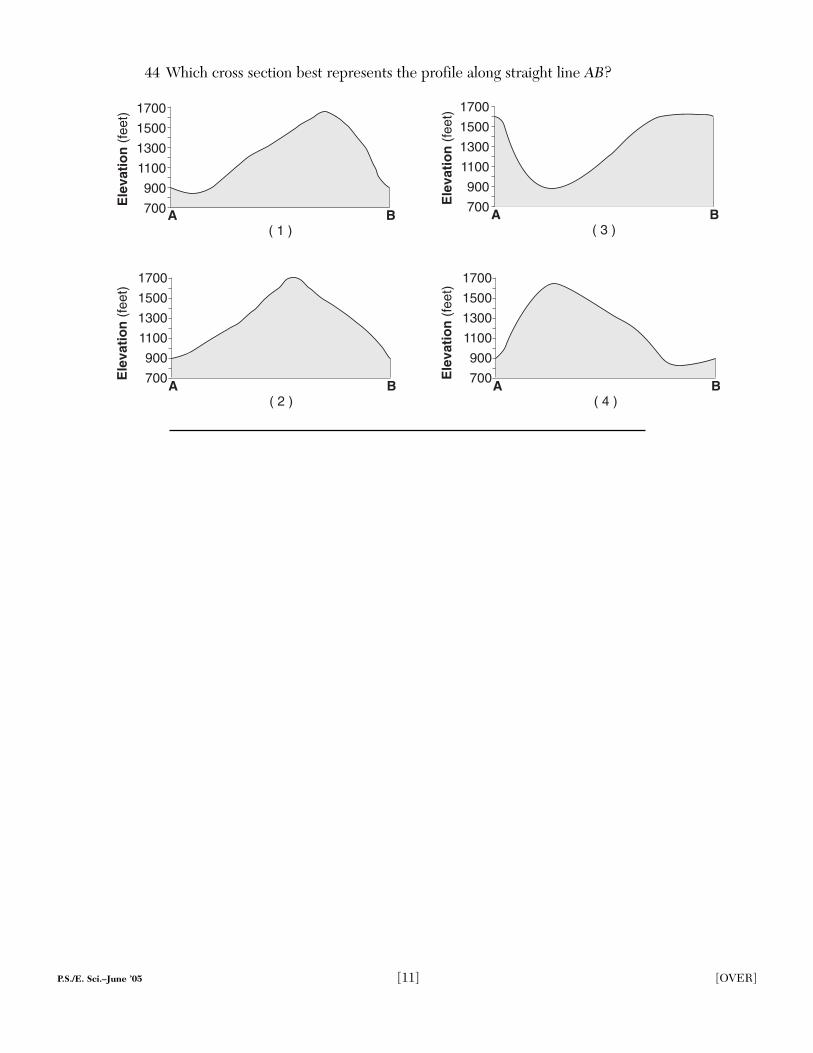
44 Which cross section best represents the profile along straight line AB?
Ele
vati
on
(fe
et)
A B( 4 )
Ele
vati
on
(fe
et)
A B( 3 )
A B( 1 )
Ele
vati
on
(fe
et)
A B( 2 )
Ele
vati
on
(fe
et)
700
900
1100
1300
1500
1700
700
900
1100
1300
1500
1700
700
900
1100
1300
1500
1700
700
900
1100
1300
1500
1700

Base your answers to questions 45 through 47 on the map below, which shows watershed regions of New York State.
45 On which type of landscape region are both the Susquehanna-Chesapeake and theDelaware watersheds located?(1) plain (3) mountain(2) plateau (4) lowland
46 In which watershed is the Genesee River located?(1) Ontario-St. Lawrence (3) Mohawk-Hudson(2) Susquehanna-Chesapeake (4) Delaware
47 Most of the surface bedrock of the Ontario-St. Lawrence watershed was formedduring which geologic time periods?(1) Precambrian and Cambrian(2) Ordovician, Silurian, and Devonian(3) Mississippian, Pennsylvanian, and Permian(4) Triassic, Jurassic, and Cretaceous
N
P.S./E. Sci.–June ’05 [12]
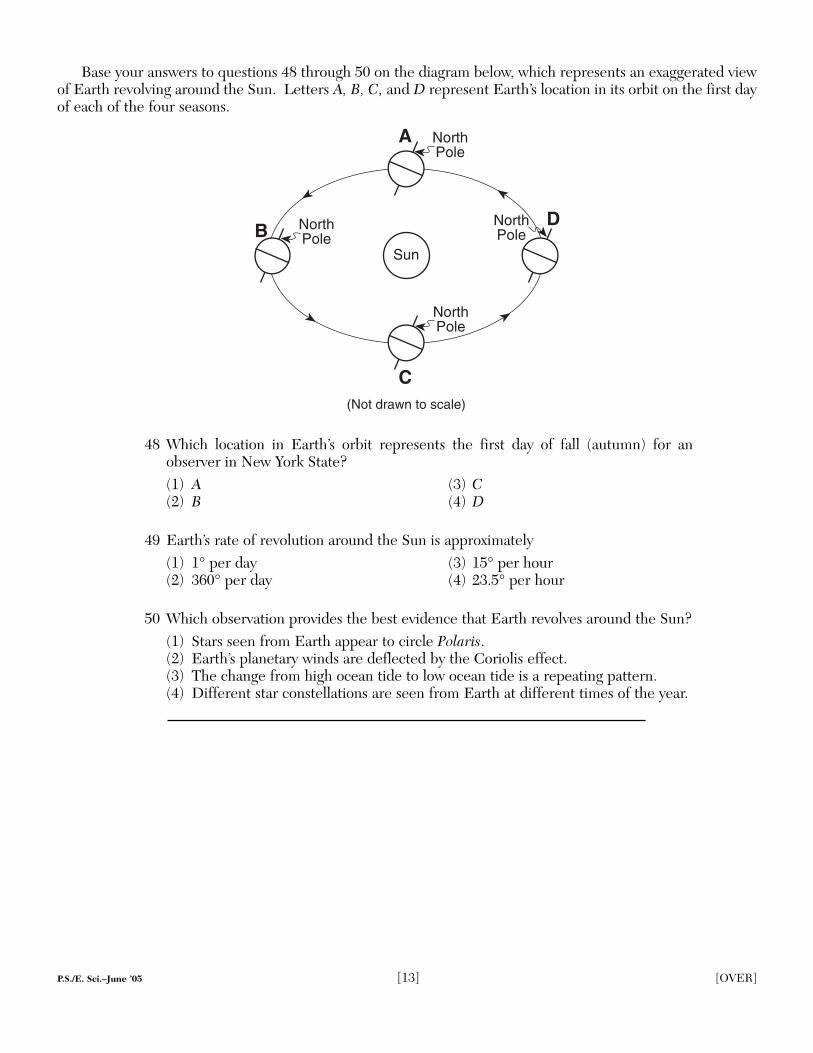
Base your answers to questions 48 through 50 on the diagram below, which represents an exaggerated viewof Earth revolving around the Sun. Letters A, B, C, and D represent Earth’s location in its orbit on the first dayof each of the four seasons.
48 Which location in Earth’s orbit represents the first day of fall (autumn) for anobserver in New York State?(1) A (3) C(2) B (4) D
49 Earth’s rate of revolution around the Sun is approximately(1) 1° per day (3) 15° per hour(2) 360° per day (4) 23.5° per hour
50 Which observation provides the best evidence that Earth revolves around the Sun?(1) Stars seen from Earth appear to circle Polaris.(2) Earth’s planetary winds are deflected by the Coriolis effect.(3) The change from high ocean tide to low ocean tide is a repeating pattern.(4) Different star constellations are seen from Earth at different times of the year.
(Not drawn to scale)
Sun
NorthPole
NorthPole
NorthPole
NorthPole
D
C
A
B
P.S./E. Sci.–June ’05 [13] [OVER]
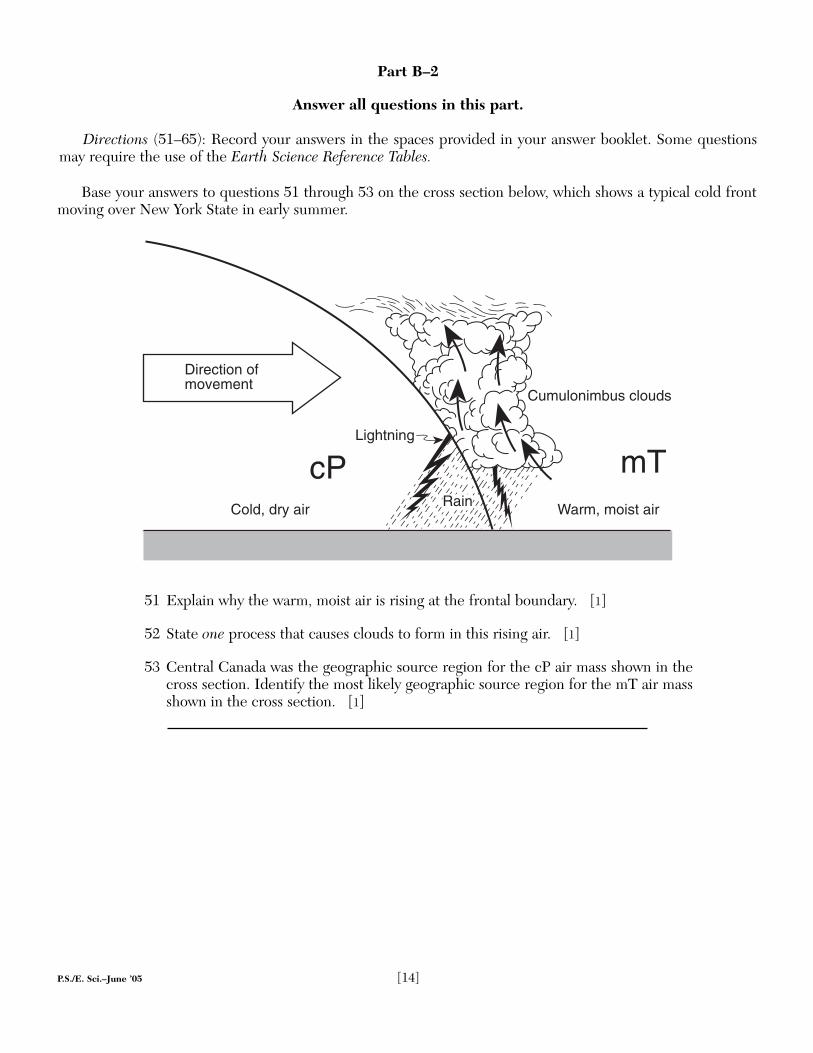
Base your answers to questions 51 through 53 on the cross section below, which shows a typical cold frontmoving over New York State in early summer.
51 Explain why the warm, moist air is rising at the frontal boundary. [1]
52 State one process that causes clouds to form in this rising air. [1]
53 Central Canada was the geographic source region for the cP air mass shown in thecross section. Identify the most likely geographic source region for the mT air massshown in the cross section. [1]
cP mT
Direction ofmovement
Cold, dry air Warm, moist air
Cumulonimbus clouds
Rain
Lightning
Cold front
P.S./E. Sci.–June ’05 [14]
Part B–2
Answer all questions in this part.
Directions (51–65): Record your answers in the spaces provided in your answer booklet. Some questionsmay require the use of the Earth Science Reference Tables.
P.S./E. Sci.–June ’05 [15] [OVER]
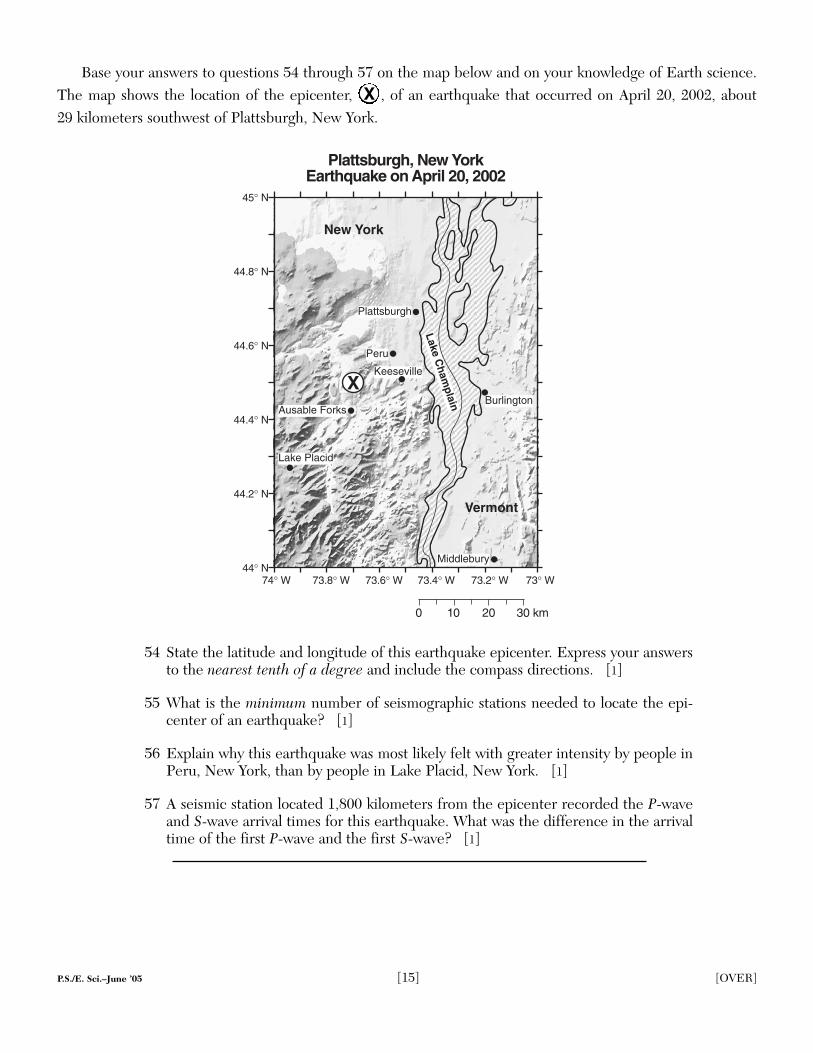
Base your answers to questions 54 through 57 on the map below and on your knowledge of Earth science.The map shows the location of the epicenter, X , of an earthquake that occurred on April 20, 2002, about 29 kilometers southwest of Plattsburgh, New York.
54 State the latitude and longitude of this earthquake epicenter. Express your answersto the nearest tenth of a degree and include the compass directions. [1]
55 What is the minimum number of seismographic stations needed to locate the epi-center of an earthquake? [1]
56 Explain why this earthquake was most likely felt with greater intensity by people inPeru, New York, than by people in Lake Placid, New York. [1]
57 A seismic station located 1,800 kilometers from the epicenter recorded the P-waveand S-wave arrival times for this earthquake. What was the difference in the arrivaltime of the first P-wave and the first S-wave? [1]
45° N
44.8° N
44.6° N
44.4° N
44.2° N
44° N74° W
Plattsburgh
Burlington
Keeseville
Ausable Forks
Middlebury
Peru
New York
Vermont
Lake Placid
Lake Cham
plain
73.8° W 73.6° W 73.2° W73.4° W 73° W
X
Plattsburgh, New YorkEarthquake on April 20, 2002
0 10 20 30 km
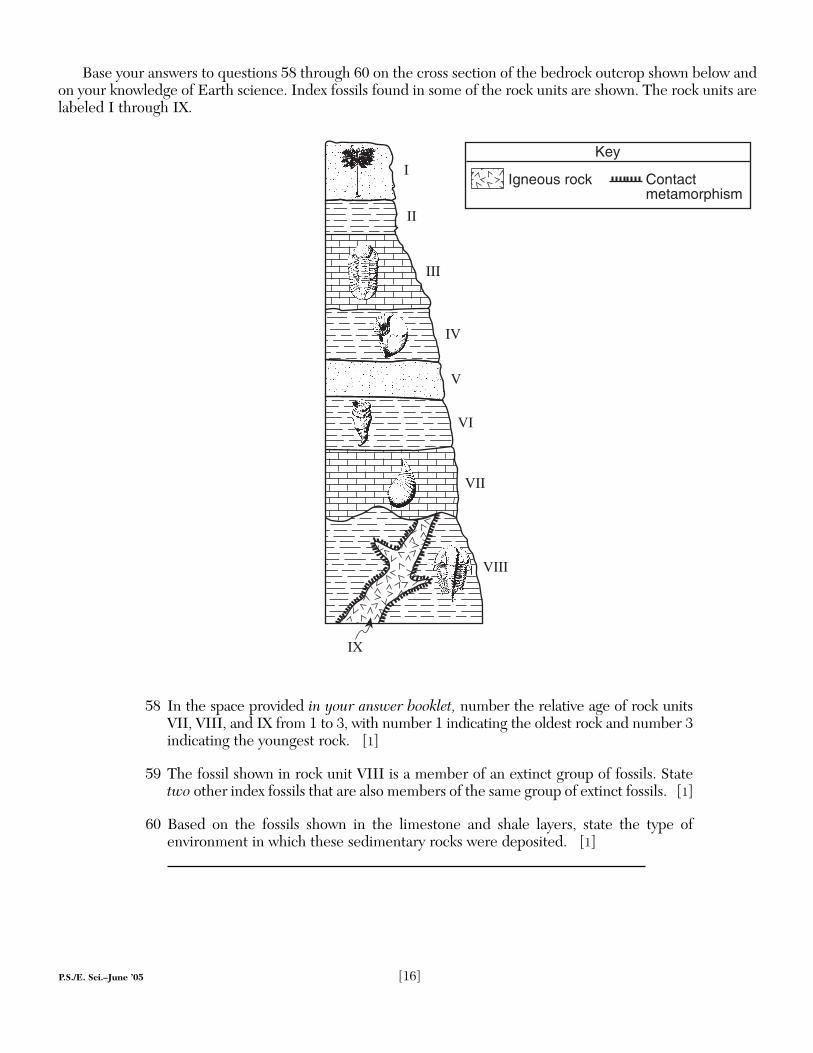
Base your answers to questions 58 through 60 on the cross section of the bedrock outcrop shown below andon your knowledge of Earth science. Index fossils found in some of the rock units are shown. The rock units arelabeled I through IX.
58 In the space provided in your answer booklet, number the relative age of rock unitsVII, VIII, and IX from 1 to 3, with number 1 indicating the oldest rock and number 3indicating the youngest rock. [1]
59 The fossil shown in rock unit VIII is a member of an extinct group of fossils. Statetwo other index fossils that are also members of the same group of extinct fossils. [1]
60 Based on the fossils shown in the limestone and shale layers, state the type of environment in which these sedimentary rocks were deposited. [1]
IX
I
II
III
IV
V
VI
VII
VIII
P.S./E. Sci.–June ’05 [16]
Igneous rock Contactmetamorphism
Key
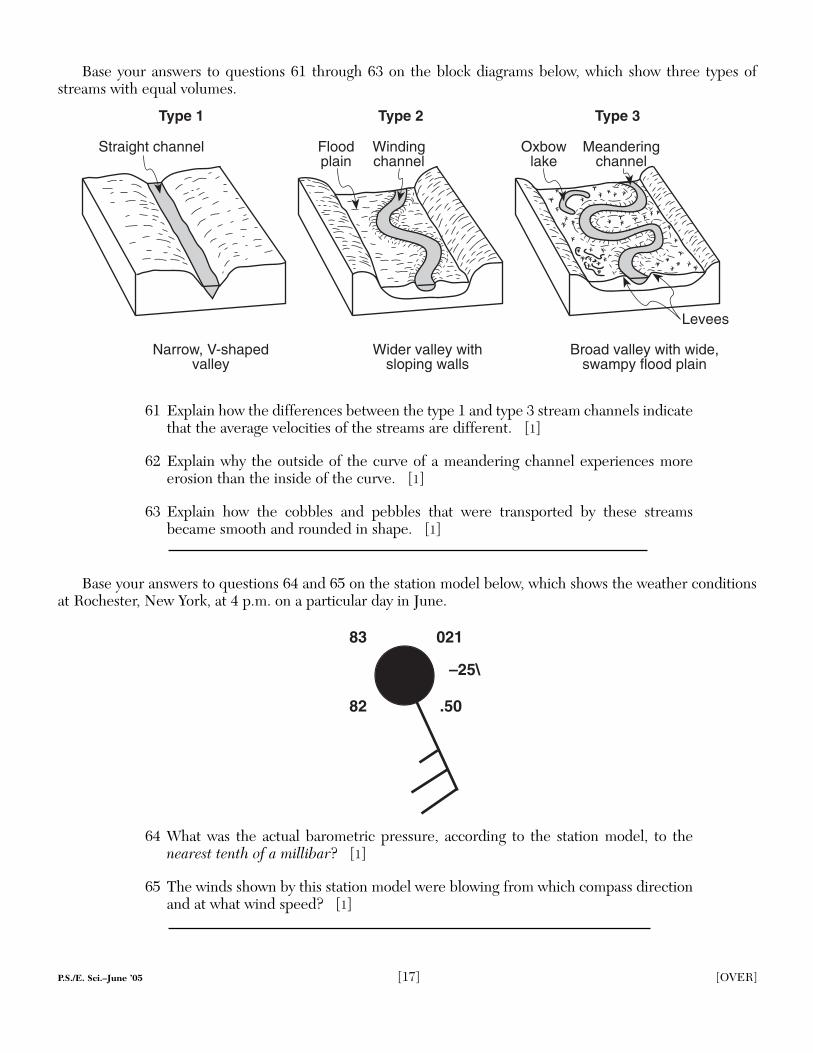
Base your answers to questions 61 through 63 on the block diagrams below, which show three types ofstreams with equal volumes.
61 Explain how the differences between the type 1 and type 3 stream channels indicatethat the average velocities of the streams are different. [1]
62 Explain why the outside of the curve of a meandering channel experiences moreerosion than the inside of the curve. [1]
63 Explain how the cobbles and pebbles that were transported by these streamsbecame smooth and rounded in shape. [1]
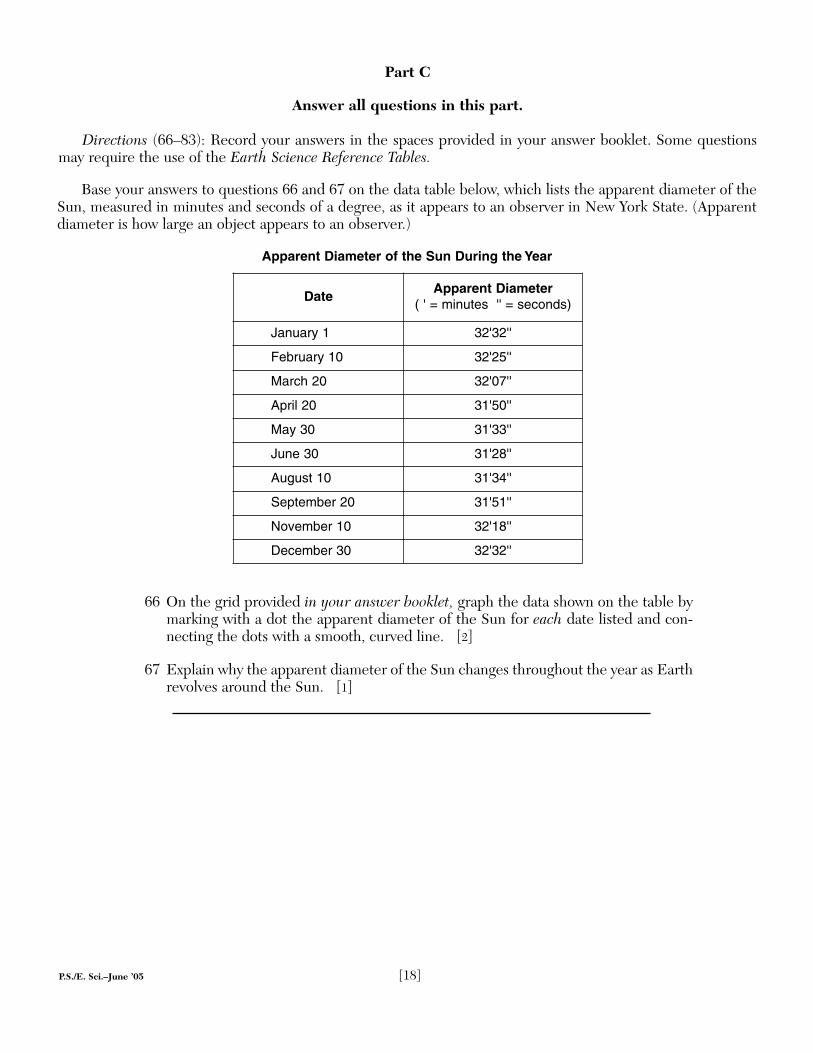
Base your answers to questions 64 and 65 on the station model below, which shows the weather conditionsat Rochester, New York, at 4 p.m. on a particular day in June.
64 What was the actual barometric pressure, according to the station model, to thenearest tenth of a millibar? [1]
65 The winds shown by this station model were blowing from which compass directionand at what wind speed? [1]
021
–25\
.50
83
82
Narrow, V-shapedvalley
Wider valley withsloping walls
Broad valley with wide,swampy flood plain
Levees
Straight channel Floodplain
Oxbowlake
Meanderingchannel
Windingchannel
Type 1 Type 2 Type 3
P.S./E. Sci.–June ’05 [17] [OVER]
Base your answers to questions 66 and 67 on the data table below, which lists the apparent diameter of theSun, measured in minutes and seconds of a degree, as it appears to an observer in New York State. (Apparentdiameter is how large an object appears to an observer.)
Apparent Diameter of the Sun During the Year
66 On the grid provided in your answer booklet, graph the data shown on the table bymarking with a dot the apparent diameter of the Sun for each date listed and con-necting the dots with a smooth, curved line. [2]
67 Explain why the apparent diameter of the Sun changes throughout the year as Earthrevolves around the Sun. [1]
P.S./E. Sci.–June ’05 [18]
Part C
Answer all questions in this part.
Directions (66–83): Record your answers in the spaces provided in your answer booklet. Some questionsmay require the use of the Earth Science Reference Tables.
DateApparent Diameter
( ' = minutes '' = seconds)
January 1 32'32''
February 10 32'25''
March 20 32'07''
April 20 31'50''
May 30 31'33''
June 30 31'28''
August 10 31'34''
September 20 31'51''
November 10 32'18''
December 30 32'32''
Base your answers to questions 68 through 71 on the passage below and on your knowledge of Earth science.
Watching the Glaciers Go
Mountain glaciers and ice caps in tropical areas of the world are melting fast and mayvanish altogether by the year 2020. That was the chilling news last year from LonnieThompson, a geologist at Ohio State University’s Byrd Polar Research Center who has beenstudying icy areas near the equator in South America, Africa, and the Himalayas for twodecades.
It doesn’t take a glacier scientist to see the changes. In 1977, when Thompson visited theQuelccaya ice cap in Peru, it was impossible not to notice a schoolbus-size boulder stuck inits grip. When Thompson returned in 2000, the rock was still there but the ice wasn’t — ithad retreated far into the distance.
Most scientists believe the glaciers are melting because of global warming — the gradual temperature increase that has been observed with increasing urgency during thepast decade. Last year a panel of the nation’s top scientists, the National Research Council,set aside any lingering skepticism about the phenomenon, concluding definitively that average global surface temperatures are rising and will continue to do so.
“Watching the Glaciers Go,”Popular Science, vol. #7, January 2002
68 State one greenhouse gas that is an excellent absorber of infrared radiation and maybe responsible for global warming. [1]
69 Describe the arrangement of sediment deposited directly from glaciers. [1]
70 Some glaciers currently exist near Earth’s equator due to the cold, snowy climate ofcertain locations. Which type of landform exists where these glaciers occur? [1]
71 Describe one action humans could take to reduce the global warming that is melting the Quelccaya ice cap. [1]
P.S./E. Sci.–June ’05 [19] [OVER]
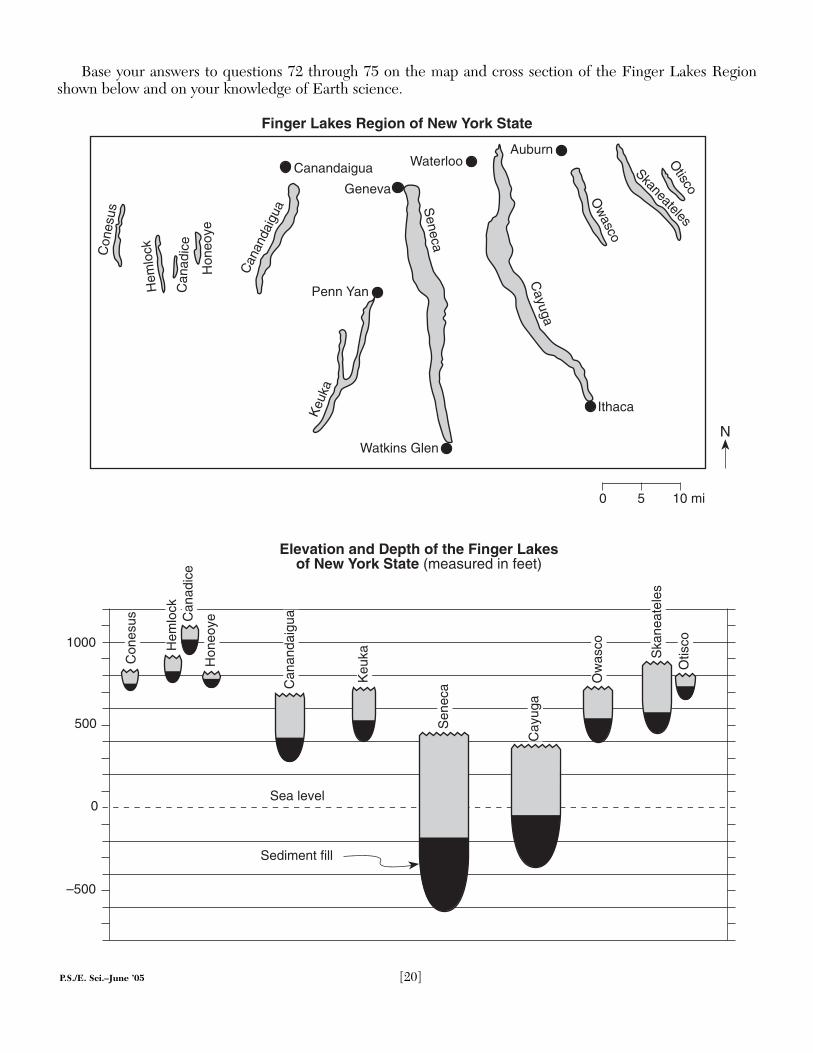
Base your answers to questions 72 through 75 on the map and cross section of the Finger Lakes Regionshown below and on your knowledge of Earth science.
Elevation and Depth of the Finger Lakesof New York State (measured in feet)
Con
esus
Hem
lock
Can
adic
e
Hon
eoye
Can
anda
igua
Keu
ka
Sen
eca
Ow
asco
Ska
neat
eles
Otis
co
Sea level
Sediment fill
Cay
uga
1000
500
0
–500
Finger Lakes Region of New York State
Con
esus
Hem
lock
Can
adic
e
Hon
eoye
Canandaigua
Keu
ka
Seneca
Cayuga
Ow
asco
SkaneatelesO
tisco
Can
anda
igua
Geneva
Waterloo
Penn Yan
Watkins Glen
Ithaca
Auburn
0 5 10 mi
N
P.S./E. Sci.–June ’05 [20]

72 According to the cross section, how thick from top to bottom is the sediment fill inSeneca Lake? [1]
73 State one possible explanation for the north-south orientation of the Finger Lakes.[1]
74 During some winters, a few of the Finger Lakes remain unfrozen even though theland around the lakes is frozen. Explain how the specific heat of water can cause theselakes to remain unfrozen. [1]
75 Identify two processes that normally occur to form the type of surface bedrockfound in the Finger Lakes Region. [1]
Base your answers to questions 76 through 79 on the diagram provided in your answer booklet, which showsobservations made by a sailor who left his ship and landed on a small deserted island on June 21. The diagramrepresents the apparent path of the Sun and the position of Polaris, as observed by the sailor on this island.
76 On the diagram provided in your answer booklet, draw an arrow on the June 21 path ofthe Sun to show the Sun’s direction of apparent movement from sunrise to sunset. [1]
77 The sailor was still on the island on September 23. On the diagram provided in youranswer booklet, draw the Sun’s apparent path for September 23, as it would haveappeared to the sailor. Be sure your September 23 path indicates the correct altitudeof the noon Sun and begins and ends at the correct points on the horizon. [2]
78 Based on the sailor’s observations, what is the latitude of this island? Include theunits and the compass direction in your answer. [1]
79 The sailor observed a 1-hour difference between solar noon on the island and solarnoon at his last measured longitude onboard his ship. How many degrees of longitudeis the island from the sailor’s last measured longitude onboard his ship? [1]
P.S./E. Sci.–June ’05 [21] [OVER]

Base your answers to questions 80 through 83 on the world map shown below and on your knowledge ofEarth science. Letters A through H represent locations on Earth’s surface.
80 Explain why most earthquakes that occur in the crust beneath location B are shallower than most earthquakes that occur in the crust beneath location C. [1]
81 Explain why location A has a greater probability of experiencing a major earthquakethan location D. [1]
82 Explain why a volcanic eruption is more likely to occur at location E than at location F.[1]
83 Explain why the geologic age of the oceanic bedrock increases from location G tolocation H. [1]
70
60
50
40
3020100
70
60
50
40
302010
70
60
50
40
3020100
70
60
50
40
302010
120 140 160 180 160 140 120 100 80 60 40 20 0 20 40 60 80 100 120
120 140 160 180 160 140 120 100 80 60 40 20 0 20 40 60 80 100 120
Asia
Australia
NorthAmerica
SouthAmerica
Antarctica Antarctica
Atlantic OceanAfrica
AsiaEurope
Indian Ocean
Pacific Ocean
HawaiianIslands
A
D
H
B
G
F
C
E
P.S./E. Sci.–June ’05 [22]
The University of the State of New York
REGENTS HIGH SCHOOL EXAMINATION
PHYSICAL SETTINGEARTH SCIENCE
Wednesday, June 22, 2005 — 9:15 a.m. to 12:15 p.m., only
ANSWER SHEET
Student . . . . . . . . . . . . . . . . . . . . . . . . . . . . . . . . . . . . . . . . . . . . . . . Sex: ■■ Male ■■ Female Grade . . . . . . . . . . . .
Teacher . . . . . . . . . . . . . . . . . . . . . . . . . . . . . . . . . . . . . . . . . . . . . . . School . . . . . . . . . . . . . . . . . . . . . . . . . . . . . . . . . . . .
Record your answers to Part A and Part B–1 on this answer sheet.
Write your answers to Part B–2 and Part C in your answer booklet.
The declaration below should be signed when you have completed the examination.
I do hereby affirm, at the close of this examination, that I had no unlawful knowledge of the questions or answers prior tothe examination and that I have neither given nor received assistance in answering any of the questions during the examination.
Signature
Tear
Her
eTe
ar H
ere
Part A
1 . . . . . . . . . . . . 13 . . . . . . . . . . . . 25 . . . . . . . . . . .
2 . . . . . . . . . . . . 14 . . . . . . . . . . . . 26 . . . . . . . . . . .
3 . . . . . . . . . . . . 15 . . . . . . . . . . . . 27 . . . . . . . . . . .
4 . . . . . . . . . . . . 16 . . . . . . . . . . . . 28 . . . . . . . . . . .
5 . . . . . . . . . . . . 17 . . . . . . . . . . . . 29 . . . . . . . . . . .
6 . . . . . . . . . . . . 18 . . . . . . . . . . . . 30 . . . . . . . . . . .
7 . . . . . . . . . . . . 19 . . . . . . . . . . . . 31 . . . . . . . . . . .
8 . . . . . . . . . . . . 20 . . . . . . . . . . . . 32 . . . . . . . . . . .
9 . . . . . . . . . . . . 21 . . . . . . . . . . . . 33 . . . . . . . . . . .
10 . . . . . . . . . . . . 22 . . . . . . . . . . . . 34 . . . . . . . . . . .
11 . . . . . . . . . . . . 23 . . . . . . . . . . . . 35 . . . . . . . . . . .
12 . . . . . . . . . . . . 24 . . . . . . . . . . . .
Part B–1
36 . . . . . . . . . . . . 44 . . . . . . . . . . . .
37 . . . . . . . . . . . . 45 . . . . . . . . . . . .
38 . . . . . . . . . . . . 46 . . . . . . . . . . . .
39 . . . . . . . . . . . . 47 . . . . . . . . . . . .
40 . . . . . . . . . . . . 48 . . . . . . . . . . . .
41 . . . . . . . . . . . . 49 . . . . . . . . . . . .
42 . . . . . . . . . . . . 50 . . . . . . . . . . . .
43 . . . . . . . . . . . .
Part A Score
Part B–1 Score
Tear Here
Tear Here
PS/EARTH SCIENCEPS/EARTH SCIENCE