Embed Size (px)
Citation preview
Physicochemical and Ignition Properties of Dust from Loblolly Pine Wood
by
Gurdeep Singh Hehar
A dissertation submitted to the Graduate Faculty of
Auburn University
in partial fulfillment of the
requirements for the Degree of
Master of Science
Auburn, Alabama
August 3, 2013
Keywords: bioenergy, loblolly pine, dust, ignition, explosion
Copyright 2013 by Gurdeep Singh Hehar
Approved by
Oladiran O. Fasina, Chair, Professor of Biosystems Engineering
Sushil Adhikari, Associate Professor of Biosystems Engineering
John P. Fulton, Associate Professor of Biosystems Engineering

ii
Abstract
Energy derived from biomass has attracted considerable attention because of increasing
energy demand, high crude oil prices and environment and climate concerns. Biomass must be
harvested and processed before conversion to a desirable form of energy. However, dust particles
can be generated during biomass processing with humans working in dusty environments
potentially causing health problems such as skin and eye allergies, respiratory issues and lung
cancer. Additionally, the risk of fire and explosion also exists with biomass dust due to its
combustible nature. Loblolly pine tree in southern forestland of the United States serves as a
potential biomass feedstock for the bioenergy industry. Therefore, this research was conducted to
study the ignition risk associated with dust generation during the grinding process of loblolly pine
chips. The specific objectives were to: 1) determine the effect of moisture content (5%, 15% and
25% on w.b.) and screen size (1.20, 3.18 and 6.35 mm) of a hammer mill on energy required to
grind loblolly pine chips and the amount of dust generated during grinding, 2) quantify the
physical and chemical properties of ground material and associated dust, and 3) quantify the
physicochemical and ignition properties of fractionated pine dust (<90, 90-180, 180-420 µm).
Results suggested that the grinding energy, amount of dust generated and the physicochemical
properties of ground material and dust were significantly affected by wood chip moisture content
and hammer-mill screen size. Grinding energy increased from 39.65 to 360.00 kJ/kg when
moisture content and screen size increased from 4.7% and 6.35 mm to 23.6% and 1.20 mm,
respectively. The amount of dust generated decreased with increase in moisture content and
iii
decrease in screen size. About 21.5 % of the dust was observed in ground material when wood
chips at 4.7% moisture content was ground through a 1.20 mm hammer mill screen.
Further, the fine fraction (<90 µm) of dust had the higher bulk density (208.33 kg/m3),
and ash content (1.70% d.b.) compared to the medium (90-180 µm) and coarse (180-420 µm)
fractions. Other physicochemical properties such as particle density, volatile matter and energy
content were not significantly different (p>0.05). Fine dust fraction had lower hot surface ignition
temperature than the other dust fractions. Temperature of volatilization, temperature of maximum
mass loss rate and temperature of oxidation were not significantly affected by particle size. The
exothermic reaction started at a significantly (p<0.05) lower temperature for fine dust fractions
compared to other fractions. The maximum temperature during exothermic reaction was almost
the same for all three fractions. According to the plot of activation energy versus oxidation
temperature, three fractions (<90, 90-180, 180-420 µm) were at high to medium risk of ignition.
The hot surface temperature and temperature of rapid exothermic reaction indicated that the risk
of ignition increased with decrease in particle size.

iv
Acknowledgements
Firstly, I would like to thank my parents, S. Chamkaur Singh and Smt. Gurmail Kaur for
their love, support and guidance throughout my life. Also I would like to thank my fiancé Saran
for her personal support and great patience at all times. I would also like to recognize my parents
in law, S. Jasbir Singh and Smt. Amarjit Kaur for their love and encouragement in the due course.
I would like to thank my uncle Balwant Singh for his guidance during my studies up to this point.
This thesis would not have been possible without the help, support and patience of my
advisor Dr.Oladiran Fasina. I would like to thank him for teaching me the valuable lessons of
academic and professional life. I would like to appreciate my committee members Dr. Sushil
Adhikari and Dr. John Fulton for sharing their knowledge and experience in this project.
I am grateful to Anshu Shrestha for her support during lab experiments. I would like to
thank Dr. Jatinder Singh Aulakh for his guidance in thesis writing. I also want to thank Shyam,
Vaishnavi, Ravi, and Qun for their friendship and emotional support during these two years.
Finally thanks to my friends, Gurjot, Harpreet, Daljit, Raman, Jaskaran, Sumit and
Harpreet Grewal for being there when I needed them the most.

v
Table of Contents
Abstract ............................................................................................................................................ ii
Acknowledgements ......................................................................................................................... iv
List of Figures .................................................................................................................................. x
List of Tables ................................................................................................................................ xiii
Chapter 1 Introduction ..................................................................................................................... 1
Chapter 2 Review of Literature ........................................................................................................ 4
2.1 Energy Overview ................................................................................................................... 4
2.1.1 Petroleum Products ......................................................................................................... 5
2.1.2 Coal and Natural Gas ...................................................................................................... 6
2.1.3 Renewable Energy .......................................................................................................... 7
2.2 Fossil Fuels ............................................................................................................................ 7
2.3 Bioenergy ............................................................................................................................... 9
2.3.1 Thermochemical Conversion ........................................................................................ 11
2.3.2 Biochemical conversion ................................................................................................ 14
2.4 Biomass Logistics and Pre-processing ................................................................................. 19
2.5 Health Problems from Dust .................................................................................................. 21

vi
2.6 Combustible Dusts ............................................................................................................... 22
2.7 Ignition of Dusts .................................................................................................................. 23
2.7.2 Factors affecting Ignition .............................................................................................. 25
2.8 Dust Explosion ..................................................................................................................... 27
2.8.1 Factors effecting Dust Explosion Characteristics ......................................................... 29
Summary ........................................................................................................................................ 33
Chapter 3 Physicochemical Properties of Ground Material and Dust ........................................... 34
3.1 Abstract ................................................................................................................................ 34
3.2 Introduction .......................................................................................................................... 35
3.3 Materials and Methods ......................................................................................................... 39
3.3.1 Wood Chips .................................................................................................................. 39
3.3.2 Conditioning of Wood Chips ........................................................................................ 39
3.3.3 Grinding of Wood Chips ............................................................................................... 39
3.3.4 Moisture Content .......................................................................................................... 40
3.3.5 Bulk Density ................................................................................................................. 40
3.3.6 Particle Density ............................................................................................................. 40
3.3.7 Particle Size Distribution .............................................................................................. 41
3.3.8 Ash Content .................................................................................................................. 42
3.3.9 Volatile Matter .............................................................................................................. 42
3.3.10 Energy Content ........................................................................................................... 43
3.3.11 Data Analysis .............................................................................................................. 43

vii
3.4 Results and Discussion......................................................................................................... 44
3.4.1 Dust Generation during Grinding ................................................................................. 44
3.4.2 Energy Requirement for Grinding ................................................................................ 45
3.4.3 Moisture Content .......................................................................................................... 46
3.4.4 Particle Size Distribution .............................................................................................. 47
3.4.5 Bulk Density ................................................................................................................. 49
3.4.6 Particle density .............................................................................................................. 51
3.4.7 Ash Content .................................................................................................................. 52
3.4.8 Volatile Matter .............................................................................................................. 53
3.4.9 Energy Content ............................................................................................................. 54
3.5 Conclusion ........................................................................................................................... 56
Chapter 4 Physicochemical and Ignition Properties of Dust ......................................................... 57
4.1 Abstract ................................................................................................................................ 57
4.2 Introduction .......................................................................................................................... 58
4.3 Materials and Methods ......................................................................................................... 61
4.3.1 Sample Preparation and Physicochemical Properties Determination ........................... 61
4.3.2 Particle Size Distribution .............................................................................................. 62
4.3.3 Moisture Content .......................................................................................................... 63
4.3.4 Bulk Density ................................................................................................................. 63
4.3.5 Particle Density ............................................................................................................. 64
4.3.6 Energy Content ............................................................................................................. 64

viii
4.3.7 Ash Content .................................................................................................................. 64
4.3.8 Volatile Matter .............................................................................................................. 65
4.3.9 Hot Surface Ignition Temperature ................................................................................ 65
4.3.10 Volatilization Properties ............................................................................................. 67
4.3.11 Exothermic Reaction Parameters ................................................................................ 68
4.2.12 Data Analysis .............................................................................................................. 68
4.4 Results and Discussion......................................................................................................... 68
4.4.1 Particle Size Distribution and Moisture Content .......................................................... 68
4.4.2 Bulk and Particle Density ............................................................................................. 70
4.4.3 Ash Content .................................................................................................................. 70
4.4.4 Volatile Matter .............................................................................................................. 71
4.4.5 Energy Content ............................................................................................................. 71
4.4.6 Hot Surface Ignition Temperature ................................................................................ 72
4.4.7 Volatilization Properties ............................................................................................... 74
4.4.8 Exothermic Parameters (DSC) ...................................................................................... 79
4.5 Conclusion ........................................................................................................................... 82
Chapter 5 Summary and Future Recommendation ........................................................................ 84
5.1 Summary .............................................................................................................................. 84
5.2 Future Recommendation ...................................................................................................... 85
References ...................................................................................................................................... 87

ix
Appendix A -Amount of Dust Generated, Energy Required for Grinding and Physicochemical
Properties Data ............................................................................................................................... 96
Appendix B Results of Objective 1 and Objective 2 ................................................................... 108
Appendix C Physical, Chemcial and Ignition Properties Data of Dust Samples ......................... 113
Appendix D SAS Code and ANOVA Results ............................................................................. 116
x
List of Figures
Figure 2.1. Rise in world energy consumption and human population (data EIA, 2013). ............... 4
Figure 2.2. Energy Sources in the United States in 2011 (EIA, 2013). .......................................... 5
Figure 2.3. Electricity generation in the United States in 2011 (EIA, 2013). .................................. 6
Figure 2.4. Renewable energy production in the United States, India and China (EIA, 2013). ...... 9
Figure 2.5. Flow chart showing conversion of biomass into bioenergy (Akpınar et al., 2008). .... 11
Figure 2.6. Schematic diagram of biomass power plant (Biomass, 2013). .................................... 12
Figure 2.7. Schematic diagram of aerobic digestion (Biogas Technology, 2013). ........................ 15
Figure 2.8. Schematic diagram of ethanol production (Mussatto, et a., 2010). ............................. 16
Figure 2.9. Pretreatment of lignocellulose crops for ethanol production (Kumar et al., 2009). .... 17
Figure 2.10. Chemical process to produce biodiesel from vegetable oil (Moser, 2011). .............. 18
Figure 2.11. Flowchart representing a Biomass logistics system. ................................................. 19
Figure 2.12. Dust generation during the handling of biomass (Wypch et al., 2005). .................... 20
Figure 2.13. Components of fire triangle (fuel, oxygen and heat) (Gillman and Le May, 2007). . 23
Figure 2.14. Effect of volatile content of material (coal and biomass) on ignition temperature
(Grotkjær et al., 2003). ................................................................................................................. 27
Figure 2.15. Dust explosion from ignited dust layer (Combustible Dusts, 2013).......................... 27
Figure 2.16. (a) A 1mm dust layer of biological material (bulk density is 500kg/m3) (b) Dust
forms a concentration of 100g/m3 when dispersed in a room of 5 m
3(Amyotte and Eckhoff,
2010). ........................................................................................................................................... 28

xi
Figure 3.1. Dust explosion pentagon and its components (fuel, mixing, ignition source, oxidant,
and confinement) (Abbasi and Abbasi, 2007). ............................................................................. 37
Figure 3.2. Effect of moisture content and screen size on the quantity (%) of dust produced (
vertical bars represent standard deviation at each level of moisture content and screen size). .... 45
Figure 3.3. Effect of wood chips moisture content and screen size on the energy required (kJ/kg)
for grinding………………………………………………………………………………………46
Figure 3.4. Moisture content (% w.b.) of ground material and dust at different wood chips
moisture content levels and hammer mill screen sizes (vertical bars represents standard deviation
at each level of moisture content and screen size). ...................................................................... 47
Figure 3.5. Particle size distribution of ground material as affected by moisture contents of wood
chips and hammer mill screen size. .............................................................................................. 48
Figure 3.6. Geometric particle size of dust and ground material at different wood chips’ moisture
levels and hammer mill screens. .................................................................................................. 48
Figure 3.7. Particle size distribution of dust as affected by moisture contents of wood chips and
hammer mill screen size. .............................................................................................................. 49
Figure 3.8. Particle size distribution of ground material and dust when wood chips at mc of
14.74% was ground through 1.20 mm hammer mill screen size. ................................................. 49
Figure 3.9. Bulk density (kg/m3) of ground material and dust as affected by moisture content and
hammer mill screen size (vertical bars represent the standard deviation at different moisture
content and screen size). ............................................................................................................... 51
Figure 3.10. Particle density (kg/m3) of ground material and dust as affected by moisture content
and hammer mill screen sizes (vertical bars represent standard deviation at different moisture
content levels and screen sizes). ................................................................................................... 52
Figure 3.11. Ash content (% d.b.) of ground material and dust as affected by moisture content and
hammer mill screens (vertical bars represent the standard deviation at each level of moisture
content and screen size). ............................................................................................................... 53
Figure 3.12. Volatile content (% d.b.) of ground material and dust as affected by moisture content
of wood chips and hammer mill screens (vertical bars represent the standard deviation at
different moisture content and screen size). ................................................................................. 54
Figure 3.13. Relation between volatile content (% d.b.) and ash content (% d.b.) of dust. ........... 54
Figure 3.14. Energy content (MJ/kg) of ground material and dust as affected by moisture content
and hammer mill screens (vertical bars represent standard deviation at different moisture content
and screens). ................................................................................................................................. 55
Figure 3.15. Relation between energy content (MJ/kg) and ash content (% d.b.) of dust. ............ 55
xii
Figure 4.1. (a) Hot plate apparatus, (b) Metal ring and thermocouple (K type) (c) Ring filled with
fresh dust sample and (d) Burned Dust. ...................................................................................... 66
Figure 4.2. Particle size distribution of fine (<90 µm), medium (90-180 µm) and coarse (180-420
µm) dust fractions ........................................................................................................................ 69
Figure 4.3. Particle size distribution of pine (unfractionated) and coal dust ................................. 69
Figure 4.4. Temperature profile of fine dust sample when hot plate was set at 290ºC (<90 µm).. 73
Figure 4.5. Temperature profile when dust sample (<90 µm) ignited.. ......................................... 73
Figure 4.6. Example of TOD and TMWL from TGA data; curve is for determination of air-heated
fine (< 90µm) dust. ....................................................................................................................... 75
Figure 4.7. Determination of Tch by thermogravimetric analysis carried out in the presence of
oxygen of fine (<90µm) dust. ....................................................................................................... 75
Figure 4.8. Mass loss of three dust fractions heated in air atmosphere. ....................................... 76
Figure 4.9. Mass loss of unfractionated pine dust and coal dust heated in air atmosphere. .......... 76
Figure 4.10. Mass loss of dust fractions (fine, medium and coarse) heated in the oxygen
atmosphere. .................................................................................................................................. 77
Figure 4.11. Mass loss of unfractionated pine and coal dust heated in the oxygen atmosphere. ... 77
Figure 4.12. Determination of apparent activation energy (<90 µm) . .......................................... 78
Figure 4.13. Ignition risk of pine dust fractions (fine dust, medium dust and coarse dust),
unfractionated pine dust, lignite coal dust, biological materials dust (icing sugar, maize dust,
wheat dust and animal waste) (Ramirez et al., (2010). ................................................................ 78
Figure 4.14. Determination of TRE and Tmax by differential scanning calorimetry ....................... 80
Figure 4.15. DSC plots of three dust fractions of loblolly pine (fine, medium and coarse) .......... 81
Figure 4.16. DSC plots of unfractionated loblolly pine dust and coal dust ................................... 81
xiii
List of Tables
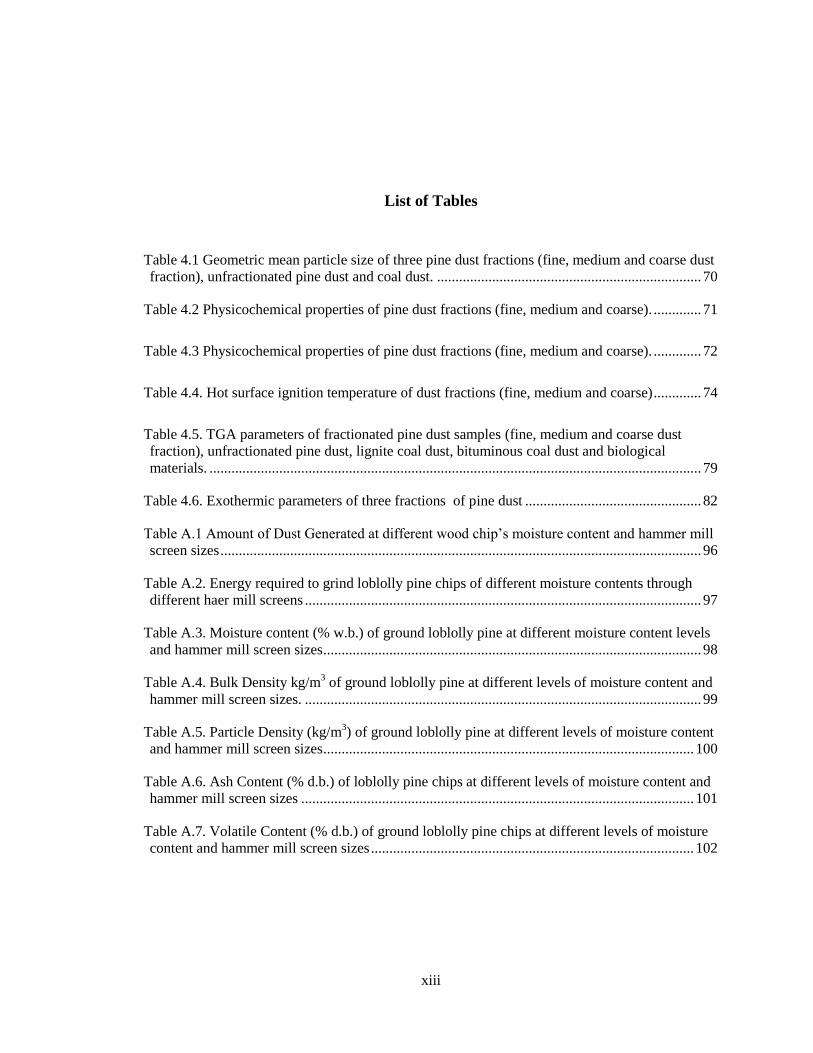
Table 4.1 Geometric mean particle size of three pine dust fractions (fine, medium and coarse dust
fraction), unfractionated pine dust and coal dust. ........................................................................ 70
Table 4.2 Physicochemical properties of pine dust fractions (fine, medium and coarse). ............. 71
Table 4.3 Physicochemical properties of pine dust fractions (fine, medium and coarse). ............. 72
Table 4.4. Hot surface ignition temperature of dust fractions (fine, medium and coarse) ............. 74
Table 4.5. TGA parameters of fractionated pine dust samples (fine, medium and coarse dust
fraction), unfractionated pine dust, lignite coal dust, bituminous coal dust and biological
materials. ...................................................................................................................................... 79
Table 4.6. Exothermic parameters of three fractions of pine dust ................................................ 82
Table A.1 Amount of Dust Generated at different wood chip’s moisture content and hammer mill
screen sizes ................................................................................................................................... 96
Table A.2. Energy required to grind loblolly pine chips of different moisture contents through
different haer mill screens ............................................................................................................ 97
Table A.3. Moisture content (% w.b.) of ground loblolly pine at different moisture content levels
and hammer mill screen sizes ....................................................................................................... 98
Table A.4. Bulk Density kg/m3 of ground loblolly pine at different levels of moisture content and
hammer mill screen sizes. ............................................................................................................ 99
Table A.5. Particle Density (kg/m3) of ground loblolly pine at different levels of moisture content
and hammer mill screen sizes ..................................................................................................... 100
Table A.6. Ash Content (% d.b.) of loblolly pine chips at different levels of moisture content and
hammer mill screen sizes ........................................................................................................... 101
Table A.7. Volatile Content (% d.b.) of ground loblolly pine chips at different levels of moisture
content and hammer mill screen sizes ........................................................................................ 102

xiv
Table A.8. Energy Content (kg/m3) of ground loblolly pine chips at different levels of moisture
content and hammer mill screen sizes ........................................................................................ 103
Table A.9. Moisture content (% d.b.) of loblolly pine dust at different levels of moisture content
and hammer mill screen sizes ..................................................................................................... 104
Table A.10. Bulk Density (kg/m3) of loblolly pine dust at different levels of moisture content and
hammer mill screen sizes ........................................................................................................... 105
Table A.11. Particle Density (kg/m3) of loblolly pine dust at different levels of moisture content
and hammer mill screen sizes ..................................................................................................... 106
Table A.12. Ash content (%d.b.) of loblolly pine dust at different levels of moisture content and
hammer mill screen sizes ........................................................................................................... 106
Table A.13. Volatile content (%d.b.) of loblolly pine dust at different levels of moisture content
and hammer mill screen sizes ..................................................................................................... 107
Table A.14. Energy content (% d.b.) of loblolly pine dust at different levels of moisture content
and hammer mill screen sizes ..................................................................................................... 107
Table B.1. Amount of dust generated (%) at different moisture content and screen size ............ 108
Table B.2. Grinding energy at different moisture content and screen size .................................. 108
Table B.3. Desired MC of loblolly pine chips for experiment, actual MC of loblolly pine chips
that was obtained, MC of ground loblolly pine and MC of dust ............................................... 109
Table B.4. Average particle size (mm) of ground loblolly pine chips and loblolly pine dust. .... 109
Table B.5. Bulk density (kg/m3) of loblolly pine chips and loblolly pine dust. ........................... 110
Table B.6. Particle density (kg/m3) of ground loblolly pine chips and loblolly pine dust. .......... 110
Table B.7. Ash content (% d.b.) of ground loblolly pine chips and loblolly pine dust. ............... 111
Table B.8. Volatile content (% d.b.) of ground loblolly pine chips and loblolly pine dust. ........ 111
Table B.9. Energy content (MJ/kg) of ground loblolly pine chips and loblolly pine dust ........... 112
Table C.1. Physical properties of loblolly pine dust fractions (fine dust, medium dust, coarse
dust), unfractionated loblolly pine dust and lignite coal ............................................................ 113
Table C.2. Chemical properties of loblolly pine dust fractions (fine dust, medium dust, coarse
dust), unfractionated loblolly pine dust and lignite coal ............................................................ 114
xv
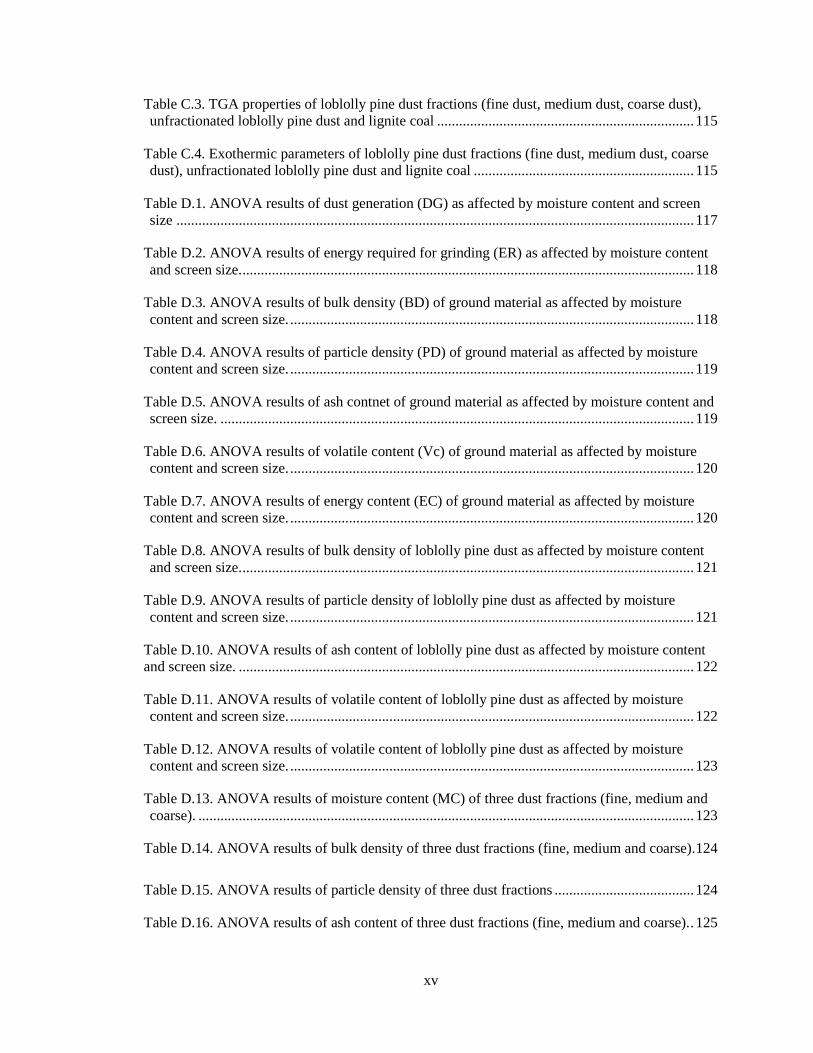
Table C.3. TGA properties of loblolly pine dust fractions (fine dust, medium dust, coarse dust),
unfractionated loblolly pine dust and lignite coal ...................................................................... 115
Table C.4. Exothermic parameters of loblolly pine dust fractions (fine dust, medium dust, coarse
dust), unfractionated loblolly pine dust and lignite coal ............................................................ 115
Table D.1. ANOVA results of dust generation (DG) as affected by moisture content and screen
size . ............................................................................................................................................ 117
Table D.2. ANOVA results of energy required for grinding (ER) as affected by moisture content
and screen size. ........................................................................................................................... 118
Table D.3. ANOVA results of bulk density (BD) of ground material as affected by moisture
content and screen size. .............................................................................................................. 118
Table D.4. ANOVA results of particle density (PD) of ground material as affected by moisture
content and screen size. .............................................................................................................. 119
Table D.5. ANOVA results of ash contnet of ground material as affected by moisture content and
screen size. ................................................................................................................................. 119
Table D.6. ANOVA results of volatile content (Vc) of ground material as affected by moisture
content and screen size. .............................................................................................................. 120
Table D.7. ANOVA results of energy content (EC) of ground material as affected by moisture
content and screen size. .............................................................................................................. 120
Table D.8. ANOVA results of bulk density of loblolly pine dust as affected by moisture content
and screen size. ........................................................................................................................... 121
Table D.9. ANOVA results of particle density of loblolly pine dust as affected by moisture
content and screen size. .............................................................................................................. 121
Table D.10. ANOVA results of ash content of loblolly pine dust as affected by moisture content
and screen size. ............................................................................................................................ 122
Table D.11. ANOVA results of volatile content of loblolly pine dust as affected by moisture
content and screen size. .............................................................................................................. 122
Table D.12. ANOVA results of volatile content of loblolly pine dust as affected by moisture
content and screen size. .............................................................................................................. 123
Table D.13. ANOVA results of moisture content (MC) of three dust fractions (fine, medium and
coarse). ....................................................................................................................................... 123
Table D.14. ANOVA results of bulk density of three dust fractions (fine, medium and coarse).124
Table D.15. ANOVA results of particle density of three dust fractions ...................................... 124
Table D.16. ANOVA results of ash content of three dust fractions (fine, medium and coarse). . 125
xvi
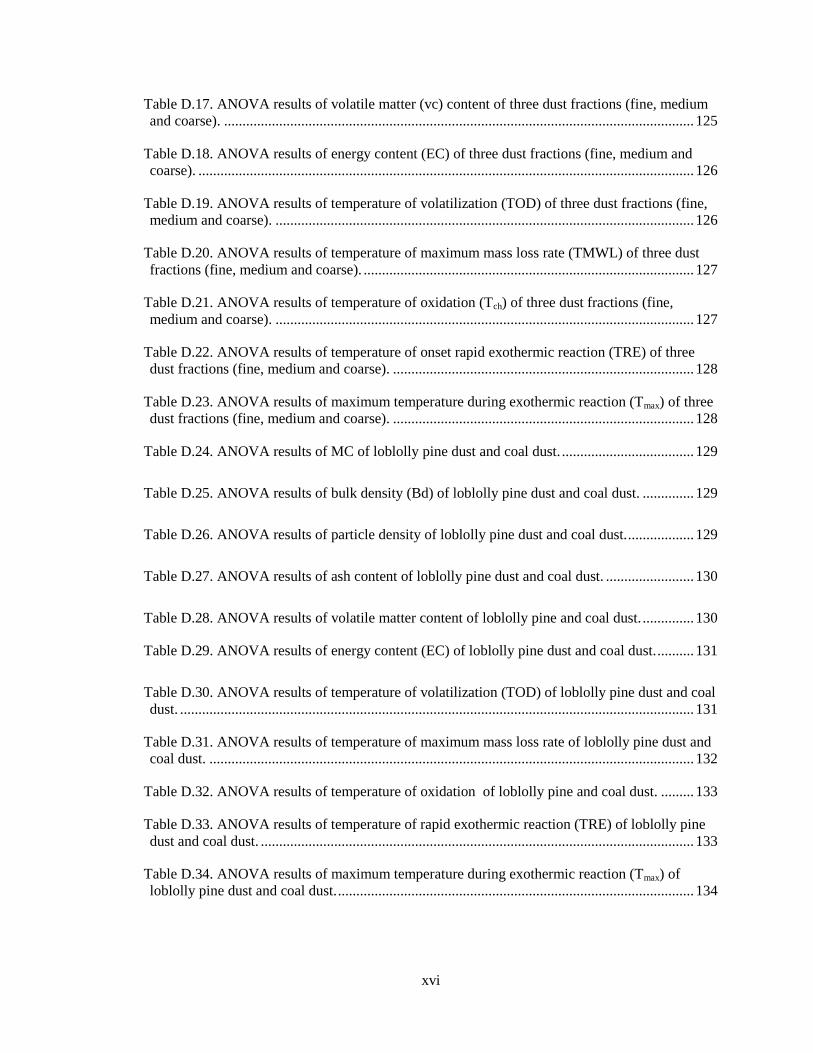
Table D.17. ANOVA results of volatile matter (vc) content of three dust fractions (fine, medium
and coarse). ................................................................................................................................ 125
Table D.18. ANOVA results of energy content (EC) of three dust fractions (fine, medium and
coarse). ....................................................................................................................................... 126
Table D.19. ANOVA results of temperature of volatilization (TOD) of three dust fractions (fine,
medium and coarse). .................................................................................................................. 126
Table D.20. ANOVA results of temperature of maximum mass loss rate (TMWL) of three dust
fractions (fine, medium and coarse). .......................................................................................... 127
Table D.21. ANOVA results of temperature of oxidation (Tch) of three dust fractions (fine,
medium and coarse). .................................................................................................................. 127
Table D.22. ANOVA results of temperature of onset rapid exothermic reaction (TRE) of three
dust fractions (fine, medium and coarse). .................................................................................. 128
Table D.23. ANOVA results of maximum temperature during exothermic reaction (Tmax) of three
dust fractions (fine, medium and coarse). .................................................................................. 128
Table D.24. ANOVA results of MC of loblolly pine dust and coal dust. .................................... 129
Table D.25. ANOVA results of bulk density (Bd) of loblolly pine dust and coal dust. .............. 129
Table D.26. ANOVA results of particle density of loblolly pine dust and coal dust. .................. 129
Table D.27. ANOVA results of ash content of loblolly pine dust and coal dust. ........................ 130
Table D.28. ANOVA results of volatile matter content of loblolly pine and coal dust. .............. 130
Table D.29. ANOVA results of energy content (EC) of loblolly pine dust and coal dust. .......... 131
Table D.30. ANOVA results of temperature of volatilization (TOD) of loblolly pine dust and coal
dust. ............................................................................................................................................ 131
Table D.31. ANOVA results of temperature of maximum mass loss rate of loblolly pine dust and
coal dust. .................................................................................................................................... 132
Table D.32. ANOVA results of temperature of oxidation of loblolly pine and coal dust. ......... 133
Table D.33. ANOVA results of temperature of rapid exothermic reaction (TRE) of loblolly pine
dust and coal dust. ...................................................................................................................... 133
Table D.34. ANOVA results of maximum temperature during exothermic reaction (Tmax) of
loblolly pine dust and coal dust. ................................................................................................. 134

1
Chapter 1 Introduction
A major portion (36% of total energy) of the energy consumed in United States is
obtained from crude oil with about 45% of the consumed crude oil imported from foreign
countries (EIA, 2013). In addition to our over-reliance on crude oil and other fossil fuels (coal
and natural gas), there are also issues of energy security due to price volatility of crude oil. Even
though the current price of crude oil is $108 per barrel, the crude oil price was as high as $140 per
barrel in 2008 (EIA, 2013).
Furthermore, the burning of petroleum products obtained from crude oil and the burning
of other fossil fuels generates emissions that pollute the environment. These emissions contain
gases such as carbon dioxide, methane, fluorinated gases, nitrous oxide and others that have been
associated with unstable climatic conditions around the world. In 2011, the United States
produced about 2299 million metric tons of carbon dioxide through the burning of petroleum
products only (contributed to 44% of total carbon dioxide generation in the United States).
Therefore, there is a need for sustainable and environment friendly energy resources that
can minimize our reliance on fossil fuels. These energy resources are often referred to as
renewable energy resources (e.g. biomass, wind energy, solar energy and geothermal energy)
because they are continuously replenished and therefore are abundant on earth. About 9% of the
energy consumed (total of 100 quadrillion Btu energy) in United States was obtained from
renewable resources in 2011 (EIA, 2013). Biomass is the only renewable energy resource that can
provide the carbon needed in transportation fuels and chemicals. According to the Energy

2
Independency and Security Act (EISA, 2007), the United States has to replace 20% of its crude
oil with renewable sources by the end of 2022. To achieve this target, the United States will need
to produce 16 billion gallons of ethanol from lignocellulosic biomass, 15 billion gallons of
ethanol from corn and 5 billion gallons of other biofuels such as biodiesel by 2022. Abundant
forest resources in the United States can provide a significant amount of lignocellulosic biomass
required to meet these goals. Loblolly pine is the dominant species in southern U.S. forests that
grows on around 55 million acres of land (Murphy et al., 2012). Thereby, loblolly pine provides a
promising feedstock that can be utilized to achieve the lofty target set by EISA (2007).
Before biomass can be transformed into energy, chemicals and byproducts, it must be
harvested, collected and processed. Unfortunately, dust particles are generated during these pre-
transformation unit operations. The two major consequences of dust generation are health and
fire/explosions. This thesis focuses on the fire/explosion aspect of dust generation and
specifically on the combustion and ignition risk of biomass dusts. The National Fire Protection
Association (NFPA) defines combustible dusts as any fine particles with a diameter less than 420
µm (material can pass through a U.S. number 40 standard sieve) that present a fire or explosion
hazard when dispersed and ignited in air (NFPA, 2011).
Several incidents of fire and explosion that were caused by combustible dusts have been
documented. These incidents have resulted in economic and sometimes human losses. In a study
carried out by the Chemical Safety and Hazard Investigation Board in 2003, there were 281
combustible dust explosions in the U.S. between 1980 and 2005 (CSB, 2004). As a result of these
accidents, 119 people lost their lives while 718 were injured. About 25% and 23% of these
accidents occurred in the wood and food processing industries, respectively (Blair, 2007). In
2008, a severe dust explosion occurred at the Imperial Sugar Plant in Port Wentworth, Georgia,
resulting in 14 fatalities and causing injury to 36 workers while completely destroying the plant.
The sugar plant lost resources worth about $15 million and incurred a fine of about $6 million for

3
violations of OSHA rules for combustible dusts. The company also had to pay over $300 million
to settle lawsuits (Vorderbrueggen, 2011). In April 2012, an explosion occurred at the Lakeland
sawmill, British Columbia, Canada killing one worker and injuring more than 24 (CBCnews,
2013). Obviously, explosions due to combustible dusts continue to be an issue when dealing with
bulk materials.
The goal of this study was to quantify the risk associated with combustion of dust generated
during processing of loblolly pine chips. To achieve this goal, the following specific objectives
were carried out:
1) Determine the effect of hammer mill screen size (1.20, 3.18 and 6.35 mm) and moisture
content (5%, 15% and 25% on w.b.) on amount of dust generated and energy required to
grind loblolly pine chips.
2) Quantify the physicochemical properties of ground material and dust collected from objective
3) Quantify the effect of particle size on physicochemical and ignition properties of fractionated
dust from ground loblolly pine, and compare physicochemical and ignition properties
unfractionated pine dust with lignite coal dust.

4
Chapter 2 Review of Literature
2.1 Energy Overview
Energy played a vital role in the development of civilization and in satisfying basic
human needs. Furthermore, development of civilization has resulted in population explosion and
causing increase in energy demand (Asif and Muneer, 2007) (Figure 2.1). For example, the
United Nations Population Division has estimated that the human population will be around 8.1
billion by 2030. Approximately 700 quadrillion Btu energy will need to be available for these
people (EIA, 2013). Most of this population rise has been observed to take place in developing
countries such as India and China and hence, energy demand in these countries will be high in the
future compared to developed countries (Asif and Muneer, 2007).
Figure 2.1. Rise in world energy consumption and human population (data EIA, 2013).
0
1
2
3
4
5
6
7
8
9
0
100
200
300
400
500
600
700
800
1990 1995 2000 2005 2010 2015 2020 2025 2030
En
erg
y C
on
sum
pti
on
(qu
ad
rill
ion
btu
)
Po
pu
lati
on
(B
illi
on
)
Year
2012
Energy Consumption
Population

5
The United States is one of the leading energy consuming countries in the world utilizing
97.5 quadrillion Btu energy in 2011 which was about 18.31% (531.2 quadrillion) of total energy
consumed in the world (EIA, 2013). The energy resources in the United States are petroleum,
coal, natural gas, nuclear and renewables as shown in Figure 2.2 (EIA, 2013). However,
renewable energy only accounts for 9% of the total US energy sources.
Figure 2.2. Energy Sources in the United States in 2011 (EIA, 2013).
2.1.1 Petroleum Products
Petroleum products (liquid fuels) are the primary energy source (36% of total energy
consumption) in the United States consuming 18.8 million barrels per day (MMbd) in 2011. The
United States highly depends upon foreign countries for petroleum products (about 45% of total
petroleum consumption was imported in 2011). In order to reduce the dependency on imported
foreign oil, domestic oil production has been increased over the past few years. In the year 2005,
total oil import accounted for 60% of total petroleum products consumption and this reduced to
45% in 2011 (EIA, 2013). The country’s long term goal is to reduce its oil import to 37% by 2035
(EIA 2013).

6
2.1.2 Coal and Natural Gas
Coal and natural gas are the other major sources of energy in the United States. The
United States has the world’s largest coal reserves which could last more than 200 years (EIA,
2013). These coal reserves are spread among 25 states. Five states (Wyoming, West Virginia,
Kentucky, Pennsylvania, and Texas) accounted for 72% of total coal production in 2011 (EIA,
2013). About a billion short tons of coal were produced from U.S. mines in 2011 and 90% of
which (about 900 million tons) was used for electricity generation (Figure 2.3). Although, major
portion of electricity comes from coal powered plants, its contribution decreased since 2007 due
to competition from natural gas and renewable energy resources. The United States also export
5% of its total coal production (EIA, 2013).
Figure 2.3. Electricity generation in the United States in 2011 (EIA, 2013).
The United States produced 23.0 trillion cubic feet of natural gas in 2011, which was
95% of its total natural gas consumption (EIA, 2013). The United States has abundance of natural
gas thereby, facilitating higher production than consumption. The United States Energy
Information Administration has estimated that natural gas production will increase to 3.1 trillion
cubic feet in 2040. This is about 44% more than the natural gas production in 2011 (EIA, 2013).

7
2.1.3 Renewable Energy
Renewable energy sources include hydroelectric power, wind, biomass, geothermal and
solar energy. The United States consumed 9 quadrillion Btu energy from renewable energy
sources in 2011 which is equivalent to 9% of total energy consumed (Figure 2.3) (EIA, 2013).
About 13% of total U.S. electricity generated in 2011 was from renewable energy
resources (EIA, 2013). Energy produced from water, hydroelectric power, is one of the primary
renewable energy sources and accounted for about 63% of total electricity generated from
renewables. However, the contribution of other renewable sources has been found to increase
over the years. For example, wind energy increased from 6 billion kWh in 2000 to about 120
billion kWh in 2011 (EIA, 2013). Electricity generation from solar energy has also been found to
increase from 0.64 million kWh in 2002 to 37.72 million kWh in 2011.
Ethanol and biodiesel are liquid fuels derived from biomass. The United States started the
use of 10% ethanol (E 10) in most of the available gasoline from 2012. U.S. Environmental
Protection Agency (EPA) has also approved 15% ethanol blend in new cars and light trucks. A
large amount of ethanol production is from starch biomass such as corn and soybean. However,
ethanol production from cellulosic biomass is minimal and it is far away to meet targets set by the
Energy Independence and Security Act of 2007 (EISA 2007).
2.2 Fossil Fuels
Fossil fuels such as coal, oil and natural gas are non-renewable energy sources generated
by anaerobic decomposition of organisms buried under the earth (Osueke and Ezugwu, 2011).
The global view is that it took millions of years to form fossil fuels and hence they are not
considered as renewables (Mckendry, 2002). Therefore, fossil fuel resources are limited but their
demand is increasing daily. Researchers have different views on fossil fuel reserves and it is not
known when fossil fuel reserves will be completely exhausted (Shafiee and Topal, 2009). For
example, Salameh (2003) stated, “global oil supplies will only meet demand until global oil
8
production has peaked sometime between 2013 and 2020”. Asif and Muneer (2007) documented
that coal reserves in India, China, Russia and USA will be consumed in 315, 83, 1034 and 305
years, respectively. Further, estimates exists that liquid fuels has reached maximum production in
Turkey and will be depleted by 2038 (Akpinar et al., 2008).
Although combustion of fossil fuels releases energy, greenhouse gases like carbon
dioxide, methane, and nitrous oxide are also produced (Kennedy et al., 2010; Macedo et al.,
2008). These greenhouse gases (GHGs) form blanket around the earth which prevent heat
escaping from the earth, thereby causing increase in temperature and climatic changes. Activities
such as deforestation, industrial processes and agricultural activities also contribute to greenhouse
gas emission (Kennedy et al., 2010; Lal, 2004).
Renewable energy sources can contribute towards meeting the future energy demands of
the world by reducing the significant proportion of fossil fuels. Renewables are environment
friendly due to their potential to reduce greenhouse gas emission. Several countries are increasing
investment in renewable energy sources (Asif and Muneer, 2007; Wei et al., 2010). For example,
the projected increase in renewable energy production in India, China and United States is shown
in Figure 2.4.
9
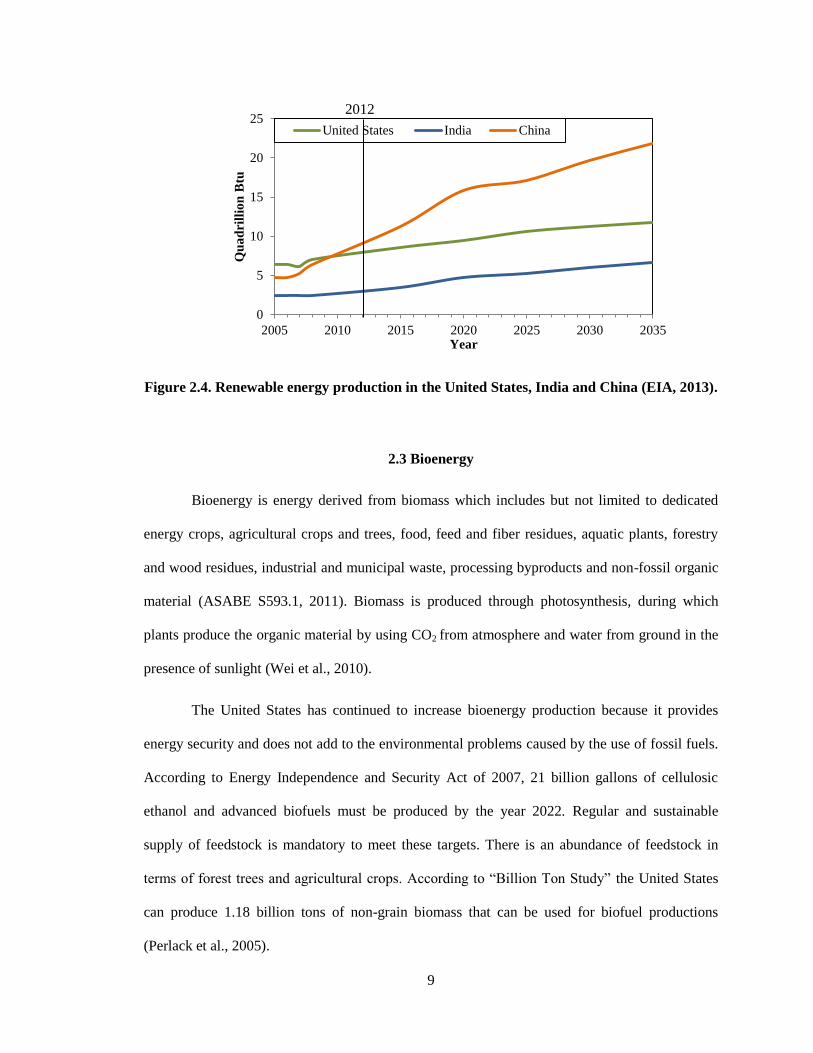
Figure 2.4. Renewable energy production in the United States, India and China (EIA, 2013).
2.3 Bioenergy
Bioenergy is energy derived from biomass which includes but not limited to dedicated
energy crops, agricultural crops and trees, food, feed and fiber residues, aquatic plants, forestry
and wood residues, industrial and municipal waste, processing byproducts and non-fossil organic
material (ASABE S593.1, 2011). Biomass is produced through photosynthesis, during which
plants produce the organic material by using CO2 from atmosphere and water from ground in the
presence of sunlight (Wei et al., 2010).
The United States has continued to increase bioenergy production because it provides
energy security and does not add to the environmental problems caused by the use of fossil fuels.
According to Energy Independence and Security Act of 2007, 21 billion gallons of cellulosic
ethanol and advanced biofuels must be produced by the year 2022. Regular and sustainable
supply of feedstock is mandatory to meet these targets. There is an abundance of feedstock in
terms of forest trees and agricultural crops. According to “Billion Ton Study” the United States
can produce 1.18 billion tons of non-grain biomass that can be used for biofuel productions
(Perlack et al., 2005).
0
5
10
15
20
25
2005 2010 2015 2020 2025 2030 2035
Qu
ad
rill
ion
Btu
Year
United States India China
2012

10
Forest trees are grown approximately on one third (749 million hectare) of the nation’s
total land (Simmons et al., 2008). About two third (204 million hectares) of forest land is
classified as timberland which is a potential biomass source. Loblolly pine is one of the
dominating species of southern forests and it occupies 51 million acre land (Murphy et al., 2012).
According to Williams and Gresham, (2006), 15.2 Mg/ha of total biomass can be produced every
year from loblolly pine tree by intensive management. This means a large amount (353.82 million
tons per year) of loblolly pine tree is potentially available for bioenergy.
The United States has 181 million acres of land for agriculture. Grain and oilseeds are the
major feedstocks that are currently used for producing ethanol, biodiesel and byproducts. Food
and feed processing residues can also be used to generate energy. Agricultural land only provides
25% of total feedstock used for bioenergy industry (Simmons et al., 2008). This contribution can
be increased by increasing land used for dedicated energy crops such as perennial and woody
crops (Perlack et al., 2005).
Biomass can be transformed into heat and power, transportation fuels and chemical
feedstock (Figure 2.5) by two main pathways, thermochemical conversion and biochemical
conversion. Choice of conversion technique depends on various factors such as amount and type
of feedstock, desired form of energy, economic and environmental conditions (McKendry, 2002).

11
Figure 2.5. Flow chart showing conversion of biomass into bioenergy (Akpınar et al., 2008).
2.3.1 Thermochemical Conversion
Thermochemical conversion is considered more time efficient (in terms of seconds or
minutes) compared to biochemical conversions (several days or weeks and even longer).
Thermochemical conversion techniques are used to convert biomass into solid, liquid or gaseous
products, are combustion, gasification, pyrolysis, and liquefaction (McKendry, 2002; Zhang et
al., 2010).
2.3.1.1 Direct Combustion and Co-firing
Direct combustion of biomass was used for cooking and heating purposes in the past and
is still being used in developed countries for power generation. Few examples of biomass power
plants in the United States are: Alexandira (location: NH), Aspen Power (location: TX) and
Cadillac (location: MI). Direct combustion produces heat (800-900ºC) that are used to produce
steam, mechanical power or electricity by using various equipment such as stoves, furnace,
boilers, turbines etc. (Figure 2.6). Direct combustion is a very reliable technology due to its low
Fiber
Process residues,
black liquor,
sawdust, bark
Crops,
Animals
Process residues, stalks
& straw, harvest
residues, forest slash,
bagasse, dung Biomass
Forest harvest for
energy, short
rotation woody
crops, herbaceous
energy crops
Materials
Pulp,
paper
lumber,
Plywood,
Cotton.
Food
MSW, yard
trimmings,
construction &
demolition, wood
Energy Services
Heat, Electricity,
CHP
Biofuels
Charcoal, Ethanol,
Producer-Gas
Bioenergy
Consumer
s

12
cost. Although, biomass of high moisture content (up to 50%) can be used for combustion, the
process is not efficient at this high moisture content since the energy content of biomass varies
inversely with moisture content. Fouling and corrosion problems are also associated with the
combustion of biomass because of the presence of alkali metals and other elements (such as
silicon, sulphur, chlorine, calcium and iron) in biomass ash (Zhang et al., 2010).
Figure 2.6. Schematic diagram of biomass power plant (Biomass, 2013).
Biomass can also be co-fired with coal for electricity generation. Examples of power
plants in the United States where biomass is co-fired with coal are Schiller Station, Portsmouth,
NH (co-fire fuel is wood), Boardman Plant, Boardman, OR (co-fire fuel is torrefied biomass), and
Mount Poso Cogeneration Plant, Bakersfield, CL (co-fire fuel is agricultural and residential
waste) (Nichols, 2012). Co-firing of biomass with coal also reduces the CO2 emission. According
to Mann and Spath (2001), 5 and 15 percent of biomass co-fired with coal can reduce CO2
emissions by 5.4 and 18.2 percent, respectively. Co-firing of biomass is a cost effective
technology and coal based power stations can be used with few modifications. Various types of
biomass such as wood based, agricultural residues, dedicated energy crops and herbaceous
materials can be co-fired with coal at different ratios (maximum up to 15%) (Zhang et al., 2010).
Although, co-firing technology has been improving constantly, there are many problems resulting

13
from highly variable characteristics of biomass which includes high moisture content, volatile
content, low calorific value and density compared to coal. Biomass also has high alkali content in
ash which causes fouling, slagging and corrosion of reactors (McIlveen-Wright et al., 2007).
2.3.1.2 Pyrolysis
Pyrolysis is the thermal decomposition of biomass in the absence of oxygen. It converts
biomass into the bio-char, bio-oil and gases at a high temperature (200-600ºC) (Babu, 2008).
Depending upon temperature and heating rate pyrolysis is divided into three types: fast pyrolysis,
intermediate pyrolysis and slow pyrolysis. High temperature and high heating rate are essential to
get high bio-oil yields and low temperature and low heating rates are preferred for more charcoal
production (Zhang et al., 2010). Bio-oil can be used for power generation, as a feedstock for
production of chemicals, and as a transportation fuel. In addition, bio-char can also be used as a
soil amendment and carbon sequestration agent. High viscosity, thermal instability, corrosive
nature (due to high acidity), and aging are major problems associated with bio-oil. A lot of
techniques such as hydrodeoxygenation, catalytic cracking of pyrolysis vapors, emulsification,
steam reforming and chemical extraction have been developed to overcome these issues (Zhang
et al., 2007).
2.3.1.3 Gasification
Gasification involves conversion of biomass into combustible gases such as CO, CH4,
and H2 at high temperature (800-1000ºC) in the presence of oxygen. The process can be split into
three stages: drying (>150ºC), devoaltization (150-700ºC) and gasification (800-1000ºC). The
mixture of H2 and CO called ‘syngas’ can not only be used in power generation, but also in
chemical production through Fischer-Tropsch synthesis (McKendry, 2002; Zhang et al., 2010).
Gasifiers are characterized according to types of bed as fixed-bed and fluidized bed. Fixed-bed
gasifiers further divided into two categories as updraft and down draft gasifiers, depending upon
the types of flow. In the case of updraft, biomass is introduced from the top while in downdraft,

14
biomass is introduced from the bottom. Downdraft and updraft are most commonly used in past
(Gómez-Barea and Leckner, 2010). Biomass gasification has many advantages such as low
greenhouse emission, complete combustion, high thermal efficiency and compact equipments.
However, it is not widely accepted for industrial uses because of its high initial investment
(Zhang et al., 2007).
2.3.1.4 Liquefaction
Liquefaction is a technique to convert biomass into liquid form at low temperatures
(280ºC –420ºC) and high pressures (5-20 MPa) in the presence of hydrogen and a catalyst. The
process involves biomass breaking into smaller reactive molecules in water, which undergo
polymerization to form oil mixtures of various ranges of molecular weight. Although,
liquefaction is a costly process compared to pyrolysis, biomass of high moisture content can be
processed without pre-drying (Qian et al., 2007).
2.3.2 Biochemical conversion
Biochemical conversion is the process of breaking down the carbohydrates in biomass
into sugars in the presence of enzymes, acids, bases, solvents or other reagents. Catalyst and or
microorganisms are then used to transform the sugars into biofuels (DOE, 2013). Although,
biochemical process can operate on small scale with low maintenance, thermochemical
conversion is highly preferred due to its ability to accept a wide range of biomass as feedstock
(Jeguirim and Trouvé, 2009). The various biochemical conversion methods are described in
details below.
2.3.2.1 Anaerobic Digestion
Anaerobic digestion is a type of biochemical conversion which involves decomposition
of biomass (biomass of high moisture content, animal manure and food processing waste) in the
absence of oxygen (Figure 2.7). Symbiotic groups of bacteria play a major role in this conversion

15
process. Some of the bacteria along with their roles have been discussed below. Hydrolytic
bacteria hydrolyze the complex structure of biomass into sugars and amino acids. Fermentative
bacteria change sugars and amino acids into acids. Acidogenic bacteria convert these acids into
hydrogen and carbon dioxide. Methanogenic bacteria convert these products into biogas which is
used for energy purposes such as cooking, heating and electricity production. The landfill
methane gas is an example of anaerobic decomposition (Weiland, 2010).
Figure 2.7. Schematic diagram of aerobic digestion (Biogas Technology, 2013).
2.3.2.2 Ethanol Production
Biochemical conversion is the main method to produce ethanol from biomass. Feedstock
for ethanol production can be divided into three categories: 1) sugar-containing feedstock (sugar
cane, sugar beet, sweet sorghum and fruits), (2) starch containing materials (corn, milo, wheat,
rice, potatoes, cassava, sweet potatoes and barley), and (3) lignocellulosic biomass (wood, straw,
and grasses) (Figure 2.8) (Balat and Balat, 2009). Sugar containing biomass are easily converted
into ethanol by crushing, mixing with water and yeast and allowing the mixture to stay in large
tanks in order to extract sugar. The yeast is used to transform the sugars into ethanol by breaking

16
them down which is followed by removal of impurities and water by distillation. Some ethanol is
lost during distillation and high yield of ethanol can be achieved by secondary distillation. A high
yield of ethanol can be obtained from starch materials but hydrolysis of the starch is required
before fermentation of the resulting sugar into ethanol. Although, ethanol production from sugar
and starch crops looks attractive, it creates a huge burden on agricultural land to produce more
food crops (Naik et al., 2010).
Figure 2.8. Schematic diagram of ethanol production (Mussatto, et a., 2010).
Cellulosic biomass is a cheap source of biomass for ethanol production because it is
available in abundance. But economic and technological challenges are currently associated with
ethanol production from lignocellulose crops due to chemical structure of lignocellulosic crops.
Lignocellulosic biomass mainly consists of lignin, cellulose and hemicellulose. Cellulose and
hemicellulose form about the two thirds of the cell wall of lignocellulosic feedstocks, are
polysaccharides they can be converted into sugars by hydrolysis and then fermented into ethanol.

17
Hence, ethanol production of biomass depends only on cellulose and hemicellulose content.
Cellulose is the main component of lignocellulosic biomass and it consists of long polymers of
glucose. Inter linkages and hydrogen bonding in the cellulose makes it rigid. Hemicellulose
consists of short and highly branched polymer of five-carbon (xylose and arabinose) and six
carbon sugars (alactose, glucose, and mannose). Hemicellulose can be easily hydrolyzed into
sugars due to its amorphous nature. The main problem is the rigid structure of lignocellulosic
biomass in its conversion to ethanol. Biochemical conversion of lignocellulose involves
pretreatment, hydrolysis, fermentation and product separation. Pretreatment is an important step
in ethanol production because it is needed to break down the cellulosic and hemi-cellulosic
structures (Figure 2.9). Lignocellulosic biomass cannot easily be hydrolyzed if pretreatment is not
efficient. Different types of pretreatment methods such as physical (milling and grinding),
physico-chemical (steam explosion/autohydrolysis, hydrothermolysis, and wet oxidation),
chemical (alkali, dilute acid, oxidizing agents, and organic solvents), and biological processes
have been used (Balat, 2011; Zhu and Pan, 2010; Mosier et al., 2005). Steam explosion is the
most commonly used pretreatment method for ethanol production from lignocellulosic biomass
(Parveen Kumar et al., 2009).
Figure 2.9. Pretreatment of lignocellulose crops for ethanol production (Kumar et al., 2009).

18
2.3.2.3. Biodiesel
Vegetable oil and animal fat can be transformed into biodiesel by transeterification
process. Vegetable oil and animal fat are composed of triacylglycerol (TAG), which consists of
long-chain fatty acids that are chemically bound to a glycerol (1,2,3-propanetriol) as shown in
Figure 2.10. In transeterification process, TAG react with monohydric alcohol in the presence of
catalyst at elevated temperature to form free fatty acids (FAAE) and glycerol (Figure 2.10)
(Moser, 2011). It is a stepwise process in which the alcohol initially reacts with TAG to produce
FAAE (bio-diesel) and diacylglycerols (DAG), DAG then reacts with alcohol to produce another
molecule of FAAE and generates monoacylglyerols (MAG). Further reaction of MAG with
alcohol yields glycerol and FAAE. Total yield of bio-diesel is obtained by the sum of FAAE
produced at each step. Biodiesel can be directly used or mix with diesel to run the internal
combustion engine. Biodiesel has many advantages compared to diesel such has low toxicity,
inherent lubricity, superior flash point and low exhaust after burning. However, problems are
associated with the use of biodiesel due to its high viscosity, low stability against oxidation and
low volatility resulting in incomplete burning (Moser, 2011;Yusuf et al., 2011).
Figure 2.10. Chemical process to produce biodiesel from vegetable oil (Moser, 2011).

19
2.4 Biomass Logistics and Pre-processing
Biomass logistic is composed of unit operations, steps that are used to process and
prepare the biomass after harvesting and before they get to the throat of bio-refinery plants
(Figure 2.11). According to Energy Indepdency and Security Act, 2007, about 1 billion tons of
biomass will be required to produce 36 billion gallons of biofuel by 2030. This requires a regular
and adequate supply of biomass, a cost effective and optimal logistic system.
Figure 2.11. Flowchart representing a Biomass logistics system.
The major problem in biomass logistics is the low density and high moisture content of
biomass which results in problems during transportation, storage and utilization. (Fasina, 2008;
Petrou and Pappis, 2009; Sokhansanj et al., 2009). Additional energy is required to reduce the
moisture in biomass destined for combustion because of the influence of high moisture content on
efficiency of combustion (Hoffa et al., 1999; Lewandowski and Kicherer, 1997). Problems related
to low bulk density can be solved by densification of biomass such as pelletization and
briquetting (Tumuluru et al., 2010). However, densification involves energy intensive processes
such as drying, grinding and compaction.
Biomass Harvesting and
Collection Pretreatment
Storage
Transportation Handling and
queuing at
biorefinery

20
Handling and collection, preprocessing and storage of biomass require the use of
equipment such as hammer mill, mechanical conveyors (screw augers, belt conveyor), cyclones,
dryers, screening and classifying equipments. According to Echkoff (2003) and Abbasi and
Abbasi (2007), these equipment cause dust generation when bulk material such as biomass are
handled and processed. For example, fine particles present in the biomass are released in the form
of dust during the free fall as shown in Figure 2.12.
Figure 2.12. Dust generation during the handling of biomass (Wypch et al., 2005).
The amount of dust generated during biomass handling and processing depends on the
feedstock, its moisture content and types of machines and equipment used for processing (Khan
et al., 2008). However, only limited information is available with the research literature on the
dust generation from biomass. Scholtz et al., (2009) observed that 14.8% of dust was generated
during grinding of hay (Medicago sativa L.) through hammer mill. Madsen et al. (2004) studied
the dustiness of straw, wood chips, and sawdust pellets and briquettes. Dust was generated by
using rotating drum as air was passed through it. Number of particles (0.75-3.5 µm) in the air
flow was measured and dustiness of biomass was expressed as number of particles/L of air. Straw
was (100000-1500000/L air) dustiest biomass sample and wood pellets (150-1000/L of air) were
less dusty compared to wood chips (5000-10000/L air) and sawdust briquettes (10000-15000/L
air).

21
2.5 Health Problems from Dust
In addition to dust generation from processing equipment as described in the last section,
dust can also be generated from harvesting and collection operations such as cutting, windrowing
and bailing. The dust generated from these operations that contain microorganisms and
endotoxins that cause health issues such as skin and eye irritation, lung and skin cancer and other
respiratory problems ( Clausnitzer and Singer, 2000).
A survey of dust exposure was conducted in 10 wood processing plants in the United
States that included sawmill, plywood assembly plants, secondary wood milling operations, and
factories producing finished wood products such as wood furniture and cabinets. Dust exposure
was determined by dividing dust in to three fractions; respirable (<10µm), thoracic (10-100 µm)
and inhalable (<100 µm). There were 2430 samples of different fractions were collected by using
RespiCon Personal Particle Sampler. Overall, geometric mean (geometric standard deviation)
exposure levels were found to be 1.44 (2.67), 0.35(2.65), and 0.18 (2.54) mg/m3 for the inhalable,
thoracic, and respirable fractions, respectively. Dust exposure level in the furniture manufacturing
plants was significantly higher than those in sawmill and plywood assembly plants, wood milling
plants, and cabinet manufacturing plants. However, only 1% of total samples were at or above the
minimum exposure limit by OSHA (5 mg/m3) (Kalliny et al., 2008).
Madsen et al. (2004) reported the amount of microorganism in different types of
biomass-- straws, wood chips, sawdust briquettes and pellets using various methods. High
amount of actinomycetes, bacteria, muramic acid, endotoxin, LPS was observed in the straw dust
compared to other biomass. Less amount of microorganism was observed in wood pellets and
wood briquettes. The concentrations of endotoxin and fungi were high in straw and wood dust,
respectively. For example, dust generated from straw contained 3610 EU/mg and dust obtained
from wood chips contained 7.3 × 10⁶ fungal spores/mg. It was also observed that 3mg/m3 of
straw or wood dust contain enough amounts of endotoxin and fungi that can cause various health
22
problems. Hence, selection of biomass based on the presence of microorganism is very important
to avoid health problems.
2.6 Combustible Dusts
As explained earlier, dust generation is a problem associated with handling and
processing of biomass. Biomass dust is combustible in nature and can result in fires and
explosion. National Fire Protection Association defined combustible dusts as follow:
NFPA, (2007) defined deflagrable wood dust as “wood particulate with a median diameter of 420
micrometers (m) or smaller in diameter (i.e., material passing through a U.S. No. 40 Standard
sieve) having a moisture content of less than 25 percent (wet basis) that presents an explosion
hazard when dispersed and ignited in air.”
NFPA 499 (NFPA, 2008a) defined combustible dust as “any finely divided solid material that is
420 micrometers (μm) or smaller in diameter (material passing through a U.S. No. 40 Standard
sieve) that presents an explosion hazard when dispersed and ignited in air.”
NFPA 61 (NFPA, 2008b) defined agricultural dust as “any finely divided solid agricultural
material that is 420 micrometers (μm) or smaller in diameter (material passing through a U.S. No.
40 Standard sieve).”
Calle et al. (2005) also mentioned that the dust particles have a diameter greater than 500
µm do not contribute significantly in dust explosions and this is close to the NFPA definition of
dust. However, Echkoff, (2003) explained that fibers and flakes can also contribute significantly
to dust explosions, though they cannot pass through a screen size of 420 micrometers (U.S. No.
40). Rate of burning of the material is directly proportion to the surface area. A spherical particle
of 5 µm diameter when compressed into a flake having 0.2 µm thickness and about 20 µm length
increases its surface area by 8 times. Hence, flakes of the same volume as sphere cannot pass
through the same screen but can be burnt quickly due to increase in its surface area. NFPA 654

23
(NFPA, 2011) now corrected the definition of combustible dust as follows “a combustible
particulate solid that presents a fire or deflagration hazard when suspended in air or some other
oxidizing medium over a range of concentrations, regardless of particle size or shape.”
2.7 Ignition of Dusts
The three elements that are essential for combustible dusts to ignite are fuel (dust),
oxygen and heat. These elements form what is is known as fire triangle as shown in Figure 2.13.
Fires and explosions due to the ignition of dusts or bulk materials are considered as one of the
serious problems in processing industries (Eckhoff, 2000; Krause and Schmidt, 2001; Janes et al.,
2008). Experiments and models were developed on ignition of combustible dusts and effects of
various factors such as volume-surface ratio, size and shape of pores, volatiles and moisture on
ignition have been studied (Gray et al., 2002; Schmidt et al., 2003; Wang et al., 1998).
Figure 2.13. Components of fire triangle (fuel, oxygen and heat) (Gillman and Le May,
2007).
2.7.1 Ignition Sources
Energy or heat required for an ignition of dust is generally provided by an ignition source.
The potential ignition sources that are found in processing plants include:
1) Open flames
2) Hot works such as welding and cutting
3) Hot surfaces
24
4) Burning dust
5) Mechanical impacts
6) Electric and electrostatic spark (Abbasi and Abbasi, 2007; Eckhoff, 2003; Taveau, 2012)
Hot surface is the most common ignition source for combustible dusts. Hot surface provides
the required energy to initiate the ignition of dusts. Dust layer settled on the hot surface acts as
insulation and minimizes heat loss. As a result, temperature of dust can increase to its ignition
temperature thereby resulting in combustion. (Echkoff, 2003).
Experimental work was done in past to find the relation between the depth of dust layer
settled on hot surfaces and ignition temperature was determined. For example, minimum ignition
temperatures of wheat flour dust layers with depth of 5 mm, 20 mm and 40 mm were 311 °C, 265
°C and 238 °C, respectively. Hence, minimum ignition temperature of dust increased with
decrease in depth and similar results were obtained by Lebecki et al. (2003).
Shape and geometry of dust layer can also effect the ignition of combustible dusts. Joshi et al.
(2012) studied the effect of geometry on the ignition behavior of bituminous coal dust deposited
between two hot surfaces forming wedges of 60º and 90º. Three thermocouples were inserted
along the plane of the wedge cross-section at various heights from the apex (lowermost, middle
and top). Ignition of coal occurred at 190º C in the 60º wedge while it started at the 195º C in the
90º wedge. This indicated that the geometry of hot surfaces affects the ignition properties of dust
settled on it.
Ignition properties of combustibles were also measured with the thermogravimetric
apparatus and differential scanning calorimeter. As an example, Ramirez et al., (2010) studied the
ignition properties of two powdered material (icing sugar and wheat flour) and five agricultural
dusts (maize, wheat, barley, alfalfa, soybean, and icing sugar). TGA variables such as
temperature of combustion onset (TIC), the temperature of maximum weight loss (TMWL) and

25
temperature of oxidation (Tcharac) were determined. The minimum temperature required for the
onset of an exothermic reaction (TOE), the maximum temperature reached during that exothermic
reaction (TDE), and the temperature required for the onset of a rapid exothermic reaction (TRE)
were calculated by using the DSC. Icing sugar was more susceptible to ignition due to its lowest
TIC (212º C) and TMWL (220º C) but its melting hindered its ignition. Wheat dust and flour had
the highest TIC and TMWL and they were less susceptible to ignition. The TOE of all material
ranged from 80-100º C. Other dusts such as maize, wheat, soybean, barley and alfalfa have high
risk of self-ignition and bread-making flour has a medium risk of self-ignition.
2.7.2 Factors affecting Ignition
Moisture Content
Moisture content of dust affects the ignition behavior of material. Material with high
moisture ignites at higher temperature and more energy is required to ignite it. Moqbel et al.
(2010) determined the ignition temperature of different types of solid wastes (food, cardboard,
yard waste, glossy paper, newspaper, office paper, textile waste, mixed solid waste ) at different
moisture contents (10%, 20% and 40% on wet bases) by using a programmable furnace. Ignition
temperature of all types of waste increased with moisture content. For example, ignition
temperature of yard waste was 250, 295 and 333 ºCat 10%, 20% and 30% moisture contents.
Hence, high moisture content of dusts is favorable for reduced ignitibility.
Particle Size
Rate of burning of material increases when material is divided into small particles
because material subdivision leads to increase in surface area. In addition, more air is available
for combustion, when particle are small. In general, particle size affects the ignition properties of
dust (Chen et al., 1996; Eckhoff, 2003). Sweis (1998) determined that particle size increased the
ignition temperature of oil shale. Ignition temperatures of dust at particle size 75.3 and 212.3 µm
were 640º C and 680º C respectively.

26
Ash Content
Ash content is a measure of amount of inorganic components in material. Ash content of
dust acts as heat sink because of its incombustible nature and it inhibits the ignition of material.
Biomass has generally low ash content (about 0.1-8.4%, d.b.) compared to coal (4-30%, d.b.).
Different types of material were used in combustible dust to reduce their ignitibility. For an
example, ignition onset temperature of wheat straw (ash content is 0.1% on d.b.) was increased
when coal (ash content is 9.7% on d.b.) was added in different ratios. Ignition started at 260, 276
and 426 ºC, when wheat straw to coal ratio was 100:0, 50:50 and 0:50, respectively (Vuthaluru,
2003).
Volatile Matter
Ignition of dusts highly depends upon their volatile matter because it acts as a fuel for
ignition. Biomass has high volatile matter (48-86%) and thereby can be easily ignited. Dust
generated from biomass handling will also be easily ignited. Ignition temperature of coal and
biomass decreased with an increase in volatile matter as shown in Figure 2.14. Ignition
temperature of wheat straw (volatile content: 72% d.b.), popular wood (volatile content: 75%
d.b.), lignite (volatile content: 51% d.b.), bituminous (volatile content: 32% d.b). and anthracite
(volatile content: 9.8% d.b.) were 210, 290, 300, 450 and 490º C, respectively.

27
Figure 2.14. Effect of volatile content of material (coal and biomass) on ignition
temperature (Grotkjær et al., 2003).
Figure 2.15. Dust explosion from ignited dust layer (Combustible Dusts, 2013).
2.8 Dust Explosion
As already discussed, dust generation is a problem with handling and processing of
biomass. The dust particles settle on different parts of plant such as floor, equipments and can
form a dust layer. Dust layer can be dispersed by an external source such as blow of air and as a
200
300
400
500
0 20 40 60 80
Ign
itio
n T
emp
era
ture
(ºC
)
Volatile Matter Content (% on w.b.)
Wheat Straw
Euclyptus wood
Lignite coal
Bituminous coal
Anthracite coal

28
result, a dust cloud can be formed (Figure 2.15). If concentration of dust is high enough and it
confined in a space, an explosions can occur when ignition source comes in contact with dust
cloud. For example, a 1 mm layer of dust of bulk density 500kg/m3, when suspended in the space
of 5 m3, can form the concentration of 100g/m
3 (Figure 2.16) (Amyotte and Eckhoff, 2010). The
lower explosive limits of concentrations of sunflower flour, maize gluten, wheat processing waste
are 125 g/m3, 100 g/m
3, and 30 g/m
3 (Ramírez et al., 2009). Thereby it is possible for a 1mm layer
(ignited) of biological material to cause an explosion in 5 m3 rooms.
(a) (b)
Figure 2.16. (a) A 1mm dust layer of biological material (bulk density is 500kg/m3) (b) Dust
forms a concentration of 100g/m3 when dispersed in a room of 5 m
3(Amyotte and Eckhoff,
2010).
However, dust layer can also be ignited when it directly comes into contact with ignition
source. In this case, when dust layer suspended in air and forms the dust cloud, ignited dust itself
acts as ignition source. The capability of ignited dusts to cause explosion has been studied by
many researchers. Pinwasser (1986) reported that burning dust of a temperature of 700º C cannot
cause ignition when fell through a dust cloud column (wheat flour). On the other hand, ignition of
dust cloud occurred when smoldering dust of 25 mm and weighing 15 g, fell freely in column of
1 m length. Gummer and Lunn (2003) reported that smouldering dust can cause ignition when the

29
difference between the temperature of dust and the minimum ignition temperature of the dust
cloud was high and burning dust was dispersed.
Hence, ignition of dust cloud by smoldering or burning of dust depends upon various
factors such as temperature of burning dust, minimum ignition temperature of dust cloud,
dispersion of nest, residence time of smoldering nest in dust cloud.
2.8.1 Factors effecting Dust Explosion Characteristics
Parameters such as minimum ignition energy (MIE), minimum ignition temperature
(MIT), minimum explosion concentration (MEC), maximum explosion pressure (Pmax) and rate of
explosion pressure rise (dip/dt)max are used to quantify dust explosion properties of material
(Cashdollar, 2000; Nifuku et al., 2005). Minimum ignition energy is the amount of electrical
energy required to ignite air/dust mixture at room temperature and atmospheric pressure.
Minimum ignition temperature is the temperature of air at which combustion of dust particles
begins. The minimum explosion concentration is the limiting value of concentration above which
dust/air mixture can propagate a flame. Severity of the explosion depends upon maximum
pressure and rate of pressure rise during the explosion (Echkoff, 2003).Dust explosion
characteristics depend upon the physicochemical properties of dust and these are described
below.
Particle Size
The particle size of dust affects its ignition and explosion properties. The rate of material
burning increased with a decrease in surface area. The effect of particle size of Pittsburgh
bituminous coal dust on MEC, Pmax and rate of pressure rise (dip/dt)max was determined by
Cashdollar (1994). MEC increased with an increase in particle size but effect of small particles
(<100µm) was negligible on MEC. No combustion occurred when a particle size was 200-300
µm existed. The maximum pressure and rate of pressure rise decreased with an increase in
particle size. The maximum pressure during explosion was almost 6.5 and 6 bar when particle

30
size of dust was 10 and 100 µm, respectively. Rate of pressure rise was 80 and 60 bar.m/s, at a
particle size of 10 and 100 µm, respectively (Cashdollar, 1994).
Particle size also affects the minimum ignition energy and minimum ignition
temperature. Minimum ignition energy required to ignite magnesium dust cloud was about 4 and
230 mJ when the particle size was about 0-20 and 149-177 µm. The minimum ignition
temperature was about 520º C and 650º C when particle size was 0-20µm and 149-177µm
(Nifuku et al., 2007). Hence, the minimum ignition temperature and minimum ignition energy of
dust cloud increased with an increase in particle size. Therefore, dust explosibilty decreases with
an increase in particle size.
Calle et al., (2005) characterized wood dust explosibility by developing a model based on
chemical reaction, kinetics and thermodynamics. Severity of explosion was determined in terms
of the maximum explosion rise and the rate of pressure rise. Experiment was also performed to
compare the results. Wood dust was divided into four fractions according to size as 25-45, 45-71,
71-90 and 90-125 µm. Rate of pressure rise was 300 and 120 bar/sec when particle size were 25-
45 and 90-125 µm respectively. Maximum pressure (about 7 bar) was almost same for four
particle size fractions. The results obtained by model were close to experimental results.
Moisture Content
Moisture is generally present in combustible dusts depending on the hygroscopic nature
of dusts, humidity in the atmosphere and internal moisture as in the case of biomass dust and has
a strong influence on dust explosion characteristics (Khan et al., 2008 and Echkoff, 2003). Since,
severity of dust explosion depends upon the maximum explosion pressure and the rate of pressure
rise during the explosion. Echkoff (2003) explained the effect of moisture content in maize starch
on rate of pressure rise. He concluded that the increase in moisture decreases the rate of rise in
pressure during the explosion. Rate of pressure changed from 20 to 100 bars/s when moisture
decreased from 25% to almost 0% (Eckhoff, 2003). Laar and Zeeuwen (1985) reported that the
31
minimum ignition temperature of maize starch increased with an increase in the moisture content.
The minimum ignition temperatures at 13% and 0% moisture content were found to be 400 ºC
and 460 ºC, respectively (Laar and Zeeuwen, 1985). The author also found that the minimum
energy required to ignite the dust cloud of tapioca, maize starch and flour (wheat) increased with
an increase in moisture content. The approximate MIE of tapioca changed from 20 to 200 mJ
with an increase in the moisture from 1% to 7% (w.b.). MIE of flour varied approximately from
40 to 80 mJ with a change in moisture from 1% to 7% (w.b.). MIE of maize changed from 200 to
400 mJ when the moisture changed from 1% to 7% (Laar and Zeeuwen, 1985).
Dust Concentration
Dust concentration also affects dust explosion characteristics such as minimum ignition
energy, minimum ignition temperature, explosion pressure and rise of pressure (Cashdollar,
2000). The effect of dust concentration of bituminous coal on maximum pressure and rate of
pressure rise during explosion was studied by Cashdollar (1994). Maximum pressure (2 to 6.5
bar) and rate of pressure (10 to 30 bar.m/sec) increased with an increase in concentration (200 to
400 g/m3) of dust up to a dust concentration of about 400 g/m
3 and after then become constant.
Chawla (1996) determined the amount of energy required for an explosion at different
level of dust concentration of Pittsburgh coal. Ignition energy decreased with an increase in
concentration of dust. When the concentration of dust was 50g/m3, about 5 kJ energy was
required for explosion and 10 kJ ignition energy required when dust concentration was about 30
g/m3 (Chawla et al., 1996).
Nifuku et al. (2007) studied the effect of dust concentration and particle size of
magnesium dust on its ignition temperature. It was observed that ignition temperature decreases
with an increase in dust concentration. The lowest ignition temperature was 520ºC when the dust
concentration was about 100 g/m3 (Nifuku et al., 2007).

32
Chemical Properties of Dust
As already discussed, ash does not participate in ignition and explosion but it suppresses
explosion of dust by absorbing heat released during explosion. High ash content material is used
in combustible dusts to reduce the explosion risk (Abbasi and abbasi, 2007). Datidar and Amyotte
(2002) studied the effect of fly ash (ash content is 90% on d.b.) on the explosibilty of Pittsburgh
pulverized coal (ash content is 6% on db). Explosion pressure reduced from 200 kPa to 100 kPa
when concentration of fly ash increased from 75% to 80% and 200 kPa was the pressure limit to
occur an explosion. Hence, a high percentage of fly ashes required to reduce the dust
explosibility.
Volatile content in combustible dusts acts as fuel for explosion and also contributes to
flame propagation. Effect of volatile content of coal dust on minimum explosion concentration
was studied at three ignition energies (10, 5 and 2.5 kJ). MEC of dusts (<75 µm) of gilstonite coal
(volatile content is 83%), Pittsburgh (volatile content is 34%), Oil shale (volatile content is 28%)
and Pocahontas coals (volatile content is16%) was determined. MEC of glistonite coal dust could
was low (20 g/m3) compared to other three coal types when 5 kJ energy was used for ignition and
because of its high volatile content of glistonite coal. Pittsburgh and Pocathontas coal have MEC
of 50g/m3 at 5kJ ignition energy although their volatile contents were different. They observed
that when particle size of Pocathontas coal was small (<100 µm), they produce same amount of
volatile content as Pittsburgh coal. Oil shale has higher minimum explosion concentration (160
g/m3) compared to Pocathontas coal (30 g/m
3) at 5kJ ignition energy. High ash content in oil
shale dust (ash content of Pocahontas coal, Oil Shale is 5 wt%, 70 wt%, respectively) act as heat
absorber and hence required more explosion concentration to occur a dust explosion. Dust
explosion risk is decreased if volatile content of dust is reduced. This principle is used to mitigate
the dust explosion risk by adding material of high ash content.

33
Summary
Problems related to fossil fuels (coal, petroleum and natural gas) initiated a pursuit to
look for alternative fuels. Renewable energy sources (biomass, solar energy, geothermal and wind
energy) are abundant on the earth and can be transformed into energy by different methods and
technologies. Biomass is one of important renewable energy resource which can be converted
into heat, syn-gas, bio-oil, char, and ethanol by different techniques. A large amount of biomass is
available in southern forests of United States in the form of loblolly pine tree to feed bioenergy
industry. Dust can be generated during the harvesting, handling and processing of loblolly pine
tree. High level of microorganisms, enzymes and endotoxins are observed in the biomass dust.
Hence, working with the dust can cause the health problems such as eye irritation, respiratory
problems, pulmonary diseases and allergies. Ignition and explosion risks are also associated with
the bioenergy industries because of the combustible nature of dust from biomass. Physical
properties of dusts such as particle size, moisture content affect ignition as well as explosion
properties. High ignition and explosion risk is associated with the combustible dusts of small
particle size and low moisture content. Chemical properties (ash content and volatile matter) of
dust also influence their ignition and explosion behavior. Volatile matter content is very
important property because it acts as a fuel for ignition. Ash content acts as a heat absorber and
suppresses the ignitability and explosibilty of dusts. Hence, it is important to understand the
physicochemical and ignition properties of loblolly pine dust to avoid ignition and explosions
accidents in the bioenergy industry centered on it.

34
Chapter 3 Physicochemical Properties of Ground Material and Dust
3.1 Abstract
Biomass conversion into energy is important to reduce the world’s dependence on non-
renewable energy resource because biomass is the only renewable resource of carbon that can be
used to manufacture carbon-based liquid fuels, chemicals and products that are currently obtained
from petroleum. Different types of equipment equipment such as grinders, mixers, dryers and
conveyors during processing and handling of biomass. These equipment generate dusts when
used on solid materials such as biomass. Dusts deposited around machinery and in processing
plants can cause heating and ignition that can lead to explosion. Therefore, a study was conducted
to quantify the effect of loblolly pine wood chip’s moisture content and hammer mill screen size
on the energy consumption and amount of dust generated during grinding. Physiochemical
properties of the ground material and dust were also determined. Wood chips were conditioned to
three different moisture contents (4.75%, 14.74% and 23.56% on w.b.) and ground through three
different hammer mill screens (1.20, 3.18 and 6.35 mm). Grinding energy increased from 39.65 to
360.00 kJ/kg when the moisture content and screen size changed from 4.75% and 6.35 mm to
23.56% and 1.20 mm, respectively. The amount of dust generated decreased with increase in
moisture content and screen size. About 21.50% of the dust was observed in ground material with
wood chips at a moisture content of 4.75% was ground through the 1.20 mm hammer mill screen.
From this study, moisture content and screen size were found to have a significant influence on
physicochemical properties of ground material as well as dust obtained from loblolly pine.

35
3.2 Introduction
The world relies heavily upon fossil fuels such as petroleum products, coal and natural
gas for its energy needs; Fossil fuel is however limited and may not be sufficient to meet the
increasing energy requirement of the world in the near future. By the end of 2035, the world
population is projected to increase to 8.1 billion which would require 700 quadrillion Btu of
energy (EIA, 2013). In addition, fossil fuels produce greenhouse gases such as carbon dioxide,
methane, water vapor, ozone, fluorocarbons and nitrous-oxide which are responsible for the rise
in atmospheric temperature and various climatic changes (McKendry, 2002).
Renewable energy resources such as hydropower, wind, solar, geothermal, and bioenergy
have the potential to reduce our reliance on fossil fuels and greenhouse gas emission. Bioenergy
is the only renewable that can supply the carbon required to manufacture transportational fuels,
chemicals and products. Bioenergy is obtained from plants and animal biomass which includes
but is not limited to dedicated energy crops, agricultural crops and trees, food, feed and fiber
residues, aquatic plants, forestry and wood residues, industrial and municipal waste, processing
byproducts and non-fossil organic material (ASABE S593.1, 2011).
Most countries are increasing investment in the bio-based economy for energy security
and environmental safety reasons. For example, United States has a target to produce 16 billion
gallons of ethanol from cellulosic biomass by 2022. This is projected to reduce crude oil
consumption by 20% (EISA, 2007). Currently, there are about 51 million acres of forestland is
occupied by loblolly pine tree (Murphy et al., 2012). Therefore, a large amount of the required
biomass in the United States will be obtained from loblolly pine tree. According to Williams and
Greshman, (2006), 15.2 Mg/ha of total biomass can be produced from loblolly pine tree by
intensive management. Therefore, a large amount (353.82 million tons per year) of the required
biomass in the United States will be obtained from loblolly pine tree.

36
After harvesting, biomass have to be stored, processed and transported before they can be
converted into energy, products and chemical (Mani et al., 2004). These unit operations will
require the use of various equipment such as hammer mills, mechanical conveyors (screw augers,
belt conveyor), cyclones, dryers, screening and classifying equipment. However, these types of
equipment generate dust when they are used to handle and process bulk solid materials such as
biomass (Abbasi and Abbasi, 2007; Eckhoff, 2003).
Biomass dust is combustible in nature. The National Fire Protection Association (NFPA)
defines combustible dusts as any fine particles of diameter less than 420 µm (material can pass
through the U.S. number 40 standard sieve) that present fire or explosion hazard when dispersed
and ignited in air (NFPA, 2011). Combustible dusts are responsible for fires and explosions in the
industries that handle or process the bulk material. The Chemical Safety and Hazard Investigation
Board documented 281 fire and explosion accidents, caused by combustible dusts, in the United
States between 1980 and 2005 in which 119 people lost their lives and 718 were injured (CSB,
2004).
Ignited dust is one of the main causes of fires and explosions in industries. Ignition
requires the presence of fuel (dust), ignition source and oxygen (Abbasi and Abbasi, 2007). Hot
surfaces, mechanical sparks, glowing cigarettes etc. can act as potential ignition sources. ignition
caused by hot surfaces (hot plates, bulbs, dryers, bearing, heated parts of equipments) is very
common in processing plants because dust that settle on the hot surfaces act as insulation that
inhibits heat loss and as a result the temperature of dust increases to the point of ignition
(Echkoff, 2003). Synnott et al. (1984) reported that the minimum ignition temperatures of flour of
a depth of 5, 20 and 40 mm layers were 311°C, 265°C and 238°C, respectively. They found that
the ignition temperature decreased with increase in depth of dust layer. Additionally, Joshi et al.
(2010) determined the ignition temperature of bituminous coal dust settled between two hot
surfaces forming wedges of 60º and 90º. They found that in a case of 90º wedge, ignition started
at 195º C which was 5ºC higher than 60º wedge.

37
An explosion can occur when all the five components (oxygen, dust, ignition source,
dispersion of dust into air (mixing) and confinement) of the explosion pentagon are present and
concentration of dust is high enough (Figure 3.1). Ignited dust can form a dust cloud when it is
dispersed by mechanical action or blown by movement of air. Furthermore, ignited dust itself acts
as ignition source for other dusts and can result in explosion (Eckhoff, 2003; Janes et al., 2008).
Figure 3.1. Dust explosion pentagon and its components (fuel, mixing, ignition source,
oxidant, and confinement) (Abbasi and Abbasi, 2007).
Various researchers have indicated that ignition and explosion properties of dusts depend
upon their physicochemical properties. Particle size of dust is one of the most important
properties that affect ignition and explosion properties of dust because the total surface area
exposed to oxygen increases as particle size decreases (Echkoff, 2003; Abbasi and Abbasi, 2007).
Small particles burn at low temperature and require less energy for ignition (Eckhoff, 2003).
Nifuku et al. (2007) found that the minimum energy (MIE) required for the ignition of
magnesium dust cloud was 40 and 120 mJ when the particle size was 0-20 and 149-177 µm,
respectively. They also reported that the minimum ignition temperature (MIT) for magnesium
dust was about 520ºC and 650ºC when particle size was 0-20 and 149-177 µm, respectively.
Dust with high moisture content ignites at high temperature and requires more energy to
ignite because moisture in dusts acts as a heat sink with energy is wasted in vaporization of
moisture. Laar and Zeeuwen, (1985) found that the minimum ignition temperature of maize

38
starch with 13% moisture and dry starch (almost 0%) were 460ºC and 400ºC, respectively.
Similarly, the minimum energy required for ignition of maize starch increased from 200 mJ to
400 mJ when the moisture increased from 1% to 7%.
Since ash is incombustible in nature, it acts as an explosion inhibitor by absorbing the heat
released during the explosion. Chawla et al. (1996) reported that dust concentration of 30 kg/m3
and 80 kg/m3 was required for ignition of oil shale and Pocahontas coal, respectively, the samples
were exposed to the same amount of energy (5 kJ) was used. They attributed the differences in
dust concentration to cause an explosion, to the high ash content of oil shale (70% d.b.) compared
to Pocahontas coal (5% d.b.). In addition, volatile content in dusts is another important factor that
affects the dust ignition. For example, ignition temperature of coal and biomass decreased with an
increase in volatile content (Grotkjær et al., 2003). The ignition temperature of wheat straw
(volatile content: 72% d.b.), popular wood (volatile content: 75% d.b.), lignite (volatile content:
51% d.b.), bituminous (volatile content: 32% d.b). and anthracite (volatile content: 9.8% d.b.)
were 210, 290, 300, 450 and 490 ºC , respectively (Grotkjær et al., 2003).
Physicochemical properties are important to understand the ignition and explosion behavior
of combustible dusts. However, limited information exists on the physicochemical properties of
combustible dusts, and information in literature does not exist on loblolly pine dust in particular,
considering its importance as a biomass resource in the United States. Therefore, the objectives of
this study were to:
1) Determine the effect of hammer mill screen size (1.20 mm, 3.18 mm and 6.35 mm) and
moisture content (5%, 15% and 25% on w.b.) on the amount of dust generated and energy
required to grind loblolly pine chips.
2) Quantify the physicochemical properties of ground loblolly pine chips and dust collected from
objective 1.

39
3.3 Materials and Methods
3.3.1 Wood Chips
Clean loblolly pine wood chips obtained from a forestland in south Alabama were used
for this study. Moisture content of wood chips was determined according to ASTM standard
E871-72 (ASTM E871-82, 2006) by placing 10 g sample in a conventional oven (Model No.-
1370FM, Sheldon Manufacturing, Cornelius, OR) set at 105 ºC for 24 hours. Initial moisture
content of the chips (based on triplicates) was determined to be 53.2% on wet basis (w.b.).
3.3.2 Conditioning of Wood Chips
Wood chips were conditioned to a desired moisture levels (5%, 15% and 25% on w.b.) by
drying in an oven (Excalibur Products, Sacramento, CA) at 45 ºC and monitoring the mass of
wood chips during the drying process. After drying, wood chips were kept in a closed container
for 72 hours to allow moisture equilibration of the sample. The actual moisture contents of wood
chips were determined after the 72 h equilibration period.
3.3.3 Grinding of Wood Chips
Wood chips were ground with a hammer mill (Model No.-10HBLPK, Sheldon
Manufacturing, Tiffin, OH) using three different screen sizes (1.20, 3.18 and 6.35 mm). A known
amount of wood chips was fed into the hammer mill manually. Energy required (kJ/kg) to grind
the material was recorded with a watt meter (Model No.-A3314/01, EZ watt meter, Santa Ynez,
CA) that was attached to hammer mill. The duration of grinding was also recorded. The energy
required to run the hammer mill empty was also recorded before the material was introduced.
Amount of dust in the ground material was obtained by passing the ground material through the
420 µm screen of a vibratory shaker (Model No.-K30-2-8S, Kason, Millburn, NJ) and weighing
the mass of ground material that did not pass through the 420 µm screen. The amount of dust
generated from wood chips ground through each screen was estimated as follows (equation 3.1).

40
Quantity of dust =
(3.1)
where
Mg1= Mass of ground material (kg)
Mg2= Mass of ground material that did not pass through the 420 µm screen (kg)
3.3.4 Moisture Content
Moisture content (MC) of dust and ground material was measured using a moisture
content analyzer (Model No.-IR-200, Denver Instrument, Avrada, CO) according to ASTM
standard E871-82 (ASTM E871-82, 2006) by placing 2 to 10 g of sample on the pan of the
moisture content analyzer. This instrument provided moisture content on a wet basis.
3.3.5 Bulk Density
Bulk density ( ) was measured by the Ohaus apparatus (Burrows Co., Evanston, IL)
and according to the modified ASABE standard (ASABE S269.4, 2002). This measurement
involved pouring the sample from a funnel into 1137 ml container. Bulk density was calculated
from the ratio of mass of the material that filled in the container to the volume of the cylinder
(equation 3.2).
(3.2)
3.3.6 Particle Density
The average volume of particles was estimated by a pycnometer (Model No.-AccuPyc
1330, Micromeritics Instrument Corp., Norcross, GA). by measuring the change in pressure when
a known quantity of helium gas was passed through the pycnometer. Particle density ( ) was

41
estimated from the ratio of the mass of material and volume measured by pycnometer (equation
3.3).
(3.3)
3.3.7 Particle Size Distribution
Particle size distributions on volume basis of ground material and dust sample were
determined with a digital image processing and size analysis system (Model No.- D-4278, Haan,
Germany). Geometric mean diameter and geometric standard deviation were calculated from the
data obtained from the equipment according to ASABE Standard S319.3 (2003).
[
∑ ( )
∑
] (3.4)
[∑ ( )
∑
]
(3.5)
[
( )
] (3.6)
where
dgw is geometric mean diameter or median size of particles by mass (mm);
Slog is geometric standard deviation of log normal distribution by mass in 10-based logarithm
(dimensionless);
Sgw is geometric standard deviation of particle diameter by mass (mm);
Wi is mass on ith sieve (g);
n is number of sieves plus one pan;
=(di×di+1)1/2
;
di is nominal sieve aperture size of the ith sieve (mm);
di+1 is nominal sieve aperture size of the ith+1 sieve (mm).
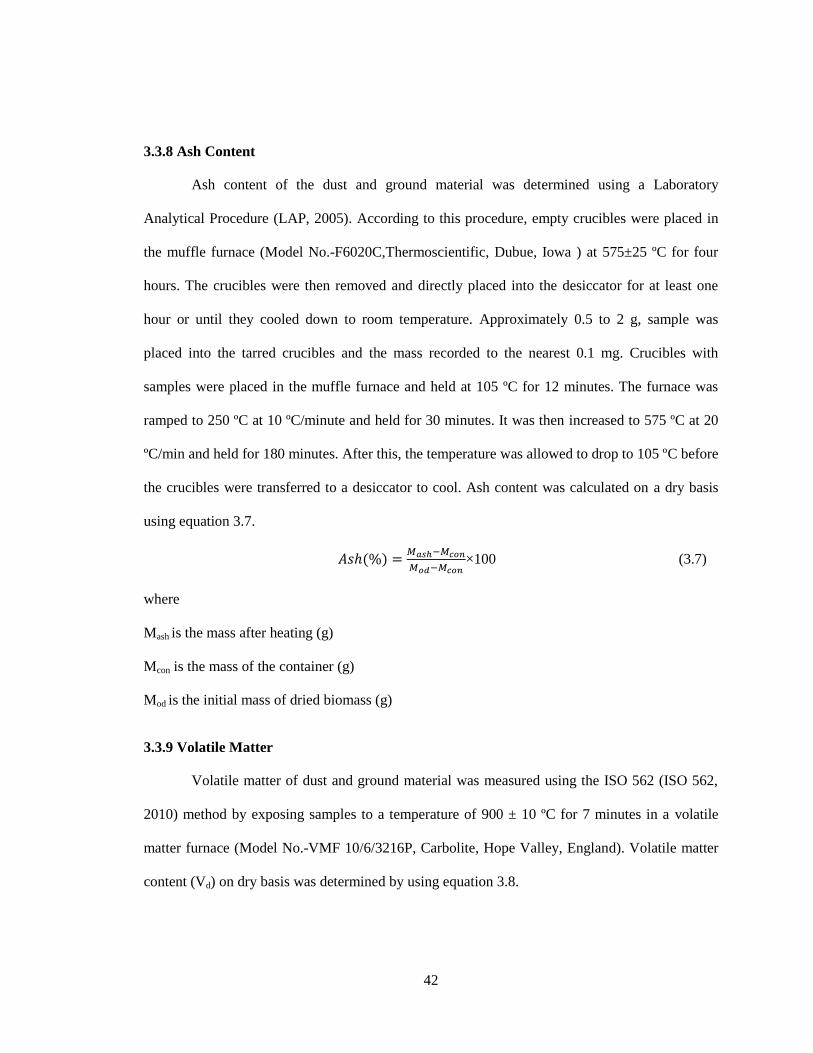
42
3.3.8 Ash Content
Ash content of the dust and ground material was determined using a Laboratory
Analytical Procedure (LAP, 2005). According to this procedure, empty crucibles were placed in
the muffle furnace (Model No.-F6020C,Thermoscientific, Dubue, Iowa ) at 575±25 ºC for four
hours. The crucibles were then removed and directly placed into the desiccator for at least one
hour or until they cooled down to room temperature. Approximately 0.5 to 2 g, sample was
placed into the tarred crucibles and the mass recorded to the nearest 0.1 mg. Crucibles with
samples were placed in the muffle furnace and held at 105 ºC for 12 minutes. The furnace was
ramped to 250 ºC at 10 ºC/minute and held for 30 minutes. It was then increased to 575 ºC at 20
ºC/min and held for 180 minutes. After this, the temperature was allowed to drop to 105 ºC before
the crucibles were transferred to a desiccator to cool. Ash content was calculated on a dry basis
using equation 3.7.
( )
×100 (3.7)
where
Mash is the mass after heating (g)
Mcon is the mass of the container (g)
Mod is the initial mass of dried biomass (g)
3.3.9 Volatile Matter
Volatile matter of dust and ground material was measured using the ISO 562 (ISO 562,
2010) method by exposing samples to a temperature of 900 ± 10 ºC for 7 minutes in a volatile
matter furnace (Model No.-VMF 10/6/3216P, Carbolite, Hope Valley, England). Volatile matter
content (Vd) on dry basis was determined by using equation 3.8.

43
Vd [ ( )
] (
) (3.8)
where
M1 is the mass, of the empty crucibles and lid (g)
M2 is the mass, in grams, of the crucible and lid and the sample (g)
M3 is the mass, in grams, of the crucibles after heating (g);
Mad is the moisture content on wet basis (% w.b.)
3.3.10 Energy Content
Energy content of dust and ground material was estimated using a bomb calorimeter
(Model No.-C200, IKA Works Inc. Wilmington, NC). Approximately 0.5 g sample was
compressed with a press to form a pellet (Model No-C21, IKA Works Inc. Wilmington, NC).
Final mass of the pellet was measured and placed in a steel container (decomposition vessel). The
steel container was pressurized to 30 bars and sample was ignited with cotton thread connected to
an ignition wire in a decomposition vessel. After the complete combustion of the sample, the
energy content of sample was displayed by the calorimeter.
3.3.11 Data Analysis
Microsoft Excel (Microsoft Excel, Redmond, WA) was used for regression analysis and
to plot graphs. The Analysis of Variance (ANOVA) procedures in the Statistical Analysis System
(SAS, 2009) were used to determine the significant effect (95% of significance level) of moisture
content and hammer mill screen size on dust generation, energy required for grinding and
physicochemical properties of ground material and dust. The Tukey test was also performed to
compare means of properties at different moisture contents and hammer mill screens. Each
experiment was carried out in duplicates or triplicates.

44
3.4 Results and Discussion
3.4.1 Dust Generation during Grinding
In general, dust generation was significantly reduced (p<0.05) with increase in moisture
content of wood chips and hammer mill screen size (Figure 3.2). Approximately 21.50% of wood
chips were converted into dust when the chips at MC of 4.7% were ground through a 1.20 mm
screen. Since material remain in the grinding chamber until the impact of hammers reduced its
size to pass through the screen, the number of times particles were struck by hammers increased
with decrease in screen size. Therefore, more dust particles were generated when wood chips
passed through the 1.20 mm screen. A similar result was reported by Kaliyan et al. (2009) who
noticed an increase in dust generation with decrease in screen size when corn stover was ground
with a hammer mill. Decrease in amount of dust generated with increase in moisture content was
attributed to the lubricating action of moisture, which reduced the friction between wood particles
as well as with the hammer mill surface. However, wood chips of high moisture content require
more grinding time, resulting in more fine (dust) particles. Therefore, more dust particles were
generated at a MC of 23.6% compared to a MC of 14.7% but the difference was not significant
(p>0.05).
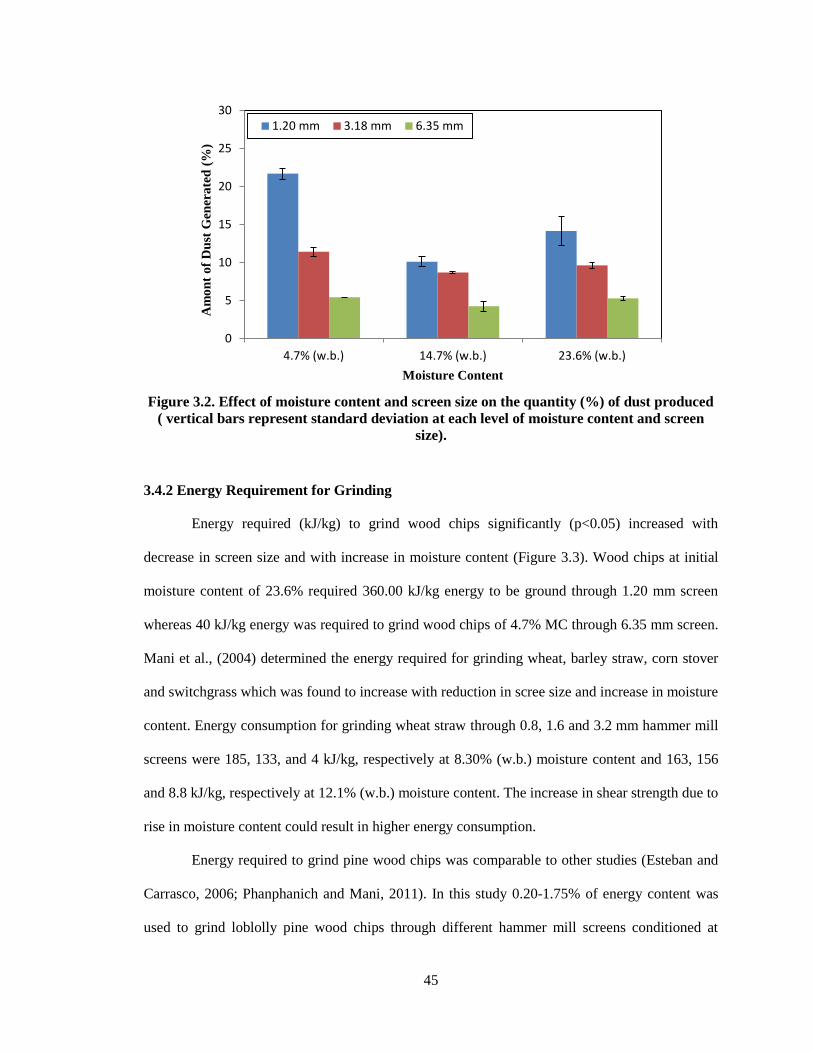
45
Figure 3.2. Effect of moisture content and screen size on the quantity (%) of dust produced
( vertical bars represent standard deviation at each level of moisture content and screen
size).
3.4.2 Energy Requirement for Grinding
Energy required (kJ/kg) to grind wood chips significantly (p<0.05) increased with
decrease in screen size and with increase in moisture content (Figure 3.3). Wood chips at initial
moisture content of 23.6% required 360.00 kJ/kg energy to be ground through 1.20 mm screen
whereas 40 kJ/kg energy was required to grind wood chips of 4.7% MC through 6.35 mm screen.
Mani et al., (2004) determined the energy required for grinding wheat, barley straw, corn stover
and switchgrass which was found to increase with reduction in scree size and increase in moisture
content. Energy consumption for grinding wheat straw through 0.8, 1.6 and 3.2 mm hammer mill
screens were 185, 133, and 4 kJ/kg, respectively at 8.30% (w.b.) moisture content and 163, 156
and 8.8 kJ/kg, respectively at 12.1% (w.b.) moisture content. The increase in shear strength due to
rise in moisture content could result in higher energy consumption.
Energy required to grind pine wood chips was comparable to other studies (Esteban and
Carrasco, 2006; Phanphanich and Mani, 2011). In this study 0.20-1.75% of energy content was
used to grind loblolly pine wood chips through different hammer mill screens conditioned at
0
5
10
15
20
25
30
4.7% (w.b.) 14.7% (w.b.) 23.6% (w.b.)
Am
on
t o
f D
ust
Gen
era
ted
(%
)
Moisture Content
1.20 mm 3.18 mm 6.35 mm

46
different moisture contents. Phanphanich and Mani, (2011) were reported that 1.2% of pine wood
chip’s calorific values was consumed during grinding of pine chips.
Figure 3.3. Effect of moisture content and screen size on the energy required (kJ/kg) for
grinding.
3.4.3 Moisture Content
Ground material and dust had different moisture contents compared to that of wood
chips. Moisture was lost during grinding from chips originally at 14.7% and 23.6% MC and this
loss in moisture content increased with decrease in screen size. Reduction of moisture was due to
the frictional heat produced during grinding. Scholtz et al. (2010) also observed a decrease in
moisture content of hay (Medicago Sativa L.) from 11.5 % (w.b.) to 8.5% (w.b.) during grinding.
However, moisture content of ground material and dust obtained at 4.7% MC was higher than
that of the wood chips because of moisture absorption from atmosphere.
Since the moisture content of ground material and dust was different from the original
moisture content of wood chips, the following designations are used in the rest of this chapter:
low moisture content (LMC), medium moisture content (MMC) and high moisture content
(HMC) were used to represent ground material and dust obtained from wood chips conditioned to
4.7%, 14.7% and 23.6% MC, respectively. Moisture contents of ground material and dust at
different moisture levels are shown in Figure 3.4.
0
2
4
6
8
10
0
50
100
150
200
250
300
350
400
1.20
mm
3.18
mm
6.75
mm
1.20
mm
3.18
mm
6.75
mm
1.20
mm
3.18
mm
6.75
mm
4.75% (w.b.) 14.74% (w.b.) 23.56% (w.b.)
Per
cen
tag
e o
f E
ner
gy
Co
nte
nt
En
erg
y R
equ
ired
(k
J/k
g) Energy required (kJ/kg)
Percentage of energy content

47
Figure 3.4. Moisture content (% w.b.) of ground material and dust at different wood chips
moisture content levels and hammer mill screen sizes (vertical bars represents standard
deviation at each level of moisture content and screen size).
3.4.4 Particle Size Distribution
Particle size distribution (Figure 3.5) and geometric mean particle size (Figure 3.6) of
ground material changed with change in moisture contents of wood chips and the hammer mill
screens. As expected, average particle size of ground material increased with an increase in
screen size Bimodal particle size distributions were also observed partly because of presence of
fine (dust) particles. Similar trend was observed by Mani et al. (2004) during grinding of wheat,
barley straw, corn stover and switchgrass. Coefficient of correlation between geometric particle
size and moisture content of ground material was found to be 0.68 implying particle size of
ground material increased with increase in moisture content. Similarly, Shaw et al. (2009) also
found increase in average particle size of ground poplar wood chips and wheat straw with
increase in moisture content.
Average size of dust was in the range of 0.25 mm to 0.40 mm. Particle size distribution of
dust was almost similar at different moisture contents of wood chips and hammer mill screen
0
5
10
15
20
25
Dust Ground Dust Ground Dust Ground
LMC MMC HMC
Mo
istu
re C
on
ten
t (%
wb
)
1.2 mm 3.18 mm 6.35 mm

48
sizes (Figure 3.7). However, the distribution was narrow compared to the bimodal distribution of
ground material (Figure 3.8).
Figure 3.5. Particle size distribution of ground material as affected by moisture contents of
wood chips and hammer mill screen size.
Figure 3.6. Geometric particle size of dust and ground material at different wood chips’
moisture levels and hammer mill screens.
0
2
4
6
8
10
12
14
0 1 2 3 4 5 6
Vo
lum
e R
eta
ined
(%
)
Screen Size (mm)
4.7%,1.20 mm
4.7%,3.18 mm
4.7%,6.37mm
14.7%,1.20mm
14.7%,3.18mm
14.7%,6.37mm
23.6%,1.20mm
23.6%,3.18mm
23.6%,6.37mm
0.0
0.5
1.0
1.5
2.0
2.5
3.0
Dust Ground Dust Ground Dust Ground
LMC MMC HMC
Geo
met
ric
Mea
n P
art
icle
Siz
e (m
m)
1.20 mm 3.18 mm 6.35 mm

49
Figure 3.7. Particle size distribution of dust as affected by moisture contents of wood chips
and hammer mill screen size.
Figure 3.8. Particle size distribution of ground material and dust when wood chips at mc of
14.74% was ground through 1.20 mm hammer mill screen size.
3.4.5 Bulk Density
The bulk density of ground material significantly changed (p<0.05) with change in wood
chip moisture content and hammer mill screen size (Figure 3.9). Bulk density of ground material
and dust ranged from 206.15 to 273.36 kg/m3 and 163.54 to 215.96 kg/m
3, respectively. Since,
0
2
4
6
8
10
12
14
0 1 2 3 4 5 6
Vo
lum
e R
eta
ined
(%
)
Screen Size (mm)
4.7%,1.20 mm
4.7%, 3.18 mm
4.7%, 6.35 mm
14.7%, 1.20 mm
14.7%, 3.18 mm
14.7%, 6.35 mm
23.6%, 1.20 mm
23.6%, 3.18 mm
23.6%, 6.35 mm
0
2
4
6
8
10
12
14
0 1 2 3 4 5 6
Vo
lum
e R
eta
ined
(%
)
Screen Size (mm)
Ground Material
Dust

50
the particle size of ground material was larger when larger screens used, the increasing inter-
particle voids resulted in decreased bulk density. Similar results were obtained by Mani et al.
(2004), showed that bulk density of wheat straw ground at 3.1, 1.6 and 0.8 mm was 97, 107 and
121 kg/m3, respectively. Bulk density of ground material increased when moisture content
changed from LMC to MMC and then decreased when moisture content changed from MMC to
HMC Increase in moisture content causes increase in mass and increase in volume of material
(Fasina, 2008; Mani et al., 2004). This means that when moisture content changed from LMC to
MMC, increase in mass was more compared to increase in volume and when moisture content
changed from MMC to HMC increase in volume was more compare to increase in mass.
Bulk density of dust also changed with moisture level in a similar way as the ground
material. Bulk density of dust was significantly less (p<0.05) compared to ground material
(Figure 3.9) (Fasina, 2008). The overall effect of screen size on bulk density of dust was
negligible (p=0.02), but at HMC bulk density changed significantly with screen size. This change
could be attributed to high variation in moisture content of dust with respect to screen size at
HMC (9.37% MC at 1.20 mm to 14.57% MC at 6.35 mm) compared to LMC (MC variation was
not significant) and MMC (9.96 % MC at 1.20 mm to 12.44% MC at 6.35 mm).

51
Figure 3.9. Bulk density (kg/m3) of ground material and dust as affected by moisture
content and hammer mill screen size (vertical bars represent the standard deviation at
different moisture content and screen size).
3.4.6 Particle density
Particle density of ground material significantly changed (p<0.05) by the moisture
content of wood chips and effect of hammer mill screen size was not significant (p=0.04). Particle
density of ground material first decreased when moisture content increased from LMC to MMC
and then increased when moisture content increased to HMC (Figure 3.10). Particle density of
ground material and dust ranged from 1404.55 to 1469.55 kg/m3 and 1514.40 to 1426.45 kg/m
3.
Initial decrease in particle density could be because of higher expansion in particle volume
compared to increase in mass due to adding of moisture and the following increase could be
attributed to higher mass change compared to volume expansion. In addition, particle density
increased with decrease in screen size of hammer mill since intra particle voids decreased when
material divided into small particles (Figure 3.10). Mani et al., (2004) observed the decrease in
particle density of four types (wheat, barley straw, corn strove and switchgrass) of ground
biomass with respect to screen sizes of hammer mill. Particle density of wheat straw at 3.2, 1.6
and 0.8 mm screen of hammer mill was found to be 1030, 1260 and 1340 Kg/m3, respectively.
0
50
100
150
200
250
300
350
Dust Ground Dust Ground Dust Ground
LMC MMC HMC
Bu
lk D
ensi
ty (
kg
m-3
)
Moisture Content level
1.20 mm 3.18 mm 6.35 mm

52
Particle density of dust was more compared to ground material but difference was not
significant. Particle density of dust followed the same trend as ground material with respect to
moisture content (p<0.05) but effect of screen size was not significant (p=0.27) (Figure 3.10).
Figure 3.10. Particle density (kg/m3) of ground material and dust as affected by moisture
content and hammer mill screen sizes (vertical bars represent standard deviation at
different moisture content levels and screen sizes).
3.4.7 Ash Content
Ash content of the ground material was not significantly influenced by moisture content
(p=0.451) and effect of screen size was marginally significant (p=0.0437) (Figure 3.11). Ash
content of dust was significantly more compared to ground wood chips (p<0.05) and it increased
with wood chip moisture content (p<0.05) and hammer mill screen size (p<0.05). Ash content is
the measure of internal or external inorganic impurities in biomass. According to Bridgeman et al.
(2007), inorganic particles are separated from lignocellulosic structure of biomass (reed canary
grass and switchgrass) during grinding. These inorganic particles are more grindable and have
smaller particle size compared to organic material. Therefore, more of the inorganic particles end
up in the dust fraction. At high moisture content, wood chips took a long time to grind and more
0
200
400
600
800
1000
1200
1400
1600
1800
2000
Dust Ground Dust Ground Dust Ground
LMC MMC HMC
Pa
rtic
le D
ensi
ty (
kg
m-3
)
1.20 mm 3.18 mm 6.35 mm

53
inorganic particles were separated from organic particles. Therefore, dust collected at MMC and
HMC had high ash content.
Figure 3.11. Ash content (% d.b.) of ground material and dust as affected by moisture
content and hammer mill screens (vertical bars represent the standard deviation at each
level of moisture content and screen size).
3.4.8 Volatile Matter
The volatile matter of ground material and dust are shown in Figure 3.12. Moisture
content (p=0.237) and screen size (P=0.453) did not affect volatile matter of ground material. On
the other hand, volatile matter of dust decreased significantly with increase in the wood chips’
moisture content (p<0.05) and hammer mill screen size (p=0.05). In addition, dust had less
volatile matter compared to ground material (p<0.05). As shown in Figure 3.13, volatile matter of
dust is inversely related to its ash content. Similar results were reported by Gani and Naruse
(2007) in which inverse relation between ash content and volatile matter was observed. Ash
content and volatile matters of hinoki saw dust, rice straw and rice husks were found by authors
to be 1.3, 20.4, 20.3 (% w.b.) and 97.4, 79.6, 78.4 (% w.b.) respectively (Gani and Naruse, 2007).
0
1
2
3
4
5
6
7
Dust Ground Dust Ground Dust Ground
LMC MMC HMC
Ash
Co
nte
nt
(%
d.b
.)
1.2 mm 3.18 mm 6.35 mm

54
Figure 3.12. Volatile content (% d.b.) of ground material and dust as affected by moisture
content of wood chips and hammer mill screens (vertical bars represent the standard
deviation at different moisture content and screen size).
Figure 3.13. Relation between volatile content (% d.b.) and ash content (% d.b.) of dust.
3.4.9 Energy Content
Although statistical tests indicated significant effect of wood chips’ moisture content
(p=0.03) and hammer mill screen size (p=0.02) on energy content of ground material, no distinct
0
20
40
60
80
100
120
Dust Ground Dust Ground Dust Ground
LMC MMC HMC
Vo
lati
le C
on
ten
t (%
d.b
.)
1.20 mm 3.18 mm 6.35 mm
y = -1.146x + 82.892
R² = 0.8935
70
72
74
76
78
80
82
84
86
0 1 2 3 4 5 6 7
Vo
lati
le M
att
er C
on
ten
t (%
d.b
.)
Ash Content (% on d.b.)

55
trend was observed (Figure 3.14). Energy content of ground material was higher compared to dust
but difference was not significant (Figure 3.15). Energy content of dust decreased significantly
(p<0.0020) with increase in moisture content and effect of screen size (p=0.0528) was not
significant. Mani et al. (2004) and Ebling and Jenkins, (1985) also concluded that the energy
content of biomass depends on ash content and volatile matter.
Figure 3.14. Energy content (MJ/kg) of ground material and dust as affected by moisture
content and hammer mill screens (vertical bars represent standard deviation at different
moisture content and screens).
Figure 3.15. Relation between energy content (MJ/kg) and ash content (% d.b.) of dust.
0
5
10
15
20
25
Dust Ground Dust Ground Dust Ground
LMC MMC HMC
En
erg
y C
on
ten
t (M
J/k
g)
1.20 mm 3.18 mm 6.35 mm
y = -0.1802x + 20.906
R² = 0.7598
15
17
19
21
23
25
0 1 2 3 4 5 6 7
En
erg
y C
on
ten
t (M
J/k
g)
Ash Content (%d.b.)

56
3.5 Conclusion
The effect of hammer-mill screen and wood chip moisture content on energy
consumption for grinding, dust generation and physicochemical properties of ground loblolly pine
chips and dust was investigated. Energy required to grind wood chips was found to increase as
moisture content increased and hammer-mill screen size decreased. About 39.65 kJ/kg energy
was required to grind loblolly pine when wood chip moisture content was 23.56% and hammer
mill screen of 1.20 mm whereas 360.00 kJ/kg energy was required to grind wood chips
conditioned to 4.7% MC through a 6.35 mm screen. Dust generation decreased with increase in
moisture content and hammer-mill screen size. Some moisture was lost during grinding and
therefore, the moisture content of the ground material and dust was different from the moisture
content of wood chips before grinding. Bulk density and particle density of ground material and
dust also changed as moisture content and screen size varied. Influence of moisture content and
screen size on chemical properties of ground material was less significant compared to dust. Ash
content of dust was significantly (p<0.05) influenced by wood chip moisture content and
hammer-mill screens. Volatile and energy content of dust were inversely related to its ash
content.

57
Chapter 4 Physicochemical and Ignition Properties of Dust
4.1 Abstract
Particle size of dust is an important parameter that affects its physical, chemical and
ignition properties. To determine the effect of particle size on physiochemical and ignition
properties of loblolly pine dust, chips were ground through a hammer mill and dust separated by
passing ground material through a 420 µm screen on a vibratory shaker. The collected dust was
then divided into three fractions (fine (<90 µm), medium (90-180 µm), coarse (180-420 µm).
Physicochemical (moisture content, bulk and particle density, ash content, volatile matter and
energy content) and ignition properties (hot surface ignition temperature, volatilization properties
from TGA and exothermic parameters from DSC) of three fractions were determined.
Physiochemical and ignition properties of unfractionated pine dust were also compared with coal
dust. The results indicated that the fine fraction of dust had a high levels of bulk and particle
density compared to medium and coarse dust fractions but the difference was significant (p<0.05)
only for bulk density. The fine dust fraction had significantly high inorganic content (1.70% d.b.)
compared to medium and coarse fractions (1.27% and 0.76% on d.b., respectively). In contrast,
medium and coarse fractions had high volatile and energy content. Pine dust had high moisture
(8.16% on d.b.) and volatile content (82.36 % on d.b.) than coal dust. Contrarily, coal dust had
high bulk-particle density, ash content and energy content versus pine dust. Fine dust had low hot
surface ignition temperature than the medium and coarse dust. The effect of particle size on
volatilization properties (temperature of volatilization, temperature of maximum mass loss rate

58
and temperature of oxidation) was not significant (p<0.05). However, temperature of rapid
exothermic reaction (242ºC) of fine fraction was significantly lower than coarse and medium dust
(253ºC and 262ºC). Pine dust had low hot surface ignition temperature, temperature of
volatilization, temperature of rate of maximum mass loss and temperature of oxidation compared
to coal dust. On the other hand, rapid exothermic reaction in coal dust started at a low
temperature (235ºC) than pine dust (241ºC). According to hot surface ignition temperature and
temperature of rapid exothermic reaction, ignition risk increased with decrease in particle size.
The three pine dust fractions (fine, medium and coarse) and unfractionated pine dust had high risk
of ignition while coal dust had low risk of ignition.
4.2 Introduction
Knowledge of the conditions that can result in dust ignition is important because ignition
of bulk materials and dust is responsible for fires and explosions in industrial plants that process
or handle bulk materials. Three conditions that have to be present for ignition to occur are air,
fuel (dust) and an ignition source (Amyotte, 2006). Ignition sources that are typically present in
processing plants include hot-ignition surface, mechanical and electrical sparks, open flames
(welding and cutting flames) and ignited dusts (Abbasi and Abbasi, 2007).
Different types of experimental techniques have been used to measure the ignition
properties of combustible dusts. Miron and Lazzara (1988) determined the effect of particle size
on the hot plate ignition temperature of different dust samples (coal, three oil shales, lycopodium
spores, corn starch, grain and brass powder). They found that the ignition temperature of these
dusts (12 mm layer thickness) ranged from 160ºC to 290ºC and decreased with decrease in
particle size (Miron and Lazzara, 1988).
Thermogravimetric analysis (TGA) is often used by various researchers to measure the
ignitability of combustible dusts. TGA is a technique to measure the change in mass of the
sample under programmed heating during the thermal decomposition of a material into the

59
volatiles. The higher the temperature at which material starts to decompose into volatiles, the
lower is the ignition risk. Pilao et al. (2006) found maximum rate of mass loss of cork dust in the
range of 380º C to 450ºC. Liu et al. (2007) observed that the mass loss of coal dust started at 300º
C and about 83% of the mass was lost by the time the material was heated to 600 ºC.
Ramirez et al. (2010) measured the activation energy of different biological materials and
used the data to determine the ignition risk by plotting the activation energy against the oxidation
temperature. Activation energy of icing sugar, maize, wheat, barley, alfalfa, bread-making flour,
soya and lycopodium dust ranged from 61.7 to 67.7 kJ/mole and their oxidation temperatures
ranged from 239ºC to 332ºC. All of these dusts except lycopodium dust were at high risk of
ignition because their activation energies and oxidation temperatures were less than 90 kJ/mole
and 300ºC, respectively.
Differential scanning calorimeter (DSC) has been used by researchers to measure ignition
properties of combustible dusts by determining heat flow as a function of temperature during
heating (Lu et al., 2009; Ramirez et al., 2010). In addition, temperature at which endothermic or
exothermic reactions begin was obtained from the heat flow curves (Lu et al., 2009; Ramirez et
al., 2010). Lu et al. (2009) studied the ignition characteristics of dusts obtained from three types
of crystalline benzoyl peroxides. The heat released during the decomposition reaction of 98%,
75% and 50% crystalline benzoyl peroxides was equal to 1047.78, 957.04 and 771.16 J/g,
respectively. Furthermore, they found that endothermic reaction (103ºC) and exothermic reaction
(110°C) started at almost the same temperatures for three types of samples. Ramirez et al. (2010)
found that rapid exothermic reaction in icing sugar, maize, wheat, barley, alfalfa, bread-making
flour, soya and lycopodium dust starts at 4ºC, 242ºC, 252ºC, 257ºC, 240ºC, 271ºC, 245ºC and
213ºC, respectively.
Ignition properties of combustible dusts depend upon their physical properties. Particle
size is one of the most important physical properties that affect ignitability of dust particles.

60
Since, surface area of a material increases when it is ground into smaller particles and more
oxygen from the atmosphere is available to react with particles when the particle size is small. In
addition, small particles react with oxygen at a faster rate (Chamberlain and Hall, 1973; Ren et
al., 1999; Cashdollar, 2000; Eckhoff, 2003;). Similarly, Ren et al. (1999), reported an increase in
the rate of oxidation as particle size decreased up to a critical particle size that ranged from 138 to
387 µm for different types of coal (Ren et al., 1999). Sweis (1998) determined that the ignition
temperature of oil shale particles of size 75.3 and 212.3 µm was 640 ºC and 680 ºC, respectively
and increased with increase in particle size. Bowes and Townshend (1961) obtained the hot plate
ignition temperature of beech sawdust after fractionating into four sizes (853-422, 422-251, 251-
124 and <124 µm). The fine fraction (<124 µm) ignited at 335º C, the lowest temperature of
ignition compared to the other fractions. The ignition temperature of other fractions (853-422,
422-251, 251-124 µm) were 350ºC, 345ºC and 340ºC, respectively.
Chemical properties of dusts such as ash and volatile matter also influence the ignition
behavior of dust. For example, the volatile matter of dust acts as fuel for the ignition process.
Dust with high volatile content has low ignition temperature as compared to those with low
volatile content. For example, Grotkjær et al. (2003) found that the ignition temperature of wheat
straw (volatile content at 72% d.b.), lignite coal (volatile content at 51% d.b.), and anthracite coal
(volatile content at 32% d.b.) were about 210ºC, 300ºC and 490ºC, respectively. Additionally,
the author found that ash content in the combustible dust did not affect its ignition potential but
acts as a heat absorber (Grotkjær et al., 2003). High ash content materials such as fly ashes (ash
content of 90% on d.b.) are often mixed with combustible dusts to reduce their ignitibility
(Dastidar and Amyotte, 2002).
Physicochemical properties of biomass change when fractionated into different particle
size because of its chemical and structural heterogeneity. Miranda et al. (2012) determined the
ash content of barks of Norway spruce (Piceaabies (L.) Karst) and Scots pine (Pinussylvestris L.)

61
after fractionating into six sizes (<0.180, 0.180-0.250, 0.250-0.450, 0.450-0.850, 0.850-1.00 and
1.00-2.00 mm). They found that for both samples, fine fractions had high ash content compared
to coarse dust. Ash content of the fine fractions (<0.180 mm) of the bark for Norway spruce and
Scot pine were 5.3%, and 17.3% (d.b.), respectively with the ash content of the coarse fractions of
both samples was about 3.2% (d.b.). Similar results were obtained by Birdgemann et al. (2007)
for the ash content of ground reed canary grass (RCG) and switchgrass (SG) after fractionating
into two sizes (<90 µm and >90 µm).
Physicochemical properties are important to understanding of the ignition behavior of
dusts. These physiochemical properties change with particle size. However, limited research has
been conducted to find the relationship between physiochemical and ignition properties of
loblolly pine dust. Therefore, the objective of this study was to determine the effect of particle
size on the physicochemical and ignition properties of loblolly pine dust after fractionating dust
into three groups (<90, 90-180, 180-420 µm).
4.3 Materials and Methods
4.3.1 Sample Preparation and Physicochemical Properties Determination
Clean loblolly pine wood chips were obtained from south Alabama forests. The initial
mean moisture content of wood chips was 52.21% (w.b.). The wood chips were the air-dried to
10.03% (w.b.). The moisture contents of wood chips were determined according to ASTM
standard (E871-82) (ASTM, 2006). This process involved placing of 10 g of sample in a forced
convection oven set at a temperature of 105 ºC for 24 hours.
The dried wood chips were thereafter ground using hammer mill (Model No.-10HBLPK,
Sheldon Manufacturing, Tiffin, OH) fitted with a 1.20 mm screen and or a 3.17 mm screen. Dust
was separated by passing the ground material through the 420 µm screen on a vibratory shaker
(Model No.-K30-2-8S, Kason, Millburn, NJ). A sieve shaker (Model No.-RX-20, Ro-Top, OH)

62
was used to separate the dust samples into three fractions: (a) coarse fraction-particles retained on
a 180 µm screen, (b) medium fraction-particles which passed through a 180 µm screen but
retained on a 90 µm screen and (c) fine fraction-particles that passed through a 90 µm screen. A
similar procedure was used to obtain dust form pulverized lignite coal sample that was obtained
from Alabama Power electrical generating plant in Gorgas, AL.
The methodology used in determination of the physiochemical properties of the fractions
are same as those described in chapter 3 for moisture content, bulk density, particle density,
particle size and distribution, ash content, volatile matter content and energy content.
4.3.2 Particle Size Distribution
Particle size distribution on a volume basis for the dust samples was measured with a
digital image particle analysis system (Model No.-D-4278, Haan, Germany). Particle size
distribution of fine the dust (<90 µm) obtained by camsizer was wide compared to medium and
coarse dust. Particle sizee distribution of then obtained by using a sieve shaker (Model No.-RX-
20, Ro-Top, OH) and seven screens ranging in size from 0.045 to 1.25 mm plus a pan. Geometric
mean diameter and geometric standard deviation were obtained according to ASABE Standard
S319.3 (2003) and equations 4.1- 4.3.
[
∑ ( )
∑
] (4.1)
[∑ ( )
∑
]
(4.2)
[
( )
] (4.3)
where
dgw is the geometric mean diameter or median size of particles by mass (mm);

63
Slog is the geometric standard deviation of the log normal distribution by mass in 10-based
logarithm (dimensionless);
Sgw is the geometric standard deviation of particle diameter by mass (mm);
Wi mass on i th sieve (g);
n is number of sieves plus one pan;
=(di×di+1)1/2
;
di is nominal sieve aperture size of the ith sieve (mm);
di+1 is nominal sieve aperture size of the ith+1 sieve (mm).
4.3.3 Moisture Content
Moisture content of dust samples was measured with a moisture content analyzer (Model
No.-IR-200, Denver Instrument, Avrada, CO) by placing 10 g of sample in the pan of the
moisture content analyzer (ASTM E87182 standard, 2006). The analyzer was programmed to
perform this analysis at a temperature of 105 ˚C. Results were displayed on screen after the
completion of test and then documented in Microsoft Excel worksheet.
4.3.4 Bulk Density
Bulk Density (ρbulk) of dust samples were measured with the Ohaus apparatus (Model No-
BurrowsCo., Evanston, IL) according to ASABE Standard S269.4 (ASABE S269.4, 2002).
Samples were poured from a funnel into a 1137 mL container. Samples were then leveled using a
steel rod with the sample mass measured and recorded. Bulk density of dust samples were
calculated according to equation 4.4.
=
(4.4)

64
4.3.5 Particle Density
Mean particle volume of dust samples was obtained with a helium pycnometer (Model
No.-AccuPyc 1330, Micromeritics Instrument Corp., Norcross, GA). A known amount of mass
(about 2 g) was placed in the sample container of the instrument to measure the particle volume.
Particle density was calculated from the ratio of sample mass in the sample container to the
volume measured by the pycnometer.
4.3.6 Energy Content
Energy content of dust samples was measured using a bomb calorimeter (Model No.-
C200, IKA Works Inc., Wilmington, NC). Approximately 0.5 g of sample was compressed with a
press to form pellet (Model No.-C21, IKA Works Inc., Wilmington, NC) and then placed in a
steel container. Cotton thread connected to an ignition wire was used to ignite the sample after the
sample in the container was pressurized to 30 bars.
4.3.7 Ash Content
Ash content of the dust samples was determined according to the NREL Laboratory
Analytical Procedure (LAP, 2005). A sample of about 2 g was placed in crucibles and then
transferred into a muffle furnace (Model No.-F6020C, Thermoscientific, Dubue, IO). The furnace
was programed to heat up to 105˚C, ramped to 250˚C at 10˚C/minute and held at this temperature
for 30 minutes, followed by increasing to 575˚C at 20˚C/min and held for 180 minutes and then
finally lowering temperature back to 105˚C. Crucibles were then placed in the desiccator for 1
hour and allowed to cool to room temperature. The mass of the samples was measured to 0.1 mg
by using a weighing balance. Ash content on the dry basis was calculated according to equation
4.5.
Ash content of coal dust was determined by using ASTM standard (ASTM D 3174-04,
2004). Based on a standard, coal dust sample of about 1 g was first heated to 450 ºC at a rate of

65
10 ºC/min. It was then heated so that a final temperature of 700 ºC was attained by the end of the
second hour and then heated for additional 2 hours.
( )
×100 (4.5)
Mash is the mass of ash (g)
Mcon is the mass of the container (g)
Mod is the mass of dried biomass (g)
4.3.8 Volatile Matter
Volatile matter of dust was measured according to ISO 562 (ISO 562, 2010). About 1g ±
0.1 of sample was placed in a crucibles. The crucibles were placed in a volatile matter furnace
(Model No.-VMF 10/6/3216P, Carbolite, Hope Valley, England) at 900˚C ± 10˚C for 7 min.
Crucibles were then removed from the furnace and placed in a desiccator until they cooled to
room temperature. The final mass of the crucibles with sample was measured. Volatile content
was calculated as follows.
Vd [ ( )
] (
) (4.6)
where
M1 is the mass of the empty crucibles with lid (g);
M2 is the mass of the crucibles with lid after placing sample in the crucibles (g);
M3 is the final of the crucibles with lid after heating (g);
Mad is the moisture content of the sample before heating (% w.b.)
4.3.9 Hot Surface Ignition Temperature
Hot surface ignition temperature of dust samples was determined according to ASTM-
E2021 (2010) by using a commercial hot plate (Model No.-VmWare, Thorofore, NJ). The
apparatus consisted of a commercial hot plate, metal plate (200 mm diameter and 20 mm
thickness), a metal ring (12.7 mm diameter and 100 mm depth) and thermocouples (Figure 4.1).

66
The metal plate placed on commercial hot plate and metal ring was placed on the metal plate. A
type K bare thermocouple (0.20 to 0.25 mm) was fixed radially across the metal ring and another
thermocouple was attached to the metal hotplate. The temperatures from the two thermocouples
were recorded by a data logger (Fuji Electric Systems Co, Ltd, Tokyo, Japan) at an interval of 5
seconds. To carry out the test, the desired temperature was set on the temperature controller of the
hot plate. The metal ring was then filled with the dust sample when the temperature of hot plate
reached the desired temperature. Surface of dust sample was leveled with the top part of metal
ring. Temperature of the hot plate and dust layer was monitored and recorded continuously. If
ignition did not occur, the test was repeated with fresh dust but with a set temperature that is 5ºC
higher than the previous test. Process was repeated until ignition of the dust sample occurred. Hot
surface ignition was taken as the average of temperature of ignition and the maximum
temperature at which dust did not ignite (5ºC lower than the ignition temperature).
Figure 4.1. (a) Hot plate apparatus, (b) Metal ring and thermocouple (K type) (c) Ring filled
with fresh dust sample and (d) Burned Dust.
Thermocouples
Metal ring
Metal plate
Commercial hot
plate
Metal ring
Thermocouple
(a) (c)
(b) (d)
))

67
4.3.10 Volatilization Properties
A TGA (Model No.-Pyris 1 TGA, PerkinElmer, Shelton, CT) was used to quantify the
volatilization properties by monitoring mass loss of 5 mg of dust samples when subjected to
programmed heating from 30ºC to 800ºC at 5ºC min-1
under air and oxygen atmospheres. A
single oxidation temperature could not be obtained when sample was heated under air and
therefore, oxygen was used to determine oxidation temperature (Tch). The onset temperature of
volatilization (TOD) and the temperature of maximum rate of mass loss (TMWL) were
determined by analyzing the data recorded by software provided by apparatus manufacturer. The
TOD indicates the starting temperature at which some of the components began to volatilize. The
TMWL is the temperature at which maximum volatile matter is produced. The lower the
temperature, readily the material is ignited. The oxidation temperature (Tchar) was obtained by
heating sample under the oxygen stream.
The apparent activation energy (Ea) of each sample was determined using equations 4.7-
4.11 and from the data obtained from thermogravimetric analysis under the air stream. A linear
equation was fitted to plot of ln(
) versus
(equation 4.11) in a Microsoft Excel 2010
(Microsoft Excel, Redmond, WA). The Ea was obtained from the slope (
) of the linear fit. The
activation energy was plotted against the oxidation temperature to estimate the risk of ignition
associated with various dust samples (Ramirez et. al, 2010).
The equation for loss of mass (dm/dt) was
( ) (4.7)
with degree of the conversion process can be defined was
( ) ( ) (4.8)
Arrhenius equation to determine k
(4.9)
( ) (4.10)

68
(
) ( ) ( )
(4.11)
where R is the universal gas constant, (8.314 J/mol K), T is the temperature (K), and A and E are
kinetics parameters pre-exponential factor (1/s) and activation energy (J/mol), respectively.
4.3.11 Exothermic Reaction Parameters
Differential Scanning Calorimetry (Model No.-Q200, TA Instruments, New Castle, DE)
was used to estimate the exothermic reaction parameters by measuring heat flow when a sample
was heated using air from 30ºC to 500ºC at a rate 20ºC/min. About 0.5 mg of material was
placed in 50 µl crucible. The plot of heat flow (Q) versus temperature was analyzed with software
provided by manufacturer to estimate the following exothermic reaction parameters- onset
temperature for rapid exothermic reaction (TRE) and, the maximum temperature reached during
the exothermic reaction (Tmax). Exothermic energy was also determined by calculating the area
under curve from the plot of heat flow versus temperature with the help of software provided by
manufacturer.
4.2.12 Data Analysis
The Analysis of Variance (ANOVA) procedures in the Statistical Analysis System (SAS,
2009) were used to determine the significant effect (95% of significance level) of particle size on
physiochemical and ignition properties of loblolly pine dust. The Tukey test was also performed
to compare means of properties of three fractions of dust and unfractionated pine dust and coal
dust. Each experiment was carried out in duplicates or triplicates. Microsoft Excel (Microsoft
Excel, 2010, Redmond, WA) was used for regression analysis and to plot graphs.
4.4 Results and Discussion
4.4.1 Particle Size Distribution and Moisture Content
Particle size distributions of the three fractionated dust samples are shown in Figure 4.2.
There was skewness in the distributions of fractionated dust samples (Figure 4.2) as well as

69
unfractionated pine dust and coal dust (Figure 4.3). Geometric particle size of three loblolly pine
dust fractions (fine, medium and coarse) ranged from 68µm-202µm. Coal dust had a wide particle
size distribution compared to unfractionated loblolly pine dust. Geometric particle size of coal
dust was also larger than the unfractionated loblolly pine dust (Table 4.1).
Moisture contents of three dust fractions were not significantly different (P >0.05).
Moisture content of unfractionated loblolly pine loblolly dust was higher compared to coal dust
(Table 4.3)
Figure 4.2. Particle size distribution of fine (<90 µm), medium (90-180 µm) and coarse (180-
420 µm) dust fractions
Figure 4.3. Particle size distribution of pine (unfractionated) and coal dust
0
5
10
15
20
25
30
0 0.2 0.4 0.6 0.8 1
Reta
ined
(%
)
Particle Size (mm)
Medium Fraction
Coarse fraction
Fine Dust
0
2
4
6
8
10
12
14
0 1 2 3 4
Ret
ain
ed (
%)
Particle Size (mm)
Unfractionated Dust
coal dust

70
Table 4.1 Geometric mean particle size of three pine dust fractions (fine, medium and
coarse dust fraction), unfractionated pine dust and coal dust.
Properties Fine Dust
(<90µm)
Medium Dust
(90-80) µm
Coarse Dust
(180-420
µm)
Unfractionated
Dust(<420 µm)
Coal Dust
(<420 µm)
Particle
Size (µm) 68.18±18.03 189.45±123.15 201.80±86.34 291.05±169.83 320.41±374.37
4.4.2 Bulk and Particle Density
Bulk densities of three types of fractions (fine, medium and coarse) were shown in the
Table 4.2. Bulk density of the dust sample decreased significantly (p>0.05) with increase in
particle size. This is because of decrease in internal particle voids as particle size decreased. Mani
et al. (2004) also found that the bulk density of material decrease with an increase in the
geometric mean diameter (Mani et al., 2004). Particle density of dust did not change significantly
with a change in particle size (p>0.05). Bulk and particle density of coal was higher than the
loblolly pine dust because of the high mineral content (ash) in coal compared to biomass
(Vassilev et al., 2010). Similar results were obtained by Demribas et al. (2004) and they reported
that an average bulk density of biomass was about 500 kg/m3 while an average bulk density of
coals was about 1300 kg/m3 (Table 4.3).
4.4.3 Ash Content
Ash content of dust samples significantly increased (P=0.0012) with decrease in particle size
(Table 4.2) with the fine fraction of dust having ash content of 1.70% while the coarse dust
samples has ash content of 0.76% . Similar results were obtained by Miranda et al. (2012), Liu
and Bui (2011) and Bridgeman et al. 2007 for switchgrass and reed canary grass. This was
because that the inorganic particles were more grindable and they were separated from

71
lignocellulose structure of crops during grinding As expected, ash content of pine dust (1.08% on
dry basis) was lower than the coal dust (19.22% on dry basis) because of higher levels of
inorganic compounds in coal (Demirbas, 2004).
4.4.4 Volatile Matter
Volatile matter did not change significantly (P=0.489) with change in particle size (Table
4.2). Pine dust had high volatile content (82.36% on d.b.) compared to coal dust (31.00% on d.b.)
because in general biomass have the higher hydrogen to carbon and oxygen to carbon ratios
compared to coal (Jenkins et al., 1998). Volatiles are due to the decomposition of hydrogen,
oxygen and carbon contents when a sample is heated at high temperature (Table 4.3).
4.4.5 Energy Content
Energy content of fractionated dust was not significantly (P=0.6363) affected by particle
size. Energy content of dust fractions varied from 20.25 to 20.28 MJ/kg. Energy content of
biomass dust (20.01 MJ/kg) was significantly less than coal dust (26.94 MJ/kg). This is due to
high oxygen content in biomass compared to coal (Demribas, 2004). These values were
comparable to the values obtained by Carter, (2012) (Table 4.2 and Table 4.3).
Table 4.2 Physicochemical properties of pine dust fractions (fine, medium and coarse).
Samples
Moisture
Content
(%w.b.)
Bulk
Density
(kg/m3)
Particle
Density
(kg/m3)
Ash
Content (%
d.b.)
Volatile
Material
(% d.b.)
Energy
Content
(MJ/kg)
Fine Dust
(<90µm) 9.20a 208.33b 1443.55a 1.70c 82.19a 20.28a
Medium Dust
(90-180 µm) 9.46a 179.14a 1448.29a 1.27b 82.07a 20.25a
Coarse Dust
(180-420 µm) 8.73a 168.92a 1423.65a 0.76a 83.94a 19.68a
Subscripts with the different letters in row are significantly different (p<0.05).

72
Table 4.3 Physicochemical properties of pine dust fractions (fine, medium and coarse).
Samples
Moisture
Content
(% w.b.)
Bulk
Density
(kg/m3)
Particle
Density
(kg/m3)
Ash
Content
(% d.b.)
Volatile
Matter (%
d.b.)
Energy
Content
(MJ/kg)
Unfractionated
Pine Dust
(<420 µm)
8.16b 196.21a 1457.99a 1.08a 82.36b 20.01a
Lignite Coal
Dust (<420
µm)
5.76a 521.48b 1513.31b 19.22b 31.00a 26.94b
Subscripts with the different letters in row are significantly different (p<0.05).
4.4.6 Hot Surface Ignition Temperature
Figure 4.4 and Figure 4.5 show the typical temperature profile obtained during the hot
surface test. In the example shown the dust (fine dust) did not ignite when the hot plate was set to
a temperature of 290ºC (Figure 4.4) and hence there was a horizontal line. However, at a hot plate
temperature of 295ºC, the dust combusted and hence the rapid increase in temperature (Figure
4.5).
Results of the hot plate test showed that fine dust sample (< 90 µm) ignited at 295ºC with
smoke and flame being observed at this temperature. However, fine dust did not ignite at hot plate
temperature of 290ºC. Medium and coarse dust fractions were ignited at 300ºC and 305ºC,
respectively. Hot plate ignition temperature therefore increases with an increase in particle size.
We suspect this because of smaller particles of fine fraction causes faster volatile matter
production (Chen et al. 1996). Ignition temperature of coal dust (295ºC-300ºC) was higher than
the pine dust (295ºC). This is because of the high volatile content of pine dust that caused the dust
to react faster and ignited at low temperature (Demirbas, 2004). Ignition temperature of coal dust
was lower compared to that obtained by Reddy et al. (1988). They found that the ignition
temperatures of Prince and Pittsburgh coals were 250ºC and 270ºC, respectively. It could be
because they used 10 mm layer of dust and these coal samples also have slightly higher volatile

73
content compared to coal sample used for present work (volatile contents of Prince coal and
Pittsburgh coal were 34.35% and 36.4% respectively).
Figure 4.4. Temperature profile of fine dust sample when hot plate was set at 290ºC (<90
µm).
Figure 4.5. Temperature profile when dust sample (<90 µm) ignited. Hot plate was set at
295ºC.
0
50
100
150
200
250
300
350
400
450
0 500 1000 1500 2000 2500
Tem
per
atu
re (
˚C)
Time (Sec)
290˚C
Hot Plate
0
50
100
150
200
250
300
350
400
450
0 500 1000 1500 2000 2500
Tem
per
atu
re (
˚C)
Time (Sec)
295˚C
Hot Plate (295˚C)

74
Table 4.4. Hot surface ignition temperature of dust samples
Properties Fine dust
(<90 µm)
Medium
Dust
(90-180 µm)
Coarse Dust
(180-420
µm)
Unfractionated
Pine Dust
(<420 µm)
Lignite Coal
Dust
(<420 µm)
Ignition
temperature
(ºC)
290-295 295-300 300-305 290-295 295-300
4.4.7 Volatilization Properties
The typical, observed mass loss curves for dust samples heated in air and oxygen
atmosphere are shown in Figures 4.6 and 4.7. There was an initial mass loss (about 10% of total
mass) that was obtained between 30ºC to 100ºC which is attributed to release of moisture from
the dusts. The thermal decomposition of dust started at about 220ºC followed by a rapid mass loss
at about 324ºC that ends at about 500ºC. Beyond 500ºC, mass loss was negligible and the final
mass recorded by TGA approximately equals to the ash content of the sample.
Particle size of dust did not affect significantly the volatilization properties (Table 4.3).
The onset temperature of volatilization and the maximum mass loss rate temperature were
obtained from the derivative of mass loss curve as shown in Figure 4.6. Loblolly pine dust had
significantly low onset temperature of volatilization (TOD), temperature of maximum rate of
mass loss (TMWI) and temperature of oxidation compared to coal dust because of the high
volatile content of pine dust (82.36% d.b.) compared to coal dust (31.00% d.b.) (Figure 4.9).
Similar results were obtained by Vuthaluru (2004) for coal and wood waste showed that their
respectively onset ignition temperature were 260ºC and 426ºC.
Using equation 4.11 apparent activation energy (Ea) of fine, medium and coarse dust
fraction was 69.89, 67.05 and 71.25 kJ/mole, respectively. These values are comparable to
activation energy (72.98 kJ/mol) of wood waste obtained by Sadhukhan et al., (2008). The plot of
Ea versus Tchr was used to measure the ignition risk for the dust fractions (Figure 4.13). Coal dust

75
had lower risk of ignition as compared to pine dust. Similar plot was obtained by Ramirez et al.,
(2010) to examine the ignition risk associated with biological materials (icing sugar, maize dust
and wheat dust). The risk of ignition of icing sugar, maize dust, and wheat dust were also shown
in Figure 4.13 (Table 4.5).
Figure 4.6. Example of TOD and TMWL from TGA data; curve is for determination of air-
heated fine (< 90µm) dust.
Figure 4.7. Determination of Tch by thermogravimetric analysis carried out in the presence
of oxygen of fine (<90µm) dust.
-0.6
-0.5
-0.4
-0.3
-0.2
-0.1
0.0
0.1
0
1
2
3
4
5
6
7
8
9
10
0 100 200 300 400 500 600 700 800
der
iva
tiv
e (m
g/m
in)
Ma
ss (
mg
)
Temperature (˚C)
Mass (mg)
derivative
(mg/min)
TOD
TMWL
-4.5
-4.0
-3.5
-3.0
-2.5
-2.0
-1.5
-1.0
-0.5
0.0
0.5
1.0
0
1
2
3
4
5
6
7
8
9
10
0 100 200 300 400 500 600 700 800 900
der
iva
tiv
e (m
g/m
in)
Ma
ss (
mg
)
Temperature (˚C)
Mass (mg)
derivative
(mg/min)
Tch

76
Figure 4.8. Mass loss of three dust fractions heated in air atmosphere (fine, medium and
coarse).
Figure 4.9. Mass loss of unfractionated pine dust and coal dust heated in air atmosphere.
0
10
20
30
40
50
60
70
80
90
100
0 100 200 300 400 500 600 700 800
Ma
ss %
Temprature (˚C)
Fine Dust
Medium Dust
Coarse Dust
0
10
20
30
40
50
60
70
80
90
100
0 100 200 300 400 500 600 700 800
Ma
ss %
Temperature(˚C)
Unfractionated
Pine Dust
Coal Dust

77
Figure 4.10. Mass loss of dust fractions (fine, medium and coarse) heated in the oxygen
atmosphere.
Figure 4.11. Mass loss of unfractionated pine dust and coal dust heated in the oxygen
atmosphere.
0
10
20
30
40
50
60
70
80
90
100
0 100 200 300 400 500 600 700 800
Ma
ss%
Temperature(˚C)
Fine Dust
Medium Dust
Coarse Dust
0
10
20
30
40
50
60
70
80
90
100
0 100 200 300 400 500 600 700 800
Ma
ss %
Temperature (˚C)
Unfractionated
Pine Dust
Coal Dust
Tcharac

78
Figure 4.12. Determination of apparent activation energy (<90 µm) .
Figure 4.13. Ignition risk of pine dust fractions (fine dust, medium dust and coarse dust),
unfractionated pine dust, lignite coal dust, biological materials dust (icing sugar, maize
dust, wheat dust and animal waste) (Ramirez et al., (2010).
y = -8206.6x + 12.92
R² = 0.9662
-6
-5
-4
-3
-2
-1
0
0.001 0.0015 0.002 0.0025
ln(d
m/d
t)
1/T (1/K)
220
240
260
280
300
320
340
360
380
400
420
440
60 65 70 75 80 85 90 95 100
Tem
pra
ture
(T
ch,
˚C)
Ea (kJ/mol)
Fine Dust
Medium Dust
Coarse Dust
Lignite Coal Dust
Unfractionated Pine
Dust
Icing Sugar
Maize Dust
Wheat Dust
Animal Waste
High Risk
Medium Risk
Low Risk

79
Table 4.5. TGA parameters of fractionated pine dust samples (fine, medium and coarse dust
fraction), unfractionated pine dust, lignite coal dust, bituminous coal dust and biological
materials.
Properties TOD (ºC ) TMW (ºC) Tchar(ºC) Ea (kJ/mole)
Fine Dust
(<90µm) 272a 325a 299a 70
Medium Dust
(90-80) µm 264a 324a 304a 69
Coarse Dust
(180-420 µm) 268a 325a 301a 71
Unfractionated Pine
Dust (<420 µm)
273e 324e 293e 65
Lignite Coal Dust
(<420 µm)
409f 489f 417f 95
Icing Sugar 212 220 239 62
Wheat Dust 268 279 279 65
Maize Dust 252 283 289 64
Animal Waste 300 180 280 73
Bituminous Coal
Dust
392 407 261 80
Subscripts with the same values are not significantly different (p<0.05) and a, b, c compare three
fractions (fine, medium and coarse) with each other while e and f compare unfractionated pine
and lignite coal dust.
Data for icing sugar, wheat dust, maize dust, bituminous dust have been used from Ramirez et al.
(2010)
4.4.8 Exothermic Parameters (DSC)
The heat flow curve for the dust fraction was shown in Figure 4.14, when dust samples
were heated from 30ºC to 550ºC at a rate of 20ºC/minute. The negative value of heat flow
indicated endothermic reaction that peaked about 100ºC due to evaporation of moisture from dust
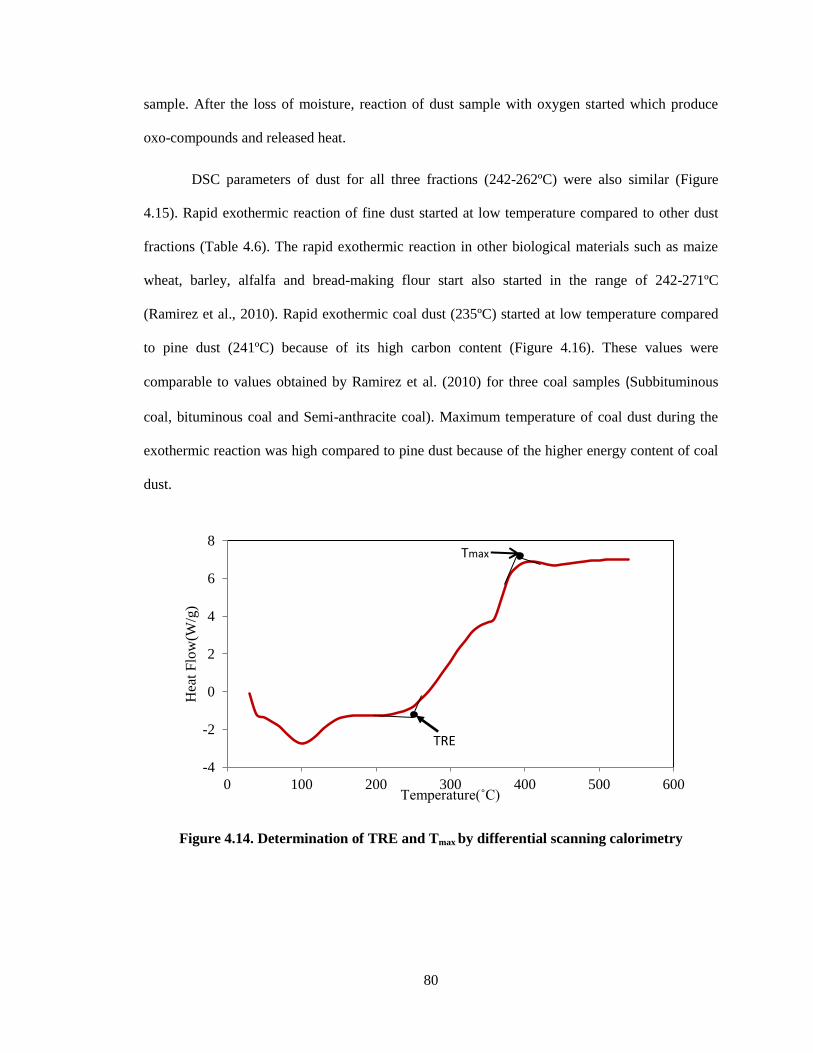
80
sample. After the loss of moisture, reaction of dust sample with oxygen started which produce
oxo-compounds and released heat.
DSC parameters of dust for all three fractions (242-262ºC) were also similar (Figure
4.15). Rapid exothermic reaction of fine dust started at low temperature compared to other dust
fractions (Table 4.6). The rapid exothermic reaction in other biological materials such as maize
wheat, barley, alfalfa and bread-making flour start also started in the range of 242-271ºC
(Ramirez et al., 2010). Rapid exothermic coal dust (235ºC) started at low temperature compared
to pine dust (241ºC) because of its high carbon content (Figure 4.16). These values were
comparable to values obtained by Ramirez et al. (2010) for three coal samples (Subbituminous
coal, bituminous coal and Semi-anthracite coal). Maximum temperature of coal dust during the
exothermic reaction was high compared to pine dust because of the higher energy content of coal
dust.
Figure 4.14. Determination of TRE and Tmax by differential scanning calorimetry
-4
-2
0
2
4
6
8
0 100 200 300 400 500 600
Hea
t F
low
(W/g
)
Temperature(˚C)
TRE
Tmax

81
Figure 4.15. DSC plots of three dust fractions of loblolly pine (fine, medium and coarse)
Figure 4.16. DSC plots of unfractionated loblolly pine dust and coal dust
-4
-2
0
2
4
6
8
10
12
0 100 200 300 400 500 600
Hea
t F
low
(W/g
)
Temperature(˚C)
Medium Dust
Coarse Dust
Fine Dust
-4
-2
0
2
4
6
8
10
12
0 100 200 300 400 500 600
Hea
t F
low
(W/g
)
Temperature(˚C)
Unfractionaed Pine Dust
Coal Dust

82
Table 4.6. Exothermic parameters of three fractions (fine, medium and coarse dust) of pine
dust
Properties TRE (ºC) Tmax (ºC) Exothermic Energy
(kJ/kg)
Fine Dust (<90µm) 242a 397a 1114
Medium Dust
(90-180) µm 253b 405a
1710
Coarse Dust
(180-420 µm) 262b 398a
1100
Unfractionated Pine Dust
(<420µm) 241f 400e
1231
Lignite Coal Dust
(<420µm) 235e 453f
441
Icing Sugar 410 480 -
Wheat Dust 252 283 -
Maize Dust 242 386 -
Animal Waste - 370 -
Bituminous Coal Dust 240 323 -
Subscripts under the values show the comparison of means according to Tukey test (P<0.05) and
a, b, c compare three fractions (fine, medium and coarse) with each other while e and f compare
unfractionated pine and lignite coal dust.
Data for icing sugar, wheat dust, maize dust, bituminous dust have been used from Ramirez et al.
(2010)
4.5 Conclusion
Particle size affected the physical, chemical and ignition properties of loblolly pine dust.
Bulk density of dust increased with a decrease in particle size. Particle density of dust remained
nearly uniform with change in particle size. The fine dust fraction contained more ash content
(1.70% on d.b.) compared to coarse and medium dust fractions (1.27% and 0.76% d.b.,
respectively). Volatile content and energy content of the three fractions were not significantly
different (p>0.05). TGA and DSC parameters of the three types of dust fractions were similar. All
83
dust fractions were at the high to medium risk of ignition according to the activation energy and
oxidation temperature results. Coal had high bulk and particle density, ash content and energy
content compared to loblolly pine dust. High ash content and low volatile content of the pine dust
affected its ignition properties. Ignition temperature of pine dust was between 290 ºC and 295 ºC
which was lower compared to coal dust (295-300ºC). Pine dust had a low onset temperature of
volatilization (273ºC) and temperature of maximum rate of mass loss (324ºC) compared to coal.
However, rapid exothermic reaction in coal started at a lower temperature (235ºC). Pine dust was
at high risk of ignition compared to coal based on the plot of activation energy and oxidation
temperature results.

84
Chapter 5 Summary and Future Recommendation
5.1 Summary
The moisture content of wood chips and hammer-mill screen size significantly affected
the amount of dust generated and energy required for grinding. When wood chips of three
different moisture contents (w.b.) (4.7%, 14.7% and 23.6% ) were ground through different
hammer mill screens (1.20, 3.18 and 6.35 mm), about 5%-21% of wood chips were converted
into dust. About 2% of the energy content of loblolly pine chips was utilized during the grinding.
In general, the amount of dust generated decreased with increase in moisture content and screen
size. Furthermore, energy required for grinding increased with increase in moisture content and
decrease in screen size. Physiochemical properties of ground loblolly pine chips and dust were
significantly affected by chip moisture content and hammer mill screen size. Except for particle
density and energy content, physiochemical properties of loblolly pine dust were significantly
different than ground chips. The ash content of dust was up to six times that of ground material.
Physicochemical properties of loblolly pine dust were significantly affected by its particle size.
Loblolly pine dust had high moisture content and volatile matter compared to coal dust. However,
bulk and particle density, ash and energy content of coal dust was higher compared to coal dust.
Similar to other biological materials, loblolly pine dust was at high risk of ignition compared to
coal dust. The hot surface temperature, temperature of volatilization and temperature of onset
85
rapid exothermic reaction indicated that the susceptibility of the ignition increased with decrease
in particle size.
In conclusion, the amount of dust generation during grinding of loblolly pine chips
depends upon its moisture content and selection of screen size of grinder. Moisture content and
screen size of grinder also affect physicochemical properties of biomass dust. Fine fraction of
dust is at high risk of ignition compared to coarse dust fractions and should be handled carefully.
5.2 Future Recommendation
This study delivers the useful information regarding the physiochemical and ignition
properties of dust from loblolly pine chips. Still, more work can be completed to better
understand the problems related to biomass dusts.
Tests should be carried out to determine the amount of microorganisms and endotoxins
and their growth in the dust obtained from loblolly pine chips to avoid the health problems. It
would be very useful and time saving if physicochemical properties of dusts can be predicted
from ground biomass. A model should be developed to find the relation between physicochemical
properties of different types of ground biomass and their dusts. In the present study, only the
effect of particle size on ignition properties of dusts was determined. Moisture content of biomass
is another important property of biomass dust that influences their ignition properties. Therefore,
additional test should be completed on ignition properties of dusts should by conditioning at
different moisture contents (w.b.) ranging from 10% to 25% . Different types of biomass such as
switch-grass, crop residues, eucalyptus tree and municipal waste are being used to produce bio-
energy. However, limited information is available regarding the ignition properties of dust from
biomass. It is crucial to determine the ignition properties of dust of different types of biomass to

86
avoid the explosion and ignition risk in bioenergy industry. In the future work, ignition properties
of different types of biomass should be determined by following similar procedure.

87
References
Abbasi, T., and S. A. Abbasi. 2007. Dust explosions–Cases, causes, consequences, and control.
Journal of Hazardous Materials 140(1–2):7-44.
Akpınar, A., M. İ. Kömürcü, M. Kankal, İ. H. Özölçer, and K. Kaygusuz. 2008. Energy situation
and renewables in Turkey and environmental effects of energy use. Renewable and Sustainable
Energy Reviews 12(8):2013-2039.
Amyotte, P. R. 2006. Solid inertants and their use in dust explosion prevention and mitigation.
Journal of Loss Prevention in the Process Industries 19(2–3):161-173.
Amyotte, P. R., and R. K. Eckhoff. 2010. Dust explosion causation, prevention and mitigation:
An overview. Journal of Chemical Health and Safety 17(1):15-28.
ASABE Standard S269.4. 2003. Cubes, pellets, and crumbles-definitions and methods for
determining density, durability, and moisture content. ASABE, St. Joseph, MI.
ASABE Standard S319.3, 2003. Method of determining and expressing fineness of feed materials
by sieving. American Society of Agricultural and Biological Engineers.
ASABE S593.1. 2011. Terminology and Definitions for Biomass Production, Harvesting and
Collection, Storage, Processing, Conversion and Utilization. American Society of Agricultural
and Biological Engineers.
Asif, M., and T. Muneer. 2007. Energy supply, its demand and security issues for developed and
emerging economies. Renewable and Sustainable Energy Reviews 11(7):1388-1413.
ASTME871-82. Reapproved 2006. Standard Test Method for Moisture Analysis of Particulate
Wood Fuels.
ASTM E2021-09. 2010. Standard Test Method for Hot-Surface Ignition Temerature of Dust
Layers. ASTM.

88
Babu, B. V. 2008. Biomass pyrolysis: a state-of-the-art review. Biofuels, Bioproducts and
Biorefining 2(5):393-414.
Balat, M., and H. Balat. 2009. Recent trends in global production and utilization of bio-ethanol
fuel. Applied Energy 86(11):2273-2282.
Balat, M. 2011. Production of bioethanol from lignocellulosic materials via the biochemical
pathway: A review. Energy Conversion and Management 52(2):858-87
Biogas Technology, 2013. Schemetic Diagram of Biogas Plant. Available at
http://www.bebgmbh.de . Accessed 2 March 2013.
Biomass, 2013, Learning Goal and Explanation. Available at . www.is3felipee-
portfolio.blogspot.com. Accessed 10 March 2013.
Blair, A.S. 2007. Dust explosion incidents and regulations in the United States. Journal of Loss
Prevention in the Process Industries. 20:523-529.
Bowes, P. C. and S. E, Townshend. 1962. Ignition of combustible dusts on hot surfaces. British
Journal. Applied Physics.13: 105-114.
Bridgeman, T. G., L. I. Darvell, J. M. Jones, P. T. Williams, R. Fahmi, A. V. Bridgwater, T.
Barraclough, I. Shield, N. Yates, S. C. Thain, and I. S. Donnison. 2007. Influence of particle size
on the analytical and chemical properties of two energy crops. Fuel 86(1–2):60-72.
Carter, C. L. 2012. Physicochemical Properties and Thermal Decomposition of Torrefied Woody
Biomass and Energy Crop. MS thesis. Auburn, Alabama: Auburn University, Biosystems
Engineering Department.
Cashdollar, K. L. 1994. Flammability of metals and other elemental dust clouds. Process Safety
Progress 13(3):139-145.
Cashdollar, K. L. 2000. Overview of dust explosibility characteristics. Journal of Loss Prevention
in the Process Industries 13(3–5):183-199.
Callé, S. , L. Klaba, D. Thomas, L. Perrin, and O. Dufaud. 2005. Influence of the size
distribution and concentration on wood dust explosion: Experiments and reaction modelling.
Powder Technology 157(1–3):144–148
CBCnews. 2012. Wood dust suspected in B.C. sawmill blasts: Available at http://www.cbc.ca.
Accessed 10 September 2012.
Chamberlain, E. A. C., and D. A. Hall. 1973. The ambient temperature oxidation of coal in
relation to the early detection of spontaneous heating The Mining Engineer:387–397.

89
Chawla, N., P. R. Amyotte, and M. J. Pegg. 1996. A comparison of experimental methods to
determine the minimum explosible concentration of dusts. Fuel 75(6):654-658.
Chen, Y., S. Mori, and W.-P. Pan. 1996. Studying the mechanisms of ignition of coal particles by
TG-DTA. Thermochimica Acta 275(1):149-158.
Clausnitzer, H., and M. J. Singer. 2000. Environmental influences on respirable dust production
from agricultural operations in California. Atmospheric Environment 34(11):1739-1745.
Combustible Dusts, 2013. Combustibe Dusts. Avaailable at http://www.ccohs.ca. Accesed 1
April, 2013.
CSB, 2004 West. Investigation Report. Dust Explosion. West Pharmaceutical Services, Inc., U.S.
Chemical Safety and Hazard Investigation Board (CSB). Avaialable at http://csb.gov/index.cfm
Accessed 10 April, 2013.
Dastidar, A. G., and P. R. Amyotte. 2002. Explosibility boundaries for fly ash/pulverized fuel
mixtures. Journal of Hazardous Materials 92(2):115-126.
Demirbaş, A. 2001. Biomass resource facilities and biomass conversion processing for fuels and
chemicals. Energy Conversion and Management 42(11):1357-1378.
Demirbas, A. 2004. Combustion characteristics of different biomass fuels. Progress in Energy
and Combustion Science 30(2):219-230.
DOE. 2013. Biochemical Conversion. United States Department of energy. Available at
www.eere.energy.gov. Accesed 17 December 2012.
Ebling, J., and B. Jenkins. 1985. Physical and chemical properties of biomass fuels. Transactions
of the ASAE (American Society of Agricultural Engineers) 28(3):5.
Eckhoff, R. K. 2000. Design of electrical equipment for areas containing combustible dust: Why
dust standards cannot be extensively harmonised with gas standards. Journal of Loss Prevention
in the Process Industries 13(3–5):201-208.
Eckhoff, R. K. 2003. Dust Explosion in the Process Industries. 3 ed. Gulf Professional
Publications,2003.
EIA. 2013. United States Energy Information Administration. Available at http://www.eia.gov.
Accessed 10 March, 2013.
Energy Independence and Security Act of 2007, H.R.6, in: 110th United States Congress, 1st
Session,(Ed.), H.R.6, Congressional Record, Washington D.C.
Esteban, L. S. and J. E. Carrasco. 2006. Evaluation of different strategies for pulverization of
forest biomasses. Powder Technology. 166 (3):139–151.
Fasina, O. O. 2008. Physical properties of peanut hull pellets. Bioresource Technology
99(5):1259-1266.

90
Gani, A., I. Naruse. 2007. Effect of cellulose and lignin content on pyrolysis and combustion
characteristics for several types of biomass. Renewable Energy. 32(4): 649–661.
García-Torrent, J., Á. Ramírez-Gómez, E. Querol-Aragón, C. Grima-Olmedo, and L. Medic-
Pejic. 2012. Determination of the risk of self-ignition of coals and biomass materials. Journal of
Hazardous Materials 213–214(0):230-235.
Gillman, T. H., and I. Le May. 2007. Mechanical and electrical failures leading to major fires.
Engineering Failure Analysis 14(6):995-1018.
Gomez, L. D., C. G. Steele-King, and S. J. McQueen-Mason. 2008. Sustainable liquid biofuels
from biomass: the writing's on the walls. New Phytologist 178(3):473-485.
Gómez-Barea, A., and B. Leckner. 2010. Modeling of biomass gasification in fluidized bed.
Progress in Energy and Combustion Science 36(4):444-509.
Gray, B. F., M. J. Sexton, B. Halliburton, and C. Macaskill. 2002. Wetting-induced ignition in
cellulosic materials. Fire Safety Journal 37(5):465-479.
Grotkjær, T., K. Dam-Johansen, A. D. Jensen, and P. Glarborg. 2003. An experimental study of
biomass ignition. Fuel 82(7):825-833.
Gummer, J., G.A Lunn. 2003. Ignitions of explosive dust clouds by smouldering and flaming
agglomerates. Journal of Loss Prevention in the Process Industries. 16(1):27–32.
Hoffa, E. A., D. E. Ward, W. M. Hao, R. A. Susott, and R. H. Wakimoto. 1999. Seasonality of
carbon emissions from biomass burning in a Zambian savanna. Journal of Geophysical Research:
Atmospheres 104(D11):13841-13853.
IEA.2013. International Energy Agency. Available at http://www.iea.org. Accessed 2 February,
2013.
ISO 562, 2010. Hard coal and coak. Determination of volatile matter. International Standards.
Janes, A., D. Carson, A. Accorsi, J. Chaineaux, B. Tribouilloy, and D. Morainvillers. 2008.
Correlation between self-ignition of a dust layer on a hot surface and in baskets in an oven.
Journal of Hazardous Materials 159(2–3):528-535.
Janes, A., J. Chaineaux, D. Carson, and P. A. Le Lore. 2008. MIKE 3 versus HARTMANN
apparatus: Comparison of measured minimum ignition energy (MIE). Journal of Hazardous
Materials 152(1):32-39.
Jeguirim, M., and G. Trouvé. 2009. Pyrolysis characteristics and kinetics of Arundo donax using
thermogravimetric analysis. Bioresource Technology 100(17):4026-4031.
Jenkins, B. M., L. L. Baxter, T. R. Miles Jr, and T. R. Miles. 1998. Combustion properties of
biomass. Fuel Processing Technology 54(1–3):17-46.
91
Jokela, E. J., P. M. Dougherty, and T. A. Martin. 2004. Production dynamics of intensively
managed loblolly pine stands in the southern United States: a synthesis of seven long-term
experiments. Forest Ecology and Management 192(1):117-130.
Joshi, K. A., V. Raghavan, and A. S. Rangwala. 2012. An experimental study of coal dust
ignition in wedge shaped hot plate configurations. Combustion and Flame 159(1):376-384.
Journal of Loss Prevention in the Process Industries. 20(4-6): 691-697.
Kaliyan, N., R. V. Morey, M. D. White, and D. G. Tiffany. 2009. A Tub-Grinding/Roll-Press
Compaction System to Increase Biomass Bulk Density: Preliminary Study. ASABE.
Kalliny, M. I., J. A. Brisolara, H. Glindmeyer, and R. Rando. 2008. A Survey of Size-
Fractionated Dust Levels in the U.S. Wood Processing Industry. Journal of Occupational and
Environmental Hygiene 5(8):501-510.
Kennedy, C., J. Steinberger, B. Gasson, Y. Hansen, T. Hillman, M. Havránek, D. Pataki, A.
Phdungsilp, A. Ramaswami, and G. V. Mendez. 2010. Methodology for inventorying greenhouse
gas emissions from global cities. Energy Policy 38(9):4828-4837.
Khan, N., M. Bradley, and R. Berry. 2008. Best Practice Guide for Handling o fBiomass Fuels
and Coal-Biomass Mixes. The Wolfson Centre for Bulk Solids Handling Technology(4).
Krause, U., and M. Schmidt. 2001. The influence of initial conditions on the propagation of
smouldering fires in dust accumulations. Journal of Loss Prevention in the Process Industries
14(6):527-532.
Kumar, P., D. M. Barrett, M. J. Delwiche and P. Stroeve. 2009. Methods for Pretreatment of
Lignocellulosic Biomass for Efficient Hydrolysis and Biofuel Production. American Chemical
Society.48 (8):3713–3729.
Laar, G. F. M. v., and J. P. Zeeuwen. 1985. On the minimum ignition energy of dust/air mixture.
Archivum Combustion 5:145-149.
Lal, R. 2004. Agricultural activities and the global carbon cycle. Nutrient Cycling in
Agroecosystems 70(2):103-116.
LAP. 2005. Determination of Ash in Biomass by Laboratory Analytical Procedure National
Renewable Energy Laboratory NREL/TP-510-42622 .
Lebecki, K., Z. Dyduch, A. Fibich, and J. Śliż. 2003. Ignition of a dust layer by a constant heat
flux. Journal of Loss Prevention in the Process Industries 16(4):243-248
Lewandowski, I., and A. Kicherer. 1997. Combustion quality of biomass: practical relevance and
experiments to modify the biomass quality of Miscanthus x giganteus. European Journal of
Agronomy 6(3–4):163-177.
Liu, X., and X. T. Bi. 2011. Removal of inorganic constituents from pine barks and switchgrass.
Fuel Processing Technology 92(7):1273-1279.
Liu, Y., J. Sun and D. Chen, 2007. Flame propagation in hybrid mixture of coal dust and
methane. Journal of Loss Prevention in the Process Industries 20 (4–6):691–697.

92
Lu., K., T. Chin and K. Hua, 2009. Investigation of the decomposition reaction and dust
explosion characteristics of crystalline benzoyl peroxides. Journal of Hazardous Material.
161(1): 246-256.
Macedo, I. C., J. E. A. Seabra, and J. E. A. R. Silva. 2008. Green house gases emissions in the
production and use of ethanol from sugarcane in Brazil: The 2005/2006 averages and a prediction
for 2020. Biomass and Bioenergy 32(7):582-595.
Madsen, A. M., L. Martensson, T. Schneider, And L. Larsson. 2004. Microbial Dustiness and
Particle Release of Different Biofuels. Annals of Occupational Hygiene 48(4):327-338.
Mani, S., L. G. Tabil, and S. Sokhansanj. 2004. Grinding performance and physical properties of
wheat and barley straws, corn stover and switchgrass. Biomass and Bioenergy 27(4):339-352.
Mann, M., and P. Spath. 2001. A life cycle assessment of biomass cofiring in a coal-fired power
plant. Clean Products and Processes 3(2):81-91.
McIlveen-Wright, D. R., Y. Huang, S. Rezvani, and Y. Wang. 2007. A technical and
environmental analysis of co-combustion of coal and biomass in fluidised bed technologies. Fuel
86(14):2032-2042.
McKendry, P. 2002. Energy production from biomass (part 2): conversion technologies.
Bioresource Technology 83(1):47-54.
Mettanant, V., P. Basu, and J. Butler. 2009. Agglomeration of biomass fired fluidized bed gasifier
and combustor. The Canadian Journal of Chemical Engineering 87(5):656-684.
Microsoft Excel, 2010. Microsoft Office 2010 Redmond, WA
Miranda, I., J. Gominho, I. Mirra, and H. Pereira. 2012. Chemical characterization of barks from
Picea abies and Pinus sylvestris after fractioning into different particle sizes. Industrial Crops and
Products 3.
Miron, Y., and C. P. Lazzara. 1988. Hot-surface ignition temperatures of dust layers. Fire and
Materials 12(3):115-126.
Moqbel, S., D. Reinhart, and R.-H. Chen. 2010. Factors influencing spontaneous combustion of
solid waste. Waste Management 30(8–9):1600-1607.
Moser, B. 2011. Biodiesel Production, Properties, and Feedstocks. In Biofuels, 285-347. D.
Tomes, P. Lakshmanan, and D. Songstad, eds: Springer New York.
Mosier, N., C. Wyman, B. Dale, R. Elander, Y. Y. Lee, M. Holtzapple, and M. Ladisch. 2005.
Features of promising technologies for pretreatment of lignocellulosic biomass. Bioresource
Technology 96(6):673-686.
Murphy, L. N., William J. Riley, and William D. Collins. 2012. Local and Remote Climate
Impacts from Expansion of Woody Biomass for Bioenergy Feedstock in the Southeastern United
States. J. Climate 25:7643–7659.

93
Mussatto, S. I., G. Dragone, P. M. R. Guimarães, J. P. A. Silva, L. M. Carneiro, I. C. Roberto, A.
Vicente, L. Domingues, and J. A. Teixeira. 2010. Technological trends, global market, and
challenges of bio-ethanol production. Biotechnology Advances 28(6):817-830.
Naik, S. N., V. V. Goud, P. K. Rout, and A. K. Dalai. 2010. Production of first and second
generation biofuels: A comprehensive review. Renewable and Sustainable Energy Reviews
14(2):578-597.
NFPA. 2007. Standard on Explosion Protection by Deflagration Venting National Fire Protection
Association NFPA 68.
NFPA. 2008a. Recommended practice for the classification of hazardous (classified) locations for
electrical installations in chemical process areas National Fire Protection Association NFPA 499.
NFPA. 2008b. Standard for the prevention of fires and dust explosions in agricultural and food
processing facilities. Nationa Fire Protection NFPA-61.
NFPA. 2011. Revised Dust Standard- Safety Engineering Networks. National Fire Protection
Association.
Nichols, D., J. Zerbe. 2012. Cofiring Biomass and Coal for Fossil Fuel Reduction and Other
Benefits—Status of North American Facilities in 2010. United States Department of Agricultural
and Forest Service.
Nifuku, M., H. Tsujita, K. Fujino, K. Takaichi, C. Barre, M. Hatori, S. Fujiwara, S. Horiguchi,
and E. Paya. 2005. A study on the ignition characteristics for dust explosion of industrial wastes.
Journal of Electrostatics 63(6–10):455-462.
Nifuku, M., S. Koyanaka, H. Ohya, C. Barre, M. Hatori, S. Fujiwara, S. Horiguchi, and I. Sochet.
2007. Ignitability characteristics of aluminium and magnesium dusts that are generated during the
shredding of post-consumer wastes. Journal of Loss Prevention in the Process Industries 20(4–
6):322-329.
Oseuke, C.O. and C. A. K. Ezugwu. 2011. Study of Nigeria Energy Resources and Its and Its
Consumption. International Journal of Scientific & Engineering Research. 2 (12):ISSN 2229-
5518.
Perlack, R. D., L. L. Wright, A. F. Turhollow, R. L. Graham, B. J. Stokes, and D. C. Erbach.
2005. Biomass as Feedstock for a Bioenergy and Bioproducts IndustryThe Technical Feasibility
of a Billion-Ton Annual Supply, United States Department of Energy, Oak Ridge, TN. United
States Department of Energy, Oak Ridge, TN.
Petrou, E. C., and C. P. Pappis. 2009. Biofuels: A Survey on Pros and Cons. Energy & Fuels
23(2):1055-1066.
Phanphanich, M., and S. Mani. 2011. Impact of torrefaction on the grindability and fuel
characteristics of forest biomass. Bioresource Technology 102(2):1246-1253.
Pialo, R. E. Ramalhoa, C. Pinho. 2006. Overall characterization of cork dust explosion. Journal
of Hazardous Material 133(1-3): 183-195.

94
Pinkwasser, T. 1986. On the Ignition capacity of Free-falling Smouldering Fires. Euromech
Colloquium 208, Explosions in Industry.
Pinkwasser, T. 1986. On the Ignition capacity of Free-falling Smouldering Fires. Euromech
Colloquium 208, Explosions in Industry.
Qian, Y., C. Zuo, J. Tan, and J. He. 2007. Structural analysis of bio-oils from sub-and
supercritical water liquefaction of woody biomass. Energy 32(3):196-202.
Ramírez, Á., J. García-Torrent, and P. J. Aguado. 2009. Determination of parameters used to
prevent ignition of stored materials and to protect against explosions in food industries. Journal
of Hazardous Materials 168(1):115-120.
Ramírez, Á., J. García-Torrent, and A. Tascón. 2010. Experimental determination of self-heating
and self-ignition risks associated with the dusts of agricultural materials commonly stored in
silos. Journal of Hazardous Materials 175(1–3):920-927.
Reddy, P. D., P. R. Amyotte, and M. J. Pegg. 1998. Effect of Inerts on Layer Ignition
Temperatures of Coal Dust. Combustion and Flame 114(1–2):41-53.
Ren, T. X., J. S. Edwards, and D. Clarke. 1999. Adiabatic oxidation study on the propensity of
pulverised coals to spontaneous combustion. Fuel 78(14):1611-1620.
Sadhukhan, A. K., P. Gupta, T. Goyalb, and R. K. Saha. 2008. Modelling of pyrolysis of coal–
biomass blends using thermogravimetric analysis. Bioresource Technology 99 (17):8022–8026.
Salameh, M. G. 2003. Can renewable and unconventional energy sources bridge the global
energy gap in the 21st century? Applied Energy 75(1–2):33-42.
SAS. 2009. SAS User’s Guide: Statistics. Ver. 6a. Cary, N.C.: SAS Institute, Inc
Schmidt, M., C. Lohrer, and U. Krause. 2003. Self-ignition of dust at reduced volume fractions of
ambient oxygen. Journal of Loss Prevention in the Process Industries 16(2):141-147.
Scholtz, G., HJ van der Merwe, and T. Tylutki. 2009. Sample preparation of Medicago sativa L.
hay for chemical analysis. South African Journal of Animal Science. 39(1): 73-76.
Shafiee, S., and E. Topal. 2009. When will fossil fuel reserves be diminished? Energy Policy
37(1):181-189.
Shaw, M. D., C. Karunakaran, and L. G. Tabil. 2009. Physicochemical characteristics of
densified untreated and steam exploded poplar wood and wheat straw grinds. Biosystems
Engineering 103(2):198-207.
Simmons, B. A., D. Loque, and H. W Blanch. 2008. Next-generation biomass feedstocks for
biofuel production. Genome Biology 9(12):9.
Sokhansanj, S., S. Mani, A. Turhollow, A. Kumar, D. Bransby, L. Lynd, and M. Laser. 2009.
Large-scale production, harvest and logistics of switchgrass (Panicum virgatum L.) – current
technology and envisioning a mature technology. Biofuels, Bioproducts and Biorefining 3(2):124-
141.
95
Sweis, F. K. 1998. The effect of admixed material on the ignition temperature of dust layers in
hot environments. Journal of Hazardous Materials 63(1):25-35.
Synnott, E. C., J. B. Glynn, and T. C. Duane. 1984. Minimum ignition temperature of a self-
raising flour on a standard hot-plate. Journal of Food Engineering 3(2):151-160.
Taveau, J. 2012. Secondary dust explosions: How to prevent them or mitigate their effects?
Process Safety Progress 31(1):36-50.
Tumuluru, J. S., C. T. Wright, K. L. Kenney, and J. R. Hess. 2010. A Technical Review on
Biomass Processing: Densification, Preprocessing, Modeling, and Optimization. 2010 ASABE
Annual International Meeting.
Vassilev, S. V., D. Baxter, L. K. Andersen, and C. G. Vassileva. 2010. An overview of the
chemical composition of biomass. Fuel 89(5):913-933.
Vordebrueggen, J.B. 2011. Imperial sugar refinery combustible dust explosion investigation.
Process Safety Progress 30(1): 66-81.
Wang, H., B. Z. Dlugogorski, and E. M. Kennedy. 1998. Low-temperature oxidation of coal at
elevated pressures. Journal of Loss Prevention in the Process Industries 11(6):373-381.
Wei, M., S. Patadia, and D. M. Kammen. 2010. Putting renewables and energy efficiency to
work: How many jobs can the clean energy industry generate in the U.S. Energy Policy
38(2):919-931.
Weiland, P. 2010. Biogas production: current state and perspectives. Applied Microbiology and
Biotechnology 85(4):849-860.
Williams, T. M., and C. A. Gresham. 2006. Biomass accumulation in rapidly growing loblolly
pine and sweetgum. Biomass and Bioenergy 30(4):370-377.
Wypych, P., D. Cook, and P. Cooper. 2005. Controlling dust emissions and explosion hazards in
powder handling plants. Chemical Engineering and Processing: Process Intensification
44(2):323-326.
Yusuf, N.N.A.N., S.K. Kamarudin and Z. Yaakub. 2011. Overview on the current trends in
biodiesel production. Energy Conversion and Management. 52 (7):2741–2751.
Zhang, L., C. Xu, and P. Champagne. 2010. Overview of recent advances in thermo-chemical
conversion of biomass. Energy Conversion and Management 51(5):969-982.
Zhang, Q., J. Chang, T. Wang, and Y. Xu. 2007. Review of biomass pyrolysis oil properties and
upgrading research. Energy Conversion and Management 48(1):87-92.
Zhu, J. Y., and X. J. Pan. 2010. Woody biomass pretreatment for cellulosic ethanol production:
Technology and energy consumption evaluation. Bioresource Technology 101(13):4992-5002.

96
Appendix A -Amount of Dust Generated, Energy Required for Grinding and
Physicochemical Properties Data
Table A.1 Amount of Dust Generated at different wood chip’s moisture content and
hammer mill screen sizes
Moisture
Level
Screen
Size (mm)
Dust
Generated
Mean (%) Standard
Deviation
(% w.b.) (%) (%.)
21.18
4.7 1.2 22.22 21.70 0.74
11.84
14.7 1.2 10.98 11.41 0.61
5.43
23.6 1.2 5.43 5.43 0.00
9.62
4.7 3.18 10.59 10.11 0.69
8.75
14.7 3.18 8.62 8.69 0.09
4.69
23.6 3.18 3.81 4.25 0.62
11.32
4.7 6.35 16.95 14.14 3.98
9.37
14.7 6.35 9.88 9.63 0.36
5.47
23.6 6.35 5.11 5.29 0.25
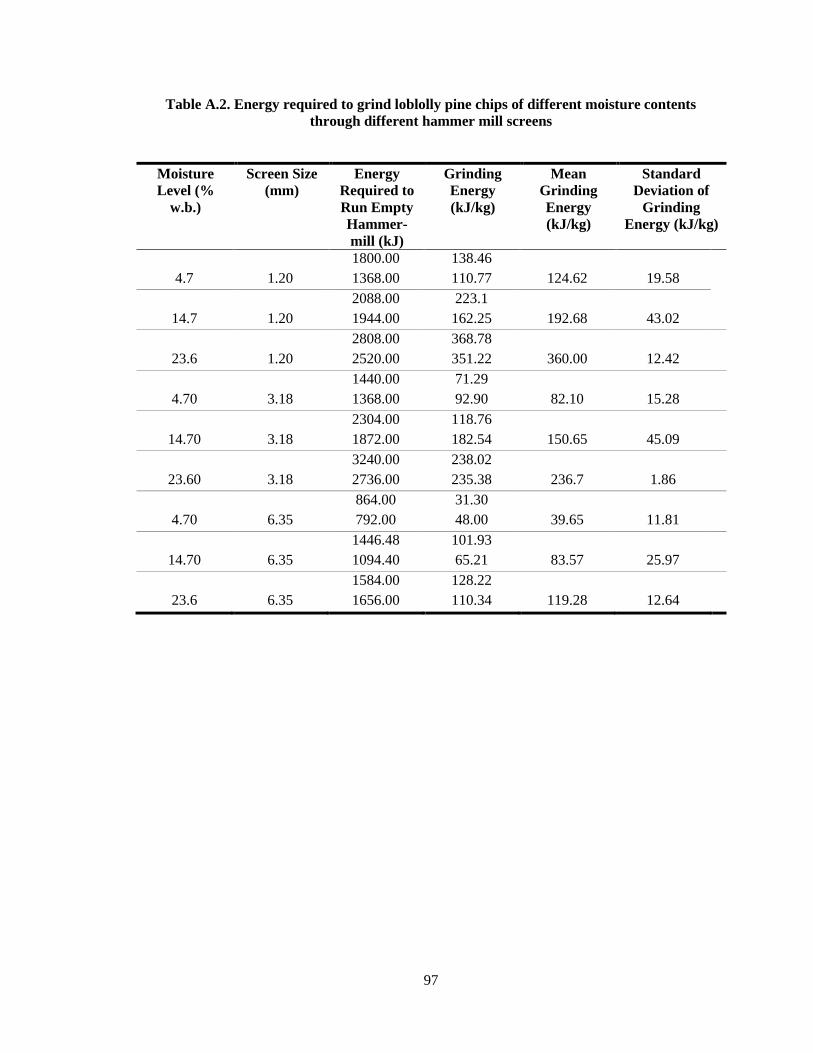
97
Table A.2. Energy required to grind loblolly pine chips of different moisture contents
through different hammer mill screens
Moisture
Level (%
w.b.)
Screen Size
(mm)
Energy
Required to
Run Empty
Hammer-
mill (kJ)
Grinding
Energy
(kJ/kg)
Mean
Grinding
Energy
(kJ/kg)
Standard
Deviation of
Grinding
Energy (kJ/kg)
1800.00 138.46
4.7 1.20 1368.00 110.77 124.62 19.58
2088.00 223.1
14.7 1.20 1944.00 162.25 192.68 43.02
2808.00 368.78
23.6 1.20 2520.00 351.22 360.00 12.42
1440.00 71.29
4.70 3.18 1368.00 92.90 82.10 15.28
2304.00 118.76
14.70 3.18 1872.00 182.54 150.65 45.09
3240.00 238.02
23.60 3.18 2736.00 235.38 236.7 1.86
864.00 31.30
4.70 6.35 792.00 48.00 39.65 11.81
1446.48 101.93
14.70 6.35 1094.40 65.21 83.57 25.97
1584.00 128.22
23.6 6.35 1656.00 110.34 119.28 12.64
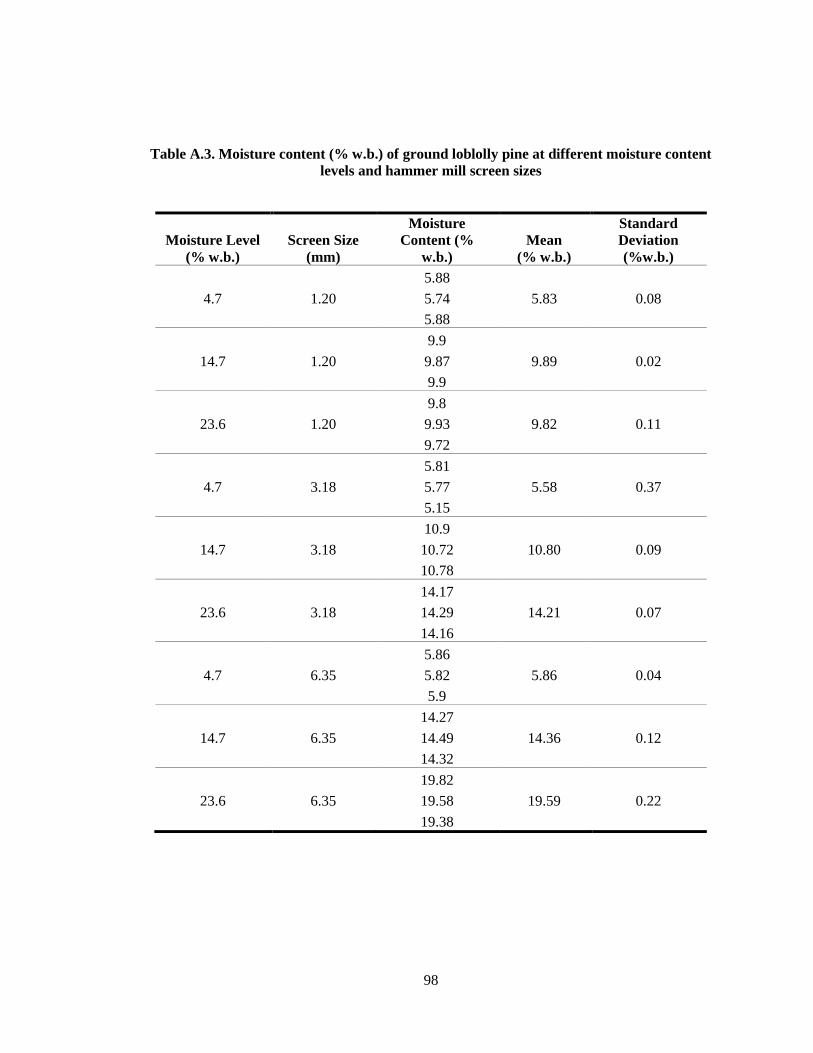
98
Table A.3. Moisture content (% w.b.) of ground loblolly pine at different moisture content
levels and hammer mill screen sizes
Moisture Level
(% w.b.)
Screen Size
(mm)
Moisture
Content (%
w.b.)
Mean
(% w.b.)
Standard
Deviation
(%w.b.)
5.88
4.7 1.20 5.74 5.83 0.08
5.88
9.9
14.7 1.20 9.87 9.89 0.02
9.9
9.8
23.6 1.20 9.93 9.82 0.11
9.72
5.81
4.7 3.18 5.77 5.58 0.37
5.15
10.9
14.7 3.18 10.72 10.80 0.09
10.78
14.17
23.6 3.18 14.29 14.21 0.07
14.16
5.86
4.7 6.35 5.82 5.86 0.04
5.9
14.27
14.7 6.35 14.49 14.36 0.12
14.32
19.82
23.6 6.35 19.58 19.59 0.22
19.38

99
Table A.4. Bulk Density kg/m3 of ground loblolly pine at different levels of moisture content
and hammer mill screen sizes.
Moisture Level
(%w.b.)
Screen Size
(mm)
Bulk Density
(kg/m3)
Mean
(kg/m3)
Standard
Deviation (kg/m3)
225.96
4.7 1.20 222.44 224.27 1.77
224.42
274.28
14.7 1.20 274.10 273.36 1.44
271.70
252.65
23.6 1.20 258.10 256.02 2.95
257.31
218.70
4.7 3.18 219.93 218.82 1.06
217.82
251.79
14.7 3.18 252.84 253.01 1.31
254.40
227.93
23.6 3.18 230.40 228.84 1.35
228.20
221.25
4.7 6.35 221.16 220.52 1.19
219.14
231.55
14.7 6.35 230.86 233.26 3.58
237.38
205.68
23.6 6.35 204.10 206.15 2.32
208.67

100
Table A.5. Particle Density (kg/m3) of ground loblolly pine at different levels of moisture
content and hammer mill screen sizes
Moisture Level
(% w.b.)
Screen
Size (mm)
Particle
Density
(kg/m3)
Mean
(kg/m3)
Standard
Deviation (kg/m3)
1458.20
4.7 1.20 1457.30 1457.75 0.64
1401.50
14.7 1.20 1413.20 1407.35 42.57
1469.90
23.6 1.20 1470.00 1469.95 0.07
1451.70
4.7 3.18 1450.19 1450.95 1.07
1401.30
14.7 3.18 1412.00 1406.65 7.57
1467.00
23.6 3.18 1468.90 1467.95 1.34
1439.30
4.7 6.35 1430.20 1434.75 6.43
1411.80
14.7 6.35 1397.30 1404.55 10.25
1453.40
23.6 6.35 1454.30 1453.85 0.64

101
Table A.6. Ash Content (% d.b.) of loblolly pine chips at different levels of moisture content
and hammer mill screen sizes
Moisture
Level (%
w.b.)
Screen Size
(mm)
Ash Content
(% d.b.)
Mean
(%d.b.)
Standard
Deviation (%
d.b.)
0.58
4.7 1.20 0.47 0.53 0.08
0.66
14.7 1.20 0.56 0.61 0.07
0.75
23.6 1.20 0.67 0.71 0.06
0.50
4.7 3.18 0.41 0.45 0.06
0.50
14.7 3.18 0.72 0.61 0.15
0.46
23.6 3.18 0.59 0.52 0.09
0.59
4.7 6.35 0.40 0.50 0.13
0.45
14.7 6.35 0.43 0.44 0.01
0.39
23.6 6.35 0.47 0.43 0.06

102
Table A.7. Volatile Content (% d.b.) of ground loblolly pine chips at different levels of
moisture content and hammer mill screen sizes
Moisture
Level (%
w.b.)
Screen Size
(mm)
Volatile
Content
(% d.b.)
Mean
(% d.b.)
Standard Deviation
(% d.b.)
82.96
4.7 1.20 83.45 83.21 0.35
82.21
14.7 1.20 82.56 82.39 0.25
82.59
23.6 1.20 82.91 82.75 0.23
82.42
4.7 3.18 82.87 82.65 0.32
82.70
14.7 3.18 83.05 82.87 0.25
82.55
23.6 3.18 83.04 82.79 0.35
82.28
4.7 6.35 81.77 82.02 0.36
82.17
14.7 6.35 82.13 82.15 0.02
83.53
23.6 6.35 83.01 83.27 0.37

103
Table A.8. Energy Content (kg/m3) of ground loblolly pine chips at different levels of
moisture content and hammer mill screen sizes
Moisture Level
(% w.b.)
Screen
Size (mm)
Energy
Content
(MJ/kg)
Mean
(MJ/kg)
Standard Deviation
(MJ/kg)
20.57
4.7 1.20 20.90 20.73 0.23
20.53
14.7 1.20 20.40 20.46 0.10
20.69
23.6 1.20 20.53 20.61 0.12
20.67
4.7 3.18 20.88 20.78 0.15
20.68
14.7 3.18 20.54 20.61 0.10
20.83
23.6 3.18 20.86 20.85 0.02
20.80
4.7 6.35 20.74 20.77 0.04
20.83
14.7 6.35 20.64 20.73 0.14
21.96
23.6 6.35 22.04 22.00 0.06

104
Table A.9. Moisture content (% d.b.) of loblolly pine dust at different levels of moisture
content and hammer mill screen sizes
Moisture
Level (% w.b.)
Screen Size
(mm)
Moisture
Content
(% w.b.)
Mean
(% w.b.)
Standard
Deviation
(% w.b.)
6.39
4.7 1.20 6.72 6.51 0.18
6.43
9.85
14.7 1.20 10.01 9.96 0.10
10.03
9.38
23.6 1.20 9.36 9.37 0.01
9.37
6.72
4.7 3.18 6.52 6.53 0.19
6.34
9.99
14.7 3.18 10.01 10.00 0.01
10.01
12.67
23.6 3.18 12.08 12.24 0.37
11.98
6.39
4.7 6.35 6.70 6.49 0.19
6.37
12.3
14.7 6.35 12.58 12.44 0.14
12.43
14.22
23.6 6.35 15.24 14.57 0.58
14.26
\

105
Table A.10. Bulk Density (kg/m3) of loblolly pine dust at different levels of moisture content
and hammer mill screen sizes
Moisture
Level (% w.b.)
Screen Size
(mm)
Bulk Density
(kg/m3)
Mean
(kg/m3)
Standard
Deviation
(kg/m3)
162.72
4.7 1.20 163.05 163.54 1.15
164.85
216.59
14.7 1.20 213.92 215.96 1.81
217.38
211.54
23.6 1.20 213.32 211.76 1.46
210.42
163.84
4.7 3.18 163.45 164.09 0.79
164.97
211.56
14.7 3.18 215.08 213.32 1.76
213.32
214.65
23.6 3.18 217.82 214.42 3.52
210.78
174.51
4.7 6.35 176.92 175.80 1.21
175.97
198.65
14.7 6.35 195.57 197.30 1.58
197.69
178.07
23.6 6.35 183.96 181.07 2.95
181.20

106
Table A.11. Particle Density (kg/m3) of loblolly pine dust at different levels of moisture
content and hammer mill screen sizes
Moisture
Level
(% w.b.)
Screen Size
(mm)
Particle
Density
(kg/m3)
Mean
(kg/m3)
Standard
Deviation
(kg/m3)
1468.1
4.7 1.2 1469.7 1468.90 1.13
1425.5
14.7 1.2 1427.4 1426.45 1.34
1491.1
23.6 1.2 1487.8 1489.45 2.33
1466.9
4.7 3.18 1500.2 1483.55 23.55
1426.1
14.7 3.18 1428.4 1427.25 1.63
1493.6
23.6 3.18 1500.4 1497.00 4.81
1449.6
4.7 6.35 1466 1457.80 11.60
1447.5
14.7 6.35 1457.7 1452.60 7.21
1514.4
23.6 6.35 1514.4 1514.40 0.00
Table A.12. Ash content (% d.b.) of loblolly pine dust at different levels of moisture content
and hammer mill screen sizes
Moisture Level
(% w.b.)
Screen Size
(mm)
Ash
Content
(% d.b.)
Mean
(% d.b.)
Standard
Deviation
(% d.b.)
0.81
4.70 1.20 0.86 0.84 0.04
1.63
14.70 1.20 1.63 1.63 0.00
1.33
23.60 1.20 1.88 1.61 0.39
1.03
4.70 3.18 0.91 0.97 0.08
2.95
14.70 3.18 2.83 2.89 0.08
2.15
23.60 3.18 2.10 2.13 0.04
1.76
4.70 6.35 1.88 1.82 0.08
5.36
14.70 6.35 5.73 5.55 0.26
5.77
23.60 6.35 5.66 5.72 0.08
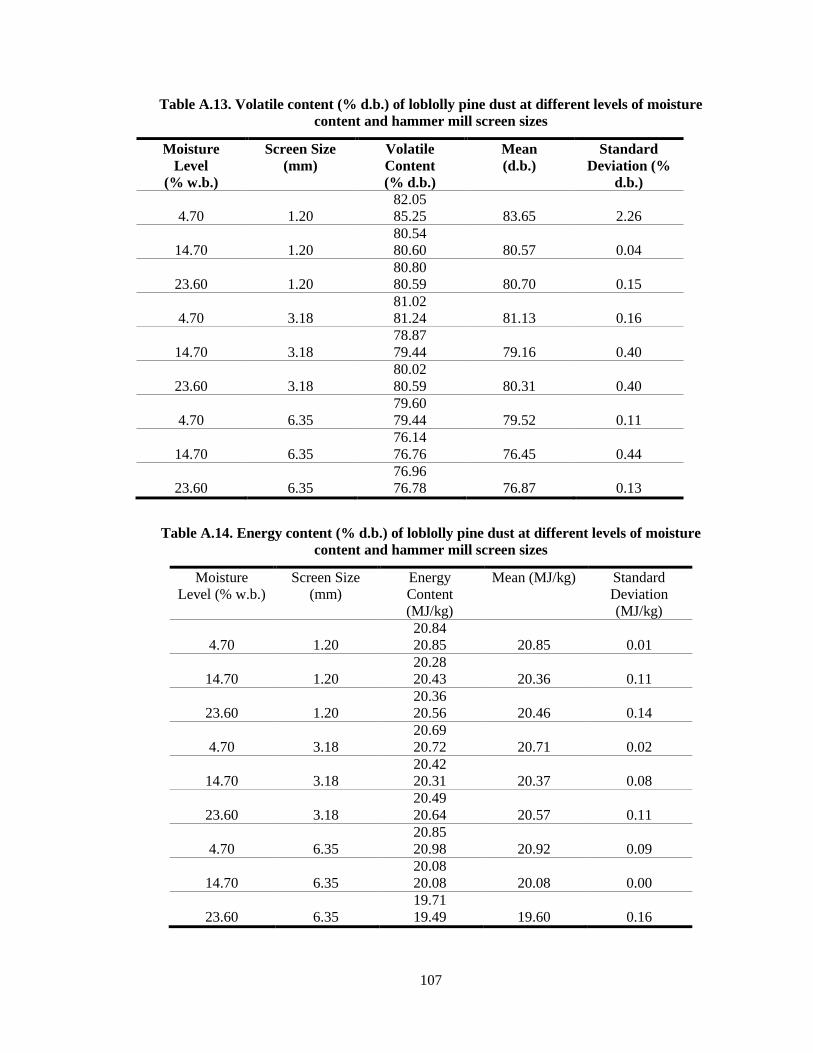
107
Table A.13. Volatile content (% d.b.) of loblolly pine dust at different levels of moisture
content and hammer mill screen sizes
Moisture
Level
(% w.b.)
Screen Size
(mm)
Volatile
Content
(% d.b.)
Mean
(d.b.)
Standard
Deviation (%
d.b.)
82.05
4.70 1.20 85.25 83.65 2.26
80.54
14.70 1.20 80.60 80.57 0.04
80.80
23.60 1.20 80.59 80.70 0.15
81.02
4.70 3.18 81.24 81.13 0.16
78.87
14.70 3.18 79.44 79.16 0.40
80.02
23.60 3.18 80.59 80.31 0.40
79.60
4.70 6.35 79.44 79.52 0.11
76.14
14.70 6.35 76.76 76.45 0.44
76.96
23.60 6.35 76.78 76.87 0.13
Table A.14. Energy content (% d.b.) of loblolly pine dust at different levels of moisture
content and hammer mill screen sizes
Moisture
Level (% w.b.)
Screen Size
(mm)
Energy
Content
(MJ/kg)
Mean (MJ/kg) Standard
Deviation
(MJ/kg)
20.84
4.70 1.20 20.85 20.85 0.01
20.28
14.70 1.20 20.43 20.36 0.11
20.36
23.60 1.20 20.56 20.46 0.14
20.69
4.70 3.18 20.72 20.71 0.02
20.42
14.70 3.18 20.31 20.37 0.08
20.49
23.60 3.18 20.64 20.57 0.11
20.85
4.70 6.35 20.98 20.92 0.09
20.08
14.70 6.35 20.08 20.08 0.00
19.71
23.60 6.35 19.49 19.60 0.16

108
Appendix B Results of Objective 1 and Objective 2
Table B.1. Amount of dust generated (%) at different moisture content and screen size
Moisture
Content
(% w.b.)
Screen Size
1.20 mm
Screen Size
3.18 mm
Screen Size
6.35 mm
4.7
14.7
23.6
21.70a,a
10.10a,b
14.13a,b
11.41b,a
8.68a,b
9.63a,b
5.431c,a
4.246b,a
5.290a,a
Subscripts under the values shows the comparison of means according to Tukey test
First alphabet shows the comparison of means according to moisture content of wood chips
Second alphabet shows the comparison of means according to screen sizes of hammer mill
Table B.2. Grinding energy at different moisture content and screen size
Moisture Content
(%w.b.)
Screen Size
1.20 mm
Screen Size
3.18 mm
Screen Size
6.35 mm
4.7
14.7
23.6
473.08a,c
760.56b,b
1009.76c,c
371.77a,b
651.84b,b
767.55b,b
168.26a,a
290.13a,a
333.52b,a
Subscripts under the values shows the comparison of means according to Tukey test
First alphabet shows the comparison of means according to moisture content of wood chips
Second alphabet shows the comparison of means according to screen sizes of hammer mill

109
Table B.3. Desired MC of loblolly pine chips for experiment, actual MC of loblolly pine
chips that was obtained, MC of ground loblolly pine and MC of dust
Desired MC
of wood
chips
(%w.b.)
Actual MC
of wood
chips
(%w.b.)
Screen Size
(mm)
MC of
Ground
Material
(% w.b.)
MC of Dust
(% w.b.)
MC
Designation
5
15
25
4.7
1.20
3.18
6.35
5.83a,a
5.58a,a
5.86a,a
6.51a,a
6.53a,a
6.49a,a
LMC
5
15
25
14.7
1.20
3.18
6.35
9.89a,b
10.80b,b
14.36c,b
9.96a,b
10.00a,b
12.44b,b
MMC
5
15
25
23.6
1.20
3.18
6.35
9.81a,b
14.21b,c
19.59c,c
9.37a,c
12.24b,c
14.57c,c
HMC
Subscripts under the values shows the comparison of means according to Tukey test
First alphabet shows the comparison of means according to moisture content of wood chips
Second alphabet shows the comparison of means according to screen sizes of hammer mill
Table B.4. Average particle size (mm) of ground loblolly pine chips and loblolly pine dust.
Material
Moisture Level
Screen Size
1.20 mm
Screen Size 3.18
mm
Screen Size 6.35
mm
Ground Material
LMC
MMC
HMC
0.42±0.34
0.56±0.53
0.48±0.43
0.64±0.62
0.80±0.79
0.86±0.16
1.34±1.32
1.73±1.39
1.97±1.72
Dust
LMC
MMC
HMC
0.34±0.23
0.29±0.18
0.31±0.21
0.23±0.15
0.30±0.20
0.29±0.05
0.38±0.25
0.31±0.21
0.33±0.07

110
Table B.5. Bulk density (kg/m3) of loblolly pine chips and loblolly pine dust.
Material
Moisture
Content of
Wood Chips
(w.b. %)
Screen Size
1.20 mm
Screen Size 3.18
mm
Screen Size 6.35
mm
Ground Material
LMC
MMC
HMC
224.27a,a
273.36a,b
256.02a,c
218.82b,a
253.00b,b
228.84b,c
220.52b,a
233.26c,b
206.15c,c
Dust
LMC
MMC
HMC
163.54a,a
215.96a,b
211.76a,c
164.09a,a
213.322a,b
214.42a,c
175.80b,a
197.30b,b
181.07b,c
Subscripts under the values shows the comparison of means according to Tukey test
First alphabet shows the comparison of means according to moisture content of wood chips
Second alphabet shows the comparison of means according to screen sizes of hammer mill
Table B.6. Particle density (kg/m3) of ground loblolly pine chips and loblolly pine dust.
Material
Moisture
Content of
Wood Chips
(% w.b.)
Screen Size
1.20 mm
Screen Size 3.18
mm
Screen Size 6.35
mm
Ground Material
LMC
MMC
HMC
1457.75a,a
1431.60a,a
1469.95a,a
1450.95a,a
1406.65a,b
1467.95a,a
1434.75b,a
1404.55a,b
1453.85b,a
Dust
LMC
MMC
HMC
1468.90a,a
1426.45a,b
1489.45a,c
1483.55a,b
1427.25a,a
1497.00a,b
1457.80a,a
1452.60b,a
1514.40b,b
Subscripts under the values shows the comparison of means according to Tukey test
First alphabet shows the comparison of means according to moisture content of wood chips
Second alphabet shows the comparison of means according to screen sizes of hammer mill

111
Table B.7. Ash content (% d.b.) of ground loblolly pine chips and loblolly pine dust.
Material Moisture
Content of
Wood Chips
(% w.b.)
Screen Size
1.20 mm
Screen Size
3.18mm
Screen Size
6.35mm
Ground Material
LMC
MMC
HMC
0.53a,a
0.61a,a
0.71a,a
0.42a,a
0.61a,a
0.52a,a
0.50a,a
0.44a,a
0.43a,a
Dust
LMC
MMC
HMC
0.83a,a
1.63a,a
1.60a,a
0.97a,a
2.89b,b
2.13b,c
1.82b,a
5.89c,b
5.72b,b
Subscripts under the values shows the comparison of means according to Tukey test
First alphabet shows the comparison of means according to moisture content of wood chips
Second alphabet shows the comparison of means according to screen sizes of hammer mill
Table B.8. Volatile content (% d.b.) of ground loblolly pine chips and loblolly pine dust.
Material Moisture
Content of
Wood Chips
(w.b.%)
Screen Size
1.20 mm
Screen Size
3.18 mm
Screen Size
6.35 mm
Ground Material
LMC
MMC
HMC
82.86a,a
82.58a,a
82.39a,a
83.55a,a
83.02a,a
82.55a,a
82.46a,a
82.63a,a
83.88a,b
Dust
LMC
MMC
HMC
84.71a,a
80.57a,a
80.72a,a
81.04a,a
79.15a,b
80.17a,a
79.52a,a
76.46b,b
76.87b,b
Subscripts under the values shows the comparison of means according to Tukey test
First alphabet shows the comparison of means according to moisture content of wood chips
Second alphabet shows the comparison of means according to screen sizes of hammer mill

112
Table B.9. Energy content (MJ/kg) of ground loblolly pine chips and loblolly pine dust
Material
Moisture
Content of
Wood Chips
(w.b.%)
Screen Size
1.20mm
Screen Size
3.18mm
Screen Size
6.35mm
Ground Material
LMC
MMC
HMC
20.76b,a
20.85a,a
20.71b,a
20.45b,a
20.58a,a
20.73b,a
20.60a,a
20.88a,a
22.00a,b
Dust
LMC
MMC
HMC
20.81a,b
20.73a,a
20.87b,a
20.34a,b
20.43a,b
20.07b,a
20.49a,a
20.56a,b
19.61a,c
Subscripts under the values shows the comparison of means according to Tukey test
First alphabet shows the comparison of means according to moisture content of wood chips
Second alphabet shows the comparison of means according to screen sizes of hammer mill

113
Appendix C Physical, Chemcial and Ignition Properties Data of Dust Samples
Table C.1. Physical properties of loblolly pine dust fractions (fine dust, medium dust, coarse
dust), unfractionated loblolly pine dust and lignite coal
Sample Moisture
Content
(% w.b.)
Mean
(%w.b.)
Std.
Dev.
(%w.b.)
Bulk
Density
(kg/m3)
Mean
(kg/m3
)
Std.
Dev.
(kg/m3)
Particle
Density
(kg/m3)
Mean
(kg/m3)
Std.
Dev.
(kg/m3)
9.88 198.63 1454.50
Fine Dust 9.22 9.20 0.69 213.83 208.33 8.43 1432.60 1443.55 15.49
(<90 µm) 8.5 212.52
9.59 177.33 1446.49
Medium
Dust
9.91 9.46 0.53 179.13 179.14 1.83 1450.08 1448.29 2.54
(90-180 µm) 8.88 180.98
8.08 167.55 1420.70
Coarse Dust 8.68 8.73 0.67 167.36 168.92 2.53 1426.60 1423.65 4.17
(180-420
µm)
9.42 171.83
8.45 192.91 1466.59
Loblolly
Pine Dust
7.49 8.16 0.58 197.11 196.21 2.95 1449.38 1457.99 12.16
(<420 µm) 8.53 198.61
5.91 530.99 1489.79
Lignite Coal
Dust
5.49 5.76 0.23 531.64 521.48 17.04 1536.89 1513.34 33.30
(<420 µm) 5.87 501.81

114
Table C.2. Chemical properties of loblolly pine dust fractions (fine dust, medium dust,
coarse dust), unfractionated loblolly pine dust and lignite coal
Sample Ash
Content
(% d.b.)
Mean
(%
d.b.)
Std.
Dev.
(%
d.b.)
Volatile
Matter
(%
d.b.)
Mean
(%
d.b.)
Std.
Dev.
(%
d.b.)
Energy
Content
(MJ/kg)
Mean
(MJ/kg)
Std.
Dev.
(MJ/kg)
1.53 81.50 20.27
Fine Dust 1.62 1.70 0.23 80.90 82.19 1.74 20.17 20.19 0.07
(<90 µm) 1.97 84.17 20.13
1.21 81.50 20.20
Medium Dust
(90-180 µm)
1.18 1.27 0.12 82.63 82.07 0.56 20.33 20.25 0.07
1.40 82.07 20.21
0.66 81.12 18.39
Coarse Dust 0.87 0.76 0.11 87.08 83.94 2.99 20.27 19.68 1.12
(180-420 µm) 0.76 83.63 20.39
1.08 81.50 19.98
Loblolly Pine
Dust
1.07 1.08 0.01 82.84 82.36 0.75 20.13 20.01 0.10
(<420 µm) 1.09 82.75 19.93
19.22 28.32 26.87
Lignite Coal
Dust
19.32 19.22 0.10 32.30 31.00 2.32 26.90 26.94 0.10
(<420 µm) 19.12 32.38 27.06

115
Table C.3. TGA properties of loblolly pine dust fractions (fine dust, medium dust, coarse
dust), unfractionated loblolly pine dust and lignite coal
Sample TOD
(ºC)
Mean
(ºC)
Std.
Dev.
(ºC)
TMW
L (ºC)
Mean
(ºC)
Std.
Dev.
(ºC)
Tch
(ºC)
Mean
(ºC)
Std.
Dev.
(ºC)
Fine Dust 275 325 297
(< 90 µm) 269 272 3.96 325 325 0.53 301 299 3.13
Medium Dust 263 324 307
(90-180 µm) 266 264 2.33 325 324 0.54 302 304 3.22
Coarse Dust 270 325 305
(180-420 µm) 267 268 2.54 326 325 0.57 298 301 4.96
Loblolly Pine
Dust
273 324 292
(<420 µm) 273 273 0.15 324 324 0.35 294 293 0.95
Lignite Coal
Dust
412 490 412
(<420 µm) 407 409 3.77 488 489 1.41 421 417 6.36
Table C.4. Exothermic parameters of loblolly pine dust fractions (fine dust, medium dust,
coarse dust), unfractionated loblolly pine dust and lignite coal
Sample TRE
(ºC)
Mean
(ºC)
Std.
Dev.
(ºC)
Tmax
(ºC)
Mean
(ºC)
Std. Dev.
(ºC)
Fine Dust 246 395
(<90 µm) 238 242 5.71 400 397 3.11
Medium Dust 253 409
(90-180 µm) 253 253 0.28 400 405 6.26
Coarse Dust 262 396
(180-420 µm) 263 262 1.14 399 398 2.14
Loblolly Pine
Dust
234 401
(<420 µm) 248 241 9.79 400 400 0.85
Lignite Coal
Dust
231 455
(<420 µm) 239 235 5.09 450 453 3.42

116
Appendix D SAS Code and ANOVA Results
SAS code to determine the effect of moisture content and screen size
data guri;
input MC Ssize EC;
datalines;
4.7 1.2 20.84
4.7 1.2 20.85
14.7 1.2 20.28
14.7 1.2 20.43
23.6 1.2 20.36
23.6 1.2 20.56
4.7 3.18 20.69
4.7 3.18 20.72
14.7 3.18 20.42
14.7 3.18 20.31
23.6 3.18 20.49
23.6 3.18 20.64
4.7 6.35 20.85
4.7 6.35 20.98
14.7 6.35 20.08
14.7 6.35 20.08
23.6 6.35 19.71
23.6 6.35 19.49
;
Proc anova data=guri;
class MC Ssize;
model EC=MC Ssize;
run;
SAS code to determine the effect of particle size on properties
data guri;
input fraction$ MC;
datalines;
Fine 9.88
Fine 9.22
Fine 8.5
Medium 9.59
Medium 9.91
Medium 8.88
Coarse 8.08
Coarse 8.68
Coarse 9.42
;
Proc anova data=guri;

117
class Types;
model MC=fraction;
run;
Table D.1. ANOVA results of dust generation (DG) as affected by moisture content and
screen size .
The ANOVA Procedure
Dependent Variable: DG
Sum of
Source DF Squares Mean Square F Value Pr > F
Model 4 401.3826667 100.3456667 15.47 <.0001
Error 13 84.3265333 6.4866564
Corrected Total 17 485.7092000
R-Square Coeff Var Root MSE DG Mean
0.826385 25.29187 2.546892 10.07000
Source DF Anova SS Mean Square F Value Pr > F
MC 2 319.9537333 159.9768667 24.66 <.0001
ssize 2 81.4289333 40.7144667 6.28 0.0124

118
Table D.2. ANOVA results of energy required for grinding (ER) as affected by moisture
content and screen size.
The ANOVA Procedure
Dependent Variable: ER
Sum of
Source DF Squares Mean Square F Value Pr > F
Model 4 137878.1976 34469.5494 22.55 <.0001
Error 13 19868.5017 1528.3463
Corrected Total 17 157746.6993
R-Square Coeff Var Root MSE ER Mean
0.874048 25.32665 39.09407 154.3594
Source DF Anova SS Mean Square F Value Pr > F
MC 2 74823.54841 37411.77421 24.48 <.0001
Ssize 2 63054.64914 31527.32457 20.63 <.0001
Table D.3. ANOVA results of bulk density (BD) of ground material as affected by moisture
content and screen size.
The ANOVA Procedure
Dependent Variable: BD
Sum of
Source DF Squares Mean Square F Value Pr > F
Model 4 9310.66497 2327.66624 27.55 <.0001
Error 22 1858.50519 84.47751
Corrected Total 26 11169.17016
R-Square Coeff Var Root MSE BD Mean
0.833604 3.912515 9.191165 234.9170
Source DF Anova SS Mean Square F Value Pr > F
MC 2 4893.650163 2446.825081 28.96 <.0001
Ssize 2 4417.014807 2208.507404 26.14 <.0001

119
Table D.4. ANOVA results of particle density (PD) of ground material as affected by
moisture content and screen size.
The ANOVA Procedure
Dependent Variable: PD
Sum of
Source DF Squares Mean Square F Value Pr > F
Model 4 9158.56669 2289.64167 12.76 0.0002
Error 13 2332.88941 179.45303
Corrected Total 17 11491.45609
R-Square Coeff Var Root MSE PD Mean
0.796989 0.928988 13.39601 1441.999
Source DF Anova SS Mean Square F Value Pr > F
MC 2 7699.753678 3849.876839 21.45 <.0001
Ssize 2 1458.813011 729.406506 4.06 0.0425
Table D.5. ANOVA results of ash contnet of ground material as affected by moisture
content and screen size.
The ANOVA Procedure
Dependent Variable: Ash
Sum of
Source DF Squares Mean Square F Value Pr > F
Model 4 0.09253333 0.02313333 2.50 0.0934
Error 13 0.12006667 0.00923590
Corrected Total 17 0.21260000
R-Square Coeff Var Root MSE Ash Mean
0.435246 18.01942 0.096104 0.533333
Source DF Anova SS Mean Square F Value Pr > F
MC 2 0.01563333 0.00781667 0.85 0.4513
Ssize 2 0.07690000 0.03845000 4.16 0.0401

120
Table D.6. ANOVA results of volatile content (Vc) of ground material as affected by
moisture content and screen size.
The ANOVA Procedure
Dependent Variable: Vc
Sum of
Source DF Squares Mean Square F Value Pr > F
Model 4 1.02942222 0.25735556 1.24 0.3436
Error 13 2.70768889 0.20828376
Corrected Total 17 3.73711111
R-Square Coeff Var Root MSE Vc Mean
0.275459 0.552000 0.456381 82.67778
Source DF Anova SS Mean Square F Value Pr > F
MC 2 0.68307778 0.34153889 1.64 0.2317
Ssize 2 0.34634444 0.17317222 0.83 0.4573
Table D.7. ANOVA results of energy content (EC) of ground material as affected by
moisture content and screen size.
The ANOVA Procedure
Dependent Variable: EC
Sum of
Source DF Squares Mean Square F Value Pr > F
Model 4 1.99613333 0.49903333 4.70 0.0145
Error 13 1.38131667 0.10625513
Corrected Total 17 3.37745000
R-Square Coeff Var Root MSE EC Mean
0.591018 1.564271 0.325968 20.83833
Source DF Anova SS Mean Square F Value Pr > F
MC 2 0.95723333 0.47861667 4.50 0.0326
Ssize 2 1.03890000 0.51945000 4.89 0.0261

121
Table D.8. ANOVA results of bulk density of loblolly pine dust as affected by moisture
content and screen size.
The ANOVA Procedure
Dependent Variable: BD
Sum of
Source DF Squares Mean Square F Value Pr > F
Model 4 9704.88261 2426.22065 25.42 <.0001
Error 22 2099.83848 95.44720
Corrected Total 26 11804.72110
R-Square Coeff Var Root MSE BD Mean
0.822119 5.061248 9.769708 193.0296
Source DF Anova SS Mean Square F Value Pr > F
MC 2 8774.046696 4387.023348 45.96 <.0001
Ssize 2 930.835919 465.417959 4.88 0.0177
Table D.9. ANOVA results of particle density of loblolly pine dust as affected by moisture
content and screen size.
The ANOVA Procedure
Dependent Variable: PD
Sum of
Source DF Squares Mean Square F Value Pr > F
Model 4 13173.70333 3293.42583 17.51 <.0001
Error 13 2444.73667 188.05667
Corrected Total 17 15618.44000
R-Square Coeff Var Root MSE PD Mean
0.843471 0.933772 13.71338 1468.600
Source DF Anova SS Mean Square F Value Pr > F
MC 2 12636.37000 6318.18500 33.60 <.0001
Ssize 2 537.33333 268.66667 1.43 0.2749

122
Table D.10. ANOVA results of ash content of loblolly pine dust as affected by moisture
content and screen size.
The ANOVA Procedure
Dependent Variable: Ash
Sum of
Source DF Squares Mean Square F Value Pr > F
Model 4 46.87038889 11.71759722 20.70 <.0001
Error 13 7.35870556 0.56605427
Corrected Total 17 54.22909444
R-Square Coeff Var Root MSE Ash Mean
0.864303 29.26861 0.752366 2.570556
Source DF Anova SS Mean Square F Value Pr > F
MC 2 16.82897778 8.41448889 14.87 0.0004
Ssize 2 30.04141111 15.02070556 26.54 <.0001
Table D.11. ANOVA results of volatile content of loblolly pine dust as affected by moisture
content and screen size.
The ANOVA Procedure
Dependent Variable: VC
Sum of
Source DF Squares Mean Square F Value Pr > F
Model 4 112.3601333 28.0900333 27.32 <.0001
Error 13 13.3687167 1.0283628
Corrected Total 17 125.7288500
R-Square Coeff Var Root MSE VC Mean
0.893670 1.266310 1.014082 80.08167
Source DF Anova SS Mean Square F Value Pr > F
MC 2 42.49570000 21.24785000 20.66 <.0001
Ssize 2 69.86443333 34.93221667 33.97 <.0001

123
Table D.12. ANOVA results of volatile content of loblolly pine dust as affected by moisture
content and screen size.
The ANOVA Procedure
Dependent Variable: EC
Sum of
Source DF Squares Mean Square F Value Pr > F
Model 4 1.86775556 0.46693889 7.05 0.0030
Error 13 0.86075556 0.06621197
Corrected Total 17 2.72851111
R-Square Coeff Var Root MSE EC Mean
0.684533 1.259368 0.257317 20.43222
Source DF Anova SS Mean Square F Value Pr > F
MC 2 1.37521111 0.68760556 10.38 0.0020
Ssize 2 0.49254444 0.24627222 3.72 0.0528
Table D.13. ANOVA results of moisture content (MC) of three dust fractions (fine, medium
and coarse).
The ANOVA Procedure
Dependent Variable: MC
Sum of
Source DF Squares Mean Square F Value Pr > F
Model 2 0.82942222 0.41471111 1.03 0.4117
Error 6 2.40966667 0.40161111
Corrected Total 8 3.23908889
R-Square Coeff Var Root MSE MC Mean
0.256067 6.942005 0.633728 9.128889
Source DF Anova SS Mean Square F Value Pr > F
Fraction 2 0.82942222 0.41471111 1.03 0.4117

124
Table D.14. ANOVA results of bulk density of three dust fractions (fine, medium and
coarse).
The ANOVA Procedure
Dependent Variable: BD
Sum of
Source DF Squares Mean Square F Value Pr > F
Model 2 2509.604356 1254.802178 46.67 0.0002
Error 6 161.336200 26.889367
Corrected Total 8 2670.940556
R-Square Coeff Var Root MSE BD Mean
0.939596 2.795985 5.185496 185.4622
Source DF Anova SS Mean Square F Value Pr > F
Fraction 2 2509.604356 1254.802178 46.67 0.0002
Table D.15. ANOVA results of particle density of three dust fractions (fine, medium and
coarse).
The ANOVA Procedure
Dependent Variable: PD
Sum of
Source DF Squares Mean Square F Value Pr > F
Model 2 683.5423000 341.7711500 3.89 0.1469
Error 3 263.6540500 87.8846833
Corrected Total 5 947.1963500
R-Square Coeff Var Root MSE PD Mean
0.721648 0.651701 9.374683 1438.495
Source DF Anova SS Mean Square F Value Pr > F
Fraction 2 683.5423000 341.7711500 3.89 0.1469

125
Table D.16. ANOVA results of ash content of three dust fractions (fine, medium and
coarse).
The ANOVA Procedure
Dependent Variable: Ash
Sum of
Source DF Squares Mean Square F Value Pr > F
Model 2 1.33642222 0.66821111 25.28 0.0012
Error 6 0.15860000 0.02643333
Corrected Total 8 1.49502222
R-Square Coeff Var Root MSE Ash Mean
0.893915 13.06473 0.162583 1.244444
Source DF Anova SS Mean Square F Value Pr > F
Fraction 2 1.33642222 0.66821111 25.28 0.0012
Table D.17. ANOVA results of volatile matter (vc) content of three dust fractions (fine,
medium and coarse).
The ANOVA Procedure
Dependent Variable: VC
Sum of
Source DF Squares Mean Square F Value Pr > F
Model 2 6.61126667 3.30563333 0.81 0.4897
Error 6 24.60713333 4.10118889
Corrected Total 8 31.21840000
R-Square Coeff Var Root MSE VC Mean
0.211775 2.447791 2.025139 82.73333
Source DF Anova SS Mean Square F Value Pr > F
Fraction 2 6.61126667 3.30563333 0.81 0.4897

126
Table D.18. ANOVA results of energy content (EC) of three dust fractions (fine, medium
and coarse).
The ANOVA Procedure
Dependent Variable: EC
Sum of
Source DF Squares Mean Square F Value Pr > F
Model 2 0.57726667 0.28863333 0.68 0.5406
Error 6 2.53713333 0.42285556
Corrected Total 8 3.11440000
R-Square Coeff Var Root MSE EC Mean
0.185354 3.244877 0.650273 20.04000
Source DF Anova SS Mean Square F Value Pr > F
Fraction 2 0.57726667 0.28863333 0.68 0.5406
Table D.19. ANOVA results of temperature of volatilization (TOD) of three dust fractions
(fine, medium and coarse).
The ANOVA Procedure
Dependent Variable: TOD
Sum of
Source DF Squares Mean Square F Value Pr > F
Model 2 56.33333333 28.16666667 3.13 0.1844
Error 3 27.00000000 9.00000000
Corrected Total 5 83.33333333
R-Square Coeff Var Root MSE TOD Mean
0.676000 1.118012 3.000000 268.3333
Source DF Anova SS Mean Square F Value Pr > F
Fraction 2 56.33333333 28.16666667 3.13 0.1844

127
Table D.20. ANOVA results of temperature of maximum mass loss rate (TMWL) of three
dust fractions (fine, medium and coarse).
The ANOVA Procedure
Dependent Variable: TMWL
Sum of
Source DF Squares Mean Square F Value Pr > F
Model 2 1.00000000 0.50000000 1.50 0.3536
Error 3 1.00000000 0.33333333
Corrected Total 5 2.00000000
R-Square Coeff Var Root MSE TMWL Mean
0.500000 0.177646 0.577350 325.0000
Source DF Anova SS Mean Square F Value Pr > F
Fraction 2 1.00000000 0.50000000 1.50 0.3536
Table D.21. ANOVA results of temperature of oxidation (Tch) of three dust fractions (fine,
medium and coarse).
The ANOVA Procedure
Dependent Variable: Tch
Sum of
Source DF Squares Mean Square F Value Pr > F
Model 2 30.33333333 15.16666667 1.01 0.4617
Error 3 45.00000000 15.00000000
Corrected Total 5 75.33333333
R-Square Coeff Var Root MSE Tch Mean
0.402655 1.283862 3.872983 301.6667
Source DF Anova SS Mean Square F Value Pr > F
Fraction 2 30.33333333 15.16666667 1.01 0.4617

128
Table D.22. ANOVA results of temperature of onset rapid exothermic reaction (TRE) of
three dust fractions (fine, medium and coarse).
The ANOVA Procedure
Dependent Variable: TRE
Sum of
Source DF Squares Mean Square F Value Pr > F
Model 2 421.0000000 210.5000000 19.43 0.0192
Error 3 32.5000000 10.8333333
Corrected Total 5 453.5000000
R-Square Coeff Var Root MSE TRE Mean
0.928335 1.303526 3.291403 252.5000
Source DF Anova SS Mean Square F Value Pr > F
Fraction 2 421.0000000 210.5000000 19.43 0.0192
Table D.23. ANOVA results of maximum temperature during exothermic reaction (Tmax) of
three dust fractions (fine, medium and coarse).
The ANOVA Procedure
Dependent Variable: Tmax
Sum of
Source DF Squares Mean Square F Value Pr > F
Model 2 65.3333333 32.6666667 1.70 0.3203
Error 3 57.5000000 19.1666667
Corrected Total 5 122.8333333
R-Square Coeff Var Root MSE Tmax Mean
0.531886 1.094950 4.377975 399.8333
Source DF Anova SS Mean Square F Value Pr > F
Fraction 2 65.33333333 32.66666667 1.70 0.3203

129
Table D.24. ANOVA results of MC of loblolly pine dust and coal dust.
The ANOVA Procedure
Dependent Variable: MC
Sum of
Source DF Squares Mean Square F Value Pr > F
Model 1 8.64000000 8.64000000 44.46 0.0026
Error 4 0.77733333 0.19433333
Corrected Total 5 9.41733333
R-Square Coeff Var Root MSE MC Mean
0.917457 6.336836 0.440833 6.956667
Source DF Anova SS Mean Square F Value Pr > F
Types 1 8.64000000 8.64000000 44.46 0.0026
Table D.25. ANOVA results of bulk density (Bd) of loblolly pine dust and coal dust.
The ANOVA Procedure
Dependent Variable: BD
Sum of
Source DF Squares Mean Square F Value Pr > F
Model 1 158700.8594 158700.8594 1061.48 <.0001
Error 4 598.0346 149.5087
Corrected Total 5 159298.8940
R-Square Coeff Var Root MSE BD Mean
0.996246 3.407425 12.22737 358.8450
Source DF Anova SS Mean Square F Value Pr > F
Types 1 158700.8593 158700.8593 1061.48 <.0001
Table D.26. ANOVA results of particle density of loblolly pine dust and coal dust.

130
The ANOVA Procedure
Dependent Variable: PD
Sum of
Source DF Squares Mean Square F Value Pr > F
Model 1 3064.176025 3064.176025 4.87 0.1579
Error 2 1257.297050 628.648525
Corrected Total 3 4321.473075
R-Square Coeff Var Root MSE PD Mean
0.709058 1.687655 25.07286 1485.663
Source DF Anova SS Mean Square F Value Pr > F
Types 1 3064.176025 3064.176025 4.87 0.1579
Table D.27. ANOVA results of ash content of loblolly pine dust and coal dust.
The ANOVA Procedure
Dependent Variable: Ash
Sum of
Source DF Squares Mean Square F Value Pr > F
Model 1 493.5894000 493.5894000 97740.5 <.0001
Error 4 0.0202000 0.0050500
Corrected Total 5 493.6096000
R-Square Coeff Var Root MSE Ash Mean
0.999959 0.700132 0.071063 10.15000
Source DF Anova SS Mean Square F Value Pr > F
Types 1 493.5894000 493.5894000 97740.5 <.0001
Table D.28. ANOVA results of volatile matter content (VC) of loblolly pine dust and coal
dust.

131
The ANOVA Procedure
Dependent Variable: VC
Sum of
Source DF Squares Mean Square F Value Pr > F
Model 1 3957.288017 3957.288017 1330.31 <.0001
Error 4 11.898867 2.974717
Corrected Total 5 3969.186883
R-Square Coeff Var Root MSE VC Mean
0.997002 3.042848 1.724737 56.68167
Source DF Anova SS Mean Square F Value Pr > F
Types 1 3957.288017 3957.288017 1330.31 <.0001
Table D.29. ANOVA results of energy content (EC) of loblolly pine dust and coal dust.
The ANOVA Procedure
Dependent Variable: EC
Sum of
Source DF Squares Mean Square F Value Pr > F
Model 1 72.03735000 72.03735000 6774.67 <.0001
Error 4 0.04253333 0.01063333
Corrected Total 5 72.07988333
R-Square Coeff Var Root MSE EC Mean
0.999410 0.439205 0.103118 23.47833
Source DF Anova SS Mean Square F Value Pr > F
Types 1 72.03735000 72.03735000 6774.67 <.0001
Table D.30. ANOVA results of temperature of volatilization (TOD) of loblolly pine dust and
coal dust.
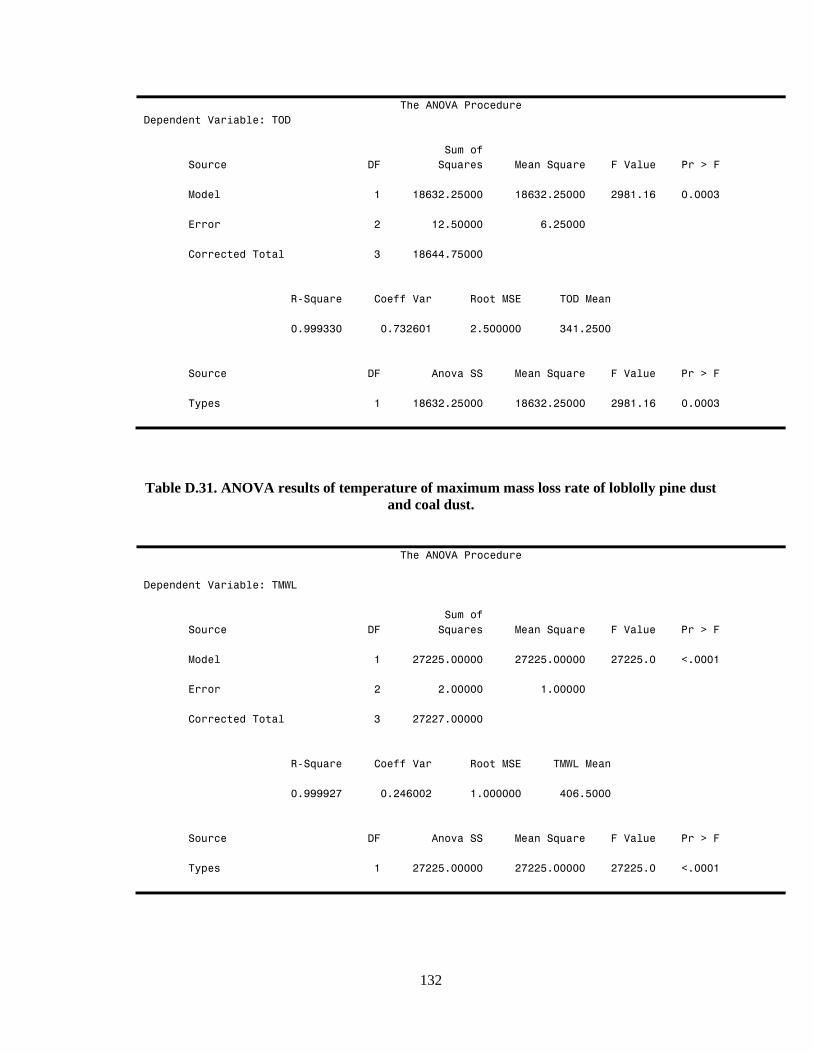
132
The ANOVA Procedure
Dependent Variable: TOD
Sum of
Source DF Squares Mean Square F Value Pr > F
Model 1 18632.25000 18632.25000 2981.16 0.0003
Error 2 12.50000 6.25000
Corrected Total 3 18644.75000
R-Square Coeff Var Root MSE TOD Mean
0.999330 0.732601 2.500000 341.2500
Source DF Anova SS Mean Square F Value Pr > F
Types 1 18632.25000 18632.25000 2981.16 0.0003
Table D.31. ANOVA results of temperature of maximum mass loss rate of loblolly pine dust
and coal dust.
The ANOVA Procedure
Dependent Variable: TMWL
Sum of
Source DF Squares Mean Square F Value Pr > F
Model 1 27225.00000 27225.00000 27225.0 <.0001
Error 2 2.00000 1.00000
Corrected Total 3 27227.00000
R-Square Coeff Var Root MSE TMWL Mean
0.999927 0.246002 1.000000 406.5000
Source DF Anova SS Mean Square F Value Pr > F
Types 1 27225.00000 27225.00000 27225.0 <.0001

133
Table D.32. ANOVA results of temperature of oxidation (Tch) of loblolly pine dust and coal
dust.
The ANOVA Procedure
Dependent Variable: Tch
Sum of
Source DF Squares Mean Square F Value Pr > F
Model 1 15252.25000 15252.25000 717.75 0.0014
Error 2 42.50000 21.25000
Corrected Total 3 15294.75000
R-Square Coeff Var Root MSE Tch Mean
0.997221 1.299442 4.609772 354.7500
Source DF Anova SS Mean Square F Value Pr > F
Types 1 15252.25000 15252.25000 717.75 0.0014
Table D.33. ANOVA results of temperature of rapid exothermic reaction (TRE) of loblolly
pine dust and coal dust.
The ANOVA Procedure
Dependent Variable: TRE
Sum of
Source DF Squares Mean Square F Value Pr > F
Model 1 36.0000000 36.0000000 0.55 0.5343
Error 2 130.0000000 65.0000000
Corrected Total 3 166.0000000
R-Square Coeff Var Root MSE TRE Mean
0.216867 3.387503 8.062258 238.0000
Source DF Anova SS Mean Square F Value Pr > F
Types 1 36.00000000 36.00000000 0.55 0.5343

134
Table D.34. ANOVA results of maximum temperature during exothermic reaction (Tmax) of
loblolly pine dust and coal dust.
The ANOVA Procedure
Dependent Variable: Tmax
Sum of
Source DF Squares Mean Square F Value Pr > F
Model 1 2704.000000 2704.000000 416.00 0.0024
Error 2 13.000000 6.500000
Corrected Total 3 2717.000000
R-Square Coeff Var Root MSE Tmax Mean
0.995215 0.597775 2.549510 426.5000
Source DF Anova SS Mean Square F Value Pr > F
Types 1 2704.000000 2704.000000 416.00 0.0024
k