Embed Size (px)
Citation preview
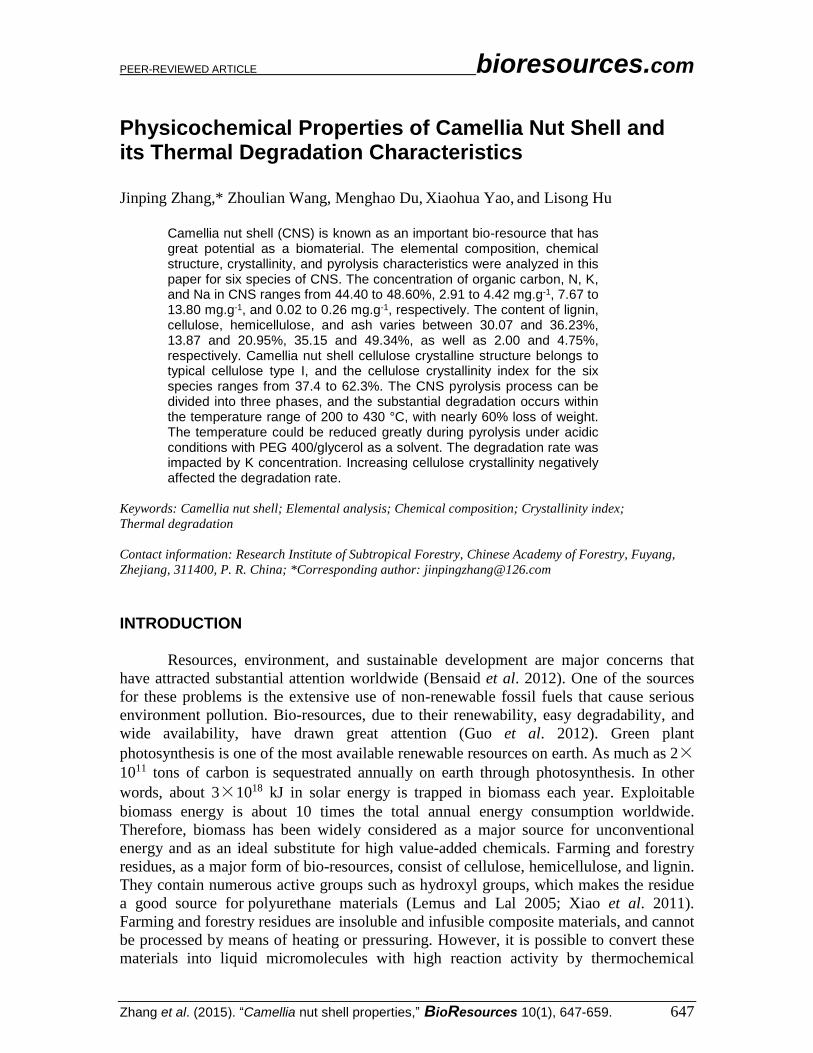
PEER-REVIEWED ARTICLE bioresources.com
Zhang et al. (2015). “Camellia nut shell properties,” BioResources 10(1), 647-659. 647
Physicochemical Properties of Camellia Nut Shell and its Thermal Degradation Characteristics Jinping Zhang,* Zhoulian Wang, Menghao Du, Xiaohua Yao, and Lisong Hu
Camellia nut shell (CNS) is known as an important bio-resource that has great potential as a biomaterial. The elemental composition, chemical structure, crystallinity, and pyrolysis characteristics were analyzed in this paper for six species of CNS. The concentration of organic carbon, N, K, and Na in CNS ranges from 44.40 to 48.60%, 2.91 to 4.42 mg.g-1, 7.67 to 13.80 mg.g-1, and 0.02 to 0.26 mg.g-1, respectively. The content of lignin, cellulose, hemicellulose, and ash varies between 30.07 and 36.23%, 13.87 and 20.95%, 35.15 and 49.34%, as well as 2.00 and 4.75%, respectively. Camellia nut shell cellulose crystalline structure belongs to typical cellulose type I, and the cellulose crystallinity index for the six species ranges from 37.4 to 62.3%. The CNS pyrolysis process can be divided into three phases, and the substantial degradation occurs within the temperature range of 200 to 430 °C, with nearly 60% loss of weight. The temperature could be reduced greatly during pyrolysis under acidic conditions with PEG 400/glycerol as a solvent. The degradation rate was impacted by K concentration. Increasing cellulose crystallinity negatively affected the degradation rate.
Keywords: Camellia nut shell; Elemental analysis; Chemical composition; Crystallinity index;
Thermal degradation
Contact information: Research Institute of Subtropical Forestry, Chinese Academy of Forestry, Fuyang,
Zhejiang, 311400, P. R. China; *Corresponding author: [email protected]
INTRODUCTION
Resources, environment, and sustainable development are major concerns that
have attracted substantial attention worldwide (Bensaid et al. 2012). One of the sources
for these problems is the extensive use of non-renewable fossil fuels that cause serious
environment pollution. Bio-resources, due to their renewability, easy degradability, and
wide availability, have drawn great attention (Guo et al. 2012). Green plant
photosynthesis is one of the most available renewable resources on earth. As much as 2×10¹¹ tons of carbon is sequestrated annually on earth through photosynthesis. In other
words, about 3×10¹⁸ kJ in solar energy is trapped in biomass each year. Exploitable
biomass energy is about 10 times the total annual energy consumption worldwide.
Therefore, biomass has been widely considered as a major source for unconventional
energy and as an ideal substitute for high value-added chemicals. Farming and forestry
residues, as a major form of bio-resources, consist of cellulose, hemicellulose, and lignin.
They contain numerous active groups such as hydroxyl groups, which makes the residue
a good source for polyurethane materials (Lemus and Lal 2005; Xiao et al. 2011).
Farming and forestry residues are insoluble and infusible composite materials, and cannot
be processed by means of heating or pressuring. However, it is possible to convert these
materials into liquid micromolecules with high reaction activity by thermochemical
PEER-REVIEWED ARTICLE bioresources.com
Zhang et al. (2015). “Camellia nut shell properties,” BioResources 10(1), 647-659. 648
processing and to generate new polymer materials for manufacturing adhesives and
molding (Hassan and Shukry 2008; Chen et al. 2009). The ratio of multipurpose
utilization for farming and forestry residues can reach 100% by using thermochemical
conversion technology, which will open up a new era for its high-value utilization.
Camellia refers to a group of species belonging to the Camellia genus under the
Theaceae family, with high oil content in their nuts (Zhang et al. 2012). Camellia has
been known as one of the top four woody oil crops in the world, the other three being oil
palm, olive, and coconut, and it has been cultivated for about 2000 years for oil
production in China and other East and Southeast Asia countries such as Japan,
Myanmar, and Vietnam (Zou and Wu 2009). China has 3.67 million hectares of camellia
plantations that are mainly distributed in 18 provinces in the Yangtze River Basin and
Southern China (Zhou et al. 2013a). The annual production of camellia nut exceeds 3
million tons, with nut shell production accounting for about 60% in weight. Camellia nut
shell (CNS) can be used to extract tannin (Xu et al. 2009), saponin (Hu et al. 2012),
anthocyanin (Xue et al. 2012), brown pigment (Qiu et al. 2009), antioxidants (Jin 2012),
furfural (Yang et al. 2011), and biosorbents (Lu et al. 2011).
However, the majority of CNS is not efficiently utilized at present. Nearly three
million tons of CNS is burned or discarded each year, resulting in great waste and
environmental pollution. Camellia nut shell is in a solid state with low chemical activity.
Its main contents include cellulose, hemicellulose, and lignin as well as a small amount of
saponin, tannins, pigments, and ash (Jin 2012). The content and structures of these
substances in CNS play a great role in the selection of liquid agents and catalysts in CNS
thermochemical conversion processing. Camellia nut shell components and their
percentage have big effects on the structure of liquefied products. For example, the
concentration of K, Na, and N directly affect the application of liquefied products (Tong
2005; Ye 2005). The content of cellulose, hemicellulose, and lignin, as well as their
thermal degradation characteristics, determine the selection of reaction parameters in
liquefaction processing (Kim 2010). Thermal decomposition of cellulose seems to be
more complicated since the amorphous zone is more active than the crystalline zone, and
the degree of polymerization of the native celluloses depends on the raw materials. In this
study, six camellia species were selected, i.e., Camellia oleifera Abel, C. eticulate Lindl,
C. semiserrata Chi, C. mairei (Levl.) Melehior, C. meiocarpa Hu, and C. polyodonta
How, which are widely cultivated in camellia production areas in China. The elemental
composition, chemical component, cellulose crystal structure, and thermal degradation
characteristics of their nut shells were analyzed. This study will provide a fundamental
understanding for the liquefaction of CNS and its thermochemical conversion
technology.
EXPERIMENTAL Materials Camellia nut shell samples were obtained from Jinhua, Zhejiang province and
provided by the Camellia Research and Development Center of Chinese Academy of
Forestry. All samples were placed in an oven at 105 °C until the weight became constant.
They were then crushed and sifted through an 80-mesh sieve and stored in a desiccator
for further analysis.

PEER-REVIEWED ARTICLE bioresources.com
Zhang et al. (2015). “Camellia nut shell properties,” BioResources 10(1), 647-659. 649
Methods Elemental analysis
Approximately 5 g of CNS samples for each species were dried by placing them
in an oven at 65 °C for 24 h and then in a desiccator for 20 min. The samples were
weighed with the subtraction method, transferred to a 150-mL Erlenmeyer flask (0.0001
g accuracy), and then boiled with 30 mL of mixed acid. After separation of silicon
dioxide, the concentration of K and Na in the filtrate with constant volume was measured
by atomic absorption spectroscopy SolaaM6 (Thermo Scientific Co., USA) according to
the China Forestry Industry Standards LY/T 1270 (1999) and Su et al. (2013).
For the measurement of N concentration, 0.3-g samples for each species were
dried by placing them in oven at 65 °C for 24 h, weighed with the subtraction method,
and transferred into a Kjeldahl flask (0.0001 g accuracy). Then, 1.0 g of mixed catalyst
was put into the flask and shaken well. Then, 5 mL of concentrated sulfuric acid was
added to the mixture, which was boiled after being set overnight. After cooling, 20 mL of
water was used for dilution and the mixture was set until the liquid was clear. The N
concentration of the liquid was measured using a FOSS Kjeldahl determination apparatus
(FOSS, Denmark) according to the China Forestry Industry Standard LY/T 1269 (1999)
and Su et al. (2013).
For the measurement of organic C concentration, a 0.5-g sample for each species
was weighed with the subtraction method and put into a test tube. Then, 0.1 g of
powdered silver sulfate was added, followed by 5 mL of 0.800 M potassium dichromate
standard solution and 5 mL of concentrated sulfuric acid. After being shaken well, the
mixture was boiled. The solution was used for titration to determine the organic C
concentration according to China Forestry Industry Standards LY/T 1237 (1999) and
Peng et al. (2014). All experiments were repeated three times, and the average values
were used.
Chemical composition analysis
The concentrations of organic extractives, cellulose, hemicellulose, lignin, and
ash were determined based on the national standards GB/T 2677.6 (1994), GB/T 2677.10
(1995), GB/T 2677.9 (1994), GB/T 2677.8 (1994), and GB/T 2677.3 (1993) and the work
of Zhou et al. (2008).
Fourier transform infrared (FT-IR) spectroscopy analysis
The infrared spectra of the CNS powder samples were measured using an FT-IR
spectrometer (Nicolet 560, Thermo Nicolet Corporation; USA), to determine the
functional groups of the CNS. The samples were placed in the sample pool, which was
made from KBr. For each spectrum, a 32-scan adsorption interferogram was collected
with a resolution of 4 cm-1 in the 400 to 4000 cm-1 region at ambient temperature.
Experiments were repeated three times, and crystallization indices were calculated.
X-ray diffraction analysis
Camellia nut shell powder samples passed through an 80-mesh sieve were dried at
50 °C for 6 h and made into thin slices at room temperature. The scanning was carried
out on a Rigaku D/max 2550PC X-ray diffractometer (Japan), with the following
experimental conditions: Cu-target X-ray tube, the nickel plate for CuKβ radiation
elimination, 40 kv tube voltage, 40 mA current, and the 2θ/θ linkage scanning. The X-ray
crystallography index was calculated using Eq. 1,
PEER-REVIEWED ARTICLE bioresources.com
Zhang et al. (2015). “Camellia nut shell properties,” BioResources 10(1), 647-659. 650
CrI= %100002
002
I
II am (1)
where CrI is relative crystallinity (%), I002 is (002) lattice diffraction maximum intensity
angle, and Iam represents 2θ the amorphous background scattering diffraction intensity.
Iam and I002 have the same units.
Thermogravimetric analysis
An SDT Q600 (TA Instruments, USA) simultaneous thermal analyzer was used
for analysis of the loss weight of CNS. The experimentation settings were as follows:
CNS powder samples passed through 80- to 100-mesh sieves, 8 mg in weight, heating
rate at 10 °C·min-1, 99.99% nitrogen atmosphere with a flow rate of 50 mL·min-1, initial
temperature of 30 °C, and termination temperature of 600 °C.
Liquefaction methods
Approximately 80 g of the liquefying agent PEG 400, 20 g of glycerin, and 3 g of
concentrated sulfuric acid were put into a three-necked flask with a stirrer, a reflux
condenser, and a thermometer. The mixture was heated in an oil bath to 100 °C, and then
33 g of powder sample was added. The heating continued until reaching 160 °C and was
maintained for 15 to 150 min, after which the reaction was terminated by cooling the
mixture in cold water.
The liquefied product was dissolved in 80% 1,4-dioxane, filtered with a No. 3
sand core funnel, and washed with 80% 1,4-dioxane until the filtrate was clear. Residue
was dried to a constant weight by placing it in an oven at 105 °C. The liquefaction rate
was calculated using Eq. 2:
Liquefaction rate = %1001
masssample
qualityresidue (2)
RESULTS AND DISCUSSION CNS Elemental Concentrations
The concentrations of K, Na, and N in CNS significantly impact the thermal
degradation characteristics and the application of the degradation products. K and Na
elements are the common catalyzers in the degradation process of CNS that can reduce
the activation energy required by CNS pyrolysis, and these make the process more
complicated (Xu et al. 2012). Furthermore, the concentrations of K and Na in CNS
determine the elemental concentrations in the degradation products. High concentrations
of K+ and Na+ in products may cause a reaction between these ions and isocyanate. In the
preparation process of polyurethane foam, the alternative reaction of polyether polyols
and isocyanates could result in agglomeration and scorching in products. Therefore,
determining the concentrations of K and Na would provide useful information for their
removal from the degradation product (biological polyether polyols). Among the six
species, C. meiocarpa Hu had the highest K concentration (13.80 mg.g-1) and C. eticulate
Lindl had the lowest (7.67 mg.g-1). Sodium concentrations ranged from 0.02 to 0.26
mg.g-1 among the six species. Higher concentrations of K in CNS could catalyze the
PEER-REVIEWED ARTICLE bioresources.com
Zhang et al. (2015). “Camellia nut shell properties,” BioResources 10(1), 647-659. 651
thermal degradation; however, the total content of K+ and Na+ in degradation products
should be less than 0.02 mg.g-1 (Tong 2005; Ye 2005). It is necessary to remove K+ and
Na+ from the degradation products (Table 1). The degradation product containing N is a
good flame retardant, and the degradation product that originated from N-containing
materials can be used to replace the flame retardant polyether polyol. Camellia nut shell
of six species all contained certain amounts of N (Table 1), with the highest concentration
occurring in C. eticulate Lindl (4.42 mg·g-1) and the lowest in C. semiserrata Chia (2.91
mg·g-1), implying that the degradation products of all of these six species CNS could
substitute for the flame retardant polyether polyol. The organic C concentrations of CNS
were similar among the six species, with a range from 44.40% to 48.60% (Table 1).
Table 1. Elemental Composition in Nut Shell of Six Camellia Species
Camellia species K (mg.g-1) Na (mg.g-1) N (mg.g-1) Organic carbon (%)
C. oleifera Abel 8.54 0.03 4.19 48.60 C.eticulate Lindl 7.67 0.02 4.42 46.90
C. semiserrata Chi 8.89 0.05 2.91 44.40 C. mairei (Levl.) Melehior 8.10 0.16 3.53 45.40
C. meiocarpa Hu 13.80 0.06 3.86 45.60 C. polyodonta How 8.64 0.26 4.16 45.50
CNS Chemical Components Camellia nut shell degradation was carried out using acidic, alkaline, or metallic
salt as catalysts or liquid agents under normal pressure (Lu et al. 2013; Tekin and
Karagoz 2013; Zhou et al. 2013b). Low cellulose and high lignin/hemicellulose content
could facilitate the CNS liquefaction in the liquefaction and catalyst system (Kurimoto et
al. 1999). Therefore, the chemical compositions of raw materials would have great
impacts on the liquefaction process.
The main components of CNS were cellulose, hemicellulose, and lignin (Table 2).
The cellulose content of CNS ranged from 13.87% to 20.95%, which is lower than that of
bamboo timber, which ranges from 45% to 69% (Jiang et al. 2008). The content of CNS
hemicellulose varied between 35.15% and 49.34%, which is higher than that of bamboo
timber, which ranges from 15% to 23%. Lignin content varied between 30.07% and
36.23%, higher than that of bamboo timber which ranges from 20% to 25% (Jiang et al.
2008). C. oleifera Abel had the highest content of hemicellulose and lignin combined
(79.41%). The organic extractive accounted for around 2.36 to 4.65% in weight except
for in C. mairei (Levl.) Melehior, which accounted for 7.76%. The ash content in CNS of
six species ranged from 2.00% to 4.75%, which is higher than that in wood (less 1%) and
approximately equivalent to that in bamboo timber (2 to 3%) (Jiang et al. 2008).
Table 2. Chemical Components and Their Percentage in Nut Shell of Six Camellia Species
Camellia species Organic
extractives Cellulose Hemicellulose Lignin Ash
C. oleifera Abel 2.50 18.62 49.34 30.07 2.57 C. eticulate Lindl 2.36 13.95 42.97 36.23 2.00
C. semiserrata Chi 3.53 14.62 45.57 33.82 2.13 C. mairei (Levl.) Melehior 7.76 13.87 39.25 34.15 2.44
C. meiocarpa Hu 4.55 20.95 34.21 31.04 4.75 C. polyodonta How 4.65 15.46 35.15 30.88 2.95
PEER-REVIEWED ARTICLE bioresources.com
Zhang et al. (2015). “Camellia nut shell properties,” BioResources 10(1), 647-659. 652
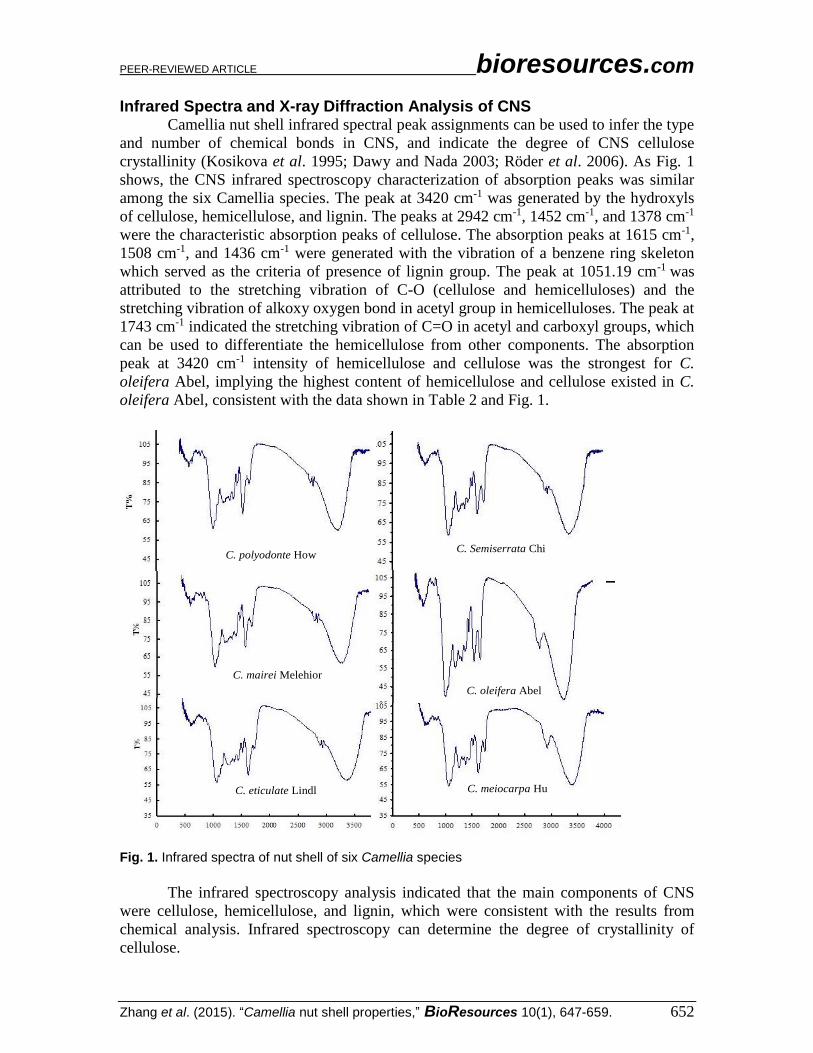
Infrared Spectra and X-ray Diffraction Analysis of CNS Camellia nut shell infrared spectral peak assignments can be used to infer the type
and number of chemical bonds in CNS, and indicate the degree of CNS cellulose
crystallinity (Kosikova et al. 1995; Dawy and Nada 2003; Röder et al. 2006). As Fig. 1
shows, the CNS infrared spectroscopy characterization of absorption peaks was similar
among the six Camellia species. The peak at 3420 cm-1 was generated by the hydroxyls
of cellulose, hemicellulose, and lignin. The peaks at 2942 cm-1, 1452 cm-1, and 1378 cm-1
were the characteristic absorption peaks of cellulose. The absorption peaks at 1615 cm-1,
1508 cm-1, and 1436 cm-1 were generated with the vibration of a benzene ring skeleton
which served as the criteria of presence of lignin group. The peak at 1051.19 cm-1 was
attributed to the stretching vibration of C-O (cellulose and hemicelluloses) and the
stretching vibration of alkoxy oxygen bond in acetyl group in hemicelluloses. The peak at
1743 cm-1 indicated the stretching vibration of C=O in acetyl and carboxyl groups, which
can be used to differentiate the hemicellulose from other components. The absorption
peak at 3420 cm-1 intensity of hemicellulose and cellulose was the strongest for C.
oleifera Abel, implying the highest content of hemicellulose and cellulose existed in C.
oleifera Abel, consistent with the data shown in Table 2 and Fig. 1.
Fig. 1. Infrared spectra of nut shell of six Camellia species
The infrared spectroscopy analysis indicated that the main components of CNS
were cellulose, hemicellulose, and lignin, which were consistent with the results from
chemical analysis. Infrared spectroscopy can determine the degree of crystallinity of
cellulose.
C. mairei Melehior
C. eticulate Lindl
Abel
C. meiocarpa Hu
C. polyodonte How
C. oleifera Abel
C. Semiserrata Chi
C. mairei Melehior
C. eticulate Lindl
Abel
C. meiocarpa Hu
C. polyodonte How
C. oleifera Abel
C. Semiserrata Chi
PEER-REVIEWED ARTICLE bioresources.com
Zhang et al. (2015). “Camellia nut shell properties,” BioResources 10(1), 647-659. 653
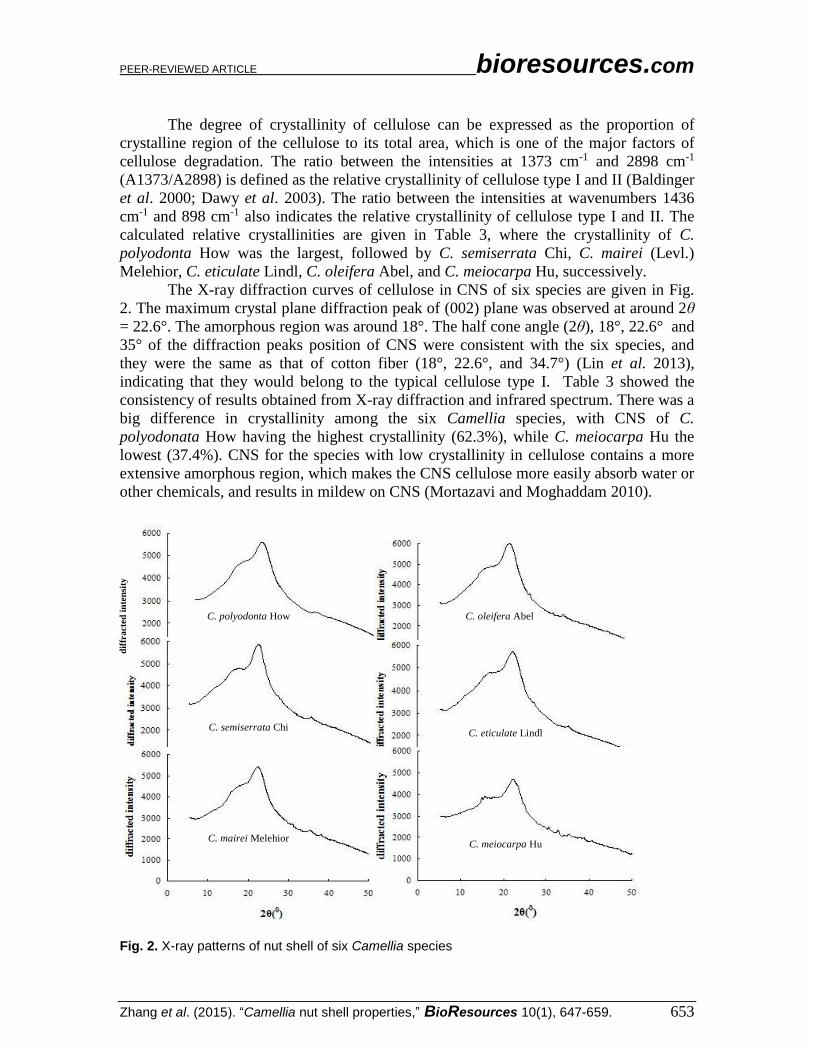
The degree of crystallinity of cellulose can be expressed as the proportion of
crystalline region of the cellulose to its total area, which is one of the major factors of
cellulose degradation. The ratio between the intensities at 1373 cm-1 and 2898 cm-1
(A1373/A2898) is defined as the relative crystallinity of cellulose type I and II (Baldinger
et al. 2000; Dawy et al. 2003). The ratio between the intensities at wavenumbers 1436
cm-1 and 898 cm-1 also indicates the relative crystallinity of cellulose type I and II. The
calculated relative crystallinities are given in Table 3, where the crystallinity of C.
polyodonta How was the largest, followed by C. semiserrata Chi, C. mairei (Levl.)
Melehior, C. eticulate Lindl, C. oleifera Abel, and C. meiocarpa Hu, successively.
The X-ray diffraction curves of cellulose in CNS of six species are given in Fig.
2. The maximum crystal plane diffraction peak of (002) plane was observed at around 2θ
= 22.6°. The amorphous region was around 18°. The half cone angle (2θ), 18°, 22.6° and
35° of the diffraction peaks position of CNS were consistent with the six species, and
they were the same as that of cotton fiber (18°, 22.6°, and 34.7°) (Lin et al. 2013),
indicating that they would belong to the typical cellulose type I. Table 3 showed the
consistency of results obtained from X-ray diffraction and infrared spectrum. There was a
big difference in crystallinity among the six Camellia species, with CNS of C.
polyodonata How having the highest crystallinity (62.3%), while C. meiocarpa Hu the
lowest (37.4%). CNS for the species with low crystallinity in cellulose contains a more
extensive amorphous region, which makes the CNS cellulose more easily absorb water or
other chemicals, and results in mildew on CNS (Mortazavi and Moghaddam 2010).
Fig. 2. X-ray patterns of nut shell of six Camellia species
C. polyodonta How
C. semiserrata Chi
C. mairei Melehior
C. oleifera Abel
C. eticulate Lindl
C. meiocarpa Hu
C. polyodonta How
C. semiserrata Chi
C. mairei Melehior
C. oleifera Abel
C. eticulate Lindl
C. meiocarpa Hu
dif
fra
cte
d i
nte
nsi
ty
PEER-REVIEWED ARTICLE bioresources.com
Zhang et al. (2015). “Camellia nut shell properties,” BioResources 10(1), 647-659. 654
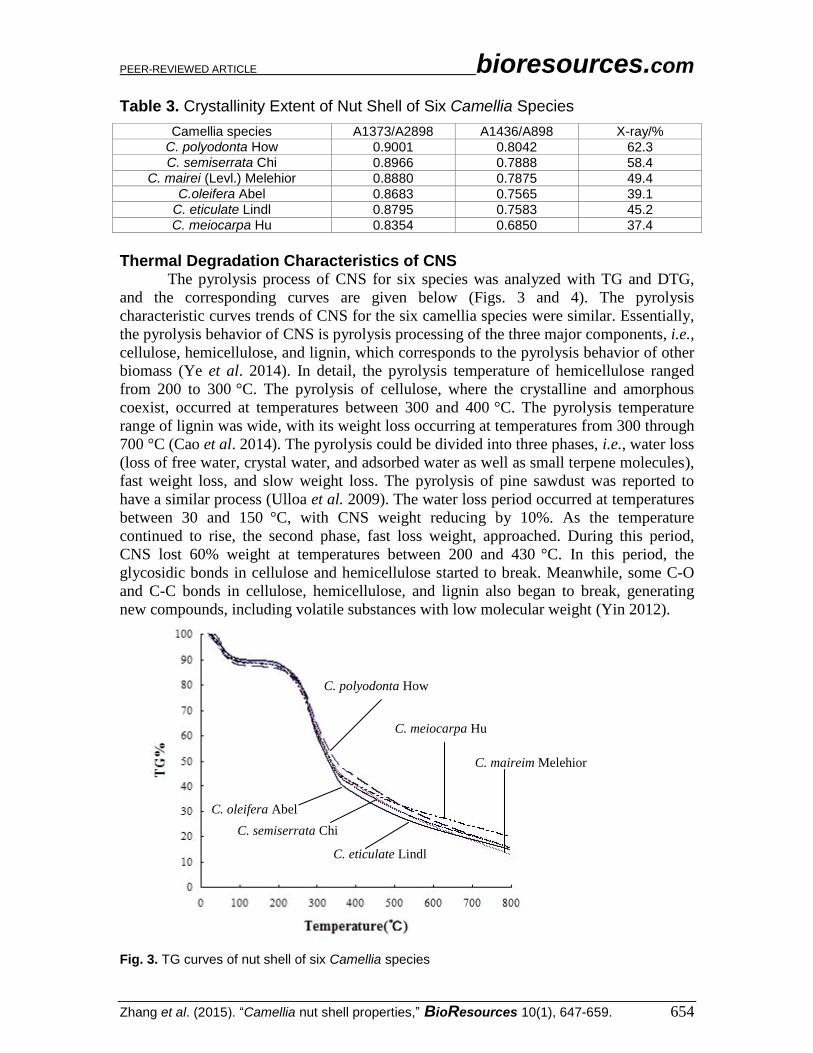
Table 3. Crystallinity Extent of Nut Shell of Six Camellia Species
Camellia species A1373/A2898 A1436/A898 X-ray/% C. polyodonta How 0.9001 0.8042 62.3 C. semiserrata Chi 0.8966 0.7888 58.4
C. mairei (Levl.) Melehior 0.8880 0.7875 49.4 C.oleifera Abel 0.8683 0.7565 39.1
C. eticulate Lindl 0.8795 0.7583 45.2 C. meiocarpa Hu 0.8354 0.6850 37.4
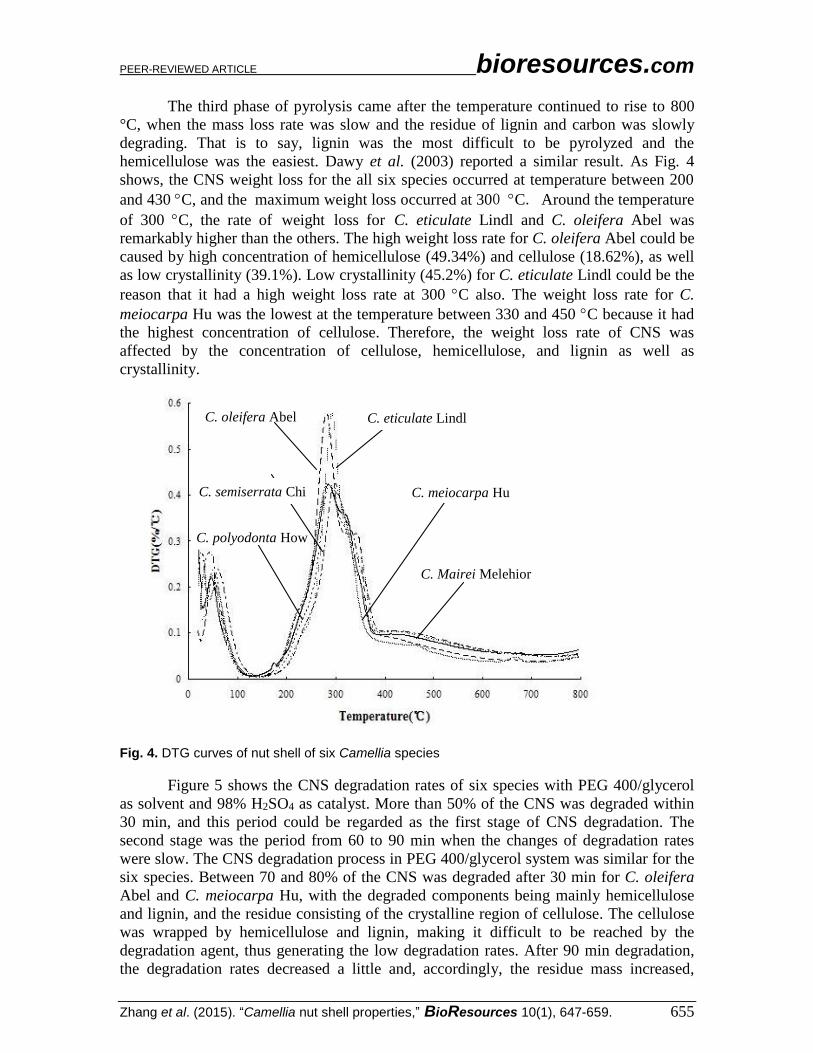
Thermal Degradation Characteristics of CNS
The pyrolysis process of CNS for six species was analyzed with TG and DTG,
and the corresponding curves are given below (Figs. 3 and 4). The pyrolysis
characteristic curves trends of CNS for the six camellia species were similar. Essentially,
the pyrolysis behavior of CNS is pyrolysis processing of the three major components, i.e.,
cellulose, hemicellulose, and lignin, which corresponds to the pyrolysis behavior of other
biomass (Ye et al. 2014). In detail, the pyrolysis temperature of hemicellulose ranged
from 200 to 300 °C. The pyrolysis of cellulose, where the crystalline and amorphous
coexist, occurred at temperatures between 300 and 400 °C. The pyrolysis temperature
range of lignin was wide, with its weight loss occurring at temperatures from 300 through
700 °C (Cao et al. 2014). The pyrolysis could be divided into three phases, i.e., water loss
(loss of free water, crystal water, and adsorbed water as well as small terpene molecules),
fast weight loss, and slow weight loss. The pyrolysis of pine sawdust was reported to
have a similar process (Ulloa et al. 2009). The water loss period occurred at temperatures
between 30 and 150 °C, with CNS weight reducing by 10%. As the temperature
continued to rise, the second phase, fast loss weight, approached. During this period,
CNS lost 60% weight at temperatures between 200 and 430 °C. In this period, the
glycosidic bonds in cellulose and hemicellulose started to break. Meanwhile, some C-O
and C-C bonds in cellulose, hemicellulose, and lignin also began to break, generating
new compounds, including volatile substances with low molecular weight (Yin 2012).
Fig. 3. TG curves of nut shell of six Camellia species
C. polyodonta How
C. meiocarpa Hu
C. maireim Melehior
C. oleifera Abel
C. semiserrata Chi
C. eticulate Lindl
C. polyodonta How
C. meiocarpa Hu
C. maireim Melehior
C. oleifera Abel
C. semiserrata Chi
C. eticulate Lindl
PEER-REVIEWED ARTICLE bioresources.com
Zhang et al. (2015). “Camellia nut shell properties,” BioResources 10(1), 647-659. 655
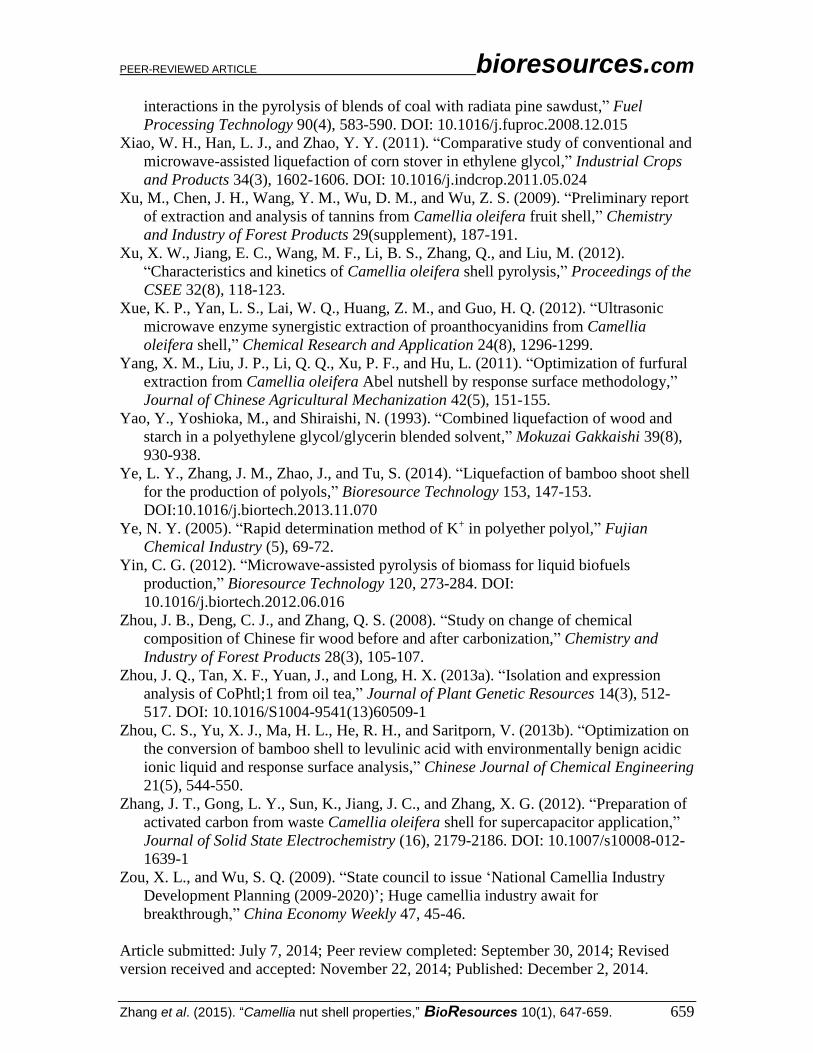
The third phase of pyrolysis came after the temperature continued to rise to 800
°C, when the mass loss rate was slow and the residue of lignin and carbon was slowly
degrading. That is to say, lignin was the most difficult to be pyrolyzed and the
hemicellulose was the easiest. Dawy et al. (2003) reported a similar result. As Fig. 4
shows, the CNS weight loss for the all six species occurred at temperature between 200
and 430 C, and the maximum weight loss occurred at 300 C. Around the temperature
of 300 C, the rate of weight loss for C. eticulate Lindl and C. oleifera Abel was
remarkably higher than the others. The high weight loss rate for C. oleifera Abel could be
caused by high concentration of hemicellulose (49.34%) and cellulose (18.62%), as well
as low crystallinity (39.1%). Low crystallinity (45.2%) for C. eticulate Lindl could be the
reason that it had a high weight loss rate at 300 C also. The weight loss rate for C.
meiocarpa Hu was the lowest at the temperature between 330 and 450 C because it had
the highest concentration of cellulose. Therefore, the weight loss rate of CNS was
affected by the concentration of cellulose, hemicellulose, and lignin as well as
crystallinity.
Fig. 4. DTG curves of nut shell of six Camellia species
Figure 5 shows the CNS degradation rates of six species with PEG 400/glycerol
as solvent and 98% H2SO4 as catalyst. More than 50% of the CNS was degraded within
30 min, and this period could be regarded as the first stage of CNS degradation. The
second stage was the period from 60 to 90 min when the changes of degradation rates
were slow. The CNS degradation process in PEG 400/glycerol system was similar for the
six species. Between 70 and 80% of the CNS was degraded after 30 min for C. oleifera
Abel and C. meiocarpa Hu, with the degraded components being mainly hemicellulose
and lignin, and the residue consisting of the crystalline region of cellulose. The cellulose
was wrapped by hemicellulose and lignin, making it difficult to be reached by the
degradation agent, thus generating the low degradation rates. After 90 min degradation,
the degradation rates decreased a little and, accordingly, the residue mass increased,
C. eticulate LindlC. oleifera Abel
C. semiserrata Chi
C. polyodonta How
C. meiocarpa Hu
C. Mairei Melehior
C. eticulate LindlC. oleifera Abel
C. semiserrata Chi
C. polyodonta How
C. meiocarpa Hu
C. Mairei Melehior

PEER-REVIEWED ARTICLE bioresources.com
Zhang et al. (2015). “Camellia nut shell properties,” BioResources 10(1), 647-659. 656
which can be attributed to the recondensation and reprecipitation of degraded CNS
components (Yao et al. 1993). It can be concluded that a higher content of hemicellulose
and lignin and lower degrees of crystallinity would lead to a higher degradation rate, and
the type degradation agent and catalyst may reduce the temperature of thermal
degradation of cellulose, hemicellulose, and lignin. Efficient degradation of CNS and the
degradation mechanism remain to be studied further.
0
10
20
30
40
50
60
70
80
90
100
0 15 30 45 60 75 90 105 120 135 150 165
Reaction time (min)
Liquefaction rate (%) C. oleifera Abel
C. eticulate Lindl
C. semiserrata Chi
C. mairei (Levl) Melehior
C. meiocarpa Hu
C. polyodonta How
Fig. 5. Time-course of degradation rate of CNS using PEG 400/glycerol system
CONCLUSIONS 1. The contents of cellulose, hemicellulose, and lignin in the nut shells of six Camellia
species were 13.87 to 20.95%, 35.15 to 49.34%, and 30.07 to 36.23%, respectively.
2. Concentrations of K, Na, and N were 7.67 to 13.80 mg.g-1, 0.02 to 0.26 mg.g-1, and
2.91 to 4.42 mg.g-1, respectively.
3. Infrared spectra and X-ray diffraction analysis showed that there is a great difference
in crystallinity among Camellia species. Camellia polyodonta How had the greatest
crystallinity (62.3%), while C. meiocarpa Hu had the lowest (37.4%).
4. The most rapid degradation for camellia nut shells occurred at temperatures around
200 to 430 °C, with 60% of weight loss in a thermogravimetric analyzer. The weight
loss rate of CNS was affected by the concentration of cellulose, hemicellulose, and
lignin as well as the cellulose crystallinity, and degradation rate is negatively related
to cellulose crystallinity significantly.
5. The degradation system containing PEG 400/glycerin and catalyst could reduce the
temperature of thermal degradation of cellulose, hemicellulose, and lignin. The
degradation rate was related to hemicellulose concentration and cellulose crystallinity
in PEG400/Glycerol system, and higher hemicellulose concentration and lower
cellulose crystallinity lead to higher degradation rates.

PEER-REVIEWED ARTICLE bioresources.com
Zhang et al. (2015). “Camellia nut shell properties,” BioResources 10(1), 647-659. 657
ACKNOWLEDGMENTS
The authors are grateful for the financial support from Provincial Department of
Science and Technology of Zhejiang, China, Grant. No. 2013C32096.
REFERENCES CITED
Bensaid, S., Conti, R., and Fino, D. (2012). “Direct liquefaction of lingo-cellulosic
residues for liquid fuel production,” Fuel 94(1), 324-332. DOI:
10.1016/j.fuel.2011.11.053
Baldinger, T., Moobauer, J., and Sixta, H. (2000). “Supermolecular structure of cellulosic
material by Fourier Transform Infrared Spectroscopy calibrated by WAXS and
13CNMR,” Lenzing Berichte79, 15-17.
Cao, X., Zhong, L., Peng, X., Sun, S., Li, S., Liu, S., and Sun, R. (2014). “Comparative
study of the pyrolysis of lignocellulose and its major components: Characterization
and overall distribution of their biochars and volatiles,” Bioresource Technology155,
21-27. DOI:10.1016/j.biortech.2013.12.006.Epub 2013 Dec 11.
Chen, F. G., and Lu, Z. M. (2009). “Liquefaction of wheat straw and preparation of rigid
poly urethane foam from the liquefaction products,” Journal of Applied Polymer
Science 111(1), 508-516. DOI: 10.1002/app.29107
Dawy, M., and Nada, A. A. M. A. (2003). “IR and dielectric analysis of cellulose and its
derivatives,” Polymer-Plastics Technology and Engineering 42(4), 643-658. DOI:
10.1081/PPT-120023100
GB/T 2677.3. (1993). “Fibrous raw material – Determination of ash,” Chinese National
Standardization Management Committee, China.
GB/T 2677.6. (1994). “Fibrous raw material – Determination of solvent extractives,”
Chinese National Standardization Management Committee, China.
GB/T 2677.8. (1994). “Fibrous raw material – Determination of acid-insoluble lignin,”
Chinese National Standardization Management Committee, China.
GB/T 2677.9. (1994). “Fibrous raw material – Determination of pentosan,” Chinese
National Standardization Management Committee, China.
GB/T 2677.10. (1995). “Fibrous raw material – Determination of holocellulose,” Chinese
National Standardization Management Committee, China.
Guo, J. X., Zhuang, Y. B., Chen, L. M., Liu, J. H., Li, D. M., and Ye, N. H. (2012).
“Process optimization for microwave-assisted direct liquefaction of Sargassum
polycystum C. Agardh using response surface methodology,” Bioresource Technology
120, 19-25. DOI: 10.1016/j.biortech.2012.06.013.
Hassan, E., and Shukry, N. (2008). “Polyhydric alcohol liquefaction of some
lignocellulosic agricultural residues,” Industrial Crops and Products 27(1), 33-38.
DOI: 10.1016/j.indcrop.2007.07.004.
Hu, J. L., Nie, S. P., Huang, D. F., Li, C., and Xie, M. Y. (2012). “Extraction of saponin
from Camellia oleifera cake and evaluation of its antioxidant activity,” International
Journal of Food Science & Technology 47(8), 1676-1687. DOI: 10.1111/j.1365-
2621.2012.03020.x
Jiang, J. X., Yang, Z. K., Zhu, L. W., Shi, L. M., and Yan, L. J. (2008). “Structure and
property of bamboo fiber,” Journal of Beijing Forestry University 30, 128-132.
Jin, X. C. (2012). “Bioactivities of water-soluble polysaccharides from fruit shell of

PEER-REVIEWED ARTICLE bioresources.com
Zhang et al. (2015). “Camellia nut shell properties,” BioResources 10(1), 647-659. 658
Camellia oleifera Abel: Antitumor and antioxidant activities,” Carbohydrate
Polymers 87(3), 2198-2201. DOI: 10.1016/j.carbpol.2011.10.047
Kim, S. S., Kim, J., Park, Y. H., and Park, Y. K. (2010). “Pyrolysis kinetics and
decomposition characteristics of pine trees,” Bioresource Technology 101(24), 9797-
9802. DOI:10.1016/j.biortech.2010.07.094
Kurimoto, B. Y., Doi, S. C., and Tamura, Y. S. (1999). “Species effects on wood-
liquefaction in polyhydric alcohols,” Holzforschung 53(6), 617-622. DOI:
10.1515/HF.1999.102
Kosikova, B., Ebringerova, A., and Kacurakova, M. (1995). “Effect of steaming on the
solubility and structural changes of wood lignin-polysaccharide complex,” Cellulose
Chemistry and Technology 29(6), 683-690.
LY/T 1270. (1999). “Determination of total silica iron aluminium calcium magnesium
potassium sodium phosphorus sulphur manganese copper and zinc in forest soil,”
China Forestry Industry Standards, China.
LY/T 1269. (1999). “Determination of total nitrogen in forest plant and forest floor,”
China Forestry Industry Standards, China.
LY/T 1237. (1999). “Determination of organic matter in forest soil and calculation
carbon-nitrogen ratio,” China Forestry Industry Standards, China.
Lemus, R., and Lal, R. (2005). “Bioenergy crops and carbon sequestration,” Critical
Reviews in Plant Science 24(1), 1-21. DOI: 10.1080/07352680590910393
Lin, T., Guo, W. J., Fang, L., and Wang, Z. (2013). “Crystallinity of stalk cotton cellulose
by three methods,” Journal of Northeast Forestry University 41(2), 89-92.
Lu, Y. D., Lin, L. Y., You, R. Y., and Wu, Z. H. (2011). “Camellia oleifera Abel shells
as a new biosorbent to remove methylene blue from aqueous solutions,” Water
Science Technology 64(7), 1566-1571. DOI: 10.2166/wst.2011.657
Lu, Z. X., Zheng, H. Y., Fan, L. W., Liao, Y. Q., Ding, B. J., and Huang, B. (2013).
“Liquefaction of sawdust in 1-octanol using acidic ionic liquids as catalyst,”
Bioresource Technology 142, 579-584. DOI: 10.1016/j.biortech.2013.05.091.
Mortazavi, S. M., and Moghaddam, M. K. (2010). “An analysis of structure and
properties of a natural cellulosic fiber (leafiran),” Fiber and Polymers 11(6), 877-882.
DOI: 10.1007/s12221-010-0877-z
Peng, L., Wang, X. J., Huang, C. D., and Li, K. Z. (2014). “Effects of litter input change
on soil organic carbon in Dendrocalamus affinnis forest,” Bulletin of Soil and Water
Conservation 34(1), 129-132.
Qiu, H. Y., Chen, J. M., and Hu, J. R. (2009). Microwave extraction and stability of
brown pigment from Camellia oleifera shells,” Food Science 30(16), 198-202.
Su, W. H., Feng, H. Y., Fan, S. H., Xu, Q. B., Zhou, J. M., and Yang, S. H. (2013).
“Dynamic changes and accumulation rules of N, P and K contents in winter shoot of
Phyllostachys edulis,” Forest Research 26(2), 252-256.
Tekin, K., and Karagoz, S. (2013). “t-Buok catalyzed bio-oil production from woody
biomass under sub-critical water conditions,” Environmental Chemistry Letters 11(1),
25-31. DOI: 10.1007/s10311-012-0373-3
Röder, T., Moosbauer, J., Fasching, M., Bohn, A., Fink, H.-P., Baldinger, T., and Sixta,
H. (2006). “Crystallinity determination of native cellulose comparison of analytical
methods,” Lenzinger Berichte 86, 85-89.
Tong, Q. Y. (2005). “Measuring content of kalium and sodium in polyetherpolylol with
method of flam atomic absorption,” Hebei Chemical Industry (5), 74-75.
Ulloa, C. A., Gordon, A. L., and Garcia, X. A. (2009). “Thermogravimetric study of
PEER-REVIEWED ARTICLE bioresources.com
Zhang et al. (2015). “Camellia nut shell properties,” BioResources 10(1), 647-659. 659
interactions in the pyrolysis of blends of coal with radiata pine sawdust,” Fuel
Processing Technology 90(4), 583-590. DOI: 10.1016/j.fuproc.2008.12.015
Xiao, W. H., Han, L. J., and Zhao, Y. Y. (2011). “Comparative study of conventional and
microwave-assisted liquefaction of corn stover in ethylene glycol,” Industrial Crops
and Products 34(3), 1602-1606. DOI: 10.1016/j.indcrop.2011.05.024
Xu, M., Chen, J. H., Wang, Y. M., Wu, D. M., and Wu, Z. S. (2009). “Preliminary report
of extraction and analysis of tannins from Camellia oleifera fruit shell,” Chemistry
and Industry of Forest Products 29(supplement), 187-191.
Xu, X. W., Jiang, E. C., Wang, M. F., Li, B. S., Zhang, Q., and Liu, M. (2012).
“Characteristics and kinetics of Camellia oleifera shell pyrolysis,” Proceedings of the
CSEE 32(8), 118-123.
Xue, K. P., Yan, L. S., Lai, W. Q., Huang, Z. M., and Guo, H. Q. (2012). “Ultrasonic
microwave enzyme synergistic extraction of proanthocyanidins from Camellia
oleifera shell,” Chemical Research and Application 24(8), 1296-1299.
Yang, X. M., Liu, J. P., Li, Q. Q., Xu, P. F., and Hu, L. (2011). “Optimization of furfural
extraction from Camellia oleifera Abel nutshell by response surface methodology,”
Journal of Chinese Agricultural Mechanization 42(5), 151-155.
Yao, Y., Yoshioka, M., and Shiraishi, N. (1993). “Combined liquefaction of wood and
starch in a polyethylene glycol/glycerin blended solvent,” Mokuzai Gakkaishi 39(8),
930-938.
Ye, L. Y., Zhang, J. M., Zhao, J., and Tu, S. (2014). “Liquefaction of bamboo shoot shell
for the production of polyols,” Bioresource Technology 153, 147-153.
DOI:10.1016/j.biortech.2013.11.070
Ye, N. Y. (2005). “Rapid determination method of K+ in polyether polyol,” Fujian
Chemical Industry (5), 69-72.
Yin, C. G. (2012). “Microwave-assisted pyrolysis of biomass for liquid biofuels
production,” Bioresource Technology 120, 273-284. DOI:
10.1016/j.biortech.2012.06.016
Zhou, J. B., Deng, C. J., and Zhang, Q. S. (2008). “Study on change of chemical
composition of Chinese fir wood before and after carbonization,” Chemistry and
Industry of Forest Products 28(3), 105-107.
Zhou, J. Q., Tan, X. F., Yuan, J., and Long, H. X. (2013a). “Isolation and expression
analysis of CoPhtl;1 from oil tea,” Journal of Plant Genetic Resources 14(3), 512-
517. DOI: 10.1016/S1004-9541(13)60509-1
Zhou, C. S., Yu, X. J., Ma, H. L., He, R. H., and Saritporn, V. (2013b). “Optimization on
the conversion of bamboo shell to levulinic acid with environmentally benign acidic
ionic liquid and response surface analysis,” Chinese Journal of Chemical Engineering
21(5), 544-550.
Zhang, J. T., Gong, L. Y., Sun, K., Jiang, J. C., and Zhang, X. G. (2012). “Preparation of
activated carbon from waste Camellia oleifera shell for supercapacitor application,”
Journal of Solid State Electrochemistry (16), 2179-2186. DOI: 10.1007/s10008-012-
1639-1
Zou, X. L., and Wu, S. Q. (2009). “State council to issue ‘National Camellia Industry
Development Planning (2009-2020)’; Huge camellia industry await for
breakthrough,” China Economy Weekly 47, 45-46.
Article submitted: July 7, 2014; Peer review completed: September 30, 2014; Revised
version received and accepted: November 22, 2014; Published: December 2, 2014.