Embed Size (px)
Citation preview
Louisiana State UniversityLSU Digital Commons
LSU Master's Theses Graduate School
2005
Physicochemical properties of pepper mashfermented in wood and plasticFoong Ming KohLouisiana State University and Agricultural and Mechanical College
Follow this and additional works at: https://digitalcommons.lsu.edu/gradschool_theses
Part of the Life Sciences Commons
This Thesis is brought to you for free and open access by the Graduate School at LSU Digital Commons. It has been accepted for inclusion in LSUMaster's Theses by an authorized graduate school editor of LSU Digital Commons. For more information, please contact [email protected].
Recommended CitationKoh, Foong Ming, "Physicochemical properties of pepper mash fermented in wood and plastic" (2005). LSU Master's Theses. 1447.https://digitalcommons.lsu.edu/gradschool_theses/1447

PHYSICOCHEMICAL PROPERTIES OF PEPPER MASH FERMENTED IN WOOD AND PLASTIC
A Thesis
Submitted to the Graduate Faculty of the Louisiana State University and
Agricultural and Mechanical College In partial fulfillment of the
Requirements for the degree of Master of Science
in
The Department of Food Science
by Foong Ming Koh
B.S., Louisiana State University, 2003 August 2005
ii
ACKNOWLEDGEMENTS
The completion of this project has required the help and support of numerous
people. I would like to thank Dr. Paul Wilson for all of his help and guidance throughout
my research. I have learned so much from him. I would also like to thank the members of
my committee, Dr. Jack Losso, and Dr. Zhimin Xu for everything that they have done for
me and all of their help with my research. Thanks also to research associate, Ms. Gloria
McClure for her valuable technical assistance and constructive advice in this project.
I would also like to thank those special people in my life who are always there to
give me support and provide their special knowledge and talent in this project: Joy, Hee
Jung, Yuk Wang, Andres, Elsa, Amanda, Yew Liong, and Hui Yang.
I would also like to thank everyone from the Department of Food Science and
Department of Horticulture. You have become like a family to me, and I have enjoyed
my time at LSU so much because of you.
I would like to thank San Chiang Tan, my fiancé and best friend. I am very
grateful for meeting you and for our relationship. Your encouragement and understanding
is endless and I look forward to sharing many more accomplishments with you in the
future
Finally, I want to express my great love for my parents, my sister, my brother and
all of my entire extended family. Without your help and patience, this would not have
been possible. I feel extraordinarily blessed to have such a network of wonderful people
in my life. Thank you all for believing in me and helping me reach my goals.
iii
TABLE OF CONTENTS
ACKNOWLEDGEMENTS……………………………………………………………..ii
LISTS OF FIGURES……………...………………………………………………….....v
ABSTRACT…………………………………………………………………………...vii
CHAPTER 1. INTRODUCTION……………………………………………………….1
CHAPTER 2. LITERATURE REVIEW………………………………………………..4 2.1 Fermentation ………………………………………………………………………..4 2.1.1 Vegetable Fermentation…………...……………………………………………4 2.1.2 Lactic Acid Bacteria………………………………………………………….....5 2.1.3 Organic Acids and Reduced pH………………………………………………...6 2.1.4 Effect of Salt on Lactic Acid Bacteria………………………………….. .……..8 2.1.5 Traditional Pepper Fermentation Process…………...………………………….9 2.2 Horticultural Characteristics………………………………………...…….………..10 2.2.1 Horticultural History of Tabasco Peppers……………………………………..10 2.2.2 Botanical Description………………………………………………………….11 2.3 Pepper Physicochemical and Functional Properties………......…………….…...…11 2.3.1 Soluble Carbohydrate……………………………………………………..…...11 2.3.1.1 Chemical Structures of Sucrose, Glucose, and Fructose……………….……....11 2.3.1.2 Carbohydrate Metabolism in Pepper Fruit……………………………..12 2.3.2 Pectin…………………………………………………………………….….….13 2.3.2.1 Structures and Characterization of Pectin……………………….……...13 2.3.2.2 Uronic Acid Quantification Methods…………………………………..16 2.3.2.3 Pectin Metabolism during Pepper Maturation………………….…...….17 2.3.3 Capsaicinoid………………………………………………………….………...18 2.3.3.1 Chemical Characteristics of Capsaicinoid…………………….………..18 2.3.3.2 Capsaicin Analysis ……………………………………………….........19 2.3.3.3 Capsaicin Metabolism during Pepper Maturation………………...……20 2.4 Carbohydrate Changes During Fermentation……………………………….…...…20 2.5 Pectin Degradation in Pickled Products……………………………………….…...22 2.6 Research Justification……………………………………………………… .……..23
2.6.1 Fermentation in White Oak Barrel vs. Polyethylene Barrel………….…..…….23 2.6.2 Substitution of Wood Barrel with Plastic Barrel……..…………………. …….24
CHAPTER 3. MATERIALS AND METHODS………………………………..……..25 3.1 Pepper Mash Fermentation…………………………………………………..…….25 3.2 Dry Weight Measurement……………………………………………….….……...25 3.3 pH and Titratable Acidity ………………………………………………………....25 3.4 Sugar Analysis by HPLC…………………………………………………….…… 26 3.5 Capsaicin Analysis by HPLC……………………………….…………………..….27 3.6 Pectin Determination………………………….…………...…………………….....28
iv
3.6.1 Sample Preparation…………………………………………………..….28 3.6.2 Total Uronide Content Determination……………………………..……28 3.6.3 Chelator-soluble Uronic Acid Determination………………………...…29 3.6.4 Pectin Depolymerization……………………………………………...…30 3.7 Statistical Analysis ……………………….…………………………………..…30 CHAPTER 4. RESULTS AND DISCUSSION……………………………….…..….. 32 4.1 Dry Weight……………………………………………………………………...….32 4.2 pH and Titratable Acidity……………………………………………………..…...34 4.3 Soluble Carbohydrate……………………………………………………….…..….37 4.4 Total Uronide Content…………………………………………………………..…41 4.5 Pectin Depolymerization…………………………………………………….…..…42 4.6 Capsaicinoids……………………………………………………………….…..…..45 CHAPTER 5. SUMMARY AND CONCLUSION………….………………………...52
REFERENCES…………………………………………………………………….….. 55
APPENDIX: DATA OF PHYSICOCHEMICAL ANALYSIS...….…………………..61
VITA………………………………………………………….………………………..78
v
LIST OF FIGURES
Figure 1. Lactic acid fermentation pathway……………..….……………………..….7
Figure 2. Chemical structures of disaccharide (a) sucrose and monosaccharides (b) fructose and (c) glucose…………………..………………………….…12 Figure 3. Pectin fills intercellular spaces of the middle lamella of plant cell wall.….15 Figure 4. Pectin is a polymer of α-galacturonic acid with a variable number of methyl ester groups……………..………………………… …………..…..16 Figure 5. Chemical structures of capsaicinoids – capsaicin, dihydrocapsaicin, homocapsaicin, homodihydrocapsaicin, nordihydrocapsaicin……......……21 Figure 6. Polyethylene plastic barrel (left) and oak wood barrel (right) for pepper fermentation……………………………………………….………….……24
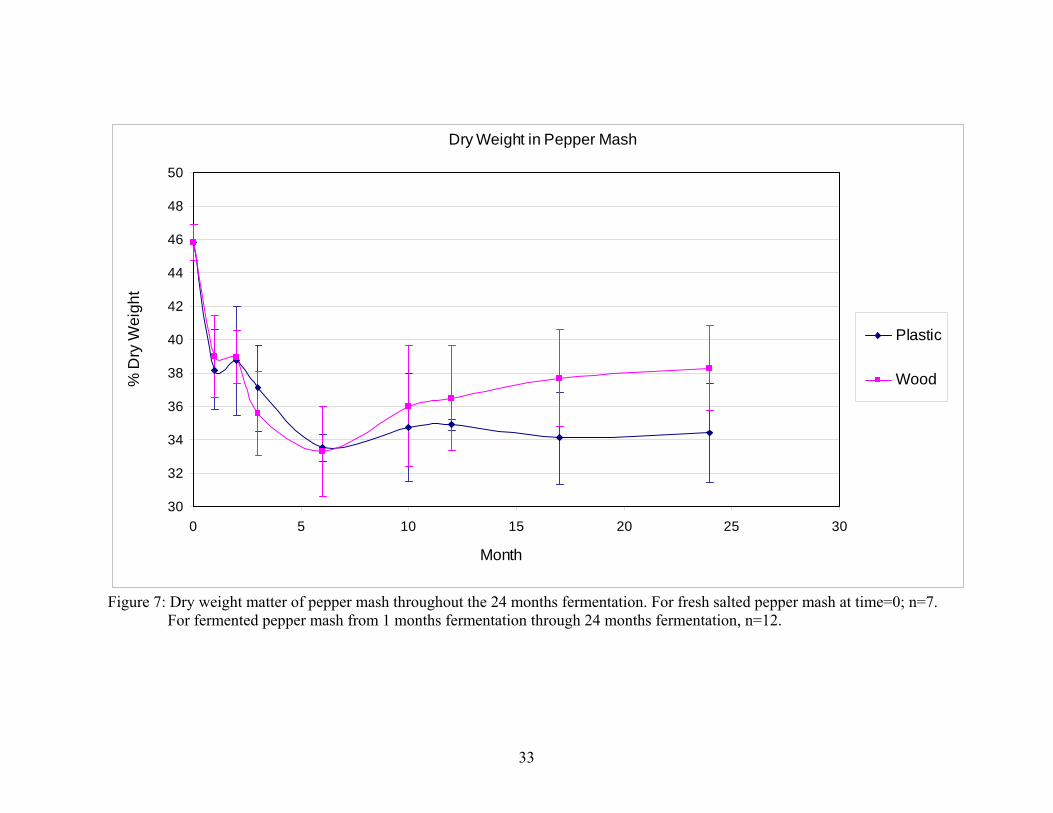
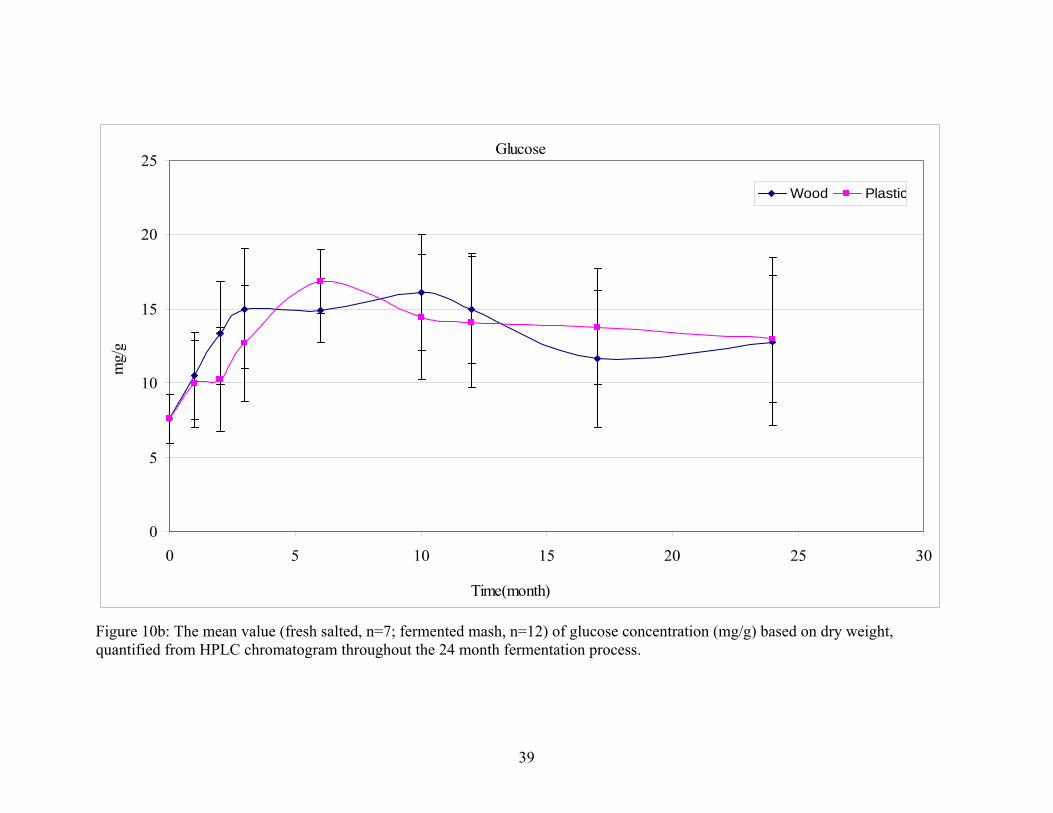
Figure 7. Dry weight matter of pepper mash throughout the 24 months fermentation. For fresh salted pepper mash at time=0; n=7. For fermented pepper mash from 1 months fermentation through 24 months fermentation, n=12…..…33 Figure 8. Average pH of pepper mash (fresh salted, n=7; fermented mash, n=12) fermented in wood and plastic barrels throughout the 24 months time course……………………………………………………………..….35 Figure 9. Mean value of titratable acidity (fresh salted, n=7; fermented mash, n=12) of pepper fermented in wood and plastic barrels throughout the 24 months time course………………………………………………………………....36 Figure 10a. Average (fresh salted, n=7; fermented mash, n=12) of sucrose concentration (mg/g) based on dry weight, quantified from HPLC chromatogram throughout the 24 month fermentation process…………………………………………………………………..38 Figure 10b. The mean value (fresh salted, n=7; fermented mash, n=12) of glucose concentration (mg/g) based on dry weight, quantified from HPLC chromatogram throughout the 24 month fermentation process…….…..39 Figure 10c. The mean value (fresh salted, n=7; fermented mash, n=12) of fructose concentration (mg/g) based on dry weight, quantified from HPLC chromatogram throughout the 24 month fermentation process…………40

vi
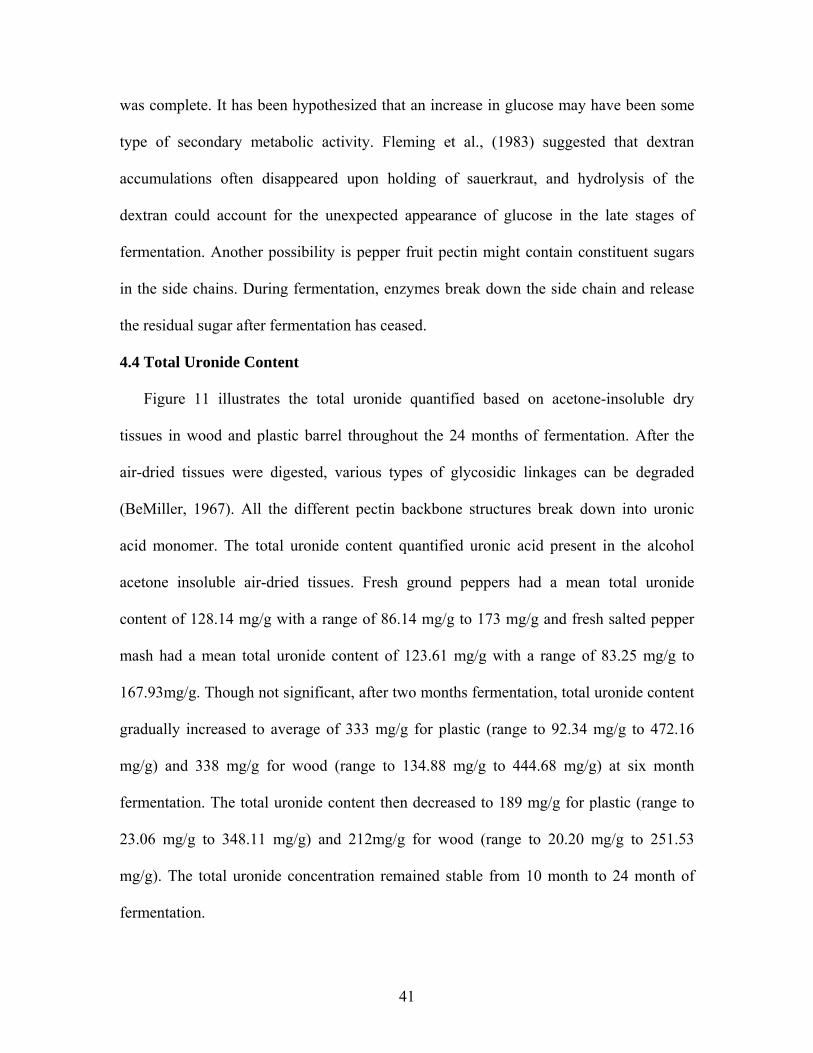
Figure 11. The mean value of total uronide quantification (based on acetone-insoluble dry tissues) for pepper mash fermented in wood and plastic barrel were measured at 520 nm absorbance in Spectrophotometer…………………..43 Figure 12a. Size-exclusion chromatography profile of CDTA-soluble polyuronide of standard and fresh salted pepper mash. Galacturonic acid (GA) was used as monomer standard. The elution rate was 0.5 ml/min and 4 ml fractions with a total of fifteen fractions were collected…………………………..46 Figure 12b. Size-exclusion chromatography profile of CDTA-soluble polyuronide of One month fermented pepper mash in wood and plastic barrels. Galacturonic acid (GA) was used as monomer standard. The elution rate was 0.5 ml/min and 4 ml fractions with a total of fifteen fractions were collected…………………………………………………………………47 Figure 13. Standards were prepared using galacturonic acid at concentration of 15-200 ppm. Absorbance measured at 520 nm in a Perkin Elmer Lambda 35 UV/VIS Spectrophotometer. The line graph have formula of y = 99.223x and R2=0.9975……………………………………………………….…..48 Figure 14a. The mean value of capsaicin (fresh salted, n=7; fermented mash, n=12) on the basis of freeze dried pepper mash quantified from HPLC chromatogram……………………………………………………..……50 Figure 14b. The mean value of dihydrocapsaicin (fresh salted, n=7; fermented mash, n=12) on the basis of freeze dried pepper mash quantified from HPLC chromatogram…………………………………………………………..51
vii
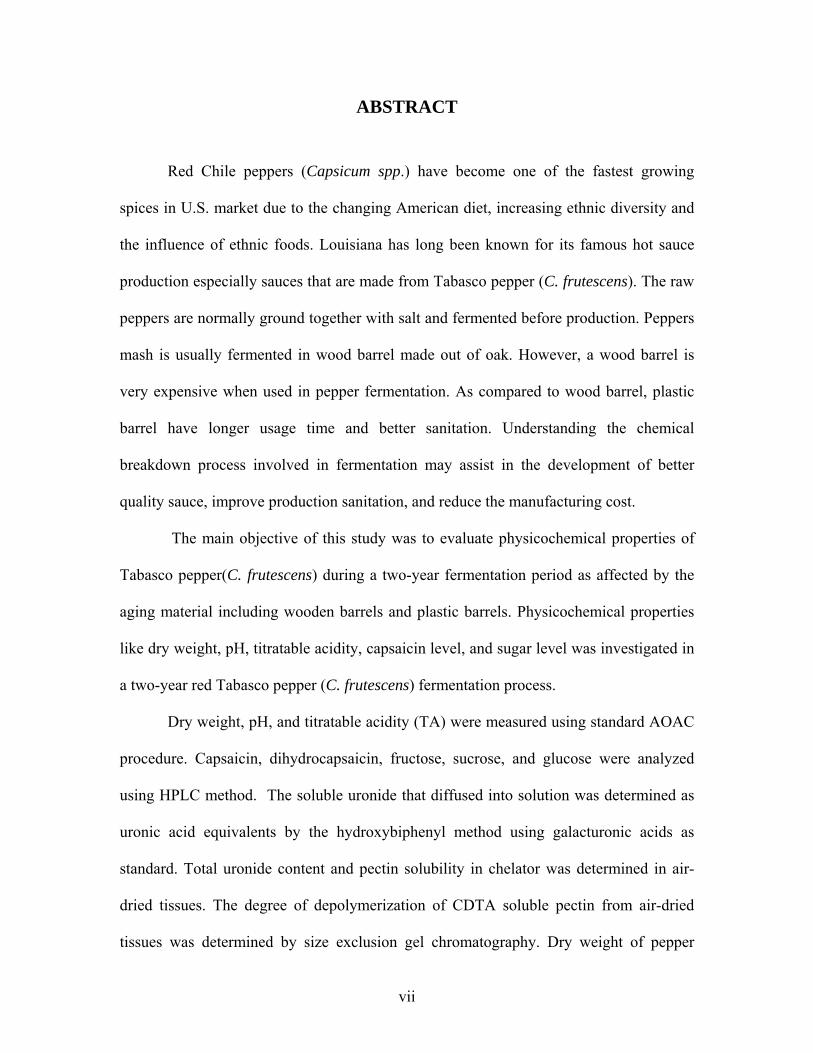
ABSTRACT
Red Chile peppers (Capsicum spp.) have become one of the fastest growing
spices in U.S. market due to the changing American diet, increasing ethnic diversity and
the influence of ethnic foods. Louisiana has long been known for its famous hot sauce
production especially sauces that are made from Tabasco pepper (C. frutescens). The raw
peppers are normally ground together with salt and fermented before production. Peppers
mash is usually fermented in wood barrel made out of oak. However, a wood barrel is
very expensive when used in pepper fermentation. As compared to wood barrel, plastic
barrel have longer usage time and better sanitation. Understanding the chemical
breakdown process involved in fermentation may assist in the development of better
quality sauce, improve production sanitation, and reduce the manufacturing cost.
The main objective of this study was to evaluate physicochemical properties of
Tabasco pepper(C. frutescens) during a two-year fermentation period as affected by the
aging material including wooden barrels and plastic barrels. Physicochemical properties
like dry weight, pH, titratable acidity, capsaicin level, and sugar level was investigated in
a two-year red Tabasco pepper (C. frutescens) fermentation process.
Dry weight, pH, and titratable acidity (TA) were measured using standard AOAC
procedure. Capsaicin, dihydrocapsaicin, fructose, sucrose, and glucose were analyzed
using HPLC method. The soluble uronide that diffused into solution was determined as
uronic acid equivalents by the hydroxybiphenyl method using galacturonic acids as
standard. Total uronide content and pectin solubility in chelator was determined in air-
dried tissues. The degree of depolymerization of CDTA soluble pectin from air-dried
tissues was determined by size exclusion gel chromatography. Dry weight of pepper

viii
mash significantly decreased during fermentation. Titratable acidity increased due to
lactic acid production which lead to decreased in pH. After fermentation, pepper mash
still contained residual sugar. Fermentation process did not affect the capsaicinoids
concentration.
In this study, pepper mash fermented in plastic and oak wood barrel did not show
any significant differences in pH, titratable acidity, sugar level, total uronide
concentration, pectin degradation, and capsaicin level. Plastic barrels might be an
alternative to wood barrels.

1
CHAPTER 1 INTRODUCTION
Fermentation is one of the oldest and most economical methods of preserving
foods. Well known fermented products range from alcoholic beverages, such as beer and
wine, to cheeses, sour milk products, various type of breads, yeast products and
antibiotics. Collectively fermented food is one of the world’s largest industries. In
technologically developed regions, these fermented food products have evolved into the
large-scale industrial production of consumer goods. Their value, and refined quality
guarantee continued and increasing consumption (Deshpande and Salunkhe, 2000).
Nearly all vegetable fermentation, including fruit handled like vegetables, such as
cucumber, tomatoes, and olives, may be fermented by lactic acid bacteria. These
vegetable products contain sugars which are nutritionally adequate as substrate for the
growth of the lactic acid bacteria and other microorganisms (Luh and Woodroof, 1975).
Vegetable fermentation is normally initiated by the bacterial species Leuconostoc
mesenteroids, followed by Lactobacillus brevis, Pediococcus cerevisiae, and
Lactobacillus plantarum (Pederson and Albury, 1954).
Due to the increasing ethnic diversity and the influence of ethnic foods, the
demand for red pepper (Capsicum spp.) products has greatly increased. Red peppers are
used in pickling, relishes, catsup, sauces, and processed meat and fish in all around the
world. The U.S. market for all peppers increased from 95 million pounds dry-weight
basis in 1980 to 210 million pounds in 1993 (Buzzanell et al. 1995). The total value of
combined capsicum imports averaged $44.6 million in 1990-94, compared with $24.7
million in 1985-89, and $15.5 million in 1980-84 (Buzzanell et al. 1995). Louisiana has

2
long been known for its famous hot sauce production especially sauce made from
Tabasco pepper (C. frutescens).
The idea of pepper fermentation was adopted from wine aging process. The raw
peppers are normally ground into mash together with salt and fermented before
production. Aging helps the mash to develop flavors, bouquet and odor. Pepper mash is
usually fermented from 3 months to 3 years depending on the manufacturer’s preference.
However, pepper mash that is fermented in wood barrels made from oak is often
associated with higher quality. Pepper fermentation is a food preservation method to
prevent undesirable changes in food and food products. Such changes can be caused by
invasion and growth of microorganism or by chemical, physical, and biochemical
reactions of compounds present in the food itself (Luh and Woodroof, 1975). Examples
of undesirable chemical changes include oxidative rancidity of fats and oils, loss of
ascorbic acid and other vitamins through oxidation, degradation of pectin, and
discoloration (Luh and Woodroof, 1975). Therefore, the mash fermentation process is a
very critical step in final hot sauce quality.
Like wine production, pepper mash may be aged in wood, aluminum, stainless
steel or plastic containers, depending on the sauce maker’s idea of the style and economic
considerations. Due to their relative permeability, the primary disadvantages of wooden
containers are leakage and contamination unless they are very carefully built and
maintained. Also, wooden barrels are relatively expensive when used in pepper
fermentation. In contrast, plastic barrels have longer usage time, lower cost, lower
maintenance, less leakage, and are easier to sanitize. If chemical aging processes are the
same for pepper fermented in wood barrels and plastic barrels, then plastic barrels could
3
become an alternative to wooden barrels. However, a comprehensive study to examine
the various physicochemical characteristics and functional properties throughout the
whole pepper fermentation and aging process has not been reported. Understanding the
chemical breakdown process involved in fermentation may assist in the development of
better quality sauce, improve production sanitation, and reduce the manufacturing cost.
One of the major concerns of sauce and beverage industries is separation of
sediments and layering of the sauce or beverage. Separation is an undesirable production
condition because consumers view this as poor quality. Pectin plays an important role in
pepper fermentation since it forms gels and influences the final viscosity of the sauce.
Pectin integrity during fermentation destined for processing influences the quality of the
final product and every effort is made to preserve the desired pectin characteristics. This
is especially important for products without added thickeners or stabilizers.
Carbohydrates in the pepper serve as substrates for the microorganism to undergo
fermentation process. Capsaicin changes in the peppers during the fermentation process
in different containers could influence the quality of the final pepper products.
Hence, the purpose of this study was to evaluate physicochemical properties of
Tabasco pepper (C. frutescens) during a two-year fermentation period as affected by the
aging container. Physicochemical properties such as pH, titratable acidity, total and
soluble pectin content, capsaicin levels, and sugar levels were investigated in a two-year
red Tabasco pepper (C. frutescens) fermentation process.
.
4
CHAPTER 2 LITERATURE REVIEW
2.1 Fermentation
The fermented food industry may very well be one of the largest worldwide food
process. Fermentation is the "slow decomposition process of organic substances induced
by micro-organisms, or induced by complex nitrogenous substances (enzymes) of plant
or animal origin" (Walker, 1988). In contrast to unwanted spoilage or toxin production,
fermentation is regarded as a desirable effect of microbial activity in foods. In general,
the desirable effects of microbial activity may be caused by the biochemical activity of
the microorganisms. Microbial enzymes breaking down carbohydrates, lipids, proteins,
and other food components, can improve food digestion in the human gastrointestinal
tract and thus increase nutrient uptake (Adams and Nout, 2001). Although modern food
technology has contributed to the present day high standard of quality and hygiene of
fermented foods, the principles of the age-old processes have hardly changed. In
industrialized societies, a variety of fermented foods are very popular with consumers
because of their attractive flavor and nutritional value.
2.1.1 Vegetable Fermentation
Fermentation, initiated by the action of microorganisms, occurs naturally and is often
part of the process of decay, especially in fruits and vegetables. However, fermentation
can be controlled to give beneficial results. Fermentation is a relatively efficient, low
energy preservation process, which increases the shelf life and decreases the need for
refrigeration or other form of food preservation technology.
5
A vegetable is "a plant cultivated for food, especially an edible herb or root used for
human consumption"(Little et al, 1973). In general, vegetables tend to be less sweet than
fruits and often require some form of processing to increase their edibility. In terms of
food processing, vegetables are classified as ‘low acid’ foods due to their lower levels of
acidity. Low acid foods are more prone to deterioration by microorganisms and can in
fact provide an ideal substrate for food poisoning organisms when in a moist
environment. Low acid foods can be safely preserved by making them more acidic, either
through pickling, salting or drying (Anon, 1993).
2.1.2 Lactic Acid Bacteria
The lactic acid bacteria (LAB) are a group of gram-positive bacteria, non-respiring,
non-spore forming, cocci or rods, which produce lactic acid as the major end product of
the fermentation of carbohydrates. They are the most important bacteria in desirable food
fermentations, being responsible for the fermentation of most "pickled" (fermented)
vegetables. Historically, bacteria from the genera Lactobacillus, Leuconostoc,
Pediococcus and Streptococcus are the main species involved. Several more have been
identified, but play a minor role in lactic fermentations. Lactic acid bacteria were recently
reviewed by Axelsson (1998).
The lactic acid bacteria are a dissimilar group of organisms with diverse metabolic
capacity. This diversity makes them very adaptable to a range of conditions and is largely
responsible for their success in acid food fermentations (Axelsson, 1998). Lactic acid
bacteria carry out their reactions by the conversion of carbohydrate to lactic acid plus
carbon dioxide and other organic acids without the need for oxygen. Lactobacillus
acidophilus, L. bulgaricus, L. plantarum, L. caret, L. pentoaceticus, L brevis and L.
6
thermophilus are examples of lactic acid-producing bacteria involved in food
fermentations. All species of lactic acid bacteria have their own particular reactions and
niches, but overall, L. plantarum (homofermenter) plays the major role and produces high
acidity in most vegetable fermentations. The lactic acid they produce is effective in
inhibiting the growth of other bacteria that may decompose or spoil the food.
In sauerkraut production, environmental factors such as temperature, anaerobiosis,
pH and salt concentration are judiciously adjusted to direct the interactions and optimize
LAB growth. After salting, the liquid phase formed by plasmolysis with the intracellular
water-carrying vitamins and other growth factors, serves as nutrient medium (Pederson,
1971). The aerobic microflora is repressed while the LAB multiply. Generally
Leuconostoc mesenteroides initiates the fermentation, then it disappears gradually to be
replaced by Lactobacillus plantarum. Of the LAB species associated with sauerkraut
production, L. mesenteroides is the most sensitive to decreasing pH and undissociated
forms of lactic and acetic acids. L. mesenteroides initiates growth in vegetables more
rapidly over a range of temperatures and salt concentrations than any other lactic acid
bacteria. The carbon dioxide produced replaces the oxygen, making the environment
anaerobic and suitable for the growth of subsequent species of lactobacillus. Removal of
oxygen also helps to preserve the color of vegetables and stabilizes any ascorbic acid that
is present. In addition to acidification, L. mesenteroides is responsible for some flavor
compounds but also, in some cases, for spoilage by dextran production (Pederson, 1971).
2.1.3 Organic Acids and Reduced pH
Despite their complexity, the whole basis of lactic acid fermentation centers on the
ability of lactic acid bacteria to produce acid, which then inhibits the growth of other non-

7
desirable organisms. Species of the genera, Streptococcus and Leuconostoc, produce the
least acid. Next are the heterofermentative species of Lactobacillus which produce
intermediate amounts of acid, followed by the Pediococcus and lastly the
homofermenters of the Lactobacillus species, which produce the most acid (Axelsson,
1998). For most pathogens, growth does not cease until the pH has dropped below 4.5
since bacteria can maintain their internal pH higher than that of their acidic environment
(Booth, 1999).
The lactic acid bacteria belong to two main groups – the homofermenters and the
heterofermenters. The pathways of lactic acid production differ for the two (Figure 1).
Homofermenters produce mainly lactic acid from hexoses via the Embden–Meyerhof
pathway. Heterofermenters using the 6-phosphoglucanate/phosphoketolase pathway
produce a mixture of lactic acid, ethanol, acetate and carbon dioxide (Axelsson, 1998).
C6H12O6 2 CH3CHOHCOOH
Glucose lactic acid
Homolactic fermentation: The fermentation of 1 mole of glucose yields two moles of lactic acid.
C6H12O6 CH3CHOHCOOH+ C2H5OH + CO2
Glucose lactic acid + Ethanol + carbon dioxide
Heterolactic fermentation: The fermentation of 1 mole of glucose yields 1 mole each of
lactic acid, ethanol and carbon dioxide
Figure 1: Lactic Acid Fermentation Pathway
Lactic acid has two important properties:
It is a weak carboxylic acid that only partially dissociates in aqueous solution

8
Its undissociated form carries no net charge and has appreciable lipid
solubility, which allows lactic acid to diffuse freely through the cell’s plasma
membrane down a concentration gradient into the cytoplasm.
In a fermented food, the low pH will increase the proportion of the undissociated
form present. When the undissociated acid passes through the cell’s cytoplasm membrane
into the higher pH environment of the cytoplasm, it will dissociate, thereby acidifying the
cytoplasm and releasing the acid anion. The increased leakage of protons into the
cytoplasm will place a metabolic burden on the cells, which will divert resources away
from growth–related functions, thus slow growing (Adams and Nout, 2001). Lactic acid
was the major constituent of the of the three end products determined from all vegetable
fermentation which included beans, beets, carrots, cucumbers, peppers (green and red),
and tomatoes. Acetic acid was produced in small amounts in all products except carrot.
Ethanol was detected only in beans and green and red peppers (Fleming et al. 1983).
2.1.4 Effect of Salt on Lactic Acid Bacteria
Ethchells et al. (1943) conducted extensive bacteriological studies on the
fermentation of various vegetables in brines of different concentrations. They stated that
the salt concentration used, rather than the kind of vegetable, was the controlling factor
on the character of the microbial flora and microbial activity. In fermentation at low salt
content, 5 percent or less, large populations of acid forming and other bacteria occurred.
At or above 15 percent salt, little or no growth of acid bacteria occurred. Coliform
bacteria developed rapidly in brines of 2.5 to 5 percent of salt, with production of much
gas. The coliform bacteria rapidly decreased in numbers as soon as an appreciable
amount of acid was formed by other bacteria. Yeasts grew and fermented over a wide

9
range of salt concentration and appeared not to be inhibited by the acidity developed by
lactic bacteria.
2.1.5 Traditional Pepper Fermentation Process
Green and red chile peppers are grown for the fresh market and for processing.
Processed chile peppers are picked into bins and transported to processing plants for
canning, brining, freezing, and drying. Fermented or pickled green jalapeno pepper is a
widely consumed product. According to Pederson and Luh (1988), pickled products are
those to which edible acids have been added, either lactic or acetic (vinegar); on the other
hand, fermented products are such that the acid present was produced from sugars by
bacterial action. Jalapeno peppers are sold as intact whole peppers, peppers without seeds,
peppers in halves, peppers cut lengthwise, peppers cut in rings, and chopped peppers.
Fermentation takes place in 4 to 6 weeks at high salt concentrations 10-15%. It is carried
out in closed tanks, with a vent to allow gas formed during the process to dissipate. At the
end of the fermentation period, the peppers originally bright green, turn olive green. Red
pepper fermentation is usually utilized for sauce production. Whole red peppers are
crushed into mash using a hammer mill together with approximately 8% of salt. This
mash is placed in suitable containers for aging. Some producers use charred Kentucky
white oak barrels from whiskey distillers with salt-sealed wooden lids that have tiny
holes which allow the gases of the peppers to escape during fermentation. The wooden
tops are secured and placed on the barrels with stainless steel hoops. Each barrel is aged
for two to three years. To encourage an anaerobic condition and reduce contamination,
salt is added on top of the barrel. The salt topping hardens in atmosphere humidity and
naturally seals the barrel after the fermentation process ceases. The barrels are uncovered
10
and oxidized mash is removed from the top of the barrels. Upon being accepted under
certain standards and requirement, the mash is pumped into large blending vats and
mixed with distilled, all-natural white vinegar to produce hot pepper sauce. The purposes
of fermentation are to increase pepper value, prevent pulp separation after sauce making,
and produce a shelf stable sauce.
2.2 Horticultural Characteristics
Red peppers are members of the genus Capsicum, a genus that belongs to the
Solanaceae family. The name “capsicum” may have been derived from the Latin word
“Capsa” meaning box referring to the pod, or from the Greek “Kapso” meaning to bite.
The capsicum (red pepper) once discovered was brought back to Europe. In a short time,
the Capsicums had spread to many parts of the world. In different areas the pods
developed different characteristics in shape, color, size and pungency. These factors
make exact classification of the genus difficult. As a result of the peppers’ long history,
in which a great amount of hybridization has occurred, over ninety species are currently
recognized (Wheat, 1987) and includes five domesticated species: C. annuum, C.
frutescens, C. baccatum, C. Chinese, and C. pubescens. (Mao, 1999). Red pepper has
been used in many food products such as relishes, catsup and as a food ingredient in
many sauces. Hot pepper sauce produced in Louisiana is mainly made from pepper
varieties of C. frutescens.
2.2.1 Horticultural History of Tabasco Peppers
The name of this pepper type is derived from the Mexican city of Tabasco, which
had extensive trade with New Orleans during 1850s (DeWitt, and Gerlach, 1990). The
Tabasco pepper was first cultivated in Louisiana by Maunsell White, a banker who
11
introduced the seed from Tabasco, Mexico. White gave pods and a sauce he had made to
his friend, Edmund McIlhenny, who began to grow the Tabasco on Avery Island.
McIlhenny began marketing a sauce from the pepper in 1869, and in 1870 he patented the
now famous brand of Tabasco sauce.
2.2.2 Botanical Description
Botanically, the Tabasco pepper, has an intermediate number of stems, a compact
habit, and grows between 1 and 4 feet high, depending upon climate. Generally, the
longer the growing season, the larger the plant. The leaves are ovate, smooth, and
measure 2½ inches long and 1-¼ inches wide. The flowers have white corollas with no
spots. The pods are borne erect, measure 1-½ inches long and 3/8 inch wide (DeWitt, and
Gerlach, 1990). Immature pods are yellow, maturing to orange and then turning red. Red
color formation during pepper fruit ripening is a result of decreased chlorophyll and
increased carotenoids. The major carotenoids are capsanthin and capsorubin (Rylski,
1986). Each plant can easily produce over 100 pods. C. frutescen requires a tropical
climate, hence is restricted in habitat (Smith et al., 1987). Tabasco is the only member of
C.frutescen commonly cultivated outside the tropics and in U.S (Mao, 1999). Tabasco
chiles measure between 30,000 and 50,000 scoville units, placing them at 8 on the heat
scale (DeWitt, and Gerlach, 1990). .
2.3 Pepper Physicochemical and Functional Properties
2.3.1 Soluble Carbohydrate
2.3.1.1 Chemical Structures of Sucrose, Fructose and Glucose
Sucrose, glucose and fructose were the major components of the soluble neutral
sugars found in pepper fruit (C. annuum) (Nielsen et al., 1991). Fructose and glucose
12
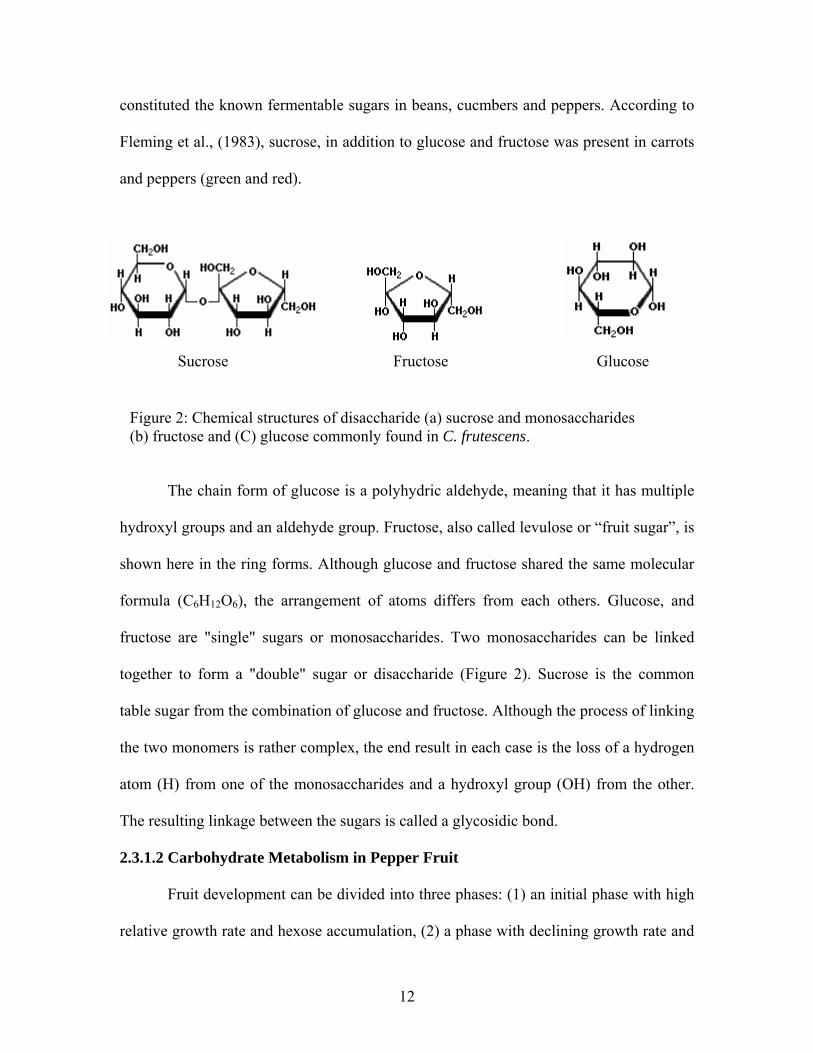
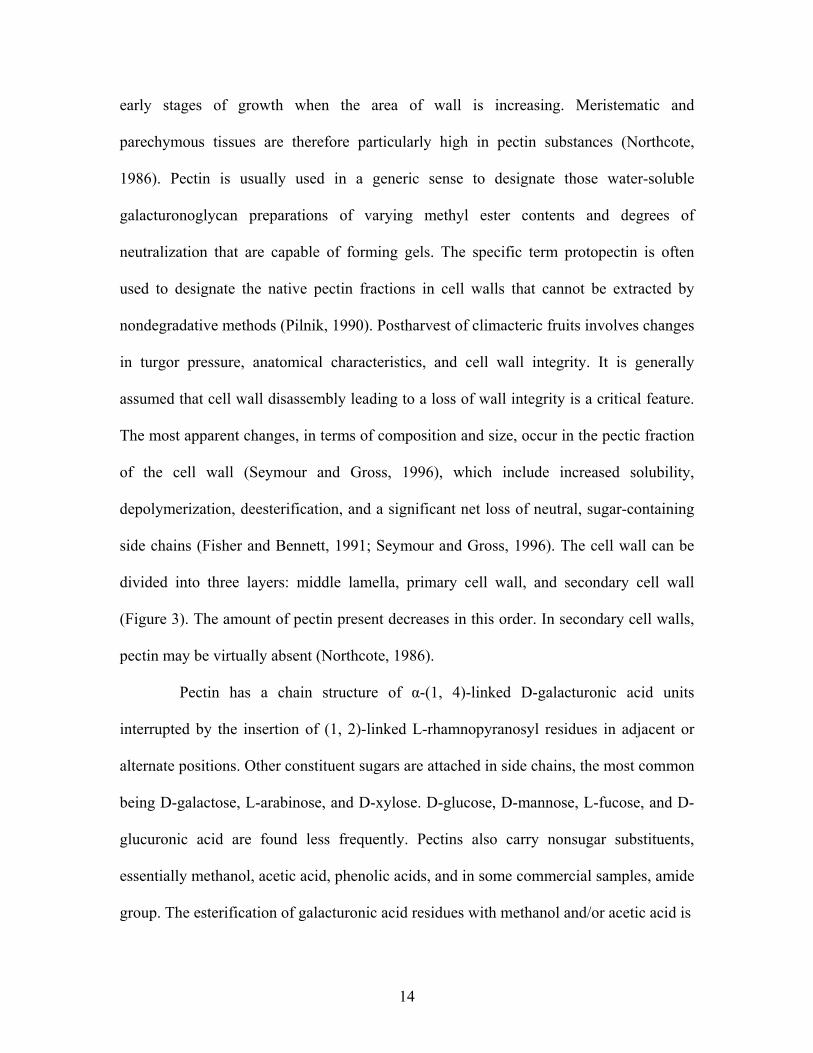
constituted the known fermentable sugars in beans, cucmbers and peppers. According to
Fleming et al., (1983), sucrose, in addition to glucose and fructose was present in carrots
and peppers (green and red).
The chain form of glucose is a polyhydric aldehyde, meaning that it has multiple
hydroxyl groups and an aldehyde group. Fructose, also called levulose or “fruit sugar”, is
shown here in the ring forms. Although glucose and fructose shared the same molecular
formula (C6H12O6), the arrangement of atoms differs from each others. Glucose, and
fructose are "single" sugars or monosaccharides. Two monosaccharides can be linked
together to form a "double" sugar or disaccharide (Figure 2). Sucrose is the common
table sugar from the combination of glucose and fructose. Although the process of linking
the two monomers is rather complex, the end result in each case is the loss of a hydrogen
atom (H) from one of the monosaccharides and a hydroxyl group (OH) from the other.
The resulting linkage between the sugars is called a glycosidic bond.
2.3.1.2 Carbohydrate Metabolism in Pepper Fruit
Fruit development can be divided into three phases: (1) an initial phase with high
relative growth rate and hexose accumulation, (2) a phase with declining growth rate and
Figure 2: Chemical structures of disaccharide (a) sucrose and monosaccharides (b) fructose and (C) glucose commonly found in C. frutescens.
Sucrose Fructose Glucose
13
accumulation of sucrose and starch, and (3) a ripening phase with no further fresh weight
increase and with accumulation of hexoses, while sucrose and starch were degraded
(Nielsen et al., 1991). According to Nielsen et al.(1991), the carbohydrate metabolism in
the growing fruit tissue is important to the partitioning of photosynthetically fixed carbon
in the plant. Furthermore, the content of different sugars is critical to the quality of the
fruit for consumption. Pepper fruits are harvested both as unripe and ripe, and the sugar
content on the fruit tissue depends strongly on the harvest time. Sucrose is the major
product in the source leaves of pepper plants (Nielsen and Veierskov, 1990), and sucrose
utilization is expected to be central to sink strength in the fruits, since phloem transport of
sucrose is considered to rely upon a downhill gradient of sucrose from source to sink
tissues (Eschrich, 1989). According to Nielsen et al. (1991), during maturation of the
fruits there was a significant accumulation of hexoses. In the ripe fruits soluble sugars
accounted for 4.4% of the fresh weight, which equaled 40% of the dry matter. Starch and
sucrose were only transiently accumulated to significant amounts during the period of
declining fruit growth rate. Subsequently both of these carbohydrates were broken down,
probably leading to the observed increase in reducing sugars 50 days after anthesis.
According to Luning et al. (1994), sweetness in bell pepper appeared to be typical for
ripe stages and closely related to glucose, fructose, total sugar, and dry matter content.
However, sucrose was not related to changes in sweetness during maturation.
2.3.2 Pectin
2.3.2.1 Structures and Characterization of Pectin
Pectin substances are a group of closely associated polysaccharides from the primary
cell walls and intercellular regions of higher plants. They are deposited mainly in the
14
early stages of growth when the area of wall is increasing. Meristematic and
parechymous tissues are therefore particularly high in pectin substances (Northcote,
1986). Pectin is usually used in a generic sense to designate those water-soluble
galacturonoglycan preparations of varying methyl ester contents and degrees of
neutralization that are capable of forming gels. The specific term protopectin is often
used to designate the native pectin fractions in cell walls that cannot be extracted by
nondegradative methods (Pilnik, 1990). Postharvest of climacteric fruits involves changes
in turgor pressure, anatomical characteristics, and cell wall integrity. It is generally
assumed that cell wall disassembly leading to a loss of wall integrity is a critical feature.
The most apparent changes, in terms of composition and size, occur in the pectic fraction
of the cell wall (Seymour and Gross, 1996), which include increased solubility,
depolymerization, deesterification, and a significant net loss of neutral, sugar-containing
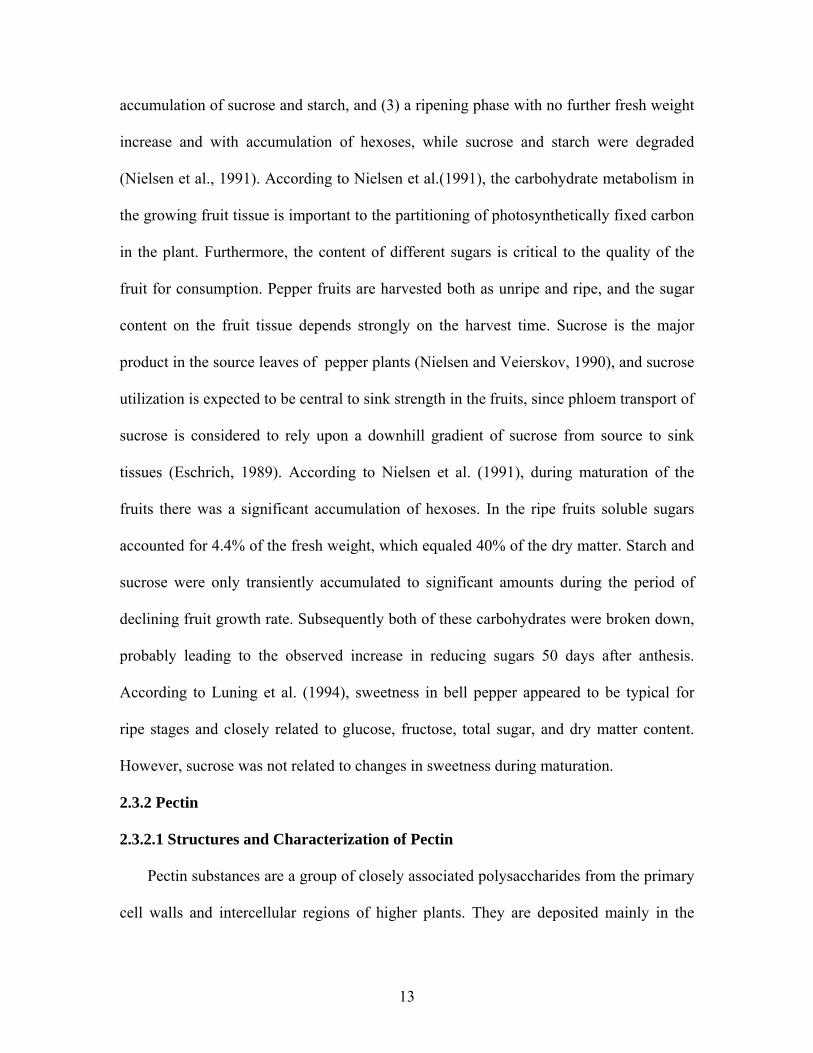
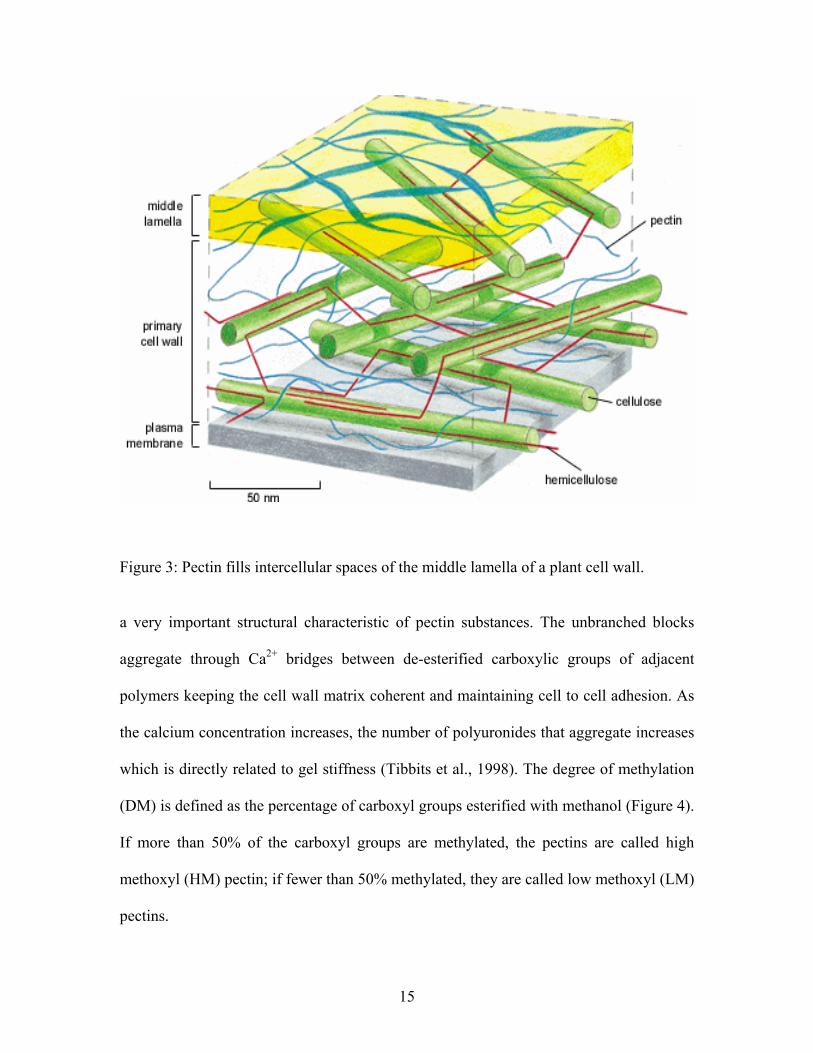
side chains (Fisher and Bennett, 1991; Seymour and Gross, 1996). The cell wall can be
divided into three layers: middle lamella, primary cell wall, and secondary cell wall
(Figure 3). The amount of pectin present decreases in this order. In secondary cell walls,
pectin may be virtually absent (Northcote, 1986).
Pectin has a chain structure of α-(1, 4)-linked D-galacturonic acid units
interrupted by the insertion of (1, 2)-linked L-rhamnopyranosyl residues in adjacent or
alternate positions. Other constituent sugars are attached in side chains, the most common
being D-galactose, L-arabinose, and D-xylose. D-glucose, D-mannose, L-fucose, and D-
glucuronic acid are found less frequently. Pectins also carry nonsugar substituents,
essentially methanol, acetic acid, phenolic acids, and in some commercial samples, amide
group. The esterification of galacturonic acid residues with methanol and/or acetic acid is
15
Figure 3: Pectin fills intercellular spaces of the middle lamella of a plant cell wall. a very important structural characteristic of pectin substances. The unbranched blocks
aggregate through Ca2+ bridges between de-esterified carboxylic groups of adjacent
polymers keeping the cell wall matrix coherent and maintaining cell to cell adhesion. As
the calcium concentration increases, the number of polyuronides that aggregate increases
which is directly related to gel stiffness (Tibbits et al., 1998). The degree of methylation
(DM) is defined as the percentage of carboxyl groups esterified with methanol (Figure 4).
If more than 50% of the carboxyl groups are methylated, the pectins are called high
methoxyl (HM) pectin; if fewer than 50% methylated, they are called low methoxyl (LM)
pectins.

16
Figure 4: Pectin is a polymer of α-Galacturonic acid with a variable number of methyl ester groups 2.3.2.2 Uronic Acids Quantification Methods
Analysis for pectin carbohydrates (polyuronides) in plant materials is difficult
because of the varied and complex matrix of nonuronide carbohydrates associated with
the samples. Galacturonic acid residues are the fundamental units of pectin chains and
quantification of this acid is a primary method used to determine the amounts of pectin
material present in a sample (Kintner and Van Buren, 1982). Previous researches have
shown that pectin fractions can be obtained by sequeantial extraction of the purified cell
wall materials with cold and/or hot water or buffer solution, cold and /or hot solutions of
chelating agents [ammonium oxalate, sodium hexametaphosphate, ethylene diamine
tetraacetate (EDTA), cyclohexane diamine tetraacetate (CDTA)], hot diluted acids and
finally cold, diluted sodium hydroxide ( Massiot et al, 1988; Rombouts and Thibault,
1986; Chambat et al., 1984). Uronic acids quantification was first determined by using
colorimetric carbazole sulfuric reaction (Dische, 1947). However, this method was not
fully accurate because the interference of nonuronide compounds such as sugars, starches
and cellulose (Selvendran, 1975). In 1973, Blumenkrantz and Asboe-Hansen developed
the m-hydroxydiphenyl method which significantly reduced the interference of neutral
sugars by adding m-hydroxydiphenyl as chromogen to heated solution of uronides in a
sulfuric acid-boric acid mixture. Ahmed and Labavitch (1977) modified and tested this
17
procedure for native and extracted pectins. Kintner and Van Buren (1982) reported that
the m-hydroxydiphenyl method would result in significant errors if the final sample
dilutions contain more than 200ug/ml of nonuronide carbohydrate material. Therefore, a
correction of the sample blank absorbance is suggested to compensate for this
interference.
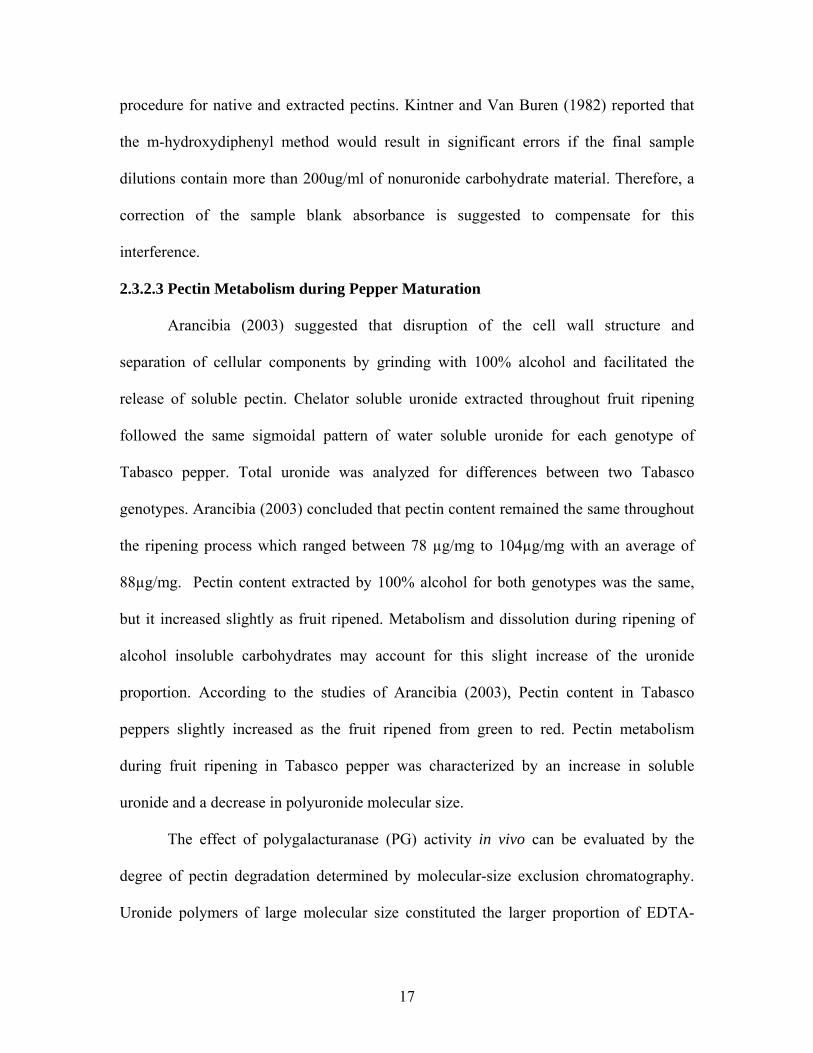
2.3.2.3 Pectin Metabolism during Pepper Maturation
Arancibia (2003) suggested that disruption of the cell wall structure and
separation of cellular components by grinding with 100% alcohol and facilitated the
release of soluble pectin. Chelator soluble uronide extracted throughout fruit ripening
followed the same sigmoidal pattern of water soluble uronide for each genotype of
Tabasco pepper. Total uronide was analyzed for differences between two Tabasco
genotypes. Arancibia (2003) concluded that pectin content remained the same throughout
the ripening process which ranged between 78 µg/mg to 104µg/mg with an average of
88µg/mg. Pectin content extracted by 100% alcohol for both genotypes was the same,
but it increased slightly as fruit ripened. Metabolism and dissolution during ripening of
alcohol insoluble carbohydrates may account for this slight increase of the uronide
proportion. According to the studies of Arancibia (2003), Pectin content in Tabasco
peppers slightly increased as the fruit ripened from green to red. Pectin metabolism
during fruit ripening in Tabasco pepper was characterized by an increase in soluble
uronide and a decrease in polyuronide molecular size.
The effect of polygalacturanase (PG) activity in vivo can be evaluated by the
degree of pectin degradation determined by molecular-size exclusion chromatography.
Uronide polymers of large molecular size constituted the larger proportion of EDTA-

18
soluble pectin that eluted first in the void volume followed by a tail of polyuronide of
decreasing molecular size that extended up to the end of the separation range (DellaPenna
et al., 1990). According to the research conducted by Arancibia (2003), the elution profile
of premature green Tabasco pepper was the same for two genotypes; however, red-
mature tissue was different between the genotypes. The elution profile of uronide from
ripe (hue 40) EZ (easy pick) genotype showed an almost complete downshift of the
uronide molecular size to oligomers of a few galacturonic acid residues as a consequence
of extensive depolymerization. In the case of ripe (hue 44) genotype HP (hard pick), the
elution profile showed that uronide was distributed throughout a wide range of large to
medium size UA polymers.
2.3.3 Capsaicinoid 2.3.3.1 Chemical Characteristics of Capsaicinoids
Capsaicinoids are alkaloid compounds that produce the hot flavor or pungency
associated with eating chiles (Collins et al., 1995). Pungency is the most outstanding
property of capsicums, resulting from the direct effect of capsaicin and its analogues on
the pain receptors in the mouth and throat (Krajewska and Powers, 1988). Pungency in
pepper is due to the amount of capsaicinoids, including capsaicin and four structurally
related compounds, namely nordihydrocapsaicin, dihydrocapsaicin, homocapsaicin, and
homodihydrocapsaicin (Hoffman et al., 1983). Capsaicin, which is the most abundant
capsaicinoids, contributes most to pungency. Quantification of these pungent compounds
is therefore an important index of pepper quality (Gibbs and O’Garro, 2004).
Capsaicin and its analogues are the pungent principles of Capsicum fruits. All of the
identified capsaicinoids are vanillylamides of fatty acids. These compounds differ in the
19
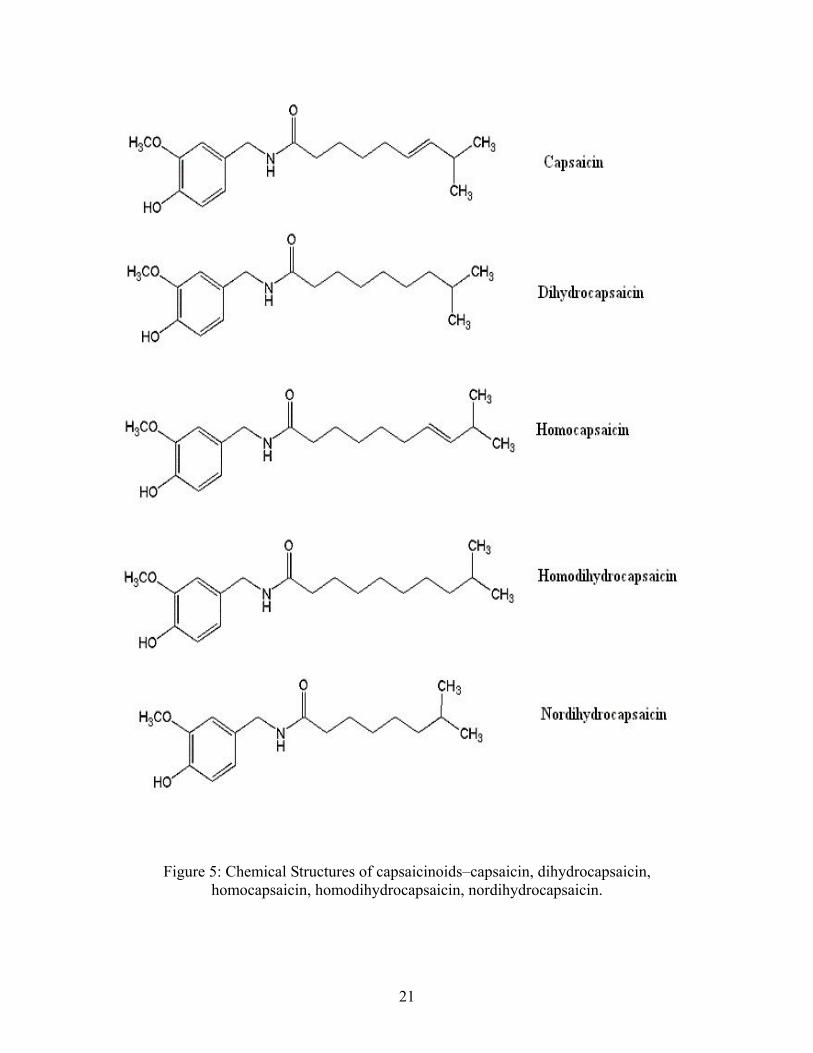
length of the aliphatic side chain, the presence or absence of a double bond, the branching
point, and by their relative pungency (Figure 5) (Krajewska and Powers, 1988). Most
capsicum products such as red pepper, chili pepper, and oleoresin of red pepper are traded
on the basis of their pungency or the level of capsaicinoids they contain (Parrish, 1996).
Capsaicin itself is practically devoid of odor and flavor. Capsaicinoid contents typically
range from 100ug/g in chili pepper to 2.5mg/g in red pepper and 0.06g/g in oleoresin red
pepper (Parrish, 1996).
2.3.3.2 Capsaicin Analysis
The first reported reliable measurement of chile pungency is the Scoville Organoleptic
Test. This test used a taste panel of five individuals who evaluate a chile sample and then
record the hot flavor level. A sample was then diluted until pungency could no longer be
detected (Scoville, 1912). This dilution is referred to as the Scoville Heat Unit. This test
is subjective, and members of the taste panel cannot determine the amount of each of the
capsaicinoids present in the sample. Food industry researchers need reliable, safe, and
standard analytical procedures that are useful for comparing pungency levels among
different samples (Collins et al., 1995). Therefore, the Scoville Organoleptic Test has
since been replaced with instrumental methods. In 1977, the spectrophotometric
vanadium oxytrichloride method was developed, measuring capsaicinoids as a group, not
taking into account the difference in pungencies of the major capsaicinoids (Todd et al.,
1977). Hot peppers contain other strongly UV-absorbing compounds that eluate with the
void volume and shortly thereafter. Fluorescense detection lessens the interference of
these compounds (Woodburry, 1980). Since 1980, newer columns (5 um particle size)
have reduced this interference by separating the interfering compounds more efficiently.

20
Detectors have been improved as well. Hoffman et al. (1983) successfully separated and
quantified five major heat principles (capsaicin, nordihydrocapsaicin, dihydrocapsaicin,
homocapsaicin, homodihydrocapsacin) in red pepper using reverse-phase high-pressure
liquid chromatography. Currently, analysis of capsaicinoids is conducted by using
spectrophotometric (Bajaj, 1980), gas chromatography (Krajewska and Powers, 1988),
and high-performance liquid chromatography (HPLC) procedures (Attuquayafio and
Buckle, 1987; Cooper et al., 1991; Collins et al., 1995). Techniques using HPLC provide
accurate and efficient analysis of content and type of capsaicinoids present in a sample
(Collins et al., 1995).
2.3.3.3 Capsaicin Metabolism during Pepper Maturation
Capsaicin content, as determined by the method outlined by Bajaj (1980), was
generally higher in ripe pepper fruit than green pepper fruit. The capsaicin content range
from 37.6 to 497.0mg/100g in ripe fruits and 278 to 404.5mg/100g in green pepper fruit.
In contrast, Wheat (1987) found Tabasco peppers at the mature green stage had a
significantly higher capsaicin concentration than the orange and red stages of maturation.
This is in agreement with Mathew et. al. (1971) study that reported capsaicin
concentration was lowest in the young green immature fruit. However, once this fruit is
fully mature. It had the highest capsaicin content just prior to beginning the ripening
stage. After the ripening stages begin, as seen by a change in color from green to red, the
capsaicin concentration decreased (Mathew et al., 1971).
2.4 Carbohydrate Changes during Fermentation
Before pasteurization was introduced into the United States pickle industries,
commercial preservation of many pickle products relied upon conversion of fermentable
21
Figure 5: Chemical Structures of capsaicinoids–capsaicin, dihydrocapsaicin, homocapsaicin, homodihydrocapsaicin, nordihydrocapsaicin.

22
carbohydrate to organic acids during bulk storage and/or the addition of sufficient
amounts of vinegar, sugar, and other ingredient to fully cured and packed product to
preclude microbial growth (Bell et al., 1951). In the case of cucumber products, “fully
cured” refers to the complete removal of fermentable sugars and changes in the flesh
from an opaque to a translucent appearance. Successful fermentation of brined vegetables
is influenced by numerous chemical and physical factors including the concentration and
type(s) of fermentable carbohydrate of the raw product, and the buffering capacity of the
vegetables (Fleminget al., 1983). During the fermentation, carbohydrates are converted to
acids and other end products by lactic acid bacteria and yeast. If sugars are incompletely
fermented during primary fermentation, the product will be susceptible to secondary
fermentation by yeasts (Fleming et al., 1983). In Fleming et al. (1983) studies, bell
peppers, both green and red, underwent secondary fermentation when stored at pH 4.3 as
evidenced by gas pressure in some jars and by a slight increase in acidity. However,
peppers did not contain measurable fermentable sugars after fermentation.
2.5 Pectin Degradation in Pickled Products
Pectin degradation attributed to the action of PG has been studied extensively in
tomato and has been associated with fruit softening (Brummell and Harpter, 2001). Pectin
degradation is characterized by uronide depolymerization and dissolution during fruit
ripening (DellaPenna et al., 1990). DellaPenna et al., (1990) concluded that the site of
action of polygalacturonase is the cell wall, where it hydrolyzes polyuronides, or pectin.
The increase in the level of chelator-soluble polyuronides during ripening and their
corresponding decrease in molecular size have been well documented and are attributed
to the action of polygalacturonase. Howard et al. (1994) study showed that softening of
23
jalapeno pepper ring was accompanied by increased level of water soluble pectin, and
decreased levels of chelator-soluble pectin and sodium hydroxide soluble pectin. Howard
stated that glycosidic and ionic linkages of pectin molecules were cleaved under high
acid environments, resulting in greater water solubility of pectin substances. The capacity
of pectin to form gels and influence the viscosity of solutions depends on the integrity of
pectin polymers.
2.6 Research Justification
Collective evidence indicates that fermentation process increases the quality of
the product, but the effect of the fermenting vessel is unknown. No systematic
investigation has been made to understand the process of Tabasco pepper mash
fermentation. The demand for red pepper products has been increased dramatically in
recent years (Buzzanell et al. 1995). Hot sauce, pickles, and relishes play an important
role in the food market. In this health conscious society, consumers prefer premium food
quality and demand for healthy foods. Understanding pepper fermentation could
potentially increases food qualities and food production to meet the consumption
worldwide.
2.6.1 Fermentation in White Oak Barrel vs. Polyethylene Barrel
Many previous researches have suggested that wine fermented in oak barrels
showed an increased in pleasant aroma or bouquet, and the addition of a soft oak wood
flavor or vanillin flavor. However, there have been no reports on pepper mash fermented
neither in oak barrel nor in plastic barrel. Yokotsuka et. al (1994) have compared the
composition of koshu white wines fermented in oak barrel and plastic tanks. The
conclusions of the studies are slower fermentation rate occurs in a wood barrel than in a
24
plastic tank might be due to smaller amount of suspended solids, less yeast growth as a
result of polyphenols extracted from wood in spite of the warmer temperature of white
wines fermented in wooden barrels.
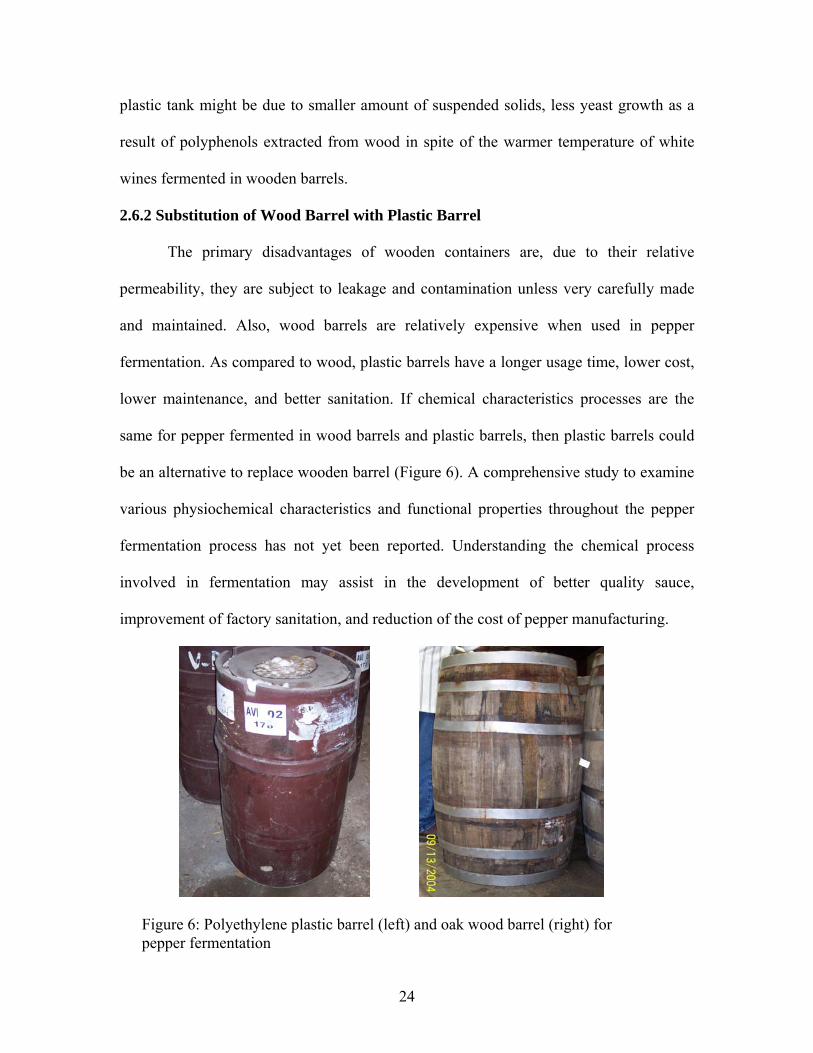
2.6.2 Substitution of Wood Barrel with Plastic Barrel
The primary disadvantages of wooden containers are, due to their relative
permeability, they are subject to leakage and contamination unless very carefully made
and maintained. Also, wood barrels are relatively expensive when used in pepper
fermentation. As compared to wood, plastic barrels have a longer usage time, lower cost,
lower maintenance, and better sanitation. If chemical characteristics processes are the
same for pepper fermented in wood barrels and plastic barrels, then plastic barrels could
be an alternative to replace wooden barrel (Figure 6). A comprehensive study to examine
various physiochemical characteristics and functional properties throughout the pepper
fermentation process has not yet been reported. Understanding the chemical process
involved in fermentation may assist in the development of better quality sauce,
improvement of factory sanitation, and reduction of the cost of pepper manufacturing.
Figure 6: Polyethylene plastic barrel (left) and oak wood barrel (right) for
pepper fermentation
25
CHAPTER 3 MATERIALS AND METHODS
3.1 Pepper Mash Fermentation
Fresh Tabasco peppers were ground and 8% salt was added. Samples of freshly
ground peppers before and after salt was added were taken for analysis. Pepper mash was
fermented in twelve wooden and twelve plastic barrels. The wood barrels have a volume
of 55 gallon and the plastic barrels are 50 gallon. For easy sampling, a hole was drilled on
top of the wooden barrel’s cover and closed with a rubber stopper. Plastic barrel had an
easily removable gasketed cover for sampling. Fermented samples were taken at 1 month,
2 months, 3 months, 6 months, 10 months, 12 months, 17 months, and 24 months.
Samples were taken by using a 42 inch drum sampler (Conbar, NJ) with minimum
disruption to the anaerobic pepper fermentation process. This avoided also taking the top
layer of oxidized pepper mash or mixing the layers. The pepper mash was collected from
the barrels into a 500 ml sampling cup (Fisher, TX).
3.2 Dry Weight Measurement
Moisture determination was performed in duplicate on pepper mash samples by
drying 48 hr in a 60°C convection oven (VWR Scientific Product, OR) (AOAC, 1990).
The samples were weighed into an aluminum pan, and recorded as weight of dry sample.
Calculated dry weight content as:
dry weight, g wet weight, g
3.3 pH and Titratable Acidity
Titratable acidity and pH were measured using an Orion EA920 pH meter (Orion,
MA). Titratable acidity (TA) was determined as ml of 0.1N NaOH used to obtain a pH
x 100 = % of dry weight content

26
8.1 endpoint (AOAC, 1990). Lactic acid serves as a major organic acid in fermented
pepper mash due to lactic acid fermentation. The formula to calculate %TA is as below:
(ml of NaOH) x (N of NaOH) x (Equivalent Weight) 10 x Sample Weight
Equivalent Weight = 90.08
3.4 Sugar Analysis by HPLC
Ten grams of pepper mash was homogenized (Brinkman PT 110/35, Westbury, NY)
with 10 ml of distilled water and frozen at -5°C until extracted. Samples were then
sonicated for 20 minutes at 40oC and centrifuged (International Equipment, MA) for 20
minutes. The supernatant was decanted and filtered through Whatman No.4 filter paper
(Whatman Int. Ltd., Maidstone) into 20 ml scintillation vials. A 2 ml aliquot of the
filtered supernatant was again filtered using a 0.45 μm Millex®-HN filter unit on a 5 ml
disposable syringe (Millipore, Bedford, MA) into a HPLC sample vial (Waters Corp.,
MA), which was capped, and stored at -5°C freezer until analyzed. The HPLC method
was adopted from Nielsen et al. (1991) with some modifications. The sugars in the eluate
were analyzed using a Waters (Waters Corp., MA) HPLC equipped with a 600E
multisolvent delivery system, a 410 differential refractometer, and a 717 autosampler.
Sugars were separated with an Aminex® HPX-87N 300 x 7.8 mm column (Bio-Rad 125-
0143, Hercules, CA) fitted with a precolumn guard (Bio-Rad Micro-Guard). This column
accommodates a salt matrix which will tolerate up to 15% of salt. The 8% salt soluble in
water will interfere the accuracy of the results in regular column. The mobile phase was
degassed HPLC grade water (Fisher, TX) having a flow rate at 0.6 ml min-1 at 85°C with
15 min run time. During HPLC sample analysis, a standard solution was injected every
%TA =
27
15 samples in order to evaluate the retention time verification and instrument calibration.
Standards consisted of fructose (80µg), glucose (80µg), and sucrose (20µg) and were
obtained from Sigma Chemical, St. Louis, MO.
3.5 Capsaicin Analysis by HPLC
Samples were extracted according to Collins et al. (1995) with some
modifications. Pepper mash was lyophilized in a freeze drier (The Virtis Company, MA)
and stored in sealed plastic bags at 0°C in the refrigerator until processed. A 1:10 (w/v)
ratio of freeze dried pepper mash to acetonitrile was placed in 120 ml glass bottles with
teflon–lined lids. Bottle were capped and placed in an 80°C water bath (Blue M., IL) for 4
hours with occasional agitation. Samples were removed from the water bath and cooled
to room temperature. A 2 ml aliquot of supernatant was extracted and filtered using a
0.45 μm Millex®-HN filter unit on a 5 ml disposable syringe (Millipore, Bedford, MA)
into a sample vial which was capped, and stored at 5°C in the refrigerator until analyzed.
A 1 μl aliquot was used for each HPLC injection.
A Waters (Waters Corp., Milford, Mass) HPLC equipped with a 600E
multisolvent delivery system, a 474 fluorescence detector with excitation at 280 nm and
emission at 338 nm, and a 717 autosampler was used. HPLC operating conditions
included ambient temperature, a flow rate of 1 ml.min-1, and a run duration of 7 min. The
mobile phase was isocratic using degassed HPLC grade 73% methanol and 27% water
(Fisher, TX). The reverse-phase chromatographic column was a Nova-Pak C18 3.9 x
150-mm packed with silica (Waters Corp., Milford, Mass). A precolumn guard cartridge,
Nova-Pak C18 (Waters Corp., Milford, Mass) was also used. During HPLC sample
analysis, a standard solution was injected every 15 samples in order to evaluate the
28
retention time verification and instrument calibration. These capsaicinoid standards
consisted of 20µg 8-methyl-n-vanillyl-6-nonenamide (capsaicin) and 20µg 8-mrthyl-n-
vanillylnonanamide (dihydrocapsaicin) and were obtained from Sigma Chemical Co, St.
Louis, MO.
3.6 Pectin Determination
3.6.1 Sample Preparation
Ten grams pepper mash samples were homogenized (Brinkman PT 110/35) for 1 min
in 10 ml 100% EtOH using a Waring blender (Scientific Industries, NY) to inactivate any
endogenous enzyme present in the pepper mash and remove alcohol-soluble solids.
Homogenates were then placed in a hot water bath at 80°C for 20 minutes, cooled to
room temperature, centrifuged at 8000 rpm for 20 minutes, and the supernatant discarded
(Ahmed and Labavitch, 1977). To conduct structural studies on pectins from plant cell
walls, a clean-up of the pectin source to remove interfering compounds is necessary. The
pellet residue was washed 3 times with 10 ml acetone (Fisher, TX), centrifuged for 20
min, and the supernatant discarded (Aracibia, 2003). The resulting pellet was air dried for
48 hours. The sample of air dried material was stored in 20 ml scintillation vials until
analyzed. Pectin was measured according to Blumenkrantz and Asboe-Hansen (1973)
with modification.
3.6.2 Total Uronide Content Determination
Approximately 5 mg of the air dried sample was weighted into a 20 ml scintillation
vial. The vial was placed in a water-ice bath and 2 ml of chilled concentrated sulfuric
acid (Fisher, TX) was added and the mixture swirled gently. The mixture was agitated
gently as 0.5 ml distilled water was added to the vial. Another 0.5 ml water was added in
29
dropwise fashion and the sample stirred for 1 hour. Aliquots of this digestion were
assayed for uronic acids quantification. For each preparation, a sample and “blank” test
tube were prepared, with 0.2 ml of the dissolved material placed in each. To each tube,
1.2 ml of chilled tetraborate reagent (0.0125M sodium tetraborate in concentrated sulfuric
acid) ((Fisher, TX) was added and the mixture vortexed for 10 seconds. The tubes were
heated in a dry bath at 100°C for 5 min then cooled in a water-ice bath. Total pectin
content was determined by the hydroxydiphenyl method (Blumenkrantz and Asboe-
Hansen, 1973) using galacturonic acid as a standard. Twenty ul of m-hydroxydiphenyl
reagent (0.15% solution of m-hydroxydiphenyl in 0.5%NaOH) (Sigma Chemical Co, St.
Louis, MO ) was added to the sample tube. Carbohydrates produce a pinkish chromogen
with sulfuric acid/tetraborate at 100oC. The blank sample was run in place of the m-
hydroxydiphenyl using 20 ul of 0.5% NaOH. The tubes were vortex for 10 seconds and
absorbance measured at 520 nm in a Perkin Elmer Lambda 35 UV/VIS
Spectrophotometer (Norwalk, CT). Absorbance for the sample was adjusted by
subtracting the absorbance for the blank. Blanks were prepared to ensure that substances
other than pectin that might react with the chromogen will not be quantifiedas pectin.
Standards were prepared using galacturonic acid (Sigma Chemical Co., St Louis, MO) at
concentration of 15-200 ppm. Standard curves were developed manually.
3.6.3 Chelator-soluble Uronic Acid Determination
Approximately 50 mg of the air dried sample was weighted into a vial. Two ml of
extraction buffer (50 mM Na acetate, 40 mM EDTA, pH 4.5) (Sigma Chemical Co, St.
Louis, MO ) was added and vortex for 10 seconds. The sample was stored for 24 hours at
5°C in refrigerator. After 24 hours in suspension, the sample was centrifuged and an
30
aliquot was taken to determine the chelator UA content by the hydroxydiphenyl method
(Blumenkrantz and Asboe-Hansen, 1973) using galacturonic acid as a standard (Sigma
Chemical Co, St. Louis, MO).
3.6.4 Pectin Depolymerization
The degree of depolymerization of chelator-soluble pectin extracted was determined
by size-exclusion chromatography using a Sepharose CL-4B column (30 x 1.5cm)
(Amersham Bioscience, NJ) following the method of DellaPenna et al. (1990) with some
modification. The air-dried alcohol acetone-insoluble cell wall material was suspended in
EDTA extraction buffer (50mM Na acetate, 40mM EDTA, pH4.5) for 24 hours at 5°C in
the refrigerator. The sample was centrifuged and a 5 ul aliquot was analyzed for uronide
concentration using a Perkin Elmer spectrophotometer (Norwalk, CT) at 520nm. Based
on this analysis the sample was diluted to give a uronide concentration of 0.5mg/ml. A 1-
ml of this adjusted sample was passed through the (Sepharose CL-4B, Sigma-Aldrich, St.
Louis, MO) column equilibrated with an elution buffer (100 mM Na acetate, 20 mM
EDTA, pH 6.5). The elution rate was 0.5 ml/min and 4 ml fractions with a total of 15
fractions were collected by Bio-Rad Fraction Collector (Hercules, CA) and analyzed for
uronic acid content. The UA content of each fraction was determined by the
hydroxybiphenyl method (Blumenkrantz and Asboe-Hansen, 1973). A 0.5 mg/ml
solution of galacturonic acid (Sigma Chemical Co, St. Louis, MO) was used as the
monomer standard.
3.7 Statistical Analysis
All experiments were carried out in 12 times (n=12) the twelve wood and twelve
plastic barrels. Fresh pepper mash experiments were carried out triplicate (n=3) from
31
three different batches and fresh salted pepper mash were carried out in 7 times (n=7)
with seven different batches. Average values (means) and standard deviations were
reported. Mean separations were analyzed using the ANOVA (SAS) and Tukey’s
studentized range tests at α = 0.05.
32
CHAPTER 4
RESULTS AND DISCUSSION
Results of the proximate analysis and physiocochemical properties throughout the
pepper fermentation process are presented in Figures 7-15.
4.1 Dry Weight
The average dry weight of Tabasco peppers immediately following grinding was
38% and moisture was 62% with a range of 61.7% to 62.9%. After salt added to the
pepper mash, moisture was 54% with a range of 52.7% to 55.8%. These results are
consistent with Mao (1999) who found that pod moisture content of red Capsicum
annuum was between 65% and 80%, depending on whether the pods were partially dried
on the plant or harvested while still succulent.
Within 1 month fermentation there was a significant decrease in dry matter for
both wooden and plastic containers from the original salted mash (Figure 7). This may
have due to an initial separation of liquid from pepper solids immediately after salting
and filling barrels with an average dry weight of 38.2% + 0.326 (plastic) and 39% +
0.248 (wood). No significant changes in dry matter were observed after 1 month. The
early water loss may have occurred between grinding and filling of the barrels as leakage
from machinery. Though not significant, the dry matter of pepper mash fermented in
wooden barrels was greater than in the plastic barrels. This may have been due to the
porous nature of the wooden barrels that allowed water to evaporate or leak during the 24
months of fermentation.
33
Dry Weight in Pepper Mash
30
32
34
36
38
40
42
44
46
48
50
0 5 10 15 20 25 30
Month
% D
ry W
eigh
t
Plastic
Wood
Figure 7: Dry weight matter of pepper mash throughout the 24 months fermentation. For fresh salted pepper mash at time=0; n=7. For fermented pepper mash from 1 months fermentation through 24 months fermentation, n=12.

34
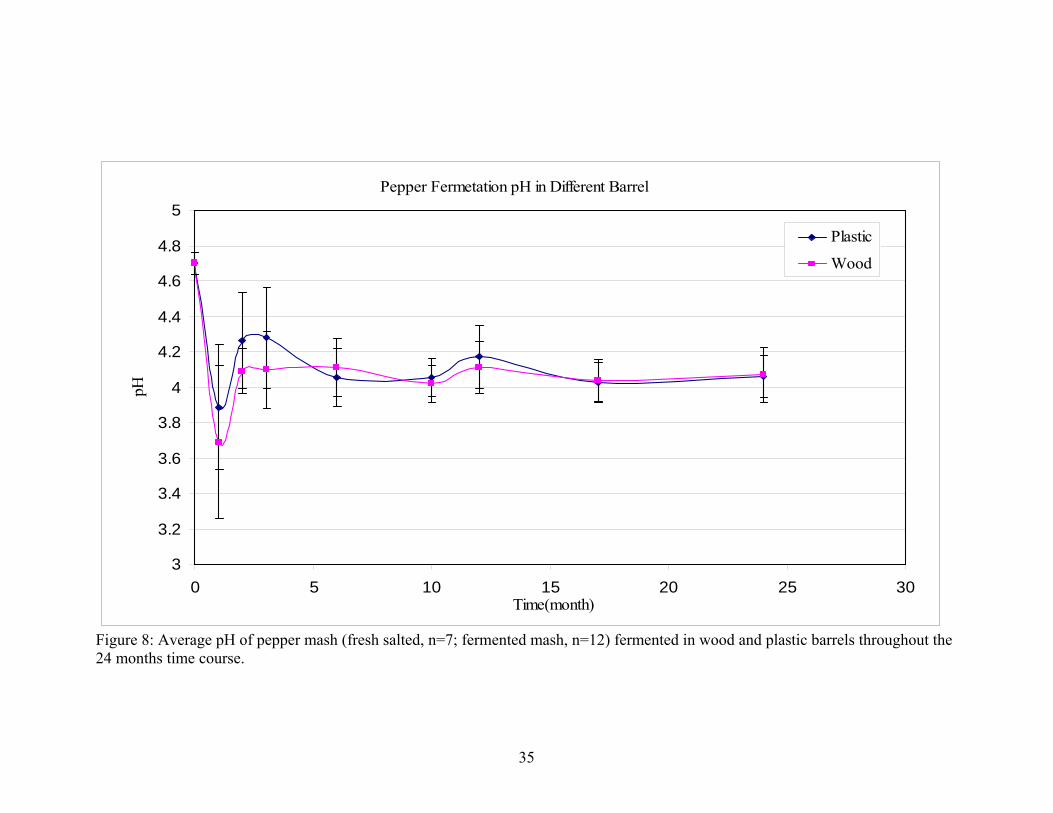
4.2 pH and Titratable Acidity
The average pH of ground fresh peppers before salting was 4.98with a range of
4.97 to 4.99. Following the addition of 8% salt, the average pH was 4.7 with a range of
4.59 to 4.80 (Figure 8). Within the first month of fermentation, the pH significantly
decreased to 3.9 (range to 3.07 to 4.41) and 3.7 (range to 3.17 to 4.6) for plastic and
wooden barrels, respectively. After 1 month there were no significant changes in pH. The
initial decrease in pH was likely due as the result of lactic acid bacteria growing in the
salted mash (Pederson and Luh, 1988) and producing lactic acid. The general
specification project for pickled products established by the processed fruit and vegetable
committee of the Codex Alimentarius Commision FAO/OMS, notes a maximum pH
specification of 4.6 for pickled products (FDA, 2003). During 24 months fermentation,
salted pepper mash in both wooden and plastic barrels was below this maximum.
Therefore, the pepper mash pH meets the specification standard.
The average titratable acidity (TA) of pepper mash before salting was 0.58% of
acidity (expressed as lactic acid) with a range of 0.57% to 0.58%. Immediately following
salting the average TA was 0.54% (Figure 9) with a range of 0.43 to 0.62%. The acidity
significantly increased to about 1.6% after 1 month of pepper fermentation for both wood
(range 1.04% to 2.10%) and plastic (range 0.97% to 2.52%) barrels. Our study agrees
with work reported by Fleming et al. (1983) where fermenting red bell pepper reached
1.53% of lactic acid after two weeks fermentation. Galicia et al. (1996) found that during
jalapeno pepper fermentation TA increased from 0.8% to 1.5%, which promoted a
decreased in pH. Statistically there are no significant differences (p>0.05) in TA between
plastic or wood barrel during the fermentation time course.
35
Pepper Fermetation pH in Different Barrel
3
3.2
3.4
3.6
3.8
4
4.2
4.4
4.6
4.8
5
0 5 10 15 20 25 30Time(month)
pH
Plastic
Wood
Figure 8: Average pH of pepper mash (fresh salted, n=7; fermented mash, n=12) fermented in wood and plastic barrels throughout the 24 months time course.

36
Titratable Acidity
0
0.5
1
1.5
2
2.5
0 5 10 15 20 25 30Time(month)
TA a
s Lac
tic a
cid
(%)
PlasticWood
Figure 9: Mean value of titratable acidity (fresh salted, n=7; fermented mash, n=12) of pepper fermented in wood and plastic barrels throughout the 24 months time course.
37
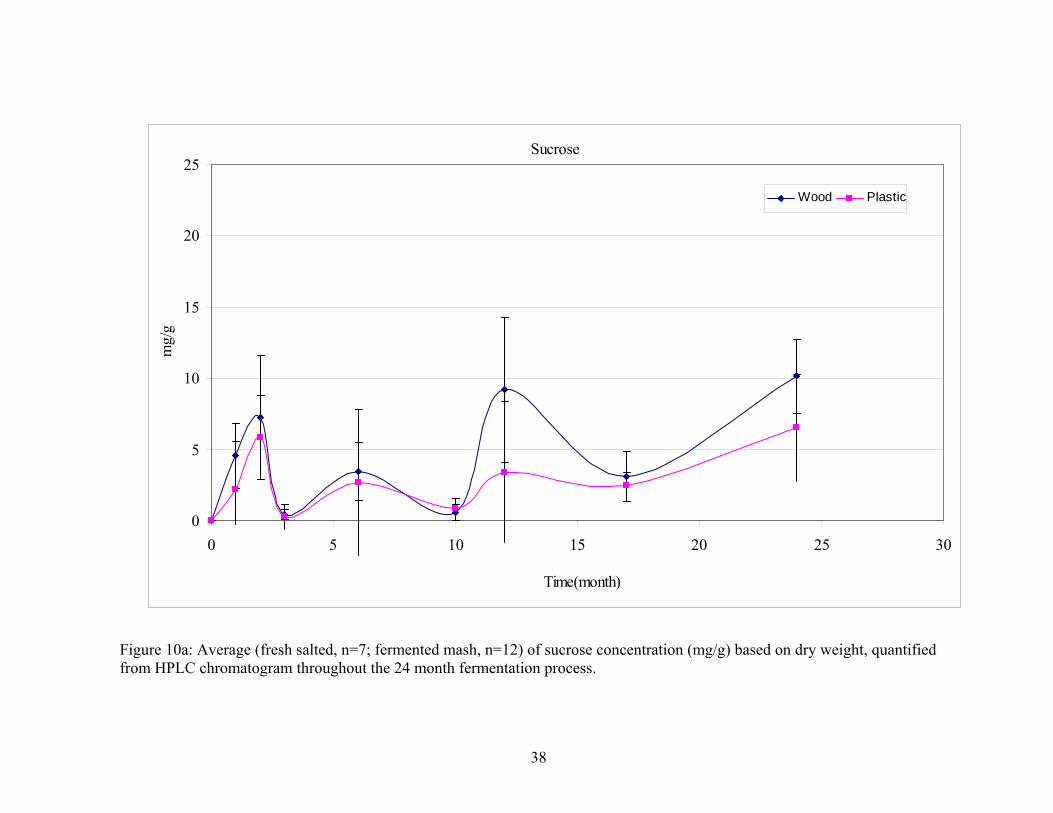
4.3 Soluble Carbohydrate
High performance liquid chromatography was used to quantify soluble sugars
based on dry weight particularly for samples containing high salt. Fresh ground peppers
soluble sugars are fructose (20.26 mg/g of dry weight), glucose (15.83 mg/g of dry
weight) and sucrose (0.07 mg/g of dry weight). No sucrose was detected in the mash
following the addition of 8% salt, and the concentration
of glucose and fructose decreased to 7.57 mg/g and 9.80 mg/g of dry weight respectively
(Figure 10a, b, and c). The mean values of glucose and fructose had decreased 50%
during the grinding and salting process.
Irrespective of fermentation container, sucrose was difficult to quantify. Although
HPLC method is relatively fast method in sugar analysis, it is less sensitive for low sugar
concentrations especially when the refractive index detector was used (Agblevor, 2004).
The sucrose concentration may have been at the limit of detector sensitivity. Glucose and
fructose did not significantly change during the fermentation process for either wood or
plastic barrel (Figure 10B, C). Concentration of glucose remained at about 12mg/g while
fructose decreased to a concentration that was difficult to quantify with refractive index.
In many fermented products, lactic acid bacteria utilize sugars as a carbon source
(Fleming et al., 1983). In our study, glucose remained at a constant concentration during
fermentation process (Figure 10). The lactic acid bacteria may not have fully utilized
glucose as a carbon source. Hughes and Lindsay (1985) reported that glucose persisted
longer than sucrose or fructose in sauerkraut fermentation, but was absent except in very
late stages of sampling (18 weeks). Peterson and Viljoen’s (1925) work showed that
about 0.4% residual reducing sugars (glucose) remain in sauerkraut after fermentation
38
Sucrose
0
5
10
15
20
25
0 5 10 15 20 25 30
Time(month)
mg/
g
Wood Plastic
Figure 10a: Average (fresh salted, n=7; fermented mash, n=12) of sucrose concentration (mg/g) based on dry weight, quantified from HPLC chromatogram throughout the 24 month fermentation process.
39
Glucose
0
5
10
15
20
25
0 5 10 15 20 25 30
Time(month)
mg/
g
Wood Plastic
Figure 10b: The mean value (fresh salted, n=7; fermented mash, n=12) of glucose concentration (mg/g) based on dry weight, quantified from HPLC chromatogram throughout the 24 month fermentation process.

40
Fructose
0
5
10
15
20
25
0 5 10 15 20 25 30Time(month)
mg/
g
Wood Plastic
Figure 10c: The mean value (fresh salted, n=7; fermented mash, n=12) of fructose concentration (mg/g) based on dry weight, quantified from HPLC chromatogram throughout the 24 month fermentation process.
41
was complete. It has been hypothesized that an increase in glucose may have been some
type of secondary metabolic activity. Fleming et al., (1983) suggested that dextran
accumulations often disappeared upon holding of sauerkraut, and hydrolysis of the
dextran could account for the unexpected appearance of glucose in the late stages of
fermentation. Another possibility is pepper fruit pectin might contain constituent sugars
in the side chains. During fermentation, enzymes break down the side chain and release
the residual sugar after fermentation has ceased.
4.4 Total Uronide Content
Figure 11 illustrates the total uronide quantified based on acetone-insoluble dry
tissues in wood and plastic barrel throughout the 24 months of fermentation. After the
air-dried tissues were digested, various types of glycosidic linkages can be degraded
(BeMiller, 1967). All the different pectin backbone structures break down into uronic
acid monomer. The total uronide content quantified uronic acid present in the alcohol
acetone insoluble air-dried tissues. Fresh ground peppers had a mean total uronide
content of 128.14 mg/g with a range of 86.14 mg/g to 173 mg/g and fresh salted pepper
mash had a mean total uronide content of 123.61 mg/g with a range of 83.25 mg/g to
167.93mg/g. Though not significant, after two months fermentation, total uronide content
gradually increased to average of 333 mg/g for plastic (range to 92.34 mg/g to 472.16
mg/g) and 338 mg/g for wood (range to 134.88 mg/g to 444.68 mg/g) at six month
fermentation. The total uronide content then decreased to 189 mg/g for plastic (range to
23.06 mg/g to 348.11 mg/g) and 212mg/g for wood (range to 20.20 mg/g to 251.53
mg/g). The total uronide concentration remained stable from 10 month to 24 month of
fermentation.

42
Previous researches have shown that pectin fractions can be obtained by
sequeantial extraction of the purified cell wall materials with cold and/or hot water or
buffer solution, cold and /or hot solutions of chelating agents [ammonium oxalate,
sodium hexametaphosphate, ethylene diamine tetraacetate (EDTA), cyclohexane diamine
tetraacetate (CDTA)], hot diluted acids and finally cold, diluted sodium hydroxide (
Massiot et al, 1988; Rombouts and Thibault, 1986; Chambat et al., 1984). In our study,
only CDTA-soluble pectin was extracted followed by depolymerization study using size
exclusion chromatography to determine degradation of CDTA-soluble pectin.
4.5 Pectin Depolymerization
Separation in red pepper mashes is thought to be caused by degradation of pectin
molecules because polygalacturonase activity results in the depolymerization of
polyuronide polymers (Huber, 1983) and polyuronide solubilization, the size of chelator
soluble polyuronides was investigated in fermented pepper mash using size exclusion
chromatography (Figure 10A, B). IN fresh Tabasco peppers, uronide polymers of large
molecular size constituted the largest proportion of CDTA-soluble pectin that eluted first
in the void volume followed by a tail of polyuronides of decreasing molecular size that
extended up to the end of the separation range (Arancibia, 2003). A 0.5mg/ml solution of
galacturonic acid was used as the monomer standard. Since it is the end point of pectin
degradation, galacturonic acid has the smallest molecular unit and is the last one to be
eluted. The molecular size profile of CDTA-soluble polyuronide extracted from fresh
unfermented and fermented pepper samples were compared to galacturonic acid standard
(Figure12a). In our study, galacturonic acid (standard) eluted at fraction #11 (Figure 12a);
while the fresh pepper sample eluted at fraction #9.
43
.
Figure 11: The mean value of total uronide quantification (based on acetone-insoluble dry tissues) for pepper mash fermented in wood and plastic barrel were measured at 520 nm absorbance in Spectrophotometer.
Total Uronide
0
50
100
150
200
250
300
350
400
450
500
0 5 10 15 20 25 30
Time(month)
mg/
g
WoodPlastic
44
This indicated that the mature fresh red pepper sample was already extensively
but not fully degraded to galacturonic acid residues. At this stage, pectin polymers were
tightly bound so they were not released from fresh tissue into water, unless the cell wall
structure was disrupted allowing some dissolution. Yield from size exclusion column was
always more than 85%.
Pectin metabolism during fruit ripening in Tabasco pepper was characterized by
an increase in soluble uronide and a decrease in polyuronide molecular size (Arancibia,
2003). Pectin dissolution depends on the size of the uronide polymer. In contrast to
galacturonic acid and uronic acid oligomers, dissolution of larger pectin polymers is
difficult because they are ionically bound and form part of the cell wall structure (Jarvis
1984). Arancibia’s study stated that red-ripe hard-pick Tabasco fruit has a limited degree
of pectin depolymerization comparable to levels found in ripe wild-type tomatoes.
However, Arancibia’s studies used whole Tabasco fruit for research; our study used fresh
pepper that was coarsely ground, salted and fermented. Comparatively, fresh salted
pepper sample eluted at fraction #10 (Figure 12a) which has more degraded chelator-
soluble pectin than the fresh pepper mash. The cell wall structure was disrupted allowing
dissolution of pectin prior to the fermentation process. After one month fermentation,
chelator soluble pectin fully degraded to monomer which eluted at fraction #11
(Figure12b). Highly degraded oligouronide could no longer hold the cell wall structure
leading to its disintegration. Consequently, oligouronide easily diffused out from fresh
tissue. Results were consistent with pepper fermented in wood and plastic barrel after one
month fermentation.
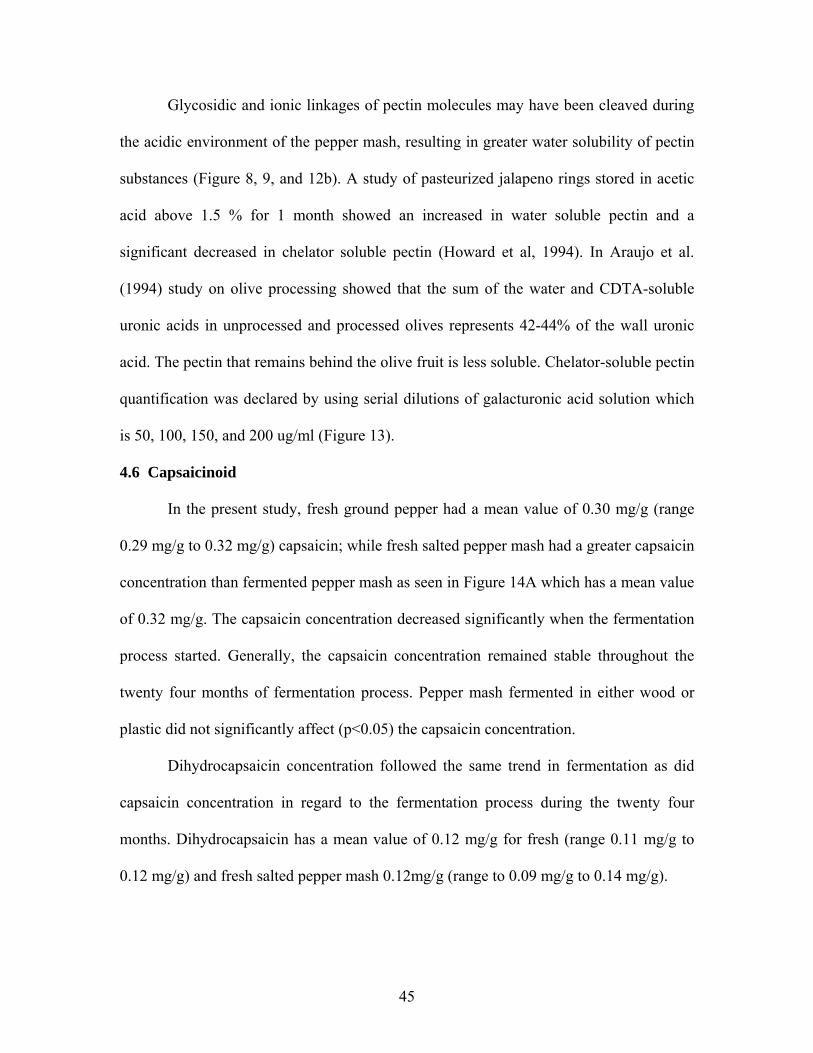
45
Glycosidic and ionic linkages of pectin molecules may have been cleaved during
the acidic environment of the pepper mash, resulting in greater water solubility of pectin
substances (Figure 8, 9, and 12b). A study of pasteurized jalapeno rings stored in acetic
acid above 1.5 % for 1 month showed an increased in water soluble pectin and a
significant decreased in chelator soluble pectin (Howard et al, 1994). In Araujo et al.
(1994) study on olive processing showed that the sum of the water and CDTA-soluble
uronic acids in unprocessed and processed olives represents 42-44% of the wall uronic
acid. The pectin that remains behind the olive fruit is less soluble. Chelator-soluble pectin
quantification was declared by using serial dilutions of galacturonic acid solution which
is 50, 100, 150, and 200 ug/ml (Figure 13).
4.6 Capsaicinoid
In the present study, fresh ground pepper had a mean value of 0.30 mg/g (range
0.29 mg/g to 0.32 mg/g) capsaicin; while fresh salted pepper mash had a greater capsaicin
concentration than fermented pepper mash as seen in Figure 14A which has a mean value
of 0.32 mg/g. The capsaicin concentration decreased significantly when the fermentation
process started. Generally, the capsaicin concentration remained stable throughout the
twenty four months of fermentation process. Pepper mash fermented in either wood or
plastic did not significantly affect (p<0.05) the capsaicin concentration.
Dihydrocapsaicin concentration followed the same trend in fermentation as did
capsaicin concentration in regard to the fermentation process during the twenty four
months. Dihydrocapsaicin has a mean value of 0.12 mg/g for fresh (range 0.11 mg/g to
0.12 mg/g) and fresh salted pepper mash 0.12mg/g (range to 0.09 mg/g to 0.14 mg/g).
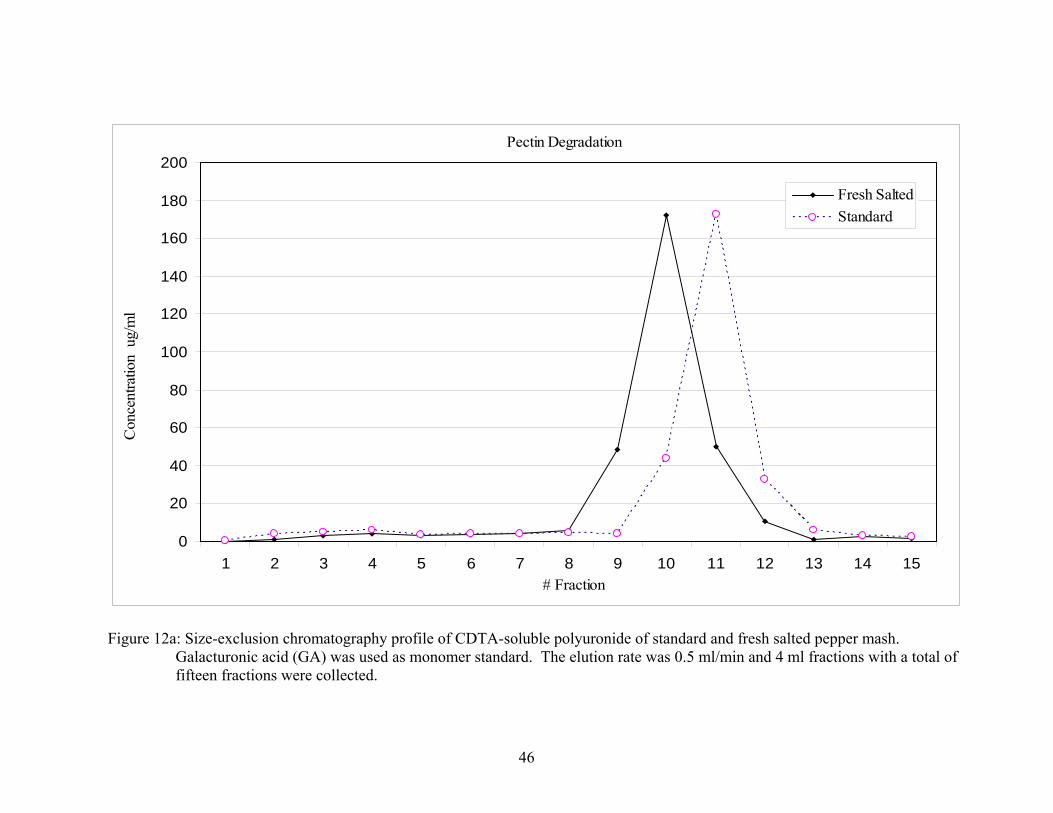
46
Pectin Degradation
0
20
40
60
80
100
120
140
160
180
200
1 2 3 4 5 6 7 8 9 10 11 12 13 14 15# Fraction
Con
cent
ratio
n u
g/m
l
Fresh SaltedStandard
Figure 12a: Size-exclusion chromatography profile of CDTA-soluble polyuronide of standard and fresh salted pepper mash. Galacturonic acid (GA) was used as monomer standard. The elution rate was 0.5 ml/min and 4 ml fractions with a total of fifteen fractions were collected.
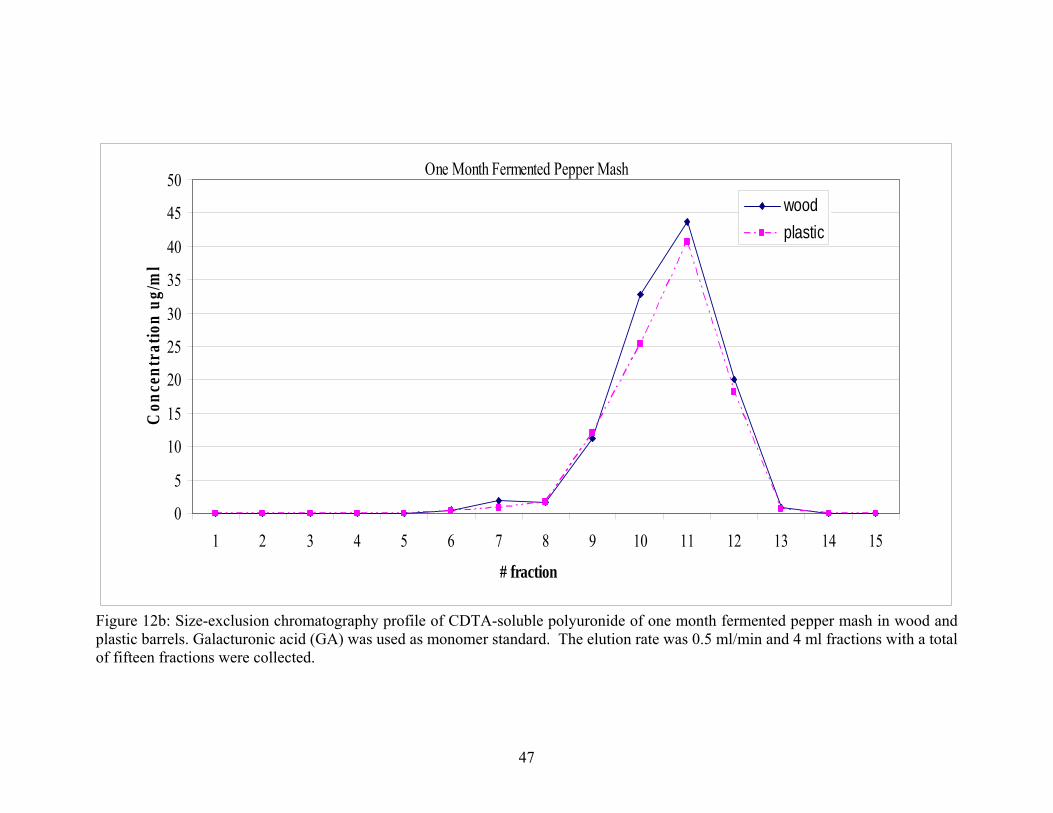
47
One Month Fermented Pepper Mash
0
5
10
15
20
25
30
35
40
45
50
1 2 3 4 5 6 7 8 9 10 11 12 13 14 15
# fraction
Con
cent
ratio
n ug
/ml
woodplastic
Figure 12b: Size-exclusion chromatography profile of CDTA-soluble polyuronide of one month fermented pepper mash in wood and plastic barrels. Galacturonic acid (GA) was used as monomer standard. The elution rate was 0.5 ml/min and 4 ml fractions with a total of fifteen fractions were collected.
48
Galacturonic Acid Standards
y = 99.223xR2 = 0.9975
0
50
100
150
200
250
0 0.5 1 1.5 2 2.5Net absorbance at 520 nm
ug/m
l
Figure 13: Standards were prepared using galacturonic acid at concentration of 15-200 ppm. Absorbance measured at 520 nm in a Perkin Elmer Lambda 35 UV/VIS Spectrophotometer. The line graph have formula of y = 99.223x and R2=0.9975.

49
The mean value of dihydrocapsaicin decreased significantly after 1 month fermentation
to 0.09 mg/g for plastic (range 0.08 to 0.12 mg/g) and 0.1 mg/g for wood (range 0.08 to
0.12 mg/g). Dihydrocapsacin concentration did not affect by barrel material or the
fermentation process because statistically dihydrocapsaicin concentration is not
significantly different.
In this study only capsaicin and dihydrocapsaicin were quantified. Generally
capsaicin and dihydrocapsaicin concentration is stable throughout the fermentation
process. Pepper mash fermented in wood or plastic did not affect concentration
significantly (p<0.05). Capsaicin concentration was about twice those of
dihydrocapsaicin. Wheat (1987) stated that approximately 95% of the pungency is
contributed by these two compounds.
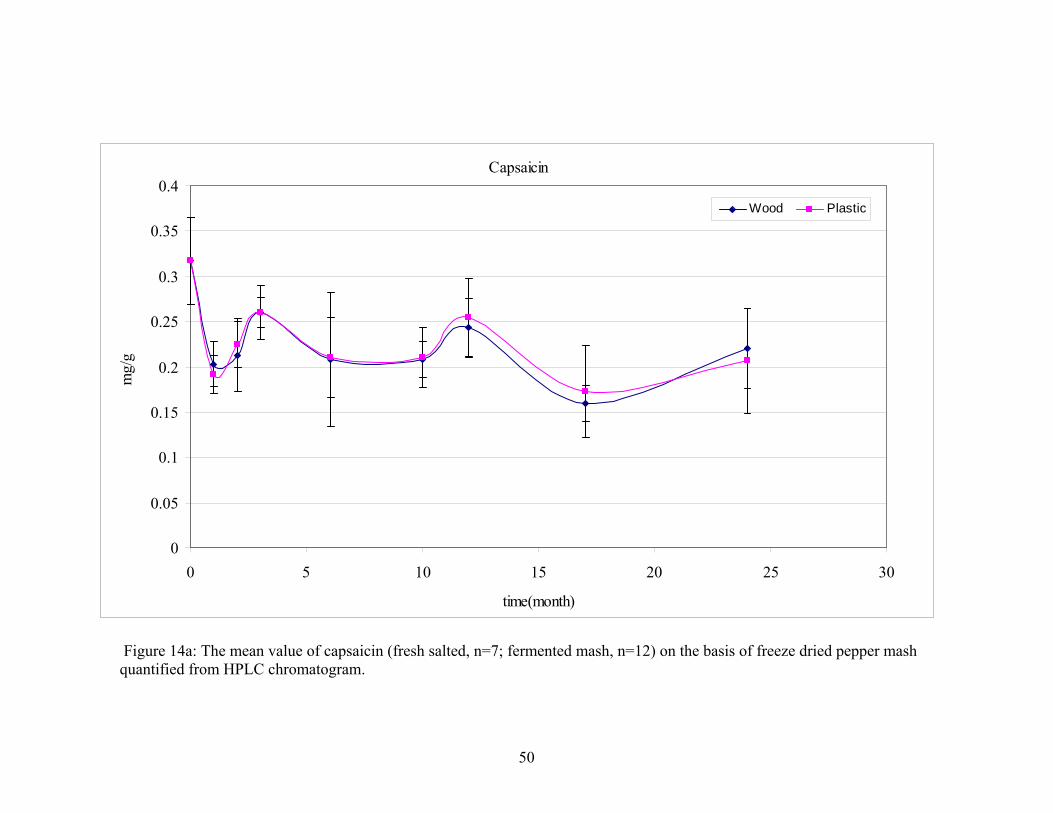
50
Capsaicin
0
0.05
0.1
0.15
0.2
0.25
0.3
0.35
0.4
0 5 10 15 20 25 30
time(month)
mg/
g
Wood Plastic
Figure 14a: The mean value of capsaicin (fresh salted, n=7; fermented mash, n=12) on the basis of freeze dried pepper mash
quantified from HPLC chromatogram.
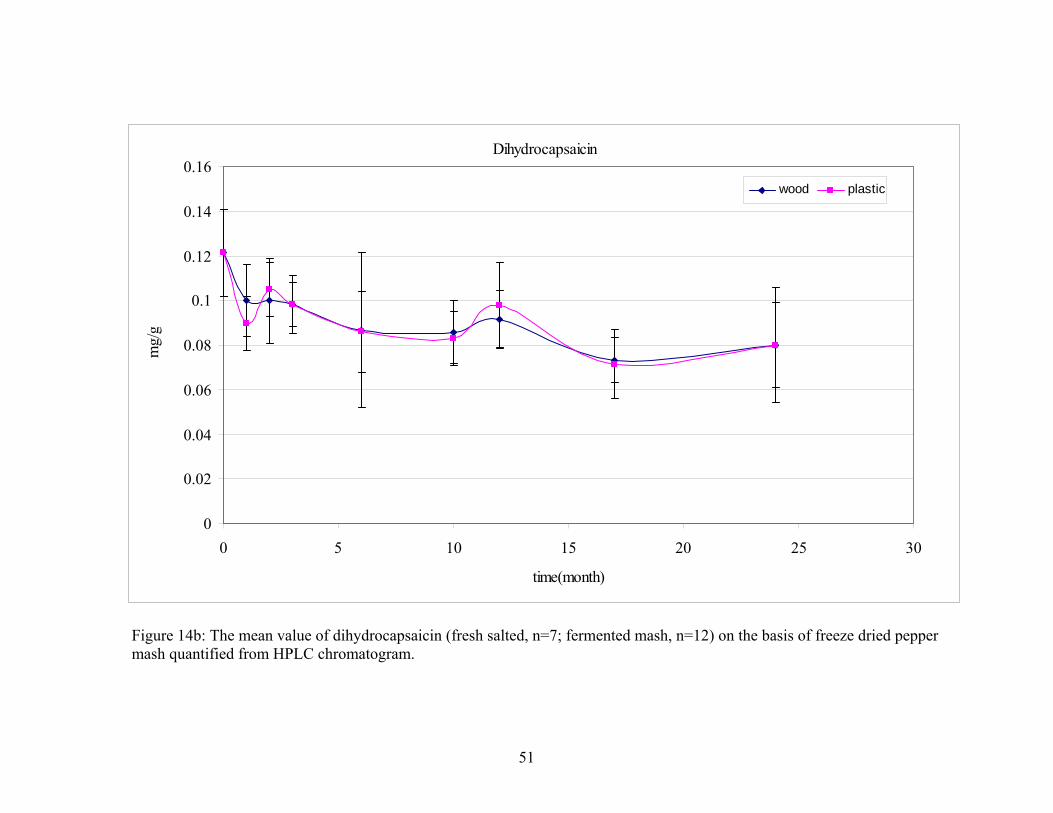
51
Dihydrocapsaicin
0
0.02
0.04
0.06
0.08
0.1
0.12
0.14
0.16
0 5 10 15 20 25 30
time(month)
mg/
g
wood plastic
Figure 14b: The mean value of dihydrocapsaicin (fresh salted, n=7; fermented mash, n=12) on the basis of freeze dried pepper mash quantified from HPLC chromatogram.
52
CHAPTER 5
SUMMARY AND CONCLUSIONS
Louisiana has long been known for its famous hot sauce production state
especially sauce made from Tabasco pepper. Mature fresh pepper fruit are usually
fermented and aged before sauce production. Aging helps pepper to develop flavors,
bouquet and unique odor. Pepper fermentation is also a kind of food preservation method
to prevent undesirable changes in food and food products during storage.
In our study, we investigated the effect of fermentation barrels (wood and plastic)
on the pepper fermentation quality. Many studies have been done on the effect of
fermentation material on wine or beer quality. However, physiocochemical changes such
as, dry weight, pH, titrable acidity, soluble carbohydrate, pectin and capsaicinoids during
pepper fermentation process were unknown. Wooden containers have been a traditional
fermentation tank in many fermented products such as beer, wine, sauerkraut, pickled and
also pepper. Due to their relative permeability, the primary disadvantages of wooden
containers are leakage and contamination. Also, wooden barrels are relatively expensive.
In contrast, plastic barrels have longer usage time, lower cost, lower maintenance, less
leakage, and are easier to sanitize. Upon this emphasis, this research study was attempted
to substitute the traditional wooden barrel with polyethylene plastic barrel to overcome
the cost and sanitation problems. The results of this study indicate that physiocochemical
changes in pepper mash in 24 months fermentation is not significantly influences by
barrel type.

53
Dry weight significantly decreased when the fermentation started for pepper mash
fermented in both wood and plastic barrels. At the end, pepper mash fermented in wood
barrel have a higher dry weight due to the natural porous of the oak wood. However, the
average dry weight was not significantly different. Fresh ground peppers have an average
pH of 5; after 24 months fermentation, final pH decreased to 4. Fresh pepper started out
with 0.58% titrable acidity (expressed as lactic acid) increased to 1.5% after 24 month.
Wood and plastic fermented pepper mash yielded the same results throughout the
fermentation. A very low concentration of sucrose was present in the freshly ground red
pepper pod. However, at the end of fermentation, sucrose, fructose, and glucose were
apparently still available in pepper mash despite lactic acid fermentation. Total uronide
content have an unexpected increased at 3 months to 10 months, however, the
concentration remain stable from 10s month to 24 months. Chelator-soluble pectin was
extensively degraded after 1 month fermentation. This indicated that the mature fresh red
pepper sample was already extensively but not fully degraded to galacturonic acid
residues. At this stage, pectin polymers were tightly bound so they were not released
from fresh tissue into water, unless the cell wall structure was disrupted allowing some
dissolution. However, pepper mash did not turn watery at the end of fermentation
process. Other pectins such as oxalate-soluble pectin, acid-soluble pectin and insoluble
pectin was not investigated in the research study. Fresh salted pepper mash has 0.32mg/g
of capsaicin and 0.12 mg/g of dihydrocapsaicin. Although, capsaicinoids content
decreased slightly when the fermentation started, capsaicin and dihydrocapsaicin remain
stable throughout 24 months of fermentation process.

54
As a conclusion, all the physiocochemical properties of pepper mash fermented in
wood and plastic barrels was not significantly different. Therefore, plastic barrels can be
a substitution for wood barrels in pepper fermentation process and produces high
qualities pepper mash for sauce production.
55
REFERENCES
Adams M.R., and Nout M.J.R. 2001. Fermentation and food safety. An Aspen publication, Maryland. Agblevor, F. A., Murden, A., and Hames, B. R. 2004. Improved method of analysis of
biomass sugars using high-performance liquid chromatography. Biotechnology Letters. 26:1207-1210.
Ahmed, A. and Labavitch J. M. 1977. A simplified method for accurate determination of
cell wall uronide content. J. Food Biochem. 1:361-365.
Anon. 1993. Fruit and Vegetable Processing. Food Cycle Technology Source Books, Intermediate Technology Publications Ltd, UK.
AOAC. Official Methods of Analysis, 15th ed.1990; Association of Official Analytical Chemists: Washington, DC. Attuquayefio, V.K. and Buckle K. A. 1987. Rapid sample preparation method for HPLC
analysis of Capsicum fruits and oleoresins. J. Agr. Food Chem.35:777-779.
Arancibia, R. A. 2003. Enhanced Pectin Degradation is Associated with the Ease of Fruit Detachment in Tabasco Pepper. Phd Dissertation. Louisiana State University.
Araujo, A. J., Labavitch, J. M. and Moreno, A. H. 1994. Changes in the cell wall of olive fruit during processing. J. Agric. Food Chem. 42:1194-1199
Axelsson, L. 1998. Lactic Acid Bacteria: Classification and Physiology. In: Lactic Acid Bacteria, Microbiology and functional Aspects. Ed. S Salminen and A von Wright, Marcel Decker Inc, New York, USA.
Bajaj, K. L. 1980. Colorimetric determination of capsaicin in Capsicum fruits. J. Assoc. Offic. Anal. Chem. 63(6): 1314-1316.
BeMiller, J. N. 1967. Acid-catalyzed hydrolysis of glycosides. Adv. Carbohydr. Chem. 22:25.
Bell, T. A., Etchells, J. L., and Jones, L. D. 1951. Pectinesterase in the cucumber. Arch.
Biochem, 31: 431-441. Blumenkrantz, N., and Asboe-Hansen G. 1973. New method for quantitative
determination of uronic acids. Anal Biochem 54: 484-489.
56
Booth, I. R. 1999. The regulation of intracellular pH in bacteria. In Bacterial Responses to pH, PP. 19-37. Edited by D. J. Chadwick & G. Cardew. Chichester, England: John Wiley & Sons.
Brummell, D. A., and Harpster, M. H. 2001. Cell wall metabolism in fruit softening and quality and its manipulation in transgenic plants. Plant Mol. Biol. 47: 311-340.
Buzzanell, P.J., Dull, R., and Gray, F. 1995. The spice market in the United States:
Recent developments and prospects. ERS/USDA Agriculture Information Bulletin no. 709.
Chambat G., Barnoud, F. and Joseleau, J. P. 1984. Structure of the primary cell walls of
suspension-cultured Rose glauca cells I: polysaccharides associated with cellulose, Plant Physiol. 74:687.
Chavasit, V., Hudson, J. M., Torres, J. A., and Daeschel, M.A. 1991. Evaluation of
fermentative bacteria in a model low salt cucumber juice brine. J. of Food Sci. 56(2): 462-465.
Collins, M.D., Wasmund, L.M., and Bosland, P.W. 1995. Improved method for
quantifying capsaicinoids in capsicum using high performance liquid chromatography. HortScience 30(1):137-139.
Cooper, T.H., J.A. Guzinski, and Fisher, C. 1991. Improved high-performance liquid
chromatography method for the determination of major capsaicinoids in capsicum oleoresins. J. Agr. Food Chem. 39:2253-2256.
Deshpande S.S., and Salunkhe D.K. 2000. Fermented grain legumes, seeds and nuts.
FAO Agricultural Services Bulletin No.142. DellaPenna, D., Lashbrook, C. C., Toenjes K., Giovannoni, J.J., Fisher R. L., and Bennett
A. B. 1990Polygalacturonase isozymes and pectin depolymerization in transgenic rin tomato fruit. Plant Physiol. 94: 1882-1886.
DeWitt D., and Gerlach N. 1990. The whole chile pepper book. Little, Brown and
Company. Boston, p. 39. Dische, Z. 1947. A new specific color reaction of hexuronic acids. J. Biol. Chem.
167:189. Etchells, J. L., Jones, I. D., and Hoffman, M. A. 1943. Brine preservation of vegetables.
Proc. Inst. Food Tech. pp. 176-182. Eschrich, W. 1989. Phloem loading of assimilates. In transport of Photoassimilates (D. A.
Baker and J.A. Milburn, eds), pp 206-263. Longman Scientific & Technical, Essex.
57
FDA. 2003. Department of Health and Human Services. 21 CFR114.90
http://www.cfsan.fda.gov/ Fisher, R. L. and Bennett, A. B. 1991. Role of cell wall hydrolases in fruit ripening.
Annu. Rev. Plant Physiol. Plant Mol. Biol. 42: 675-703. Fleming H. P., McFeeters R. F., Thompson R. L., and Sanders D. C. 1983. Storage
stability of vegetables fermented with pH control. J. of Food Sci. 48:975-981. Galicia, R. R. Garcia, R.M. Machorro, G. S., Reyes, J. F., and Sandoval, S. O. 1996.
Ensalada de Verduras en Escabeche Entalada. Proyecto Terminal, Universidad Autonoma Metropolitana, Mexico City.
Gibbs H. A. A., and O’Garro, L. W. 2004. Capsaicin content of West Indies hot pepper
cultivars using colorimetric and chromatographic techniques. HortSci. 39(1):132-125.
Hoffman, P.G., M.C. Lego, and W.G. Galetto. 1983. Separation and quantification of red
pepper major heat principles by reverse-phase high pressure liquid chromatography. J. Agr. Food Chem. 31: 1326-1330.
Howard, L.R. and Buescher, R. W. 1989. Cell wall characteristics of gamma-radiated
refrigerated cucumber pickles. J. of Food Sci. 54(5): 1266-1268. Howard, L. R., Burma, P., and Wagner, A. B. 1993. Firmness and cell wall
characteristics of pasteurized jalapeno pepper rings affected by calcium chloride and acetic acid. J. of Food Sci. 59(6): 1184-1186.
Howard, L. R., Burma, P., and Wagner, A. B. 1994. Firmness and cell wall
characteristics of pasteurized jalapeno pepper rings as affected by preheating and storage. J. of Food Sci. 62(1): 89-92, 112.
Huber D. J. 1983. Polyuronide degradation and hemicellulose modifications in ripening
tomato fruit. J.l Am Soc Hort. Sci. 108:405-409. Hudson, J.M. and Buescher, R.W. 1985. Pectin substances and firmness of cucumber
pickles as influenced by CaCl2, NaCl, and brine storage. J. Food Biochem. 9:211-214.
Hughes, A. and Lindsay, R. C. 1985. Liquid Chromatogrpahic Analysis of sugars and
mannitol in cabbage and fermenting sauerkraut. J. of Food Science. 50:1662-1667.
58
Jarvis, M. C. 1984. Structure and properties of pectin gels in plant cell walls. Plant, Cell and Environment 7:153-164.
Kitner, P. K., and Buren P. V. 1982. Carbohydrate interference and its correction in
pectin analysis using the m-hydroxydiphenyl method. J.l of Food Sci. 47:756-759. Krajewska, A. M. and J.J. Powers. 1988. Sensory properties of naturally occurring
capsaicinoids. J. Food Sci. 53:902-905.
Little, W., Fowler, H.W. and Coulson J. 1973. The Shorter Oxford English Dictionary, Oxford University Press, UK
Luh B.S., and Woodroof J.G. 1975. Commercial vegetable processing. The Avi Publishing Company, Inc. Westport, CT. 458-459pp.
Luning P. A., Vries R. V., Yuksei D., Ebberhorst-Seller T., Wichers H. J, and Roozen J.
P. 1994. Combined instrumental and sensory evaluation of flavor of fresh bell peppers (Capsisum annuum) harvested at three maturation stages. J. Agric. Food Chem. 42, 2885-2861.
Mao, C. 1999. Investigation of Tabasco pepper (Capsicum frutescens) fruit ripening and
abscission. Master thesis. Louisiana State University. Massiot, P., Rouau, X., and Thibault, J. F.1988. Structural studies of pectin substances
from pulp of grape berries, Carbohydr. Res. 182:63. Mathew, A.G., Lewis, Y.S., Krishnamurthy, N. and Nambudiri, E.S. 1971. Capsacin.
Flav. Industry. 2:691. Nielson, T. H. and Veierskov, B. 1990. Regulation of carbon partitioning in source and
sink leaf parts in sweet pepper (Capsicum annuum L) plants. Role of fructose 2,6-bisphosphate. Plant physiology. 93:637-641.
Nielson, T. H., Skjaerbaek H. C., and Karlsen P. 1991 Carbohydrate metabolism during
fruit development in sweet pepper (Capsicum annuum) plants. Physiologia planetarium 82: 311-319.
Northcote, D. H.1986. Control of pectin synthesis and deposition during plant cell wall
growth, Chemistry and Function of Pectins, ACS Symposium Series. American Chemical society, Washington DC. Pp134.
Parrish, M. 1996. Liquid chromatography method for determining capsaicinoids in
capsicums and their extractives: collaborative study. J. Assn. Offic. Anal. Chem. 79(3): 738-745.
59
Pederson, C. S. and Albury, M. N., 1954. The influence of salt and temperature on the microflora of sauerkraut fermentation. Food Technology. 8, 1-5.
Pederson, C.S. 1971. Microbiology of food fermentations. Avi Publishing Co, Westpoort,
Conn. pp79-85 Pederson, C. S., and Luh, B. S. 1988. Pickling and fermenting vegetables, In: Luh B. S.,
and Woodroof, J. G. Commercial Vegetable Processing. 2nd ed. Westport: AVI, pp 475-501.
Peterson, W. H., and Viljoen, J.A. 1925. Variations in the chemical composition of
cabbage and sauerkraut. The Canner July 18:19. Pilnik W. 1990. Pectin- a many splendoured thing, Gums and stabilizers for the food
industry 5, IRL Press, Oxford, P.209. Rombouts F. M. and Thibault J. F. 1986. Feruloylated pectin substances from sugar-beet.
Carbohydr. Res. 154:177. Rylski, I. 1986. Pepper(Capsicum). In CRC handbook of fruit set and development.
pp341-354. Rymal, K.S., R.D. Cosper, and D. A. Smith. 1984. Injection-extraction procedure for
rapid determination of relative pungency in fresh jalapeno peppers. J. Assn. Offic. Anal. Chem. 67:658-659.
Saria, A., F. Lembeck, and G. Scotfish. 1981. Determination of capsaicin in tissues and
separation of capsaicin analogues by high performance liquid chromatography. J. Chromatogrpahy 208:41-46.
Scoville, W. L. 1912. Note Capsicum. J. Amer. Pharm. Assn. 1:453. Selvendran, R. R. 1975. Analysis of cell wall material from plant tissues: extraction and
purification. Phytochem. 14: 1011. Seymour G.B., and Gross K. C. 1996. Cell wall disassembly and fruit softening.
Postharvest News and Information 7, 5N–52N. Smith, P.G., B. Villalon and P.L. Villa. 1987. Horticultural classification of peppers
grown in the United States. HortScience 22:11-13. Tibbits, C. W., MacDougall, A. J. 1998. Calcium binding and swelling behaviour of high
methoxyl pectin gel. Carbohydrate Research 310: 101-107. Todd, P.H., Bengsinger and M.T. Biftu. 1977. Determination of pungency due to
Capsicum by GLC. J. Food Sci. 42:660.
60
Walker, P.M.B. 1988. Chambers Science and Technology Dictionary, Chambers, Cambridge University Press, UK.
Wheat P.L. 1987. Quantification of capsaicinoid compounds in Tabasco peppers as affected by maturation and growing region. Master Thesis. Louisiana State University.
Woodbury, J.E., 1980. Determination of Capsicums pungency by HPLC and
spectrofluorometric detection. J. Assn. Offic. Anal. Chem. 63(3): 556-558. Yokotsuka K., Matsunaga M., and Singleton, V. 1994. Comparison of composition of
koshu white wine fermented in oak barrels and plastic tanks. Am. J. Enol. Vitic., 45(1).
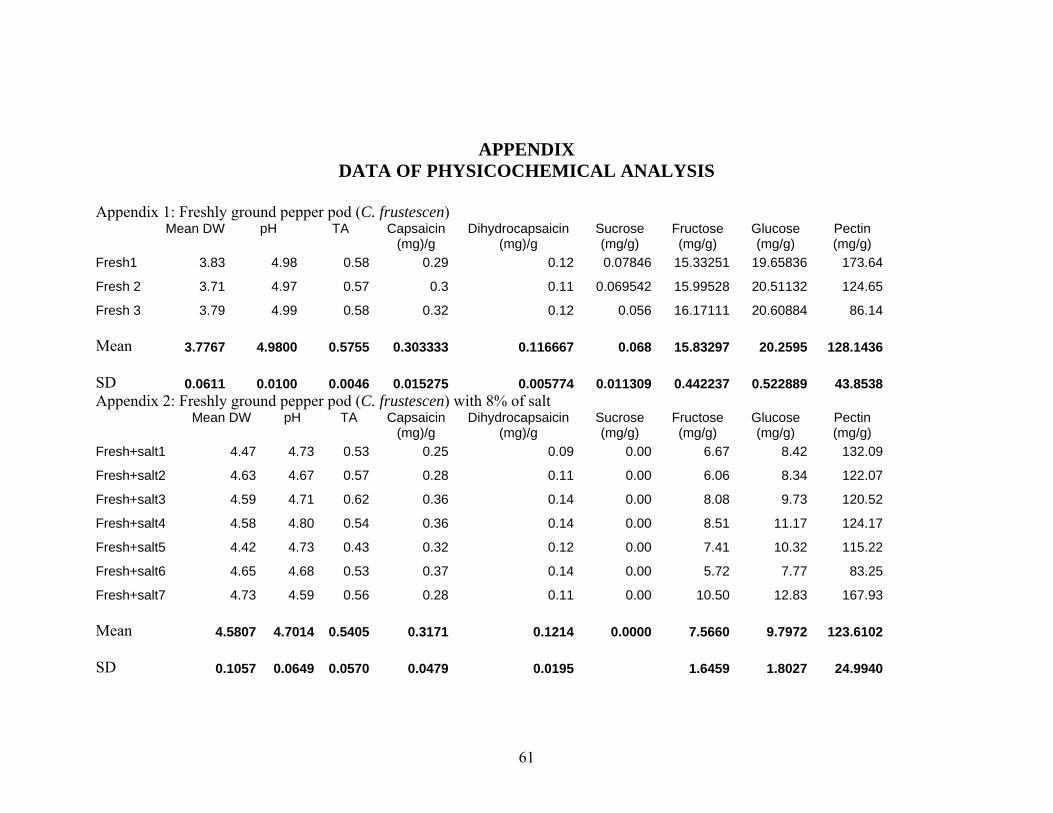
61
APPENDIX
DATA OF PHYSICOCHEMICAL ANALYSIS
Appendix 1: Freshly ground pepper pod (C. frustescen) Mean DW pH TA Capsaicin
(mg)/g Dihydrocapsaicin
(mg)/g Sucrose (mg/g)
Fructose (mg/g)
Glucose (mg/g)
Pectin (mg/g)
Fresh1 3.83 4.98 0.58 0.29 0.12 0.07846 15.33251 19.65836 173.64
Fresh 2 3.71 4.97 0.57 0.3 0.11 0.069542 15.99528 20.51132 124.65
Fresh 3 3.79 4.99 0.58 0.32 0.12 0.056 16.17111 20.60884 86.14 Mean 3.7767 4.9800 0.5755 0.303333 0.116667 0.068 15.83297 20.2595 128.1436 SD 0.0611 0.0100 0.0046 0.015275 0.005774 0.011309 0.442237 0.522889 43.8538Appendix 2: Freshly ground pepper pod (C. frustescen) with 8% of salt Mean DW pH TA Capsaicin
(mg)/g Dihydrocapsaicin
(mg)/g Sucrose (mg/g)
Fructose (mg/g)
Glucose (mg/g)
Pectin (mg/g)
Fresh+salt1 4.47 4.73 0.53 0.25 0.09 0.00 6.67 8.42 132.09
Fresh+salt2 4.63 4.67 0.57 0.28 0.11 0.00 6.06 8.34 122.07
Fresh+salt3 4.59 4.71 0.62 0.36 0.14 0.00 8.08 9.73 120.52
Fresh+salt4 4.58 4.80 0.54 0.36 0.14 0.00 8.51 11.17 124.17
Fresh+salt5 4.42 4.73 0.43 0.32 0.12 0.00 7.41 10.32 115.22
Fresh+salt6 4.65 4.68 0.53 0.37 0.14 0.00 5.72 7.77 83.25
Fresh+salt7 4.73 4.59 0.56 0.28 0.11 0.00 10.50 12.83 167.93 Mean 4.5807 4.7014 0.5405 0.3171 0.1214 0.0000 7.5660 9.7972 123.6102 SD 0.1057 0.0649 0.0570 0.0479 0.0195 1.6459 1.8027 24.9940

62
Appendix 3 : One month fermented pepper mash in plastic barrel Mean
DW pH TA Capsaicin
(mg)/g Dihydrocapsaicin
(mg)/g Sucrose (mg/g)
Fructose (mg/g)
Glucose (mg/g)
Pectin (mg/g)
PA1M 3.38 4.02 1.73 0.20 0.10 2.15 13.76 7.44 144.74
PB1M 3.80 3.94 1.32 0.24 0.12 2.11 14.04 5.90 136.93
PC1M 3.81 3.94 2.52 0.22 0.10 1.90 12.19 6.59 148.83
PD1M 3.77 4.01 1.25 0.20 0.10 0.00 6.81 1.30 137.39
PE1M 4.01 4.03 1.17 0.18 0.08 0.00 6.40 1.23 62.54
PF1M 3.19 3.07 1.98 0.14 0.06 2.13 11.38 2.42 114.39
PG1M 3.96 3.59 1.19 0.18 0.08 1.88 11.00 5.07 50.08
PH1M 4.32 4.41 0.93 0.18 0.08 1.58 8.41 1.79 103.41
PI1M 3.96 4.00 1.22 0.18 0.08 1.88 10.99 5.06 151.61
PJ1M 4.11 3.60 1.24 0.20 0.10 1.31 10.90 8.74 110.20
PK1M 4.09 4.28 0.97 0.20 0.08 8.89 8.91 3.75 120.94
PL1M 3.51 3.73 1.12 0.18 0.10 2.03 4.60 3.77 71.66 Mean 3.8233 3.8850 1.3872 0.1917 0.0900 2.1552 9.9494 4.4204 112.7259 SD 0.3265 0.3519 0.4645 0.0248 0.0160 2.2555 2.9528 2.4725 34.8087 TA = Titratable Acidity (expressed as lactic acid); SD = Standard Deviation; DW = Dry Weight Sucrose, fructose, and glucose expressed on dry weight basis Pectin expressed on per gram of air-dried tissues Capsaicin and dihydrocapsaicin expressed on per gram of freeze dried tissue
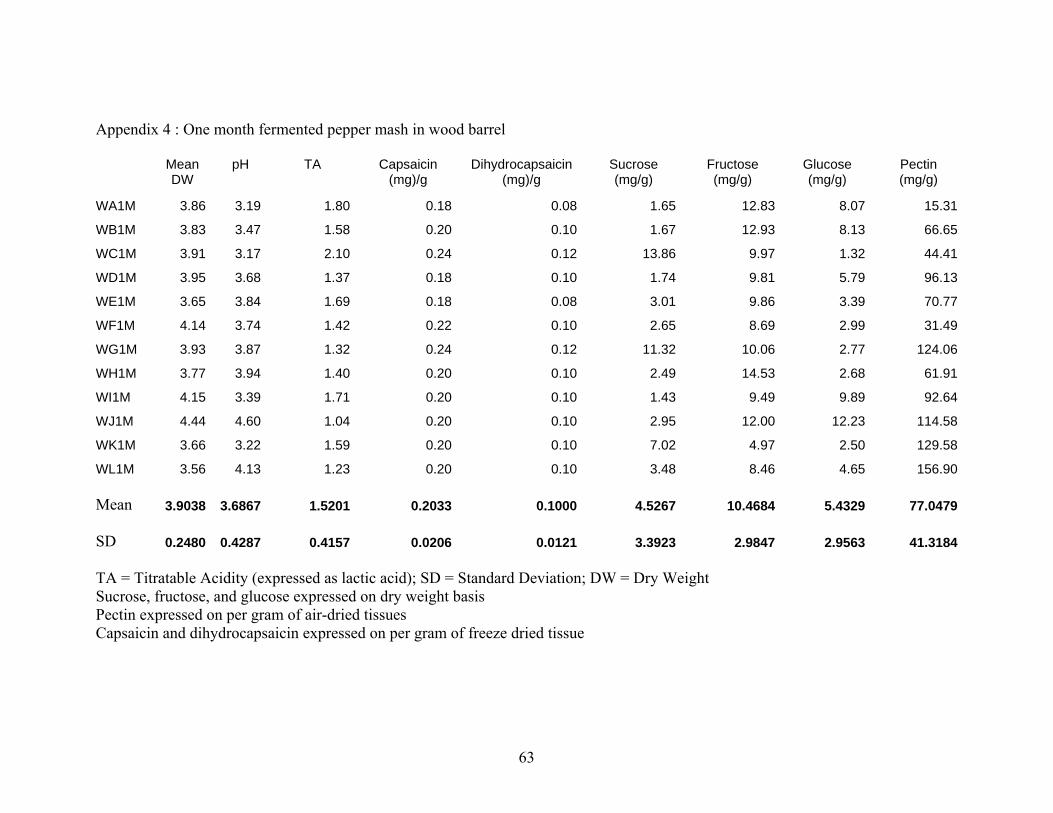
63
Appendix 4 : One month fermented pepper mash in wood barrel Mean
DW pH TA Capsaicin
(mg)/g Dihydrocapsaicin
(mg)/g Sucrose (mg/g)
Fructose (mg/g)
Glucose (mg/g)
Pectin (mg/g)
WA1M 3.86 3.19 1.80 0.18 0.08 1.65 12.83 8.07 15.31
WB1M 3.83 3.47 1.58 0.20 0.10 1.67 12.93 8.13 66.65
WC1M 3.91 3.17 2.10 0.24 0.12 13.86 9.97 1.32 44.41
WD1M 3.95 3.68 1.37 0.18 0.10 1.74 9.81 5.79 96.13
WE1M 3.65 3.84 1.69 0.18 0.08 3.01 9.86 3.39 70.77
WF1M 4.14 3.74 1.42 0.22 0.10 2.65 8.69 2.99 31.49
WG1M 3.93 3.87 1.32 0.24 0.12 11.32 10.06 2.77 124.06
WH1M 3.77 3.94 1.40 0.20 0.10 2.49 14.53 2.68 61.91
WI1M 4.15 3.39 1.71 0.20 0.10 1.43 9.49 9.89 92.64
WJ1M 4.44 4.60 1.04 0.20 0.10 2.95 12.00 12.23 114.58
WK1M 3.66 3.22 1.59 0.20 0.10 7.02 4.97 2.50 129.58
WL1M 3.56 4.13 1.23 0.20 0.10 3.48 8.46 4.65 156.90 Mean 3.9038 3.6867 1.5201 0.2033 0.1000 4.5267 10.4684 5.4329 77.0479 SD 0.2480 0.4287 0.4157 0.0206 0.0121 3.3923 2.9847 2.9563 41.3184 TA = Titratable Acidity (expressed as lactic acid); SD = Standard Deviation; DW = Dry Weight Sucrose, fructose, and glucose expressed on dry weight basis Pectin expressed on per gram of air-dried tissues Capsaicin and dihydrocapsaicin expressed on per gram of freeze dried tissue
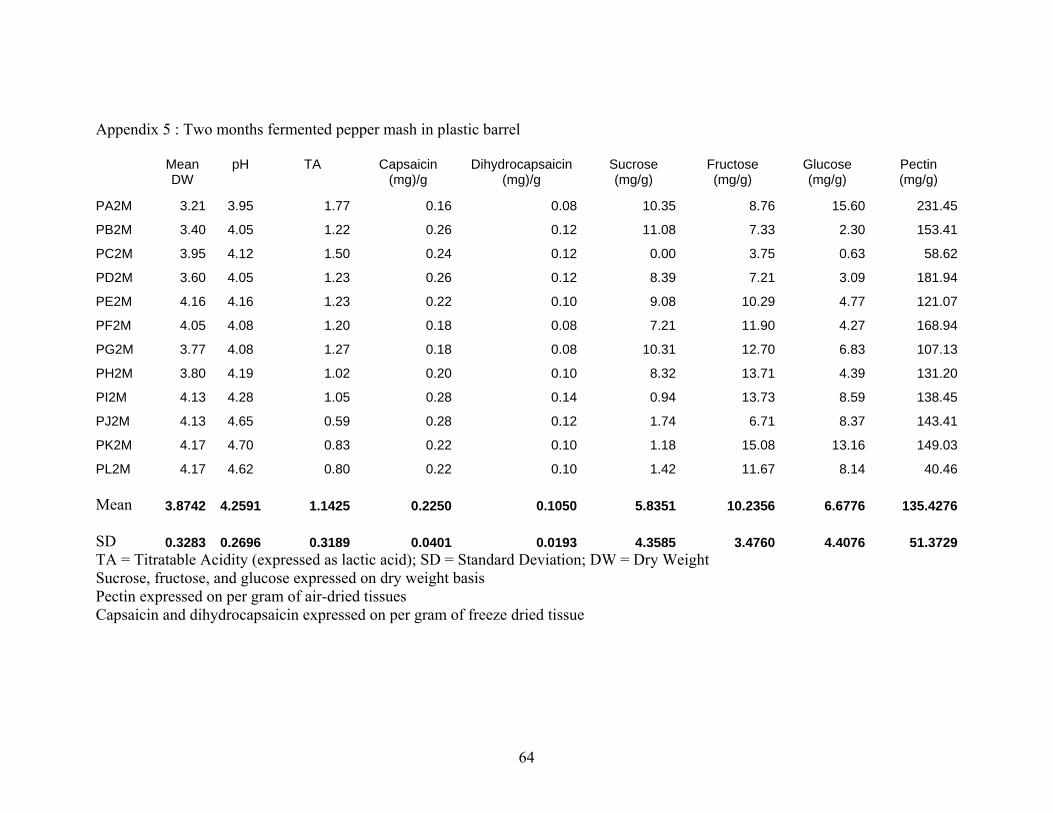
64
Appendix 5 : Two months fermented pepper mash in plastic barrel Mean
DW pH TA Capsaicin
(mg)/g Dihydrocapsaicin
(mg)/g Sucrose (mg/g)
Fructose (mg/g)
Glucose (mg/g)
Pectin (mg/g)
PA2M 3.21 3.95 1.77 0.16 0.08 10.35 8.76 15.60 231.45
PB2M 3.40 4.05 1.22 0.26 0.12 11.08 7.33 2.30 153.41
PC2M 3.95 4.12 1.50 0.24 0.12 0.00 3.75 0.63 58.62
PD2M 3.60 4.05 1.23 0.26 0.12 8.39 7.21 3.09 181.94
PE2M 4.16 4.16 1.23 0.22 0.10 9.08 10.29 4.77 121.07
PF2M 4.05 4.08 1.20 0.18 0.08 7.21 11.90 4.27 168.94
PG2M 3.77 4.08 1.27 0.18 0.08 10.31 12.70 6.83 107.13
PH2M 3.80 4.19 1.02 0.20 0.10 8.32 13.71 4.39 131.20
PI2M 4.13 4.28 1.05 0.28 0.14 0.94 13.73 8.59 138.45
PJ2M 4.13 4.65 0.59 0.28 0.12 1.74 6.71 8.37 143.41
PK2M 4.17 4.70 0.83 0.22 0.10 1.18 15.08 13.16 149.03
PL2M 4.17 4.62 0.80 0.22 0.10 1.42 11.67 8.14 40.46 Mean 3.8742 4.2591 1.1425 0.2250 0.1050 5.8351 10.2356 6.6776 135.4276 SD 0.3283 0.2696 0.3189 0.0401 0.0193 4.3585 3.4760 4.4076 51.3729TA = Titratable Acidity (expressed as lactic acid); SD = Standard Deviation; DW = Dry Weight Sucrose, fructose, and glucose expressed on dry weight basis Pectin expressed on per gram of air-dried tissues Capsaicin and dihydrocapsaicin expressed on per gram of freeze dried tissue

65
Appendix 6: Two months fermented pepper mash in wood barrel Mean
DW pH TA Capsaicin
(mg)/g Dihydrocapsaicin
(mg)/g Sucrose (mg/g)
Fructose (mg/g)
Glucose (mg/g)
Pectin (mg/g)
WA2M 3.92 4.06 1.40 0.20 0.10 6.59 10.72 9.63 145.36
WB2M 3.70 3.99 1.82 0.18 0.08 3.34 14.30 3.86 179.61
WC2M 3.94 3.99 1.43 0.22 0.10 3.48 11.34 1.58 79.28
WD2M 3.75 3.98 1.50 0.20 0.10 8.50 20.29 2.74 107.19
WE2M 3.65 3.92 1.60 0.18 0.08 10.45 10.96 3.74 192.25
WF2M 3.95 4.08 1.39 0.24 0.12 6.42 11.20 6.51 187.56
WG2M 3.95 4.00 1.35 0.22 0.10 11.95 10.68 4.80 82.79
WH2M 3.77 4.07 1.37 0.20 0.10 8.47 20.21 2.73 158.00
WI2M 4.03 4.17 1.32 0.24 0.10 5.37 11.35 9.86 171.02
WJ2M 4.22 4.25 1.22 0.22 0.10 5.13 10.83 9.42 166.32
WK2M 3.99 4.26 1.49 0.20 0.10 5.77 14.36 7.50 65.08
WL2M 3.90 4.32 1.35 0.26 0.12 11.43 14.36 7.01 181.47 Mean 3.8950 4.0908 1.4368 0.2133 0.1000 7.2422 13.3822 5.7823 142.9946 SD 0.1591 0.1294 0.1555 0.0246 0.0121 2.9171 3.5269 2.9335 46.5433TA = Titratable Acidity (expressed as lactic acid); SD = Standard Deviation; DW = Dry Weight Sucrose, fructose, and glucose expressed on dry weight basis Pectin expressed on per gram of air-dried tissues Capsaicin and dihydrocapsaicin expressed on per gram of freeze dried tissue

66
Appendix 7: Three months fermented pepper mash in plastic barrel Mean
DW pH TA Capsaicin
(mg)/g Dihydrocapsaicin
(mg)/g Sucrose (mg/g)
Fructose (mg/g)
Glucose (mg/g)
Pectin (mg/g)
PA3M 3.52 3.87 1.55 0.30 0.12 0.00 8.26 7.33 330.03
PB3M 3.00 3.91 1.49 0.24 0.10 0.00 12.35 6.91 225.36
PC3M 3.90 4.61 0.94 0.26 0.10 1.04 17.14 18.63 216.95
PD3M 3.76 4.36 1.00 0.26 0.10 0.68 11.88 12.65 134.87
PE3M 3.92 4.23 0.96 0.26 0.10 0.00 15.43 14.44 576.70
PF3M 3.96 3.98 1.05 0.26 0.10 0.00 10.17 2.63 153.07
PG3M 3.73 4.49 0.73 0.24 0.08 0.04 9.31 16.39 206.25
PH3M 3.86 4.60 0.77 0.26 0.10 0.00 6.53 2.22 245.85
PI3M 3.74 4.47 0.87 0.28 0.10 0.00 9.21 13.77 251.03
PJ3M 3.69 4.07 1.14 0.26 0.10 0.20 16.59 18.76 238.88
PK3M 3.66 4.63 0.59 0.24 0.08 0.78 16.27 19.37 228.18
PL3M 3.85 4.10 0.96 0.26 0.10 0.23 18.99 11.85 190.93 Mean 3.7146 4.2767 1.0044 0.2600 0.0983 0.2473 12.6773 12.0795 249.8404 SD 0.2573 0.2851 0.2819 0.0171 0.0103 0.3708 4.0795 6.0592 114.2218TA = Titratable Acidity (expressed as lactic acid); SD = Standard Deviation; DW = Dry Weight Sucrose, fructose, and glucose expressed on dry weight basis Pectin expressed on per gram of air-dried tissues Capsaicin and dihydrocapsaicin expressed on per gram of freeze dried tissue

67
Appendix 8: Three months fermented pepper mash in wood barrel Mean
DW pH TA Capsaicin
(mg)/g Dihydrocapsaicin
(mg)/g Sucrose (mg/g)
Fructose (mg/g)
Glucose (mg/g)
Pectin (mg/g)
WA3M 2.96 3.92 1.61 0.28 0.12 0.00 9.75 7.03 233.04
WB3M 3.63 3.95 1.96 0.22 0.08 2.96 16.05 1.87 163.01
WC3M 3.63 3.98 1.28 0.22 0.08 0.10 15.44 12.53 294.02
WD3M 3.61 3.92 1.57 0.26 0.10 0.41 16.15 15.60 297.34
WE3M 3.62 3.90 1.65 0.28 0.10 0.00 8.08 7.48 262.24
WF3M 3.46 3.95 1.77 0.26 0.10 0.00 16.50 3.07 224.58
WG3M 3.79 4.03 1.50 0.30 0.12 0.00 9.17 10.74 164.62
WH3M 3.25 4.02 1.73 0.24 0.10 1.20 18.66 7.99 281.53
WI3M 3.78 4.54 1.15 0.26 0.10 0.36 15.67 20.13 296.97
WJ3M 3.46 4.37 0.95 0.22 0.08 0.00 20.87 16.66 165.51
WK3M 3.83 4.28 1.10 0.28 0.10 0.07 16.50 16.83 228.83
WL3M 3.72 4.30 1.67 0.30 0.10 0.00 17.29 6.92 211.54 Mean 3.5592 4.0967 1.4953 0.2600 0.0983 0.4248 15.0110 10.5706 235.2693 SD 0.2508 0.2162 0.3063 0.0295 0.0134 0.8711 3.9336 5.8049 52.0306TA = Titratable Acidity (expressed as lactic acid); SD = Standard Deviation; DW = Dry Weight Sucrose, fructose, and glucose expressed on dry weight basis Pectin expressed on per gram of air-dried tissues Capsaicin and dihydrocapsaicin expressed on per gram of freeze dried tissue

68
Appendix 9: Six months fermented pepper mash in plastic barrel Mean
DW pH TA Capsaicin
(mg)/g Dihydrocapsaicin
(mg)/g Sucrose (mg/g)
Fructose (mg/g)
Glucose (mg/g)
Pectin (mg/g)
PA6M 3.38 3.96 1.44 0.20 0.08 2.08 15.72 7.64 472.10
PB6M 3.38 3.94 1.35 0.34 0.14 2.20 12.99 13.57 349.31
PC6M 3.29 4.00 1.31 0.20 0.08 3.52 18.76 7.24 392.02
PD6M 3.30 4.11 1.22 0.20 0.08 1.91 15.55 15.14 417.83
PE6M 3.26 4.12 1.05 0.20 0.08 2.30 17.84 15.79 370.27
PF6M 3.38 4.15 1.26 0.20 0.08 3.02 16.07 13.86 366.73
PG6M 3.31 4.06 1.17 0.16 0.06 1.86 18.99 19.96 92.34
PH6M 3.58 4.36 1.15 0.40 0.18 2.26 18.29 15.58 273.62
PI6M 3.33 3.83 1.35 0.18 0.08 8.89 14.97 6.51 407.46
PJ6M 3.26 3.91 1.53 0.16 0.06 2.47 20.05 17.09 181.80
PK6M 3.37 3.99 1.07 0.16 0.06 1.94 15.27 12.06 298.44
PL6M 3.36 3.93 0.97 0.18 0.08 0.30 19.53 20.27 339.59 Mean 3.3519 4.0554 1.2244 0.2108 0.0862 2.6613 16.8510 13.7962 333.2116 SD 0.0827 0.1631 0.1685 0.0738 0.0350 2.0109 2.1703 4.4476 102.1808TA = Titratable Acidity (expressed as lactic acid); SD = Standard Deviation; DW = Dry Weight Sucrose, fructose, and glucose expressed on dry weight basis Pectin expressed on per gram of air-dried tissues Capsaicin and dihydrocapsaicin expressed on per gram of freeze dried tissue

69
Appendix 10: Six months fermented pepper mash in wood barrel Mean
DW pH TA Capsaicin
(mg)/g Dihydrocapsaicin
(mg)/g Sucrose (mg/g)
Fructose (mg/g)
Glucose (mg/g)
Pectin (mg/g)
WA6M 3.58 4.03 1.30 0.26 0.10 1.44 14.10 14.29 434.30
WB6M 3.93 4.42 1.22 0.28 0.12 2.19 15.48 13.74 394.86
WC6M 3.36 3.98 1.35 0.18 0.08 2.20 12.68 14.76 280.37
WD6M 4.06 4.07 1.23 0.24 0.10 1.23 11.99 10.96 227.54
WE6M 3.78 4.12 1.14 0.16 0.06 2.28 16.09 14.28 391.78
WF6M 3.58 3.99 1.24 0.22 0.08 1.96 17.50 15.08 441.73
WG6M 3.38 4.18 1.22 0.24 0.10 2.78 17.66 12.88 293.80
WH6M 3.56 4.04 1.12 0.18 0.08 1.75 13.72 14.33 289.24
WI6M 3.81 4.05 1.08 0.18 0.08 1.64 13.08 14.06 134.88
WJ6M 3.11 3.85 1.84 0.18 0.08 19.69 13.59 8.50 444.68
WK6M 3.35 4.36 1.35 0.24 0.10 2.33 18.57 21.06 402.64
WL6M 3.69 4.23 1.17 0.14 0.06 1.52 14.32 14.93 326.77 Mean 3.3260 3.8064 1.2709 0.2083 0.0867 3.4184 14.8978 14.0727 338.5496 SD 0.2717 0.1633 0.1980 0.0439 0.0178 5.1444 2.1419 2.9143 96.7445TA = Titratable Acidity (expressed as lactic acid); SD = Standard Deviation; DW = Dry Weight Sucrose, fructose, and glucose expressed on dry weight basis Pectin expressed on per gram of air-dried tissues Capsaicin and dihydrocapsaicin expressed on per gram of freeze dried tissue

70
Appendix 11: Ten months fermented pepper mash in plastic barrel Mean
DW pH TA Capsaicin
(mg)/g Dihydrocapsaicin
(mg)/g Sucrose (mg/g)
Fructose (mg/g)
Glucose (mg/g)
Pectin (mg/g)
PA10M 3.48 3.96 1.25 0.24 0.08 0.54 15.04 10.49 230.56
PB10M 3.60 4.13 1.34 0.20 0.08 0.85 12.90 3.46 139.27
PC10M 3.15 4.00 1.25 0.24 0.10 0.45 16.77 6.53 348.11
PD10M 3.46 4.04 1.63 0.20 0.10 1.73 18.17 8.70 193.26
PE10M 3.57 3.95 1.86 0.20 0.08 1.29 14.22 2.41 239.62
PF10M 3.51 4.26 1.13 0.20 0.10 1.34 9.60 1.75 23.06
PG10M 4.08 4.07 1.50 0.20 0.08 1.25 16.80 3.27 60.90
PH10M 3.55 3.92 1.58 0.18 0.10 1.11 11.05 2.58 228.22
PI10M 2.74 3.96 1.17 0.20 0.08 0.00 5.94 3.39 242.75
PJ10M 3.66 4.18 1.41 0.22 0.06 0.26 17.37 2.86 228.46
PK10M 3.65 4.15 1.32 0.20 0.06 0.28 17.23 6.23 176.40
PL10M 3.28 4.02 1.31 0.24 0.08 1.39 18.51 7.03 167.63 Mean 3.4746 4.0533 1.3947 0.2100 0.0833 0.8740 14.4687 4.8920 189.8530 SD 0.3230 0.1063 0.2131 0.0200 0.0144 0.5538 3.9067 2.8188 86.6731TA = Titratable Acidity (expressed as lactic acid); SD = Standard Deviation; DW = Dry Weight Sucrose, fructose, and glucose expressed on dry weight basis Pectin expressed on per gram of air-dried tissues Capsaicin and dihydrocapsaicin expressed on per gram of freeze dried tissue
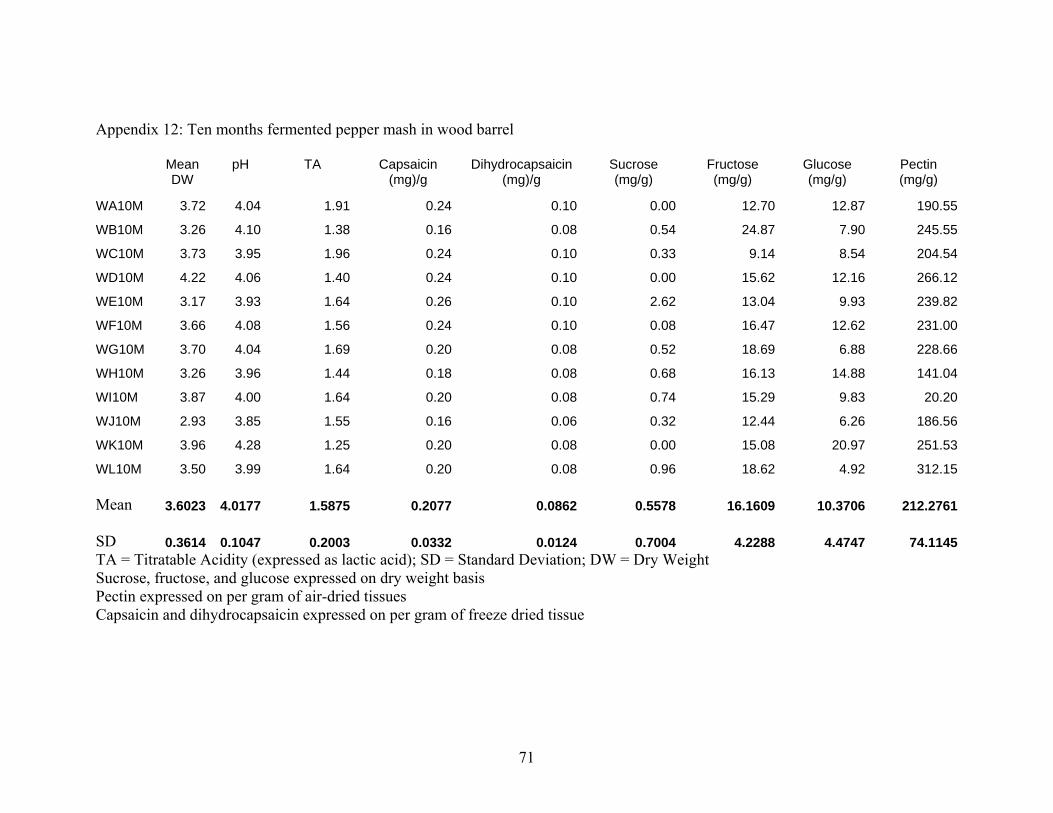
71
Appendix 12: Ten months fermented pepper mash in wood barrel Mean
DW pH TA Capsaicin
(mg)/g Dihydrocapsaicin
(mg)/g Sucrose (mg/g)
Fructose (mg/g)
Glucose (mg/g)
Pectin (mg/g)
WA10M 3.72 4.04 1.91 0.24 0.10 0.00 12.70 12.87 190.55
WB10M 3.26 4.10 1.38 0.16 0.08 0.54 24.87 7.90 245.55
WC10M 3.73 3.95 1.96 0.24 0.10 0.33 9.14 8.54 204.54
WD10M 4.22 4.06 1.40 0.24 0.10 0.00 15.62 12.16 266.12
WE10M 3.17 3.93 1.64 0.26 0.10 2.62 13.04 9.93 239.82
WF10M 3.66 4.08 1.56 0.24 0.10 0.08 16.47 12.62 231.00
WG10M 3.70 4.04 1.69 0.20 0.08 0.52 18.69 6.88 228.66
WH10M 3.26 3.96 1.44 0.18 0.08 0.68 16.13 14.88 141.04
WI10M 3.87 4.00 1.64 0.20 0.08 0.74 15.29 9.83 20.20
WJ10M 2.93 3.85 1.55 0.16 0.06 0.32 12.44 6.26 186.56
WK10M 3.96 4.28 1.25 0.20 0.08 0.00 15.08 20.97 251.53
WL10M 3.50 3.99 1.64 0.20 0.08 0.96 18.62 4.92 312.15 Mean 3.6023 4.0177 1.5875 0.2077 0.0862 0.5578 16.1609 10.3706 212.2761 SD 0.3614 0.1047 0.2003 0.0332 0.0124 0.7004 4.2288 4.4747 74.1145TA = Titratable Acidity (expressed as lactic acid); SD = Standard Deviation; DW = Dry Weight Sucrose, fructose, and glucose expressed on dry weight basis Pectin expressed on per gram of air-dried tissues Capsaicin and dihydrocapsaicin expressed on per gram of freeze dried tissue

72
Appendix 13: Twelve months fermented pepper mash in plastic barrel Mean
DW pH TA Capsaicin
(mg)/g Dihydrocapsaicin
(mg)/g Sucrose (mg/g)
Fructose (mg/g)
Glucose (mg/g)
Pectin (mg/g)
PA12M 2.76 3.95 1.40 0.26 0.10 15.49 20.09 1.99 154.39
PB12M 3.22 4.10 1.34 0.28 0.10 11.35 21.10 4.24 152.85
PC12M 3.23 4.11 1.72 0.24 0.08 0.96 15.93 0.49 145.86
PD12M 3.46 3.95 1.54 0.26 0.10 2.70 15.48 4.16 166.14
PE12M 3.66 4.12 1.07 0.24 0.08 7.50 12.58 3.76 278.73
PF12M 3.42 4.21 1.04 0.22 0.08 7.25 15.11 4.47 301.46
PG12M 3.48 4.09 1.03 0.26 0.10 12.95 12.13 1.82 194.44
PH12M 3.52 4.07 1.69 0.24 0.10 8.55 13.58 0.85 99.58
PI12M 3.97 4.49 1.04 0.28 0.10 2.43 10.72 2.62 121.29
PJ12M 3.86 4.33 1.22 0.22 0.10 6.57 12.16 4.93 112.54
PK12M 3.67 4.48 1.07 0.26 0.10 0.65 12.31 2.33 204.62
PL12M 3.70 4.13 1.50 0.16 0.06 0.00 8.19 1.78 182.14 Mean 3.4942 4.1692 1.3039 0.2433 0.0917 6.3673 14.1144 2.7854 176.1706 SD 0.3239 0.1788 0.2635 0.0328 0.0134 5.1316 3.7059 1.4843 62.0559TA = Titratable Acidity (expressed as lactic acid); SD = Standard Deviation; DW = Dry Weight Sucrose, fructose, and glucose expressed on dry weight basis Pectin expressed on per gram of air-dried tissues Capsaicin and dihydrocapsaicin expressed on per gram of freeze dried tissue

73
Appendix 14: Twelve months fermented pepper mash in wood barrel Mean
DW pH TA Capsaicin
(mg)/g Dihydrocapsaicin
(mg)/g Sucrose (mg/g)
Fructose (mg/g)
Glucose (mg/g)
Pectin (mg/g)
WA12M 3.58 4.03 1.71 0.22 0.08 2.23 16.81 14.23 200.52
WB12M 3.15 3.98 1.74 0.26 0.10 7.38 19.21 7.08 151.92
WC12M 3.31 4.03 1.85 0.24 0.10 7.84 20.11 3.02 199.74
WD12M 3.58 4.08 2.19 0.30 0.12 8.18 11.53 0.42 148.83
WE12M 3.33 3.97 2.11 0.22 0.08 6.97 18.14 6.69 192.97
WF12M 3.51 3.99 1.95 0.24 0.10 18.67 15.32 2.73 264.22
WG12M 3.93 4.04 1.77 0.36 0.14 13.43 8.16 2.92 142.39
WH12M 3.74 0.00 0.20 0.08 10.83 14.37 2.56 246.77
WI12M 4.21 4.04 1.99 0.30 0.12 12.55 7.63 2.73 151.61
WJ12M 4.21 4.37 1.12 0.26 0.10 0.00 14.12 10.20 191.41
WK12M 3.74 4.40 1.17 0.22 0.08 6.87 20.95 17.39 306.96
WL12M 3.55 4.20 1.26 0.26 0.10 13.49 10.54 6.50 155.65 Mean 3.6485 4.1092 1.5535 0.2554 0.0985 9.1885 15.0127 6.4245 195.0211 SD 0.3196 0.1474 0.5862 0.0433 0.0191 4.9407 4.4491 4.9858 50.3530TA = Titratable Acidity (expressed as lactic acid); SD = Standard Deviation; DW = Dry Weight Sucrose, fructose, and glucose expressed on dry weight basis Pectin expressed on per gram of air-dried tissues Capsaicin and dihydrocapsaicin expressed on per gram of freeze dried tissue

74
Appendix 15: Seventeen months fermented pepper mash in plastic barrel Mean
DW pH TA Capsaicin
(mg)/g Dihydrocapsaicin
(mg)/g Sucrose (mg/g)
Fructose (mg/g)
Glucose (mg/g)
Pectin (mg/g)
PA17M 3.19 3.82 2.01 0.18 0.08 4.05 9.79 2.11 117.76
PB17M 3.23 4.10 0.33 0.18 0.08 4.90 20.57 4.57 138.01
PC17M 3.00 4.14 1.36 0.16 0.06 3.92 9.03 3.24 153.83
PD17M 3.57 3.92 1.58 0.20 0.08 0.77 10.00 1.96 154.02
PE17M 3.31 3.86 1.82 0.20 0.08 0.95 16.67 2.42 188.05
PF17M 3.67 4.18 1.32 0.16 0.06 2.21 15.00 12.36 194.43
PG17M 3.63 3.99 1.86 0.16 0.06 3.94 16.32 6.00 155.50
PH17M 3.11 3.98 1.69 0.14 0.06 4.15 15.41 3.35 117.71
PI17M 3.22 4.07 1.26 0.18 0.08 2.90 5.11 3.46 214.49
PJ17M 3.89 4.09 1.36 0.20 0.08 0.71 11.74 3.60 204.92
PK17M 3.66 4.02 1.42 0.16 0.06 0.77 17.36 1.54 119.54
PL17M 3.46 4.13 1.31 0.16 0.08 0.00 18.79 2.87 203.31 Mean 3.4100 4.0250 1.4435 0.1733 0.0717 2.4381 13.8146 3.9553 163.4631 SD 0.2734 0.1143 0.4300 0.0197 0.0103 1.7312 4.6229 2.9108 36.2801TA = Titratable Acidity (expressed as lactic acid); SD = Standard Deviation; DW = Dry Weight Sucrose, fructose, and glucose expressed on dry weight basis Pectin expressed on per gram of air-dried tissues Capsaicin and dihydrocapsaicin expressed on per gram of freeze dried tissue

75
Appendix 16: Seventeen months fermented pepper mash in wood barrel Mean
DW pH TA Capsaicin
(mg)/g Dihydrocapsaicin
(mg)/g Sucrose (mg/g)
Fructose (mg/g)
Glucose (mg/g)
Pectin (mg/g)
WA17M 3.55 4.07 1.42 0.14 0.06 2.72 10.53 9.63 144.24
WB17M 3.74 4.01 1.32 0.02 0.08 2.57 6.57 2.07 181.30
WC17M 4.02 3.91 1.90 0.22 0.10 2.29 8.79 8.34 165.44
WD17M 4.47 4.08 1.67 0.18 0.08 2.15 5.50 4.70 195.18
WE17M 3.50 3.95 1.82 0.16 0.06 2.87 10.88 8.77 178.74
WF17M 3.86 3.99 1.85 0.16 0.06 4.03 16.40 5.44 136.64
WG17M 3.73 4.21 1.70 0.18 0.08 2.43 15.23 13.05 207.03
WH17M 3.62 4.06 1.59 0.16 0.06 4.31 17.51 5.81 182.31
WI17M 3.97 4.05 1.77 0.18 0.08 2.98 13.15 7.84 233.80
WJ17M 3.55 3.85 2.06 0.22 0.10 2.90 10.38 4.07 239.50
WK17M 3.81 4.27 1.06 0.14 0.06 2.79 9.29 2.03 217.33
WL17M 3.45 3.99 1.52 0.16 0.06 5.09 15.47 3.76 194.63 Mean 3.7700 4.0367 1.6410 0.1600 0.0733 3.0930 11.6421 6.2923 189.6790 SD 0.2870 0.1174 0.2765 0.0512 0.0156 0.9008 3.9004 3.3072 31.9923TA = Titratable Acidity (expressed as lactic acid); SD = Standard Deviation; DW = Dry Weight Sucrose, fructose, and glucose expressed on dry weight basis Pectin expressed on per gram of air-dried tissues Capsaicin and dihydrocapsaicin expressed on per gram of freeze dried tissue

76
Appendix 17: twenty four months fermented pepper mash in plastic barrel Mean
DW pH TA Capsaicin
(mg)/g Dihydrocapsaicin
(mg)/g Sucrose (mg/g)
Fructose (mg/g)
Glucose (mg/g)
Pectin (mg/g)
PA24M 3.57 3.87 1.95 0.22 0.08 6.55 17.80 16.75 144.15
PB24M 3.30 4.30 1.30 0.24 0.10 7.98 9.54 0.64 159.50
PC24M 3.37 3.99 1.52 0.28 0.10 7.50 5.71 1.60 181.58
PD24M 3.41 4.00 2.09 0.28 0.12 6.14 17.44 2.43 117.58
PE24M 2.88 4.04 1.95 0.16 0.06 9.04 20.22 2.70 145.60
PF24M 3.49 4.21 1.36 0.18 0.08 5.33 8.90 2.73 161.30
PG24M 3.38 3.97 1.65 0.16 0.06 6.26 20.91 2.71 208.99
PH24M 3.32 3.97 1.85 0.16 0.06 9.41 13.22 6.63 155.10
PI24M 3.43 4.11 0.51 0.18 0.06 5.43 9.07 2.78 121.46
PJ24M 3.32 4.02 1.62 0.22 0.08 9.54 4.36 1.84 176.40
PK24M 4.14 4.16 1.43 0.22 0.08 0.11 10.73 2.29 167.92
PL24M 3.72 4.09 1.72 0.18 0.08 4.51 17.49 2.31 243.34 Mean 3.4429 4.0608 1.5802 0.2067 0.0800 6.4846 12.9487 3.7834 165.2441 SD 0.2938 0.1192 0.4188 0.0438 0.0191 2.6097 5.6797 4.3214 35.1399TA = Titratable Acidity (expressed as lactic acid); SD = Standard Deviation; DW = Dry Weight Sucrose, fructose, and glucose expressed on dry weight basis Pectin expressed on per gram of air-dried tissues Capsaicin and dihydrocapsaicin expressed on per gram of freeze dried tissue
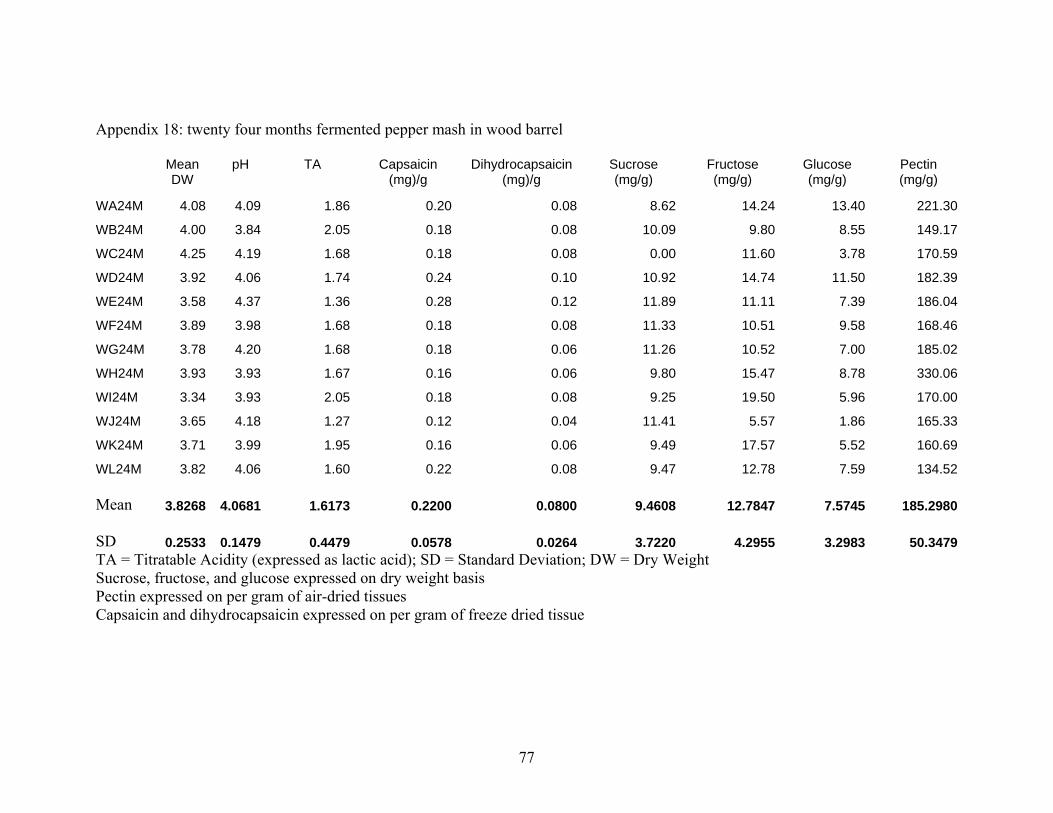
77
Appendix 18: twenty four months fermented pepper mash in wood barrel Mean
DW pH TA Capsaicin
(mg)/g Dihydrocapsaicin
(mg)/g Sucrose (mg/g)
Fructose (mg/g)
Glucose (mg/g)
Pectin (mg/g)
WA24M 4.08 4.09 1.86 0.20 0.08 8.62 14.24 13.40 221.30
WB24M 4.00 3.84 2.05 0.18 0.08 10.09 9.80 8.55 149.17
WC24M 4.25 4.19 1.68 0.18 0.08 0.00 11.60 3.78 170.59
WD24M 3.92 4.06 1.74 0.24 0.10 10.92 14.74 11.50 182.39
WE24M 3.58 4.37 1.36 0.28 0.12 11.89 11.11 7.39 186.04
WF24M 3.89 3.98 1.68 0.18 0.08 11.33 10.51 9.58 168.46
WG24M 3.78 4.20 1.68 0.18 0.06 11.26 10.52 7.00 185.02
WH24M 3.93 3.93 1.67 0.16 0.06 9.80 15.47 8.78 330.06
WI24M 3.34 3.93 2.05 0.18 0.08 9.25 19.50 5.96 170.00
WJ24M 3.65 4.18 1.27 0.12 0.04 11.41 5.57 1.86 165.33
WK24M 3.71 3.99 1.95 0.16 0.06 9.49 17.57 5.52 160.69
WL24M 3.82 4.06 1.60 0.22 0.08 9.47 12.78 7.59 134.52 Mean 3.8268 4.0681 1.6173 0.2200 0.0800 9.4608 12.7847 7.5745 185.2980 SD 0.2533 0.1479 0.4479 0.0578 0.0264 3.7220 4.2955 3.2983 50.3479TA = Titratable Acidity (expressed as lactic acid); SD = Standard Deviation; DW = Dry Weight Sucrose, fructose, and glucose expressed on dry weight basis Pectin expressed on per gram of air-dried tissues Capsaicin and dihydrocapsaicin expressed on per gram of freeze dried tissue

78
VITA
The author was born on November 19, 1981, in Kuala Lumpur, Malaysia. She
spent her childhood life in Perak, Malaysia until she graduated from Menglembu High
School. In January 2000, she started her first year college life in Inti College, Malaysia.
Later she continued to pursue her undergraduate studies in the United States of America
in August 2001. She graduated from Louisiana State University and Agricultural and
Mechanical College with a Bachelor of Science degree in food science. After receiving
her bachelor's degree, she entered the master’s program in Department of Food Science,
Louisiana State University and Agricultural and Mechanical College in the fall of 2003.
She conducted research under Dr. Paul Wilson’s supervision. She is a candidate for the
degree of Master of Science in food science in August 2005.