Embed Size (px)
Citation preview

Physics 100
Lecture 16
The US Fossil Fuel
Energy Mix
March 19, 2018
1

Oil terminology
Reserves are those resources that are
well known and recoverable with current
technology and at current prices
Resources are the total amount of oil
that exists, whether known or unknown,
accessible or inaccessible.
2

Reserves and Resources
3
Reserves
Incre
asin
g c
ost→
Increasing Uncertainty →
Known but too
expensive to
recover
Undiscovered oil

The US uses about 19 MBPD of oil. At
that rate, how long would the 5000 MB
of oil in the ANWR last?
4
A. 263 y
B. 95 y
C. 31 y
D. 0.72 y

The US uses about 19 MBPD of oil. At
that rate, how long would the 5000 MB
of oil in the ANWR last?
A. 263 y
B. 95 y
C. 31 y
D. 0.72 y
5
5000 MB 1 y263 d
19 MB/d 365 d
0.72 y 8.6 mo

Recovering oil
Petroleum is trapped in deposits deep
below the surface
6

7
Fig. 7-10a, p. 217

8
Fig. 7-10b, p. 217

9
Fig. 7-10c, p. 217
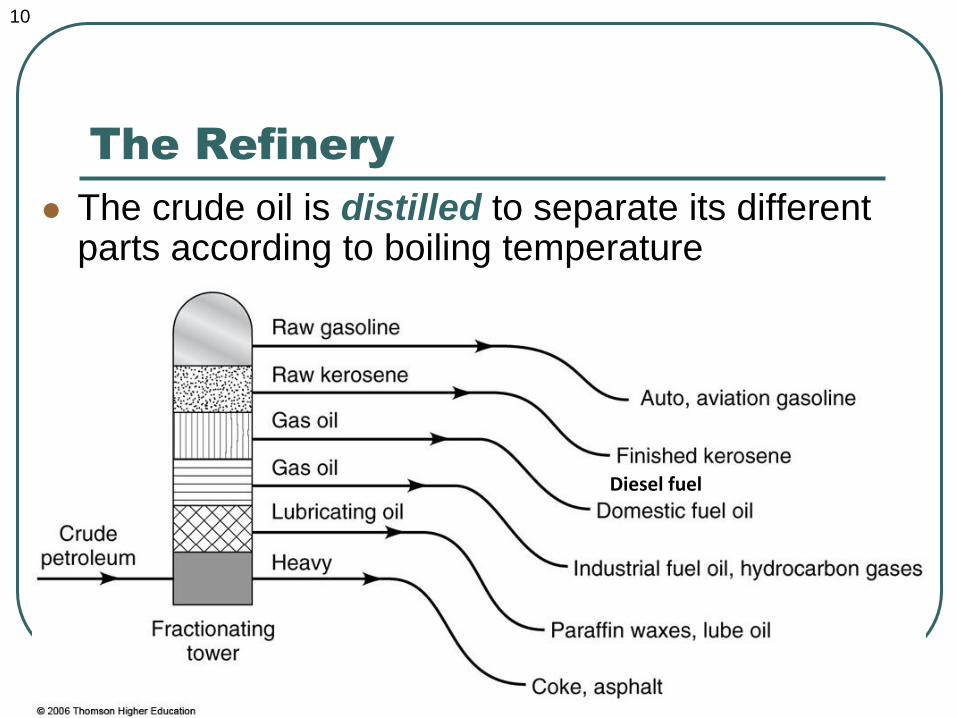
The Refinery
The crude oil is distilled to separate its different parts according to boiling temperature
10
Diesel fuel
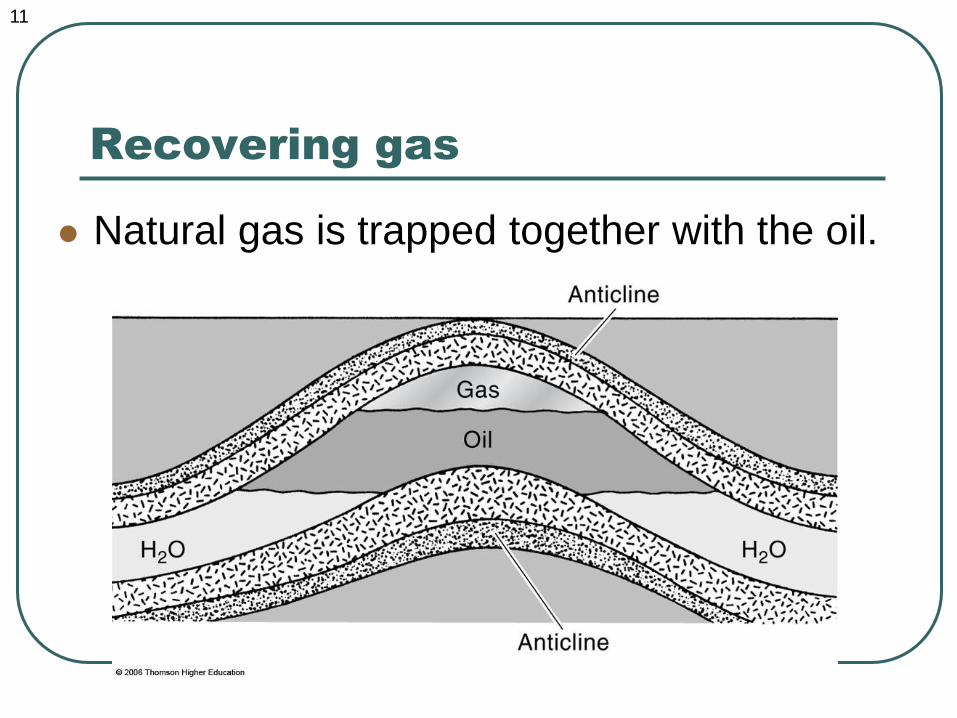
Recovering gas
Natural gas is trapped together with the oil.
11
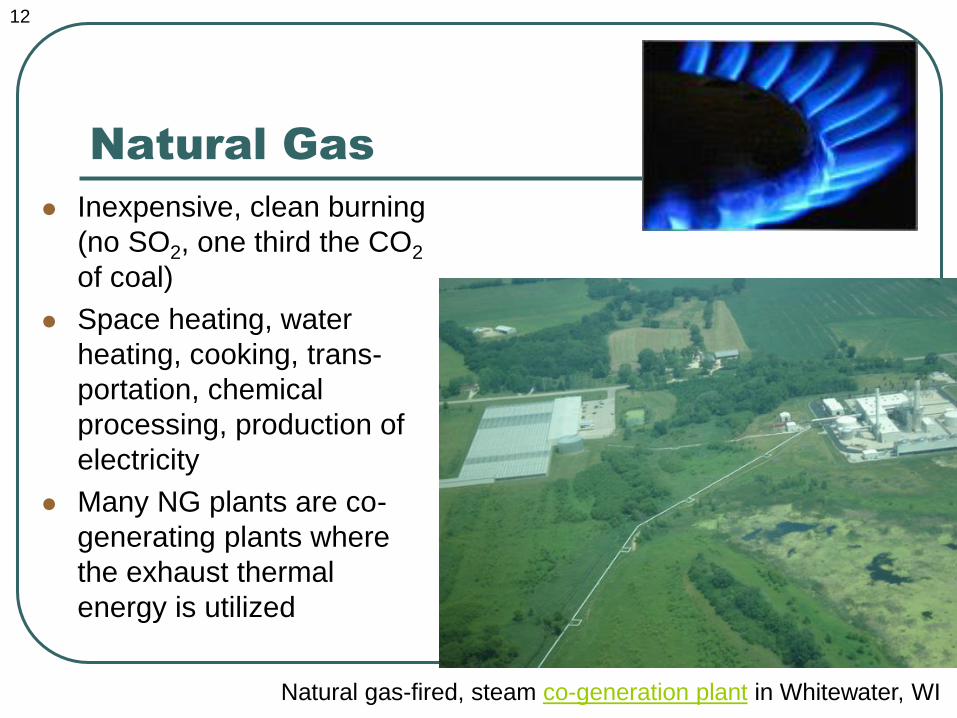
Natural Gas
Inexpensive, clean burning
(no SO2, one third the CO2
of coal)
Space heating, water
heating, cooking, trans-
portation, chemical
processing, production of
electricity
Many NG plants are co-
generating plants where
the exhaust thermal
energy is utilized
12
Natural gas-fired, steam co-generation plant in Whitewater, WI

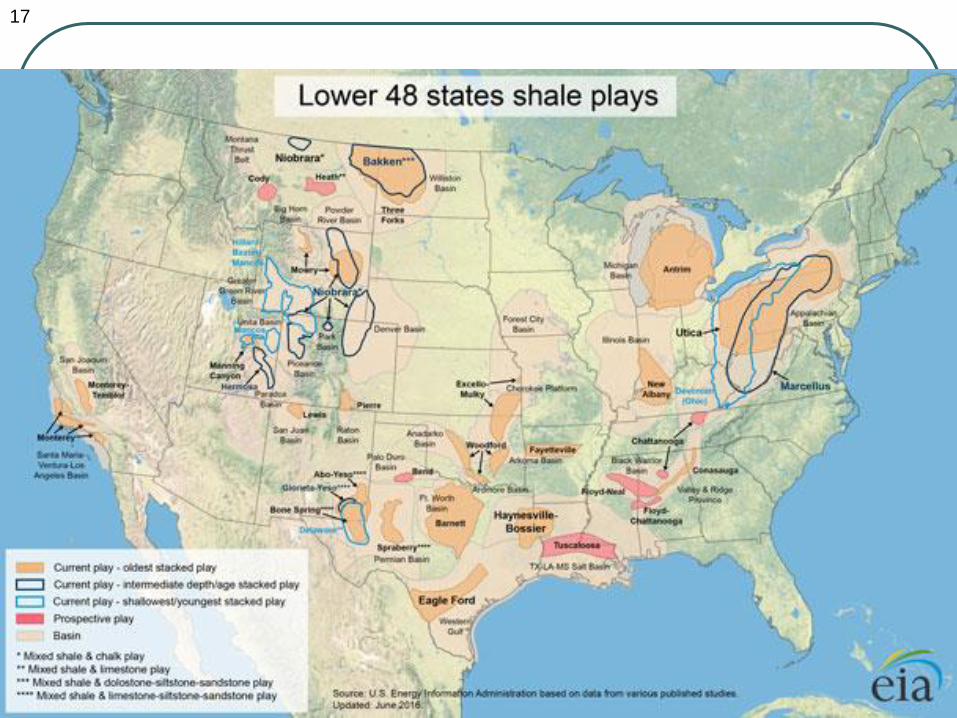
US Oil and Gas deposits map
13
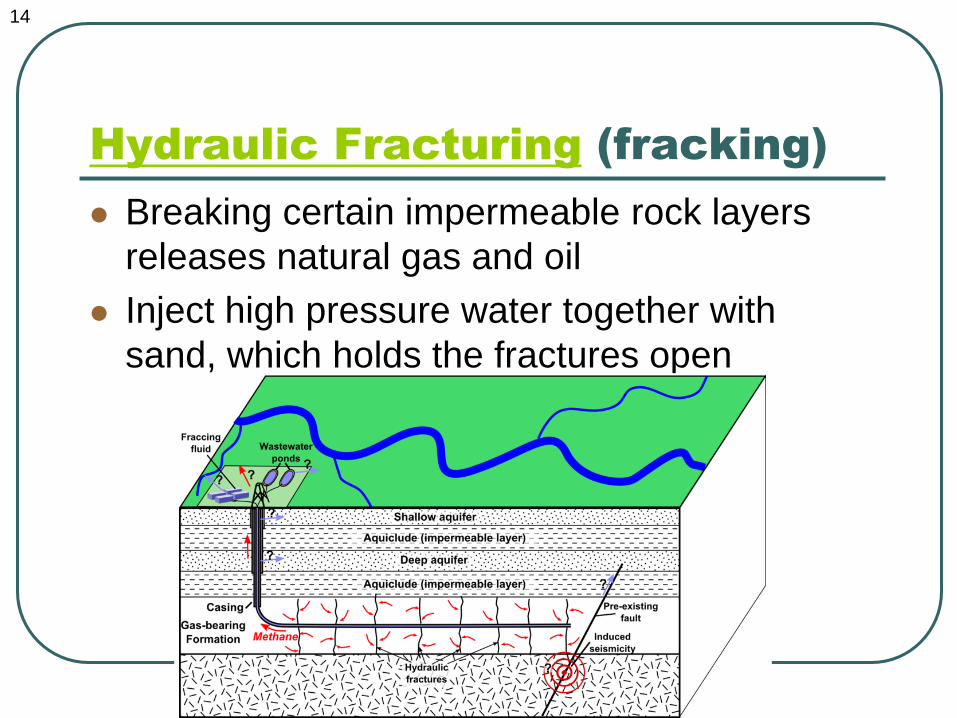
Hydraulic Fracturing (fracking)
Breaking certain impermeable rock layers
releases natural gas and oil
Inject high pressure water together with
sand, which holds the fractures open
14

Fracking has led to a large increase in
US natural gas production
15
Source: U.S. Energy Information Administration, Annual Energy Outlook 2016 Reference case, September 2016

Most US oil and gas now comes from fracking
16
Source: US EIA
Today in Energy
March 15, 2016
Source: US EIA
Today in Energy
May 5, 2016
17

18

Kerosene is lighter than heating oil. It is
extracted from the distillation tower at
______ the heating oil.
19
A. a higher level than
B. a lower level than
C. the same level as

Coal
Ancient, compressed plant material
The US has more recoverable reserves of coal than any other country. See www.eia.gov/coal
In 2015, 92.5% of coal mined in the US was burned by utilities to produce electricity
In 2015, 33% of US-produced electricity came from coal, down from 50% in 2007 as many power plants switch to natural gas.
Plentiful and inexpensive but associated with a number of environmental hazards
20
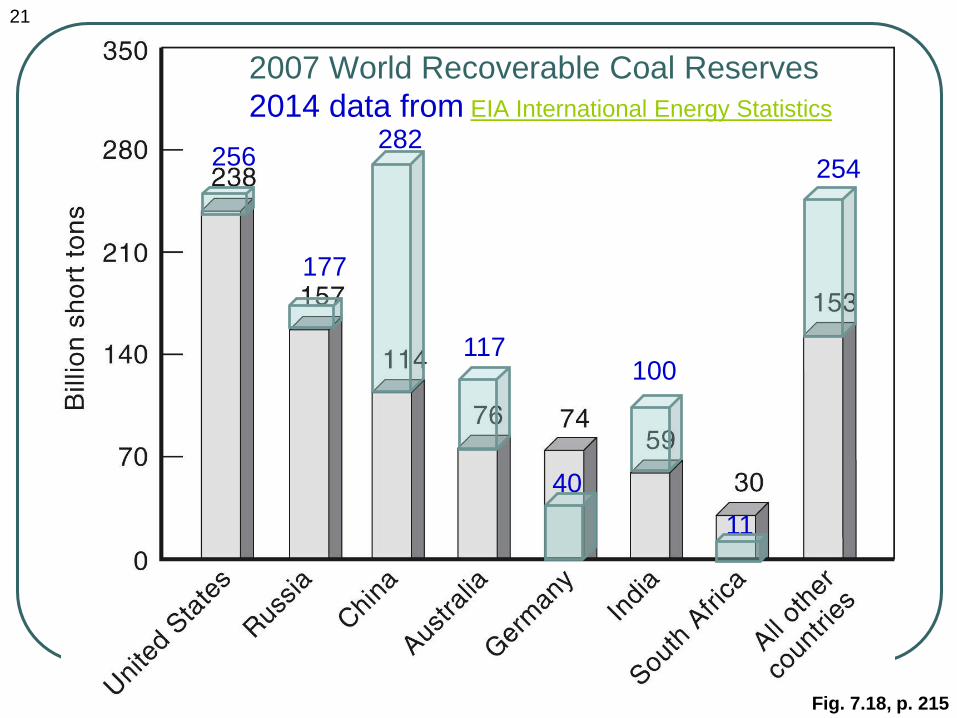
21
2007 World Recoverable Coal Reserves
2014 data from EIA International Energy Statistics
Fig. 7.18, p. 215
256
177
282
117
40
100
11
254

Ranks of Coal
Lignite – youngest, high water content, low
energy content
Subbituminous – low sulfur, high water,
medium energy content. Great plains
surface mines, inexpensive to harvest
Bituminous – high sulfur, high energy
content. Most plentiful supply
Anthracite – very hard, very high energy
content, low dust. Limited supply.
22
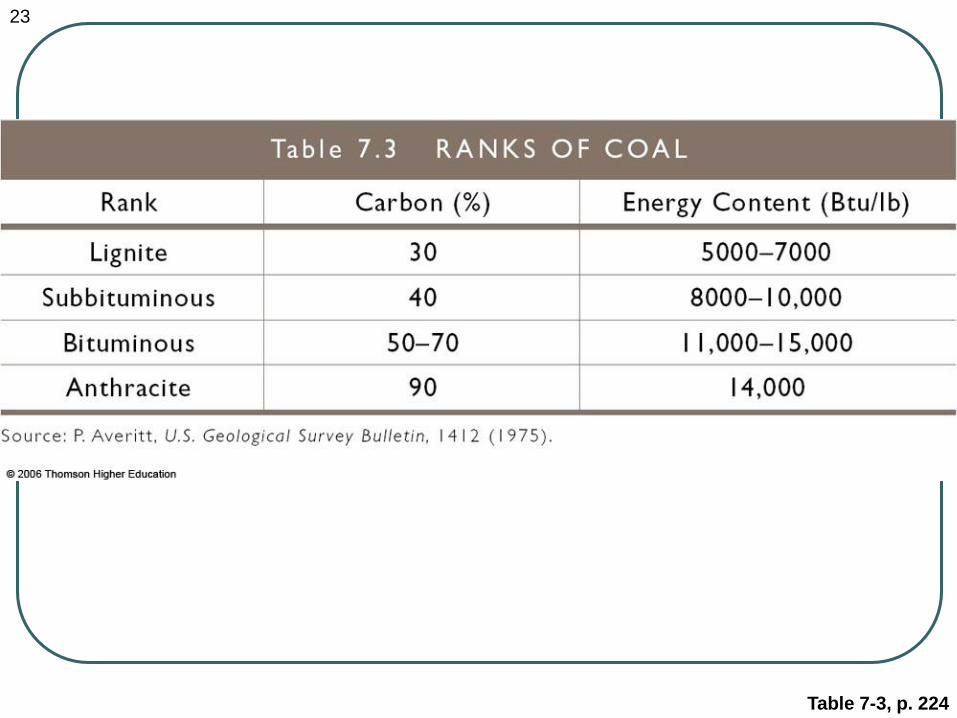
23
Table 7-3, p. 224

USGS Coal deposits map
24

Environmental Hazards
Burning coal releases large amounts of CO2, a
greenhouse gas
Burning high-sulfur coal produces a large
amount of SO2, linked to acid rain
(environmental effects of acid rain are debatable
– see pp. 252-256)
Ash and dust in the air cause breathing
difficulties
Strip mining can produce a damaged landscape
incapable of supporting vegetation
25
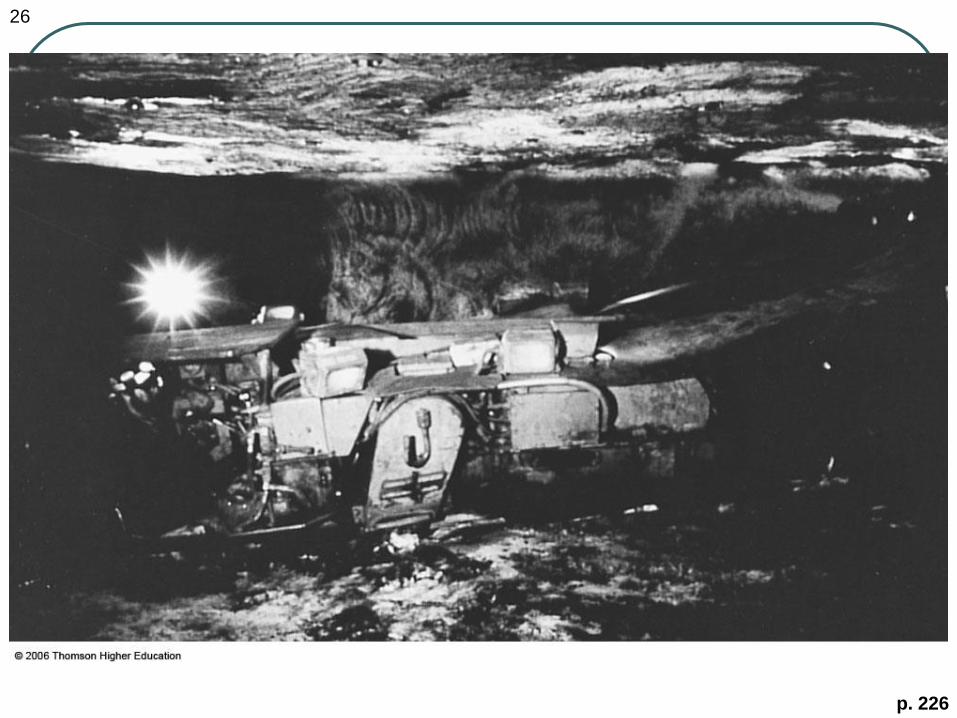
26
p. 226
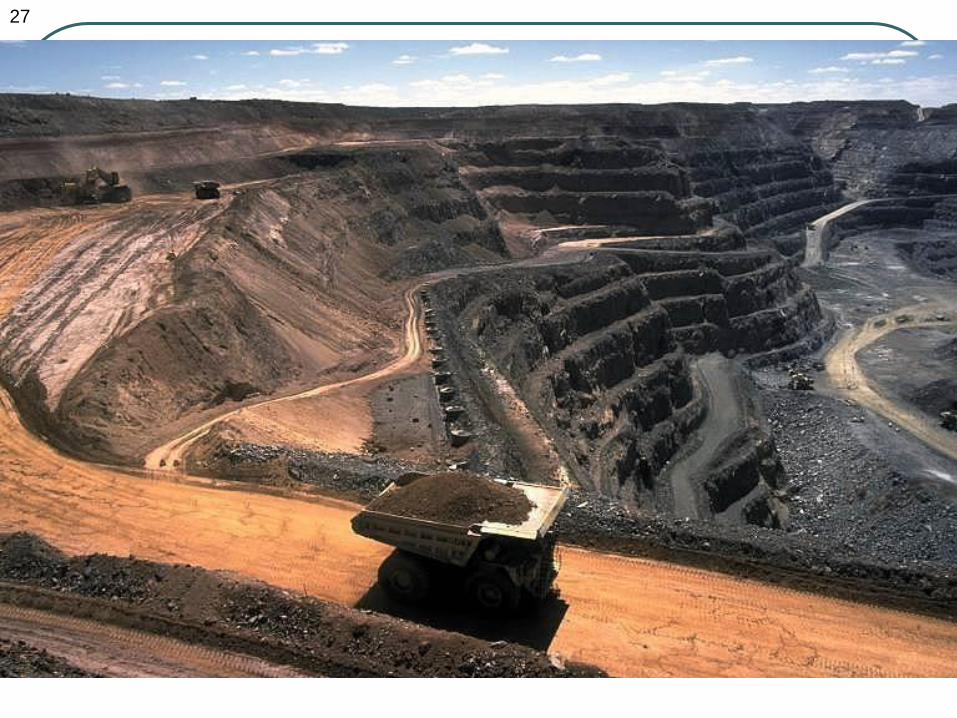
Strip coal mine
Strip coal mining (location unknown).
Codrington, Stephen. Planet Geography 3rd Edition
(2005) [1]
Personal photo by Stephen Codrington uploaded
with permission for the benefit of geography on
Wikimedia projects.
http://commons.wikimedia.org/wiki/File:Strip_coal_mining.jpg
27

28 World’s largest excavator: The Bagger 288 (Germany)
265,000 tons of lignite per dayhttp://www.popsci.com/bagger-288-facts

The US Energy Mix 2012
29
On 3/29/16 I couldn’t find an equivalent pie chart, but I found a different chart
(next slide) for 2014. The percentages didn’t change much in the two year
span…

The US Energy Mix 2014
http://www.eia.gov/totalenergy/data/monthly/pdf/flow/css_2014_energy.pdf
30

Energy Consumption history
31
35.9%
32.0%
13.0%
10.5%
8.7%
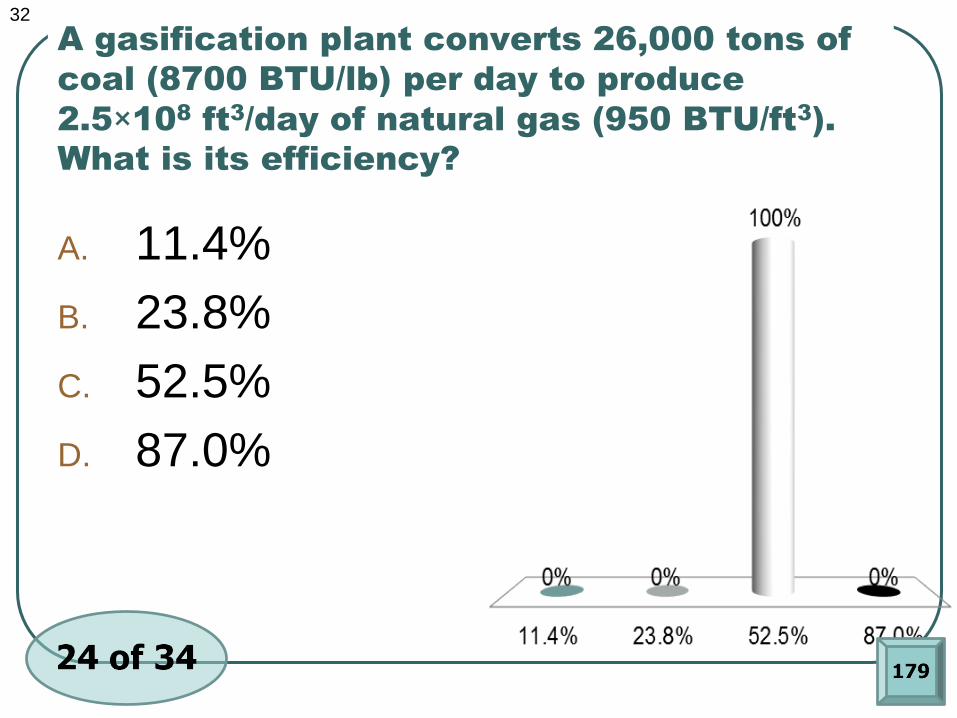
A gasification plant converts 26,000 tons of
coal (8700 BTU/lb) per day to produce
2.5×10⁸
ft3/day of natural gas (950 BTU/ft
3).
What is its efficiency?
A. 11.4%
B. 23.8%
C. 52.5%
D. 87.0%
32
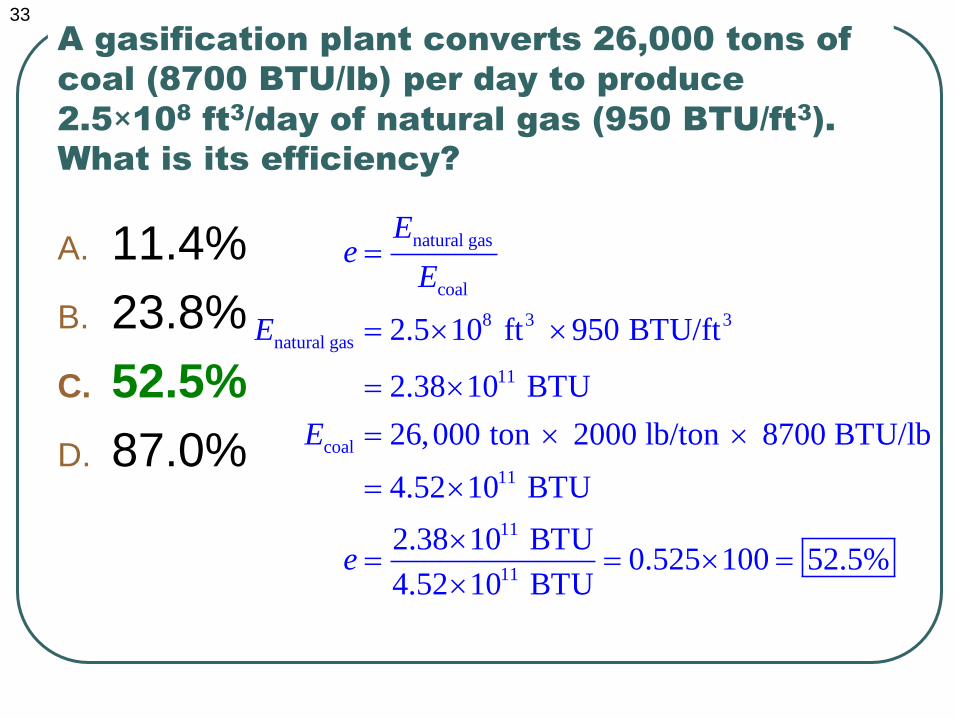
A gasification plant converts 26,000 tons of
coal (8700 BTU/lb) per day to produce
2.5×10⁸
ft3/day of natural gas (950 BTU/ft
3).
What is its efficiency?
A. 11.4%
B. 23.8%
C. 52.5%
D. 87.0%
33
natural gas
coal
8 3 3
natural gas
11
coal
11
11
11
2.5 10 ft 950 BTU/ft
2.38 10 BTU
26,000 ton 2000 lb/ton 8700 BTU/lb
4.52 10 BTU
2.38 10 BTU0.525 100 52.5%
4.52 10 BTU
Ee
E
E
E
e

US Generated Electricity
http://www.eia.gov/electricity/monthly/
34
(37% in 2012)
2011 2017
7.8% hydroelectric 7.3%
2.9% wind energy 6.2%
0.4% solar energy 3.2%
1.4% biomass-derived 1.6%
0.4% geothermal 0.4%
18.7%
19.7%
31.1%
29.5% in 2017
2017

US Electricity generation history
http://www.eia.gov/electricity/data/browser/
35
Coal
Natural Gas
Nuclear
Hydroelectric
Renewable
Natural gas declined 7.7% in 2017.
See New York Times article 3/28/18

Some possible solutions
Installation of exhaust gas scrubbers at
power plants
Cleaner-burning fluidized bed
combustion
Use of low-sulfur coal
Coal gasification and liquefaction
Careful land reclamation after mining
36

37
Right here at UWSP
Steam for heating is provided by a power
plant that can burn various combinations of
natural gas, coal, paper pellets, and fuel oil.
2008 Usage:
• 62.4% coal
• 37.6% gas
2017 Usage:
• 21.6% coal
• 78.4% gas
Goal: eliminate coal
by March 2020

38
Right here at UWSP
Electricity is purchased from off campus.
100% of overall campus electricity
consumption is from renewable sources
(by purchasing energy credits through Renewable Choice Energy).
The campus has a Carbon Neutrality Plan
See the Energy and Carbon page

How many kWh of electricity can be
delivered from 1 ton of coal (2.6×10¹⁰
J)
fuel? The plant is 35% efficient and the
transmission is 90% efficient.
39
A. 2275 kWh
B. 825 kWh
C. 35 kWh
D. 2.9 kWh

How many kWh of electricity can be
delivered from 1 ton of coal (2.6×10¹⁰
J)
fuel? The plant is 35% efficient and the
transmission is 90% efficient.
40
10 9
9
6
2.6 10 J 0.35 0.90 8.19 10 J
1 kWh8.19 10 J 2275 kWh
3.6 10 J
About 2 month's worth for a house