Embed Size (px)
Citation preview
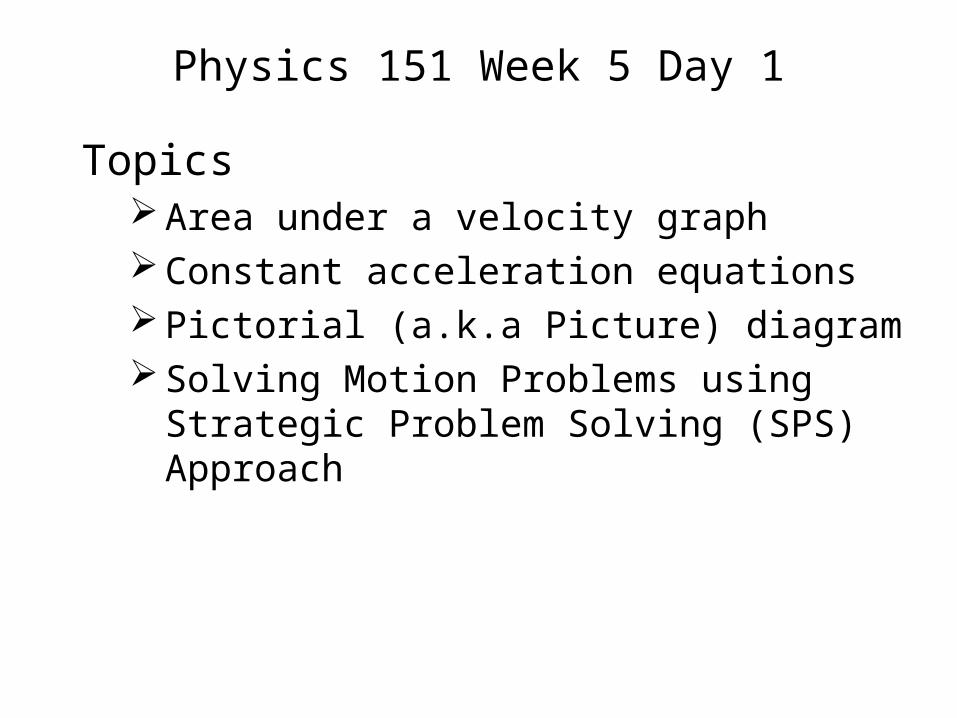
Physics 151 Week 5 Day 1
Topics Area under a velocity graph Constant acceleration equations Pictorial (a.k.a Picture) diagram Solving Motion Problems using Strategic
Problem Solving (SPS) Approach
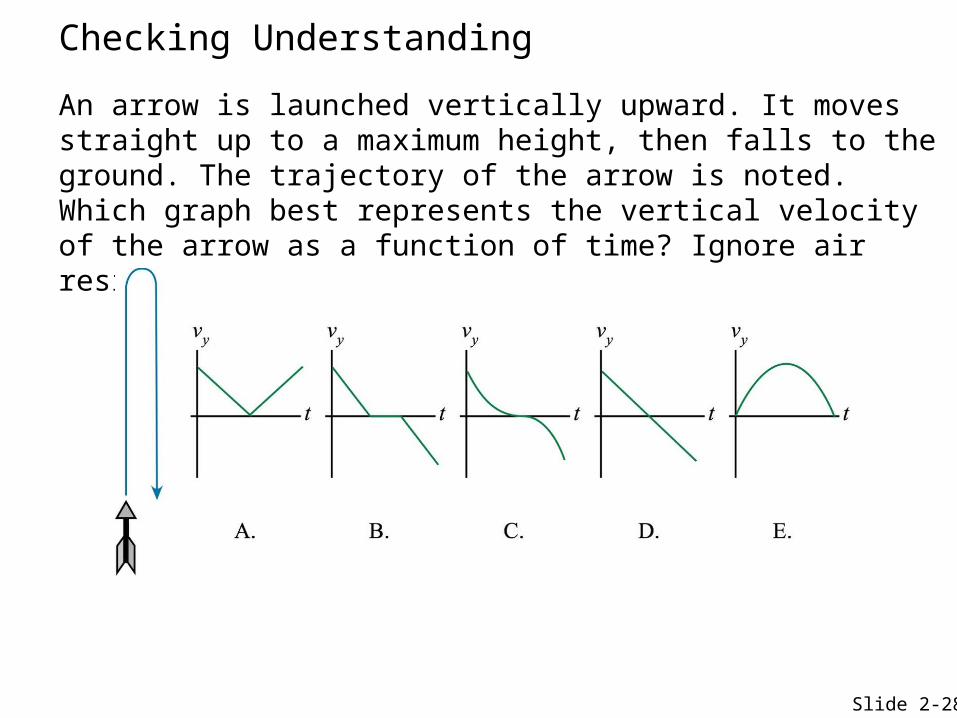
An arrow is launched vertically upward. It moves straight up to a maximum height, then falls to the ground. The trajectory of the arrow is noted. Which graph best represents the vertical velocity of the arrow as a function of time? Ignore air resistance; the only force acting is gravity.
Slide 2-28
Checking Understanding
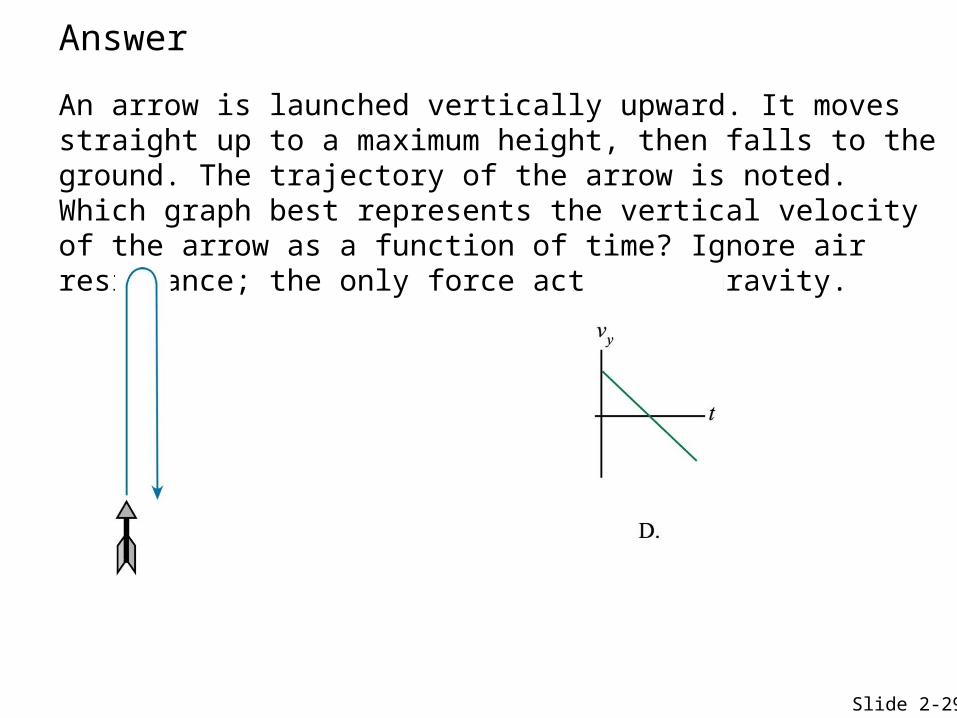
An arrow is launched vertically upward. It moves straight up to a maximum height, then falls to the ground. The trajectory of the arrow is noted. Which graph best represents the vertical velocity of the arrow as a function of time? Ignore air resistance; the only force acting is gravity.
Slide 2-29
Answer
Slide 2-34
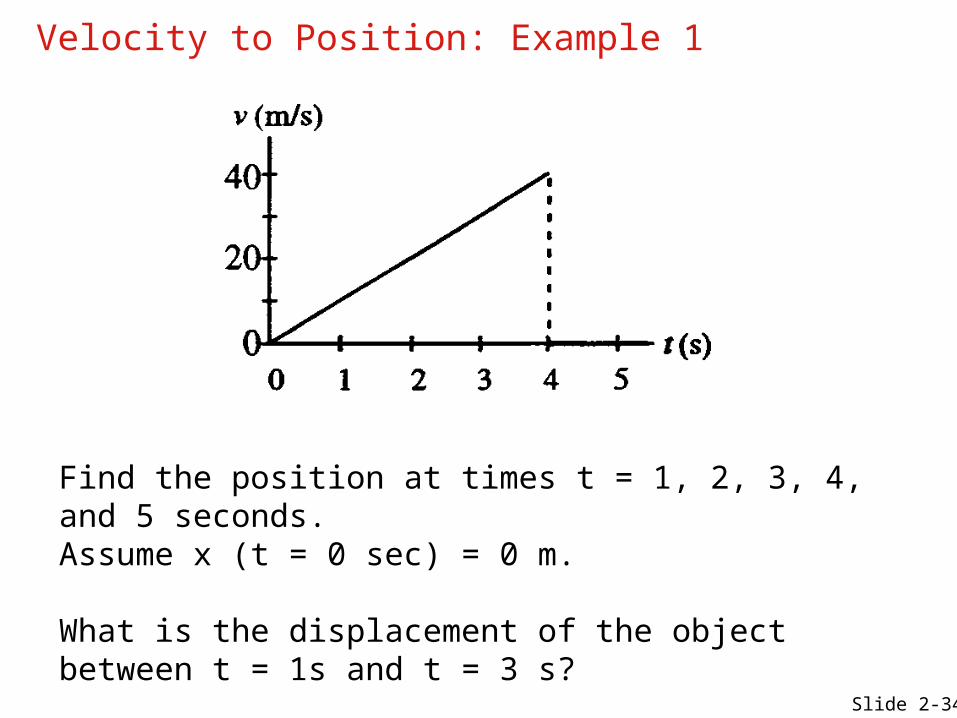
Velocity to Position: Example 1
Find the position at times t = 1, 2, 3, 4, and 5 seconds.Assume x (t = 0 sec) = 0 m.
What is the displacement of the object between t = 1s and t = 3 s?
Slide 2-34
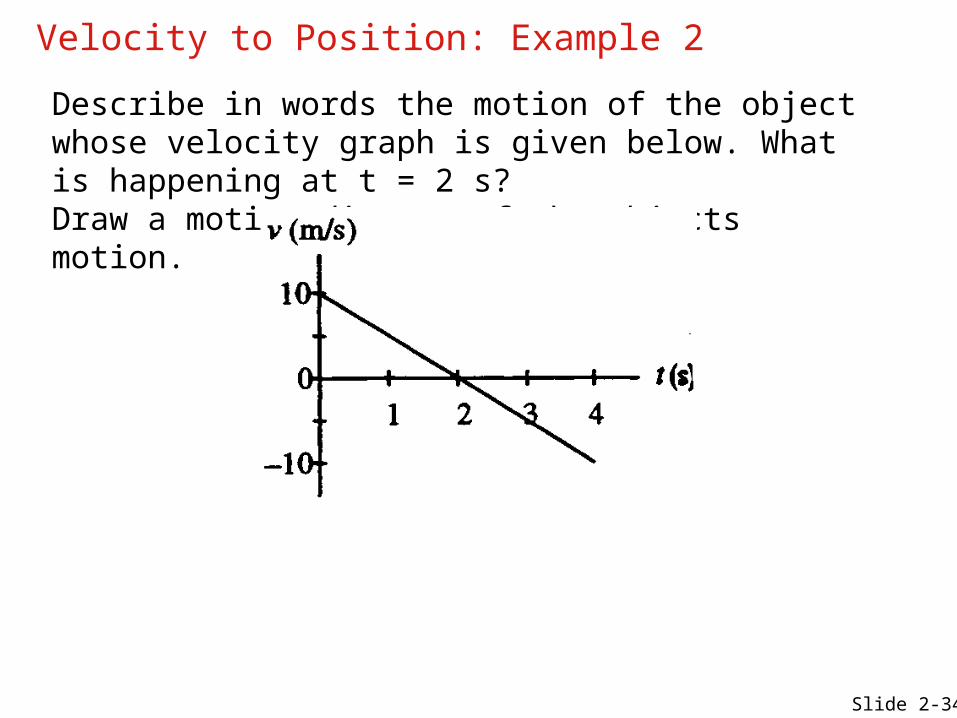
Velocity to Position: Example 2
Describe in words the motion of the object whose velocity graph is given below. What is happening at t = 2 s?Draw a motion diagram of the objects motion.
Slide 2-34
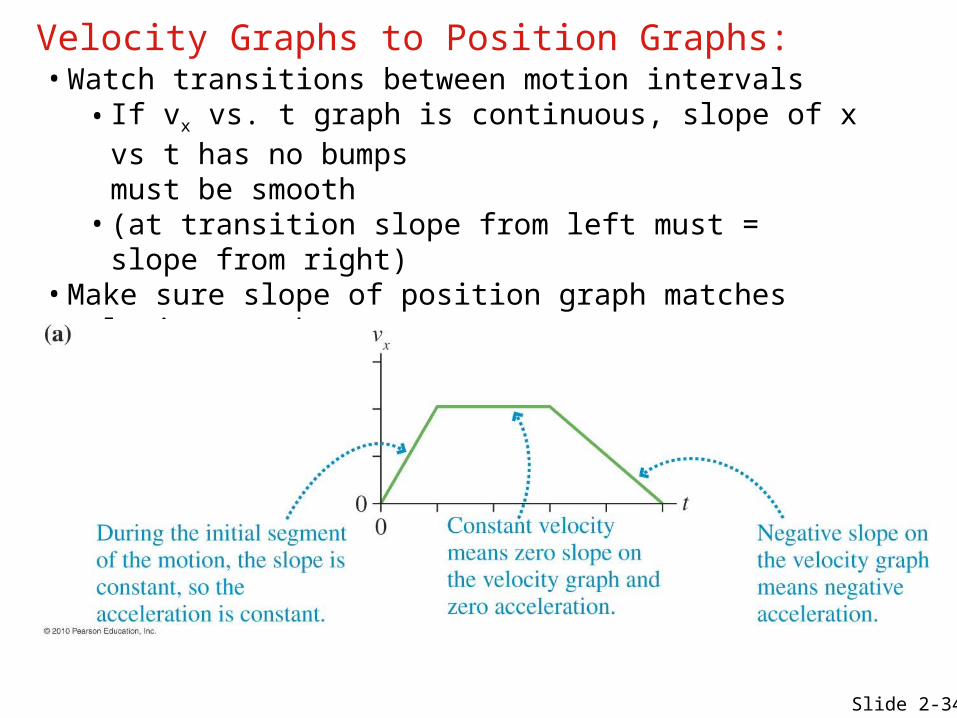
Velocity Graphs to Position Graphs: •Watch transitions between motion intervals
• If vx vs. t graph is continuous, slope of x vs t has no bumpsmust be smooth
• (at transition slope from left must = slope from right)
•Make sure slope of position graph matches velocity graph
Example
Slide 2-34
Start your engine (velocity and acceleration)
On the on ramp to Interstate 25 a car accelerates at 7 m/s2 from rest.
What is the car's velocity at 1 second after it starts from rest?
2 seconds?
3 seconds?
4 seconds?
Slide 2-4
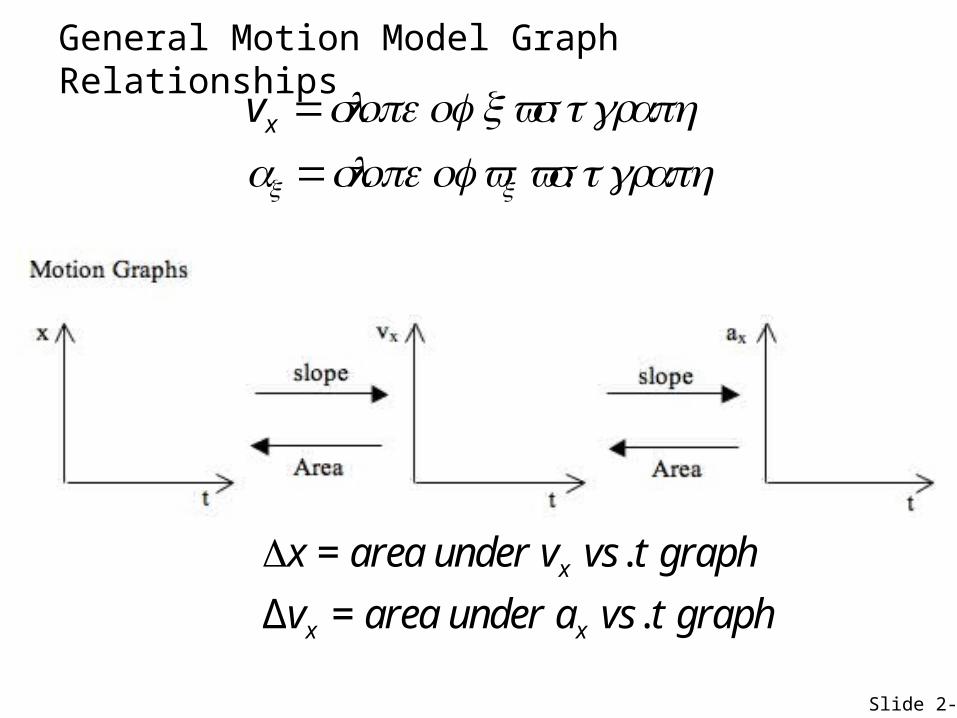
General Motion Model Graph Relationships
Δx = area under vx vs. t graphΔvx = area under ax vs. t graph
Slide 2-4
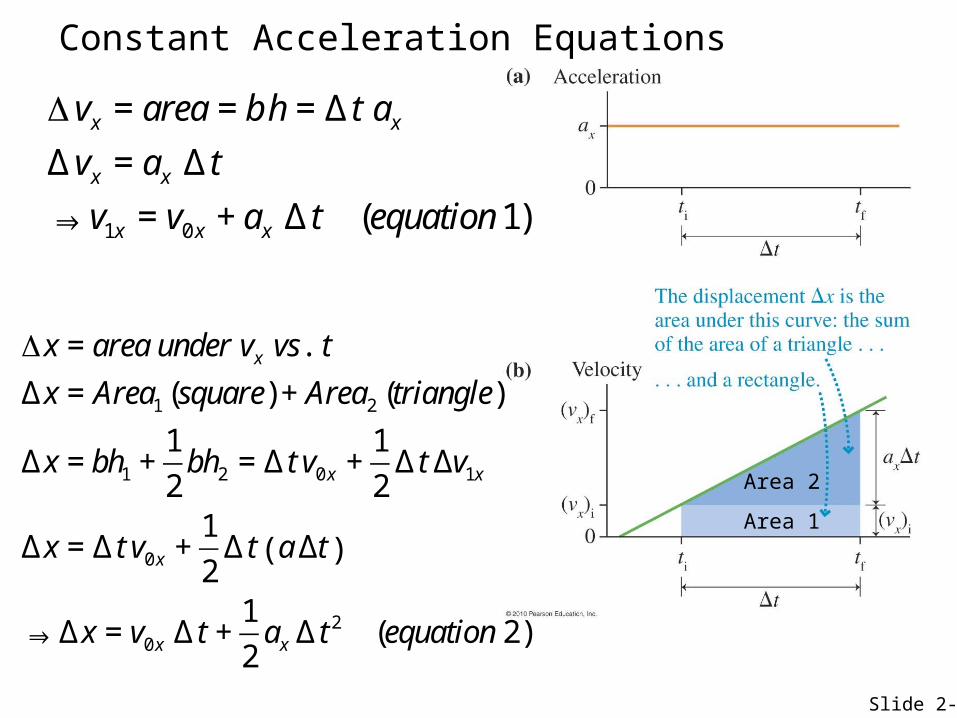
Constant Acceleration Equations
Δ vx = area = bh = Δ t axΔvx = ax Δ t
⇒ v1x = v0x + ax Δ t (equation 1)
Δx = area under vx vs. tΔx = Area1 (square) + Area2 (triangle)
Δx = bh1 +1
2bh2 = Δ t v0x +
1
2Δ t Δv1x
Δx = Δ t v0x +1
2Δ t aΔt( )
⇒ Δx = v0x Δ t +1
2ax Δ t
2 (equation 2)
Area 1
Area 2
Slide 2-4
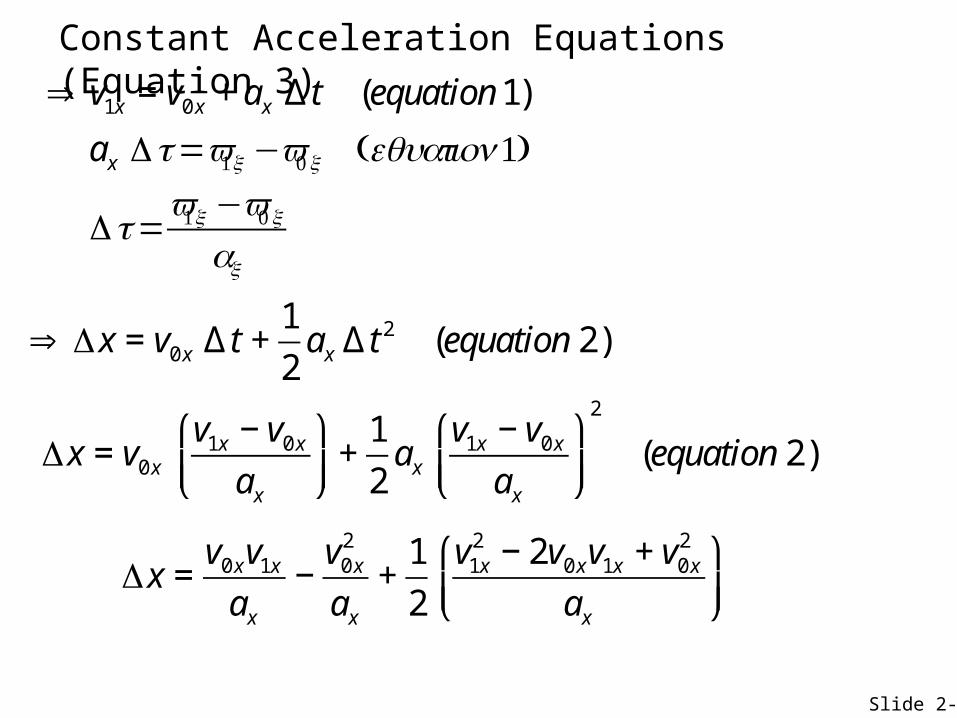
Constant Acceleration Equations (Equation 3)
⇒ v1x = v0x + ax Δ t (equation 1)
ax Δ t =v1x −v0x (equation1)
Δ t =v1x −v0x
ax
Δx = v0xv1x − v0xax
⎛
⎝⎜⎞
⎠⎟+1
2ax
v1x − v0xax
⎛
⎝⎜⎞
⎠⎟
2
(equation 2)
Δx =v0xv1xax
−v0x2
ax+1
2
v1x2 − 2v0xv1x + v0x
2
ax
⎛
⎝⎜⎞
⎠⎟
Slide 2-4
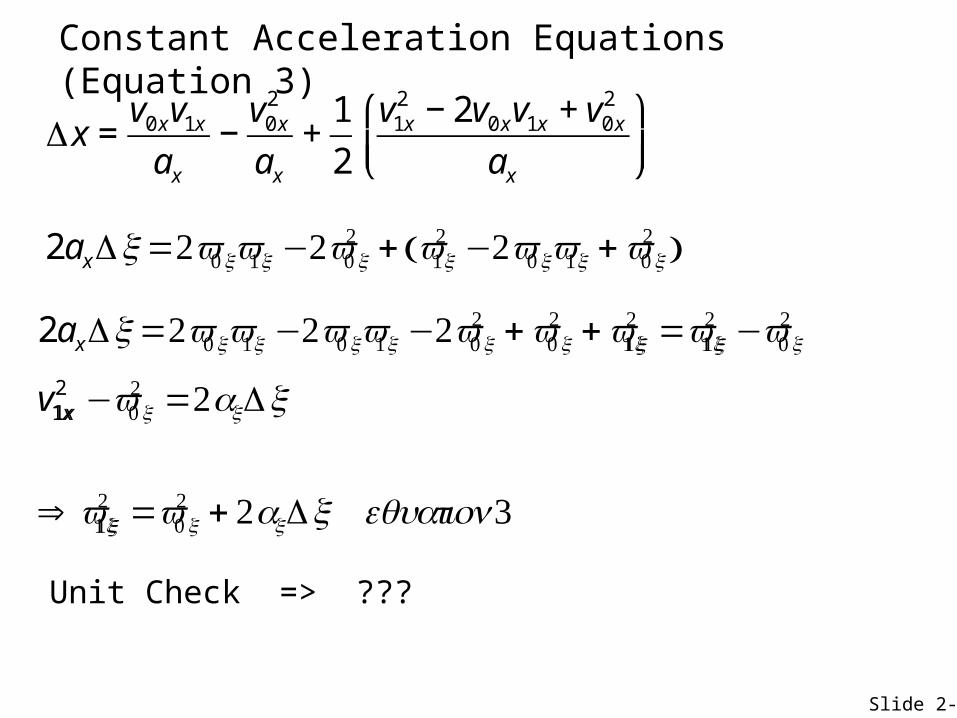
Constant Acceleration Equations (Equation 3)
Δx =v0xv1xax
−v0x2
ax+1
2
v1x2 − 2v0xv1x + v0x
2
ax
⎛
⎝⎜⎞
⎠⎟
2axΔx=2v0xv1x −2v0x2 + v1x
2 −2v0xv1x + v0x2( )
2axΔx=2v0xv1x −2v0xv1x −2v0x2 + v0x
2 + v1x21x =v1x
21x −v0x
2
v1x21x −v0x
2 =2axΔx
⇒ v1x21x =v0x
2 + 2axΔx equation3
Unit Check => ???
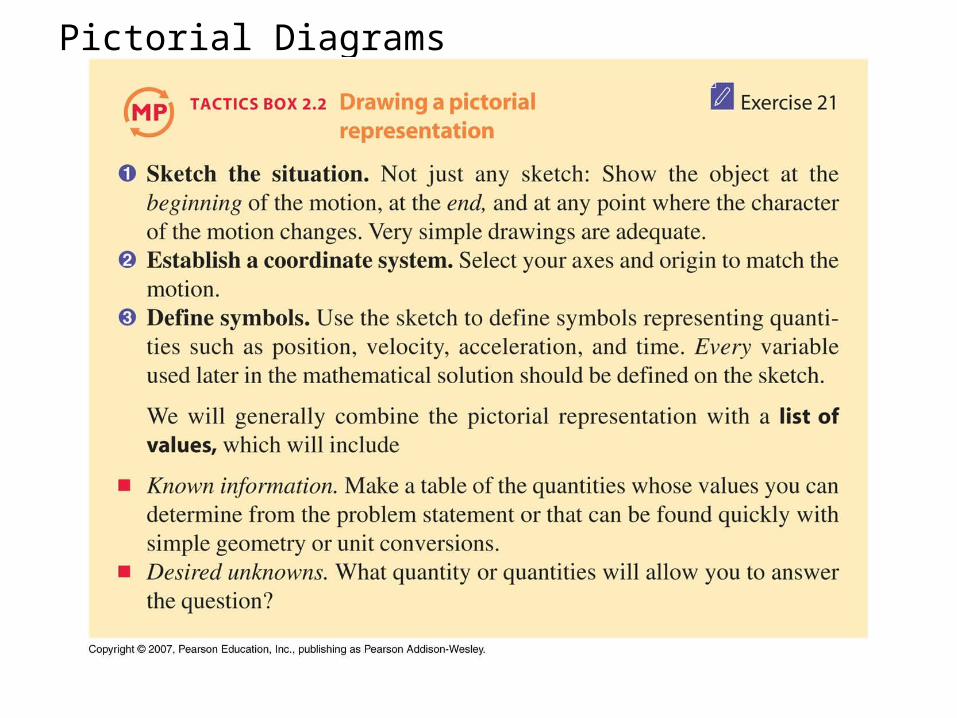
Pictorial Diagrams
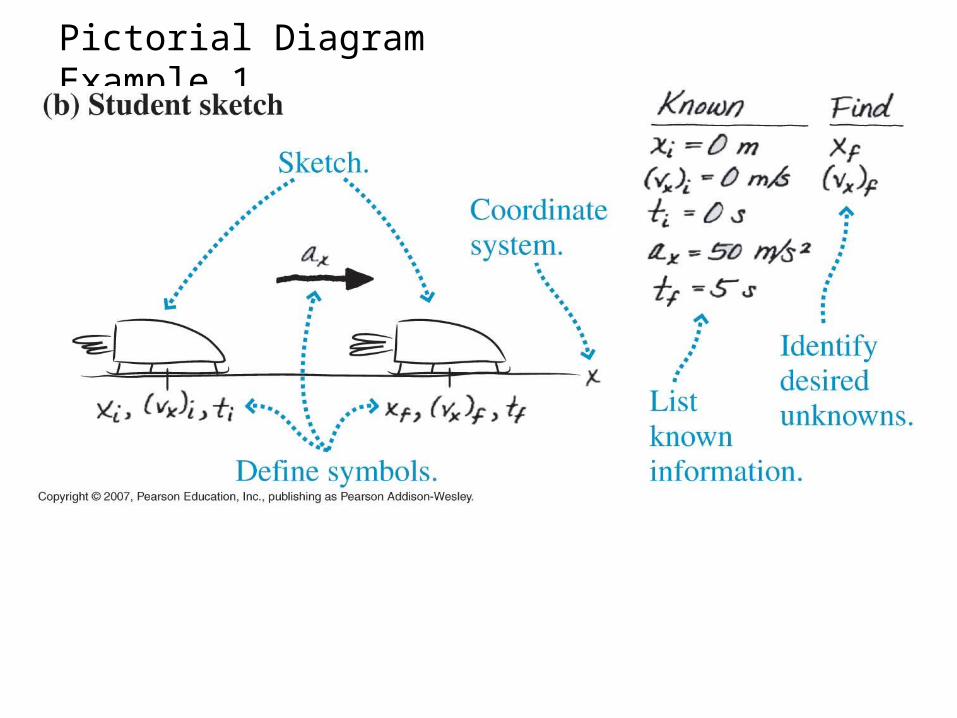
Pictorial Diagram Example 1
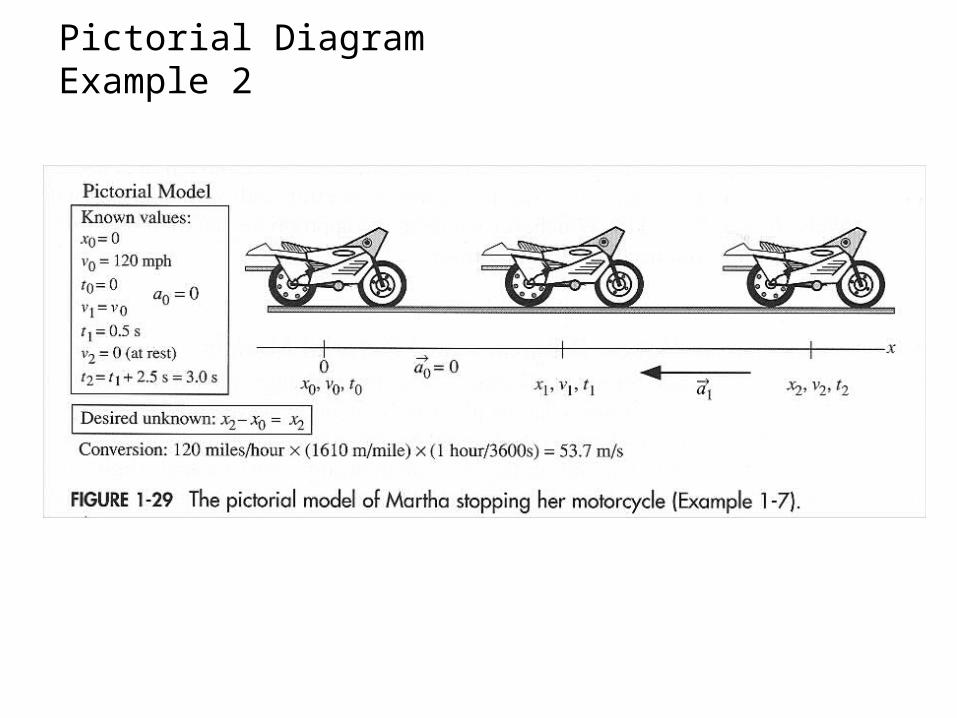
Pictorial Diagram Example 2
Slide 2-4
The Sprinter
A sprinter accelerates at 2.5 m/s^2 until reaching his top speed of 15 m/s. He then continues to run at top speed.
How long does it take him to run the 100 m dash?
Slide 2-4
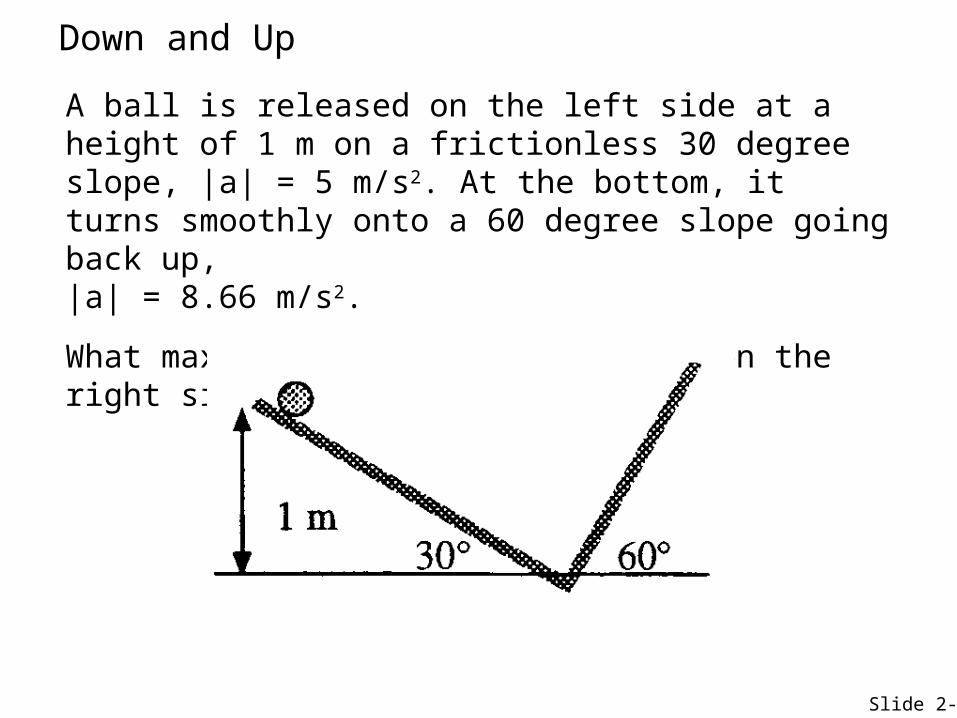
Down and Up
A ball is released on the left side at a height of 1 m on a frictionless 30 degree slope, |a| = 5 m/s2. At the bottom, it turns smoothly onto a 60 degree slope going back up, |a| = 8.66 m/s2.
What maximum height does it reach on the right side?