Embed Size (px)
Citation preview

PHYSICS PARTICIPATION AND POLICIES: LESSONS FROM ABROAD
Alan Smithers and Pamela Robinson Centre for Education and Employment Research
University of Buckingham
Produced with the Support of The Gatsby Charitable Foundation
(INSIDE FRONT COVER)
© The Gatsby Charitable Foundation, and Alan Smithers and Pamela Robinson 2009
Published December 2009
Carmichael Press University of Buckingham Buckingham MK18 1EG
Printed in England for the Carmichael Press by ********* ISBN 978 1 907168-20-8

Contents
Executive Summary i
1. Introduction 1
2. Current School Situation in England 4
3. A-Level Stage (ISCED 3) 13
4. Degrees, Doctorates and Employment in the UK 30
5. Graduates and Doctorates in Other Countries 38
6. The Science Dilemma 50
7. Specialist Science Schools 54
8. National Strategies and Initiatives 65
9. Policy Implications 77
References 86
Executive Summary Physics participation at A-level has fallen sharply in recent years. This is the sixth in a series of reports, funded by the Gatsby Charitable Foundation, which has investigated the decline. The first described the situation in schools, the second analysed national statistics, the third looked at schools that were bucking the trend, the fourth considered teacher supply in detail, and the most recent assessed the impact of the specialist schools. This final report draws together evidence from around the world to pose the question: is England typical?
A-Levels in UK Between 1982 and 2006 A-level physics entries halved from 55,728 to 27,466. The number of 18-year-olds fell and there were more A-levels to choose from, but the decline seems to have been mainly an unintended consequence of the switch from the separate sciences to combined science at GCSE. Combined science has tended to be taught by biologists and it seems to have been a much better platform for biology than physics and chemistry at A-level. It is now government policy to revert to the separate sciences for the most able. Since 2006 there has been some modest recovery in A-level physics entries, with an increase of 7.3 per cent to 29,436.
A-Level Stage in Other Countries Extensive searches yielded six countries in which physics participation at the A-level stage was both identifiable (it is often taken as part of a larger science grouping) and recorded over a run of years. In five - Australia, Eire, Finland, New Zealand and Scotland - take-up has been falling. Only in the United States have numbers been increasing. The A-level physics entry is much lower than for equivalent courses in other countries. In 2007 it was only 3.6 per cent of the age cohort compared to an average of 11 per cent elsewhere. Taken together with the halving of entries, this suggests there is considerable scope for raising participation.
Degrees and Doctorates in the UK In contrast to the sharp falls at A-level, university physics entries in the UK have remained at much the same level for several decades. This is possible because only about one in ten of those passing A-level physics are needed to fill the university places, even in the lean years. While graduate output overall has burgeoned, especially following the elevation of the former polytechnics, physics has flat-lined. In the period 1995 to 2008 it was one of only three subjects - chemistry and engineering were the others - to fall back rather than to share in the rapid growth. Unemployment and salaries can be taken as indicators of the demand for graduates. Surprisingly physics comes toward the upper end of the unemployment range six months after graduating. The salaries of physics graduates, both first degree and doctoral, after three years were well below average, probably reflecting the high proportion going into research and the low salaries paid to university staff. The widespread belief that there is a severe shortage of physics graduates seems to stem from the undoubted difficulty of recruiting sufficient high quality teachers.
Degrees and Doctorates in Other Countries At the first-degree and doctoral levels, physics graduate output in most countries has tended to stay about the same or to fall somewhat, in contrast to the physical sciences as a whole where there have been rises. In neither case, however, has any increase kept pace with the growth in graduates or doctorates overall, so shown as relative share they appear to decline.
i

In fact, in the United States and the UK, two countries with long runs of data, the output of first-degree physics graduates has remained much the same over many years. If there is shortage of physics specialists, it is curious that the market has not corrected for it.
The Science Dilemma Statistics for the European Union show that, on average, 13.4 per thousand of 20-29 year-olds in 2007 had degrees in science, maths and technology, with a range from 20.5 in France to 6.4 in Hungary. In organising school science education, countries face a dilemma: do they gear it mainly to the science professionals of the future or to science for citizens so that all can participate in a society’s decision-making about scientific issues? Often there are not enough high quality physics teachers to go round, so should the specialist teachers and scientifically talented pupils be brought together in some way? Some countries have selection in lower secondary education, including Germany, the Netherlands, Austria and Hungary, and others in upper secondary education as in Finland.
Specialist Science Schools A number of countries, the United States, Korea, Japan, Singapore, the Philippines and Turkey among them, have specialist science schools for the especially able. Scientific ability and interest is identified not only through selection tests, but also from prior attainment, interviews, and assessment activities. Most are high schools but in Singapore entry is either at age 12 or 14, and in the Philippines it is 12. Japan created science schools through a bidding process among its high schools. Singapore encouraged its National University to take the lead. Entry can be very competitive. In New York about 29,000 take the admissions test for the 6,000 places at the eight specialised schools. Research in the United States found that science schools are “highly effective at producing graduates not only with high levels of aptitude in STEM, but who go on to further study and careers in STEM.” The Bronx High has six Nobel laureates among its former pupils. It has been the inspiration for science schools in the Philippines and Turkey. In contrast to specialist science schools in other countries, science schools in England are explicitly non-selective.
National Strategies and Initiatives The Netherlands has a comprehensive National Action Plan from primary school through to business-education links, which aims to raise participation in maths, science and technology by 15 per cent over the ten years from 2000. Some of its ‘grammar’ schools are funded as science schools to act as catalysts and there is also a university-based consortium at Utrecht University providing for the most gifted science pupils in partner schools. Japan has a Science Literacy Enhancement Initiative with the twin aims of raising interest and, through Super Science High Schools particularly, developing talented children’s individuality and capabilities. Attracting sufficient physics teachers is a problem experienced by many countries and a number of initiatives target teachers, seeking to recruit more with science specialisms and improving training and support in employment. In Italy, the United States and Norway less than ten per cent of 14-year-old pupils are taught by a teacher whose main area in science is physics. England is second only to Tunisia in the proportion of science teaching in the hands of biologists. The United States seems to have increased physics take-up by making more science credits a requirement for high school graduation. There are voluntary out-of-school initiatives such as Les Petits Débrouillards, originally in Quebec but now in 15 countries, which aims to make science interesting and fun for younger children. Some initiatives are less about fun or achievement than increasing diversity through attracting more females or ethnic minorities.
ii
Recommendations The UK government has a broad raft of policies for improving physics participation and performance in England at both school and university. It has an ambitious target of raising A-level physics entries by nearly a fifth to 35,000 by 2014. There are signs that the drive on science has begun to turn around the continual decline, but the government is not satisfied and as this report is being written a Science and Learning Expert group is consulting on ways of promoting ‘stretch and challenge’. We suggest that there are important lessons to be learned from other countries and make eight recommendations.
Stretch and Challenge 1) The role of the specialist science schools should be re-thought with a view to harnessing them to provide stretch and challenge for the most able and increasing the numbers of young people taking physics and other science A-levels.
2) The development of a network of specialist science schools with provision for the scientifically talented from age 13-14 should be explored.
3) Universities with leading physics departments should be invited to bid for funds to enable them to pilot partnerships with schools to provide high-level courses in the sciences.
Curriculum, Examinations and Qualifications 4) The role of the universities in setting and regulating A-level examinations should be increased by requiring awarding bodies, the QCDA and Ofqual to have strong representation from them.
5) Universities should explore the feasibility of establishing a new examination board that would offer A-levels, or an alternative qualification, that fully met their entry requirements in terms of standards and distinguishing between applicants, and obviate the need for individual entrance tests.
Teachers 6) Accepting that good physics teachers are in short supply at present and are likely to remain so in the immediate future, models for ensuring that all secondary pupils have access to high quality specialist teachers should be trialled. These might include schools sharing teachers among themselves and working in partnership with the further education sector and universities.
University Numbers 7) It is widely held that there is a shortage of physics graduates, but the evidence for this is not unequivocal. An investigation should be undertaken to better understand the demand for physics graduates and the factors affecting supply.
Evaluation 8) All initiatives and strategies for improving physics participation and performance should set out the criteria by which they can be judged, and they should be carefully monitored and evaluated.
iii

1. Introduction 1.1 Physics participation in schools in England fallen sharply. Recognising the
considerable concern, the Gatsby Charitable Foundation has funded the Centre for Education and Employment Research at the University of Buckingham for five years to investigate the trend and draw out policy implications. This is the sixth in a series of reports (Smithers and Robinson, 2005-09) examining the decline from a number of perspectives. The first described the situation in schools, the second analysed national statistics, the third looked at schools that were bucking the trend, the fourth considered teacher supply in detail, and the most recent reviewed the role of the specialist science schools.
1.2 This final report draws together evidence from around the world to pose the question: to what extent is England typical? Is physics participation going up, down or remaining more or less the same? Behind this is the implicit question: are young people becoming less interested in studying the subject? The numbers can go up and down in relation to a variety of influences - changes in the organisation of schools, curricula, qualifications, places available, career prospects and incentives among them. There will also be an effect of population size. But at root we are hoping that the numerical patterns from around the world will tell us something about whether physics is becoming less popular. It is also important to try to identify which policy changes seem to have had the most impact. The best place to start is upper secondary schooling since here young people are often able to make choices. But it is also potentially the most difficult phase since physics is not always taught as a separate subject.
1.3 We have focused on three stages of education. We have called these the A-level stage, the degree stage (both entrants and graduates) and doctoral stage since we are writing mainly for an English audience. In international terms (OECD, 2004) these are International Standard Classification of Education (ISCED) Level 3, ISCED Level 5A (which includes bachelor’s and master’s degrees) and ISCED Level 6. We also adopt the English usage of the term ‘pupil’ for young people at school and ‘student’ for those at university, recognising that other countries use the term student throughout.
A-Level Stage 1.4 We begin our analysis, in Chapter 2, by re-visiting the situation in England since
there are signs that the long downturn described by Smithers and Robinson (2006) may have bottomed out. From 2007 there have been small increases. A-levels (taken in England, Wales and Northern Ireland) are particularly revealing as an indicator of pupils’ willingness to study physics, since they are single subject qualifications which can be chosen among an array of options - currently 36. As single subject awards, they can also easily be logged and counted.
1.5 In Chapter 3, we ask how other countries have fared. Unfortunately comparisons are difficult because few other countries have a separate qualification for physics at this stage. The subject is usually taught as part of, or as an option within, some science grouping. Neither do all countries keep such good statistics as England. Where there are statistics available these tend to be for the ‘natural sciences’ or
1
‘science and technology’ so that trends in physics can be masked by changes elsewhere.
Degrees and Doctorates 1.6 The information on graduates is more extensive, but is less good as an indicator of
interest in physics since other factors may be paramount. Participation at degree level depends crucially on the number of places a government, usually the main paymaster of universities, is prepared to fund. If fewer people come forward to study physics but the number of places is kept at the same level then it becomes an issue of quality rather than quantity, and that is more difficult to detect. Perceptions of the demand for physicists and the relative rewards of specialising in physics also come into play. These perceptions will in turn be affected by a country’s investment in physics-related research and development, and the economic situation generally. The driver of physics take-up may, therefore, lie outside the individual and be more a function of the society in which the universities exist. In Chapter 4 we look at the trends in degrees, doctorates and employment in the UK and, in Chapter 5, we consider the situation worldwide.
The Science Dilemma 1.7 Chapter 6 poses a dilemma: should school science education be geared more to
identifying and developing the researchers and specialists of the future who will make a disproportionate contribution to a country’s economic and intellectual health, or should the emphasis be more on science for citizens so that all can participate in a society’s decision-making about scientific issues? The nature of the knowledge and depth of understanding required suggest that these two aims are not entirely compatible at least within the same classes. It emerges that only a relatively small part of any population is capable of taking and enjoying physics to a high level, and there is often a shortage of specialist teachers. A practical aspect to the dilemma is: should the best teachers be brought together with the best pupils?
Specialist Science Schools 1.8 Some countries cater for the most able in specialist science schools, and we consider
those in Chapter 7. The United States has long had such schools but they are also to be found in Singapore, Korea, Japan, the Philippines and Turkey. Australia has one specialist science school associated with Flinders University, where the main purpose seems to be curriculum development. The specialist science schools in England are, of course, quite different in that they are explicitly non-selective.
National Strategies 1.9 In Chapter 8 we consider national strategies to boost science take-up. The
Netherlands is aiming to achieve a 15 per cent increase in the pupils and students choosing scientific and technical education and has commissioned Platform Bèta Techniek (PBT) to deliver it. Many of the States in the USA have imposed requirements for science credits in order to achieve high school graduation. Eire launched the Discover Science and Engineering (DSE) initiative in October 2003 and in June 2006 published the Strategic Plan for Science, Technology and Innovation 2006-2013 in which a major objective is to increase the percentage taking physics and chemistry in the Leaving Certificate to 20 per cent. England in
2

the recent past has had a programme to develop the gifted and talented including those in science.
Policy Implications 1.10 In the concluding chapter, Chapter 9, we bring together the findings and draw out
the policy implications. England has adopted a variety of approaches to boosting physics participation and performance, among them: national strategies; reversion to separate sciences for the most able 14 to 16 year-olds; and a gifted and talented strand. It has also established specialist science schools, but not specialist in the sense of the selective specialist schools of other countries. Graduate output in physics has remained much the same over three decades. If there is a shortage of physics graduates why has not the market acted to correct it? Possibly there is not the shortage that is assumed. There are certainly not enough well-qualified physics teachers, but does it go beyond that? The situation in England will be examined in the light of the experience of other countries.
3
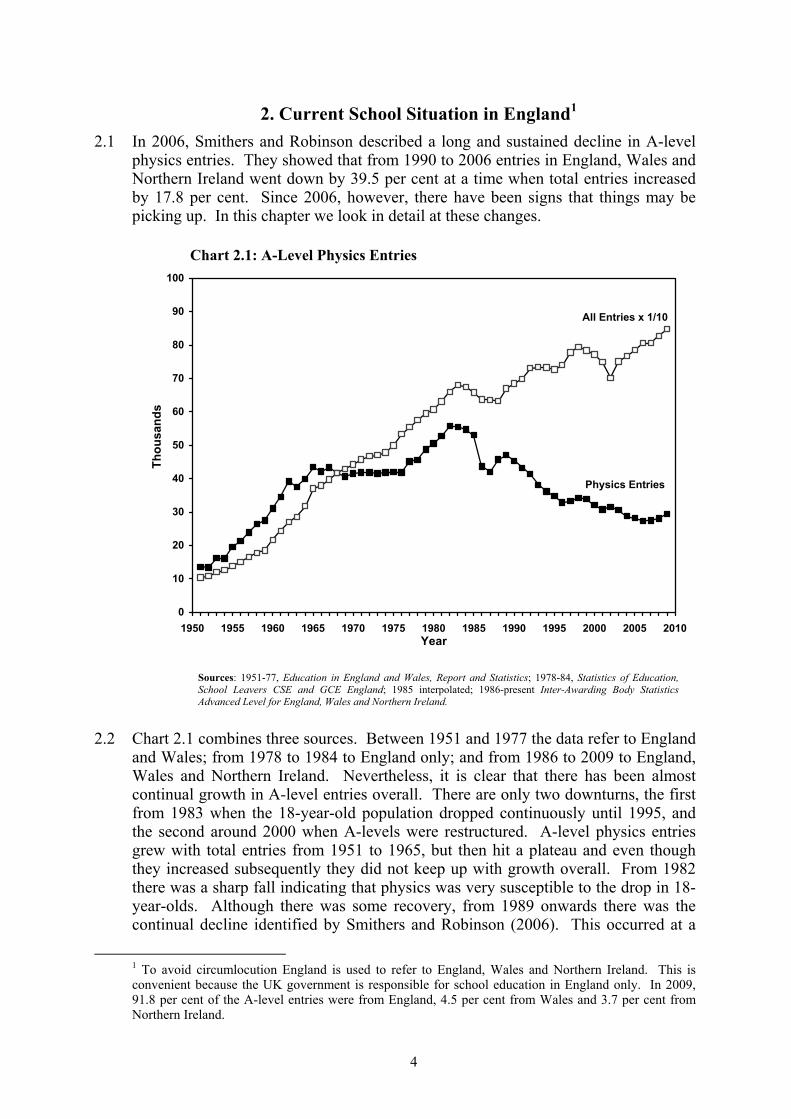
2. Current School Situation in England1 2.1 In 2006, Smithers and Robinson described a long and sustained decline in A-level
physics entries. They showed that from 1990 to 2006 entries in England, Wales and Northern Ireland went down by 39.5 per cent at a time when total entries increased by 17.8 per cent. Since 2006, however, there have been signs that things may be picking up. In this chapter we look in detail at these changes.
Chart 2.1: A-Level Physics Entries
0
10
20
30
40
50
60
70
80
90
100
1950 1955 1960 1965 1970 1975 1980 1985 1990 1995 2000 2005 2010Year
Thou
sand
s
Physics Entries
All Entries x 1/10
Sources: 1951-77, Education in England and Wales, Report and Statistics; 1978-84, Statistics of Education, School Leavers CSE and GCE England; 1985 interpolated; 1986-present Inter-Awarding Body Statistics Advanced Level for England, Wales and Northern Ireland.
2.2 Chart 2.1 combines three sources. Between 1951 and 1977 the data refer to England and Wales; from 1978 to 1984 to England only; and from 1986 to 2009 to England, Wales and Northern Ireland. Nevertheless, it is clear that there has been almost continual growth in A-level entries overall. There are only two downturns, the first from 1983 when the 18-year-old population dropped continuously until 1995, and the second around 2000 when A-levels were restructured. A-level physics entries grew with total entries from 1951 to 1965, but then hit a plateau and even though they increased subsequently they did not keep up with growth overall. From 1982 there was a sharp fall indicating that physics was very susceptible to the drop in 18-year-olds. Although there was some recovery, from 1989 onwards there was the continual decline identified by Smithers and Robinson (2006). This occurred at a
1 To avoid circumlocution England is used to refer to England, Wales and Northern Ireland. This is convenient because the UK government is responsible for school education in England only. In 2009, 91.8 per cent of the A-level entries were from England, 4.5 per cent from Wales and 3.7 per cent from Northern Ireland.
4
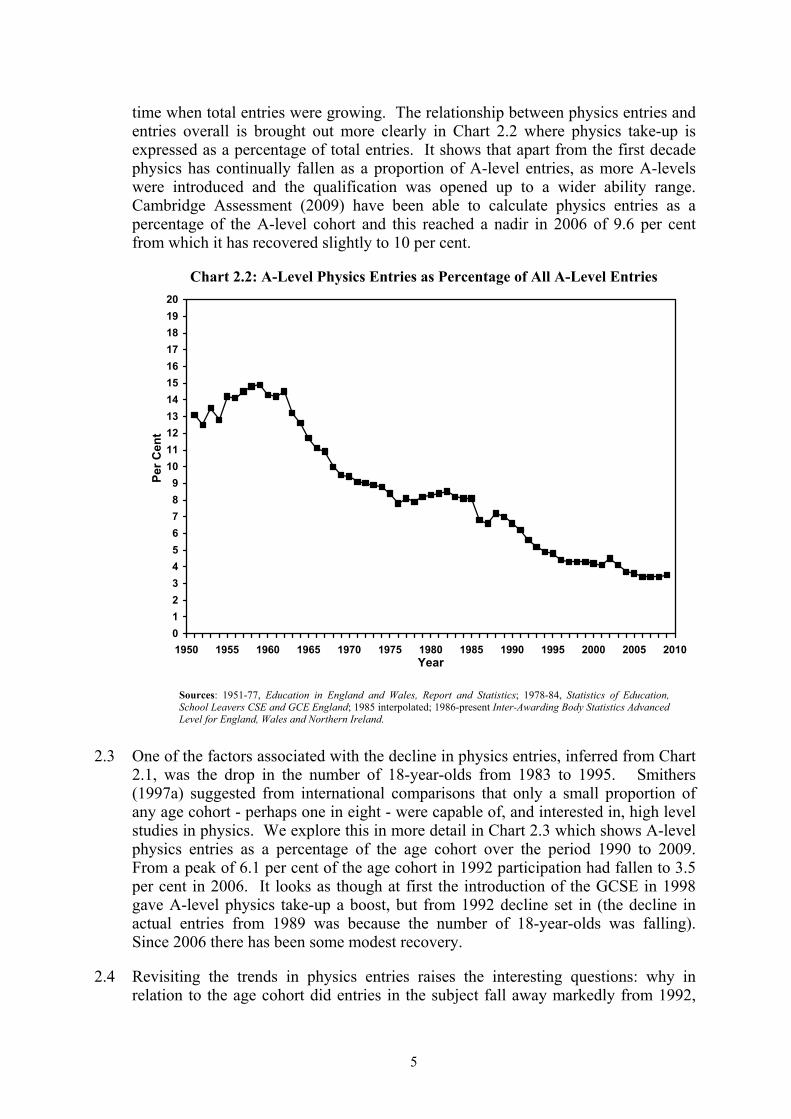
time when total entries were growing. The relationship between physics entries and entries overall is brought out more clearly in Chart 2.2 where physics take-up is expressed as a percentage of total entries. It shows that apart from the first decade physics has continually fallen as a proportion of A-level entries, as more A-levels were introduced and the qualification was opened up to a wider ability range. Cambridge Assessment (2009) have been able to calculate physics entries as a percentage of the A-level cohort and this reached a nadir in 2006 of 9.6 per cent from which it has recovered slightly to 10 per cent.
Chart 2.2: A-Level Physics Entries as Percentage of All A-Level Entries
0123456789
1011121314151617181920
1950 1955 1960 1965 1970 1975 1980 1985 1990 1995 2000 2005 2010Year
Per C
ent
Sources: 1951-77, Education in England and Wales, Report and Statistics; 1978-84, Statistics of Education, School Leavers CSE and GCE England; 1985 interpolated; 1986-present Inter-Awarding Body Statistics Advanced Level for England, Wales and Northern Ireland.
2.3 One of the factors associated with the decline in physics entries, inferred from Chart 2.1, was the drop in the number of 18-year-olds from 1983 to 1995. Smithers (1997a) suggested from international comparisons that only a small proportion of any age cohort - perhaps one in eight - were capable of, and interested in, high level studies in physics. We explore this in more detail in Chart 2.3 which shows A-level physics entries as a percentage of the age cohort over the period 1990 to 2009. From a peak of 6.1 per cent of the age cohort in 1992 participation had fallen to 3.5 per cent in 2006. It looks as though at first the introduction of the GCSE in 1998 gave A-level physics take-up a boost, but from 1992 decline set in (the decline in actual entries from 1989 was because the number of 18-year-olds was falling). Since 2006 there has been some modest recovery.
2.4 Revisiting the trends in physics entries raises the interesting questions: why in relation to the age cohort did entries in the subject fall away markedly from 1992,
5

and why have they begun to pick up again from 2006. They also offer some important pointers to international comparisons.
• To understand the trends in take-up we need to consider three metrics; actual entries; entries relative to other subjects (or even better the school cohort); and entries as a percentage of the age cohort.
• Entries within a country can go up and down at different times and it is important to specify the period for which the comparison is being made.
• Entries do not just reflect pupil interest but are affected by, among other things, the structure of the school system, the nature of qualifications, and demand factors of various kinds.
Chart 2.3: A-Level Physics as Percentage1,2 of Age Group
0
1
2
3
4
5
6
7
Per C
ent
1990 1992 1994 1996 1998 2000 2002 2004 2006 2008 2010
Year
1. Population statistics for England and Wales are mid-year estimates from the Office of National Statistics (ONS) and those for Northern Ireland are from the Northern Ireland Statistics Research Agency (NISRA). 2. A-level entries from maintained schools, independent schools, sixth form colleges, tertiary colleges and FE colleges in England, Wales and Northern Ireland from Inter-Awarding Body Statistics.
GCSEs 2.5 But to return to the interesting question of why the fall from 1992. A likely
explanation is the changes which took place in the qualifications at age 16 with effect from 1988, and also the curriculum reforms of the 1988 Education Reform Act (ERA). Two previously separate qualifications, O-level the stepping-stone to A-levels and the Certificate of Secondary Education for the less able, were combined to become the GCSE. But of even greater importance as far as physics take-up was concerned were the changes stemming from the curriculum reform. The ERA made science compulsory to age 16 and in a related move a double science GCSE was introduced. Both these changes were expected to boost the sciences at A-level. Too many young people were writing themselves off from science at age
6
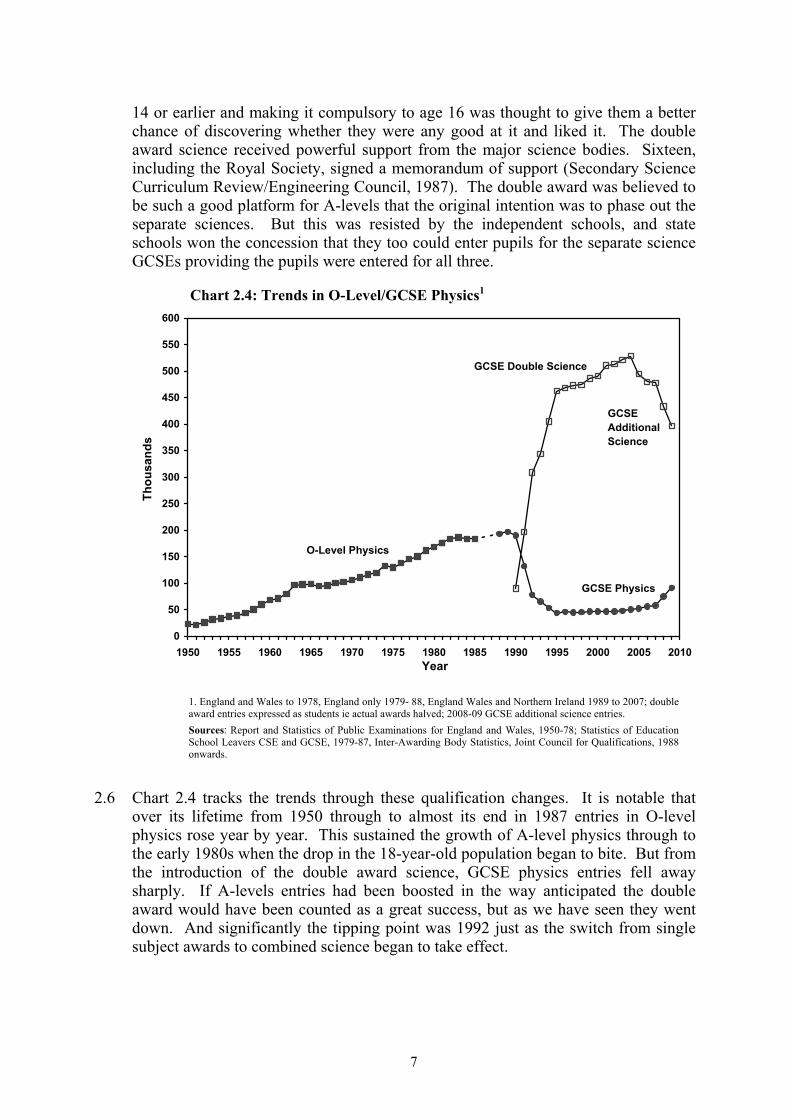
14 or earlier and making it compulsory to age 16 was thought to give them a better chance of discovering whether they were any good at it and liked it. The double award science received powerful support from the major science bodies. Sixteen, including the Royal Society, signed a memorandum of support (Secondary Science Curriculum Review/Engineering Council, 1987). The double award was believed to be such a good platform for A-levels that the original intention was to phase out the separate sciences. But this was resisted by the independent schools, and state schools won the concession that they too could enter pupils for the separate science GCSEs providing the pupils were entered for all three.
Chart 2.4: Trends in O-Level/GCSE Physics1
0
50
100
150
200
250
300
350
400
450
500
550
600
1950 1955 1960 1965 1970 1975 1980 1985 1990 1995 2000 2005 2010Year
Thou
sand
s
O-Level Physics
GCSE Double Science
GCSE Physics
GCSE Additional Science
1. England and Wales to 1978, England only 1979- 88, England Wales and Northern Ireland 1989 to 2007; double award entries expressed as students ie actual awards halved; 2008-09 GCSE additional science entries. Sources: Report and Statistics of Public Examinations for England and Wales, 1950-78; Statistics of Education School Leavers CSE and GCSE, 1979-87, Inter-Awarding Body Statistics, Joint Council for Qualifications, 1988 onwards.
2.6 Chart 2.4 tracks the trends through these qualification changes. It is notable that over its lifetime from 1950 through to almost its end in 1987 entries in O-level physics rose year by year. This sustained the growth of A-level physics through to the early 1980s when the drop in the 18-year-old population began to bite. But from the introduction of the double award science, GCSE physics entries fell away sharply. If A-levels entries had been boosted in the way anticipated the double award would have been counted as a great success, but as we have seen they went down. And significantly the tipping point was 1992 just as the switch from single subject awards to combined science began to take effect.
7

Changes Since 2006 2.7 If changes in qualifications at 16 were associated with the decline of physics at A-
level, could they also be associated with the signs of revival? Chart 2.4 shows that since 2008 particularly, physics GCSE entries have begun to rise and combined science entries to fall. The double award science has now been split (taking effect in 2008) into core science and additional science. Triple science can also be combined with core science making it easier for state schools to offer the three sciences. It is possible, for example, to offer the core in Year 9 leaving the following two years for the three sciences whereas previously they had had to be taught in a two-subject slot or through additional lessons outside the normal timetable. At the same time government policy has become to promote the separate sciences for the most able (HM Treasury, 2006). This has been tied in with the specialist schools programme so that all specialist science schools are required to offer the separate sciences.
2.8 Chart 2.5 provides the detailed figures for changes in science and maths A-level participation since 2006 and compares them with the 1990 entries when the GCSE changes will first have taken effect. There has indeed been a modest recovery in physics take-up of 7.3 per cent since 2006, but that is in the context of a fall of nearly 40 per cent since 1990. Entries in 2009 are still down by 35.1 per cent on 1990. The increase since 2006 is in line with the growth of entries generally.
Chart 2.5: A-Level Entries in Thousands
Subject 1990 2006 2007 2008 2009 %Change 1990-2006
%Change2006-09
Physics 45.3 27.4 27.5 28.1 29.4 -39.5 7.3 Chemistry 46.2 40.1 40.3 41.7 42.5 -13.2 6.0 Biology 46.5 54.9 54.6 56.0 55.5 18.1 1.1 Maths 79.7 56.0 60.1 64.6 72.5 -29.7 29.5 Further Maths 7.3 7.9 9.1 10.5 43.8 Total Entries 684.1 805.7 805.7 827.7 865.0 17.8 7.4 Age Cohort 749.3 743.7 735.1 742.3 752.0 0.4 1.1
Source: Joint Council for Qualifications.
2.9 Maths also fell sharply from 1990 to 2006 (though this is exaggerated because the 1990 figure also includes further maths), but the subject has bounced back almost completely in the past three years. Chemistry like physics declined between 1990 and 2006 since when there has been some recovery. In contrast, biology entries actually rose between 1990 and 2006, but since then have plateaued. The maths recovery will owe something to the national strategies at Key Stages 2 and 3, its inclusion in the main accountability measure at GCSE, changes in the A-level examination to make it more accessible, and particular initiatives such as Maths in Education and Industry initially funded by Gatsby. The growth in A-level maths is likely to have boosted A-level physics take-up since it is difficult to study it without. Chemistry has benefited but to a lesser extent from the drive to revive the A-level. The pattern for biology has been rather different because it seems that the double award science, in practice largely taught by biologists (Smithers and Robinson, 2005), was a much more suitable platform for biology than physics and chemistry.
8

2.10 In Chart 2.6 we set out sciences and maths entries at GCSE for the two years prior to the A-level years shown in Chart 2.5, and run on to the present day. All three sciences fell from the level they were at when GCSE started. But while this seemed to affect A-level physics and chemistry take-up, biology grew in spite of the separate science GCSEs falling. The gradual move back to the separate science up to 2007 may have contributed to the slight recovery in A-level physics and chemistry, but we shall be able to see more clearly from next year since the separate science GCSE entries rose sharply in 2008 and 2009. Chart 2.6 also records the rapid growth in additional maths which may have contributed to the increased popularity of A-level maths and further maths.
Chart 2.6: GCSE Entries in Thousands Subject 1988 2004 2005 2006 2007 2008 2009
Physics 254.1 50.4 52.6 56.0 58.4 75.4 91.2 Chemistry 217.6 51.2 53.4 56.8 59.2 76.7 92.2 Biology 304.7 53.4 56.5 60.1 63.2 85.5 100.9 Science1 155.7 527.0 494.5 479.8 478.0 433.5 396.9 Maths 670.1 741.7 741.4 750.6 760.3 738.5 754.7 Additional Maths 3.2 3.3 3.3 9.8 17.0 18.8 Total Entries 4,486.3 5,875.4 5,736.5 5,752.1 5,827.3 5,669.1 5,469.3 Age Cohort 746.9 728.8 723.5 727.2 738.9 727.4 700.0
1. Double award to 2007, additional 2008-2009. Source: Joint Council for Qualifications.
2.11 As encouraging as the recent GCSE and A-level numbers in physics may be they still fall far short of the government’s target of 35,000 A-level entries by 2014 (DCSF, 2009). Given its recent growth, the maths target of 80,000 though does look attainable. It must be borne in mind, however, that actual entries in 2009 reflected a large age cohort which is set to fall through to 2014.
Universities 2.12 The dynamic of university participation is different from that in schools. Whereas in
schools opportunities are provided for all or most of the age cohort to study to age 18 and the numbers taking physics/sciences reflect pupil interest to some extent, at university the determining feature is the number of places available. Chart 2.7 shows a time course of university entries (we will look at first-degree and doctoral graduates in Chapter 4). The time course runs together several data sets with different universities and different definitions of physics. Nevertheless, in contrast to the fall in A-level physics entries, the impression conveyed by Chart 2.7 is of stability. In the period 1980 to 1993 when the data are from the old established universities in Britain (the polytechnics and Northern Ireland are not covered) there were about 2,500 full time first year first-degree home-domiciled physics entrants a year. When the data source changed in 1994 to include the former polytechnics and Northern Ireland the number recorded first went up to 3,200, but then drifted down again to about 2,500 in 2001. In 2002 the definition of physics was modified to include, among other things, education degrees and that has contributed to entries rising to about 3,000 in 2007 the latest year for which this statistic is currently available.
9

Chart 2.7: University Entrants1 in Physics2
0
1
2
3
4
5
1980 1985 1990 1995 2000 2005 2010Year
Thou
sand
s
1. First year, full time, first-degree, home domiciled 2.Physics per se (does not include astronomy, materials science); definition broadened in 2002 Sources: 1980 -1993 University Statistical Record (old universities only, does not include polytechnics, does not include Northern Ireland); 1994-2007 Higher Education Statistics Agency, Students in HE Institutions.
2.13 This recent increase is set in context in Chart 2.8 which shows changes in the other sciences, maths and total entries over the same period. Physics and the physical sciences generally have kept pace with the increase in entries overall, but have not done as well as the biological and mathematical sciences.
Chart 2.8: University Entrants1 by Subject Area in Thousands
Subject 2002 2003 2004 2005 2006 2007 %Change 2002-2007
Physics 2.79 2.77 2.63 2.76 2.69 3.04 9.0 Chemistry 3.56 3.30 3.11 3.56 3.53 3.72 4.5 Other Physical Sciences 8.89 8.83 8.71 9.64 9.30 9.47 6.5
Biological Sciences 31.49 32.35 32.55 35.22 34.98 36.62 16.3
Mathematical Sciences 5.48 5.48 5.82 6.13 6.11 6.60 20.4
Total Entries 316.15 320.29 320.87 339.93 325.55 338.72 7.1 1. First year, full time, first-degree home, undergraduate students. Source: Higher Education Statistics Agency, Students in HE Institutions.
2.14 The increase in entries in the physical and biological sciences occurred when A-level entries were at best static and had been falling (see Chart 2.5, remembering that the university figures only run to 2007). This does not mean that A-level entries
10

have not impacted at all on the universities. Between 1994 and 2004, 17 university physics departments closed (Smithers and Robinson, 2006). The effects of this can be traced in Chart 2.7 where from a peak in the reformed university sector of 3,203 in 1994 entries drifted down to 2,515 in 2001, before subject redefinition kicked in. But the closures seem to have been more part of a process of consolidation, whereby the universities, particularly the former polytechnics, with minor physics departments came to realise that physics was never going to be a viable option for them. The net effect in terms of student numbers has been greater concentration in the centres of excellence.
2.15 The disconnect between A-level and university physics entries is possible because only about 10 per cent of those passing the subject at A-level go on to take it at university. In 2007 there were 26,147 passes in physics at GCE A-level and 3,040 university entrants. These figures are not directly comparable since the university entrants include those from Scotland entering on Scottish Highers, but they do give some idea of the proportions. The ninety per cent taking other subjects mainly go into the other physical sciences, maths, engineering, computer science, and medicine. It is easy to see then how the number of university places can be set independently of the numbers qualifying at A-level: as the total falls more can be drawn into to university places from the remaining 90 per cent, perhaps by adjusting the incentives or the entry criteria. Quantity can be maintained, but the quality may be different.
Résumé 2.16 A-level physics entries fell by nearly 40 per cent from 1990 to 2006. As a
proportion of total A-level entries they fell from 6.6 per cent to 3.4 per cent. As a proportion of the age cohort they fell from 5.9 per cent to 3.5 per cent. Since 2006 there has been a slight recovery. By 2009 physics entries were up 7.3 per cent on 2006. As a percentage of total entries there was little change, but as a proportion of the age cohort they rose to 3.9 per cent. The continual decline from 1990 to 2006 seems to have been an unintended consequence of the switch from the separate sciences at age 16 to a double award science GCSE. This was largely taught by biologists and seems to have been a much better platform for biology than physics and chemistry at A-level. It is now government policy to encourage schools to offer the separate sciences to the most able pupils. It could be that the modest recovery from 2006 is associated with this shift. It should become clearer from 2010 since GCSE physics increased appreciably in 2008.
2.17 In contrast to the sharp falls in A-level physics entries, university entries in the subject have remained more or less the same. This is possible because only about ten per cent of those passing A-level physics are needed to fill the university places even in the lean years. More qualifying at A-level gives universities a greater opportunity to select and thus improve the quality. But the reverse will be the case as A-level passes fall. Revisiting and updating the data for England (plus Wales and Northern Ireland) has established some ground rules for examining whether physics take-up is going up, down or staying the same in other countries.
11
• We need to look, where possible, at actual entries, entries relative to other subjects (or even better the school cohort) and as a percentage of the age cohort;
• Entries within a country can go up and down at different times and it is important to specify the period in which the comparison is being made;
• Entries are affected by government policies, for example regarding the structure of the school system and the nature of qualifications, and are not just a measure of pupil interest;
• University participation follows a different dynamic from that in schools, since it is determined mainly by the places made available and it will reflect more the processes generating those places than the interest of students.
What then of other countries?
12

3 A-Level Stage (ISCED 3) 3.1 As we were about to begin this inquiry, the OECD (2008b) published a report from
its Global Science Forum, Encouraging Student Interest in Science and Technology Studies, in which the first chapter, ‘Is There a Real Decline?’ addressed our research question. We wondered whether, given all the resources at the OECD’s disposal, our research was really necessary. It soon became apparent, however, that the OECD’s interest was broader than ours. While we were intending to focus directly on physics, the OECD’s purview was ‘science and technology orientation’ (S&T) in which the physical sciences are lumped together and included along with life sciences, mathematics and statistics, computing sciences, and engineering. Given this wide brief it is entirely possible for the numbers studying ‘science and technology’ to go up or down without physics being affected or indeed going in the opposite direction. But the Global Science Forum’s report was potentially a very important starting point for us and we were particularly fortunate that the Forum generously agreed to release its raw data to us.
Global Science Forum 3.2 The Forum set out to collect science and technology numbers across countries for
the period 1985 to 2003 at four stages of education, upper secondary graduates, new entrants to tertiary education, graduates from tertiary education, and doctorates. Nineteen countries agreed to take part but few were able to provide all the information requested. The most complete set of comparative data for upper secondary schooling was obtained for the period 1997 to 2003 where 12 countries sent figures, nine on actual numbers and ten on proportions of the school cohort. Chart 3.1 shows that three countries - Finland, Germany and Israel - increased their science and technology numbers over this period while six suffered falls. The biggest decreases were in Korea and Norway.
Chart 3.1: Science and Technology ISCED Level 3 S & T Numbers % Pupil Cohort Country 1997 2003 % Change 1997 2003 % Change
Belgium Flanders 13.3 11.7 -12.0 - - - Denmark1 12.2 11.4 -6.6 35.0 36.7 4.9 Finland 12.6 14.0 11.1 39.5 40.5 2.5 France 205.2 200.4 -2.3 34.0 33.1 -2.6 Germany 168.6 194.4 15.3 - - - Israel 27.0 36.3 34.4 33.3 37.1 11.4 Italy2 - - - 26.8 32.8 22.4 Korea 331.8 238.9 -28.0 44.7 41.3 -7.6 Netherlands 22.2 21.6 -2.7 37.9 35.0 -7.7 Norway 14.8 11.7 -20.9 23.5 20.7 -11.9 Sweden - - - 19.1 21.0 9.9 United Kingdom - - - 29.9 28.9 -3.3
1.Comparison 1997-2002. 2.Comparison 1997-2001. Source: Global Science Forum. (2008b)
13

3.3 Norway, along with France and Denmark, was one of three countries which provided science and technology numbers back to 1985. The time courses are shown in Chart 3.2. Over the longer period there were both rises and falls. From a baseline of 100 in 1985 Norway reached a peak of 132 in 1993 and another of 131 in 1999 before dropping to 89 in 2003 - putting it among the fallers in the period covered by Chart 3.1. The OECD suggests that there were some definitional changes in Norway that may have contributed to the apparent peaks and troughs. France also had ups and downs. There the index of science and technology numbers rose to 147 in 1993 before falling back to 120 in 2003. In the third country, Denmark, science and technology numbers drifted mainly downwards although there was some recovery to 95 in 1991 before slipping to 81 in 2001. Korea was able to provide data from 1991. If that is indexed to 100, numbers fluctuated but rose to 124.5 in 1999 before falling sharply to 86 in 2003. Hence Korea appears among the chief fallers. A longer perspective shows that of the six countries in Chart 3.1 showing an overall drop between 1997 and 2003, four had previously had periods of growth, and information was not available on the other two. This makes it crucial to define the period in which countries are being compared.
3.4 Chart 3.1 also shows that science and technology pupils as a percentage of the school cohort increased in five countries and went down in another five. We can take a longer view of Norway, France and Denmark in these terms in Chart 3.3. These are the same pupils as in Chart 3.2 but now as a percentage of the school cohort. In all three countries it was mainly downwards. In Norway the proportion remained at around 27 per cent from 1985-95 since when, with fluctuations, it has drifted down to 21 per cent. In Denmark, however, the decrease was mainly between 1985 and 1995, and from 1997 there was some recovery, so it shows among the gainers in Chart 3.1. The decrease in France coincided with a period of great expansion in upper secondary education and the authors of the Global Science Forum Report suggest:
It could indicate that S&T subjects tend to be perceived as elitist and that their proportion of students rises with the degree of selectivity of the educational level, i.e. a system which places few restrictions on access to upper secondary education and the choice of subject will have a lower share of students taking S&T than one where access is restricted to the most academically able students.
There is some support for this from other countries. The low point for Denmark in 1995 coincides with the largest pupil cohort. The rise in Norway from 2001 reflects a drop in the pupil cohort. In Korea the fall in science and technology numbers from 1999 onwards is greater than the fall in upper secondary pupils so its percentage goes down from 46 to 41. The drop in the upper secondary school population is associated with a decline in the age cohort.
3.5 The fluctuations and variations show that it is not always easy to interpret trends in a particular country from a general compilation of data. As the Global Science Forum says: “Extrapolating student interest in specific disciplines from numbers of students in S&T studies must also be done with caution, as the relationships among numbers, choices, and the degree of interest in S&T studies are complex and indirect.”
14

Chart 3.2: Trends in Science and Technology Numbers
50
60
70
80
90
100
110
120
130
140
150
1985 1987 1989 1991 1993 1995 1997 1999 2001 2003Year
Inde
x
Denmark
Norway
France
Source: Global Science Forum
Chart 3.3: Trends Relative to Pupil Cohort
0
10
20
30
40
50
1985 1987 1989 1991 1993 1995 1997 1999 2001 2003Year
Per c
ent
Denmark
France
Norway
Source: Global Science Forum
15
CEER Study
3.6 The present study differs from the Global Science Forum report in several ways. First, it focuses on physics rather than some broader science grouping. Secondly, it aims to drill down in individual countries. And, thirdly, it looks closely at the qualifications, school structures and educational policies (including particular strategies) of the countries to see if they provide clues as to why physics participation should be going up, down, or remaining about the same. Our first thought in planning international comparisons was to gather evidence and make contacts through the education attachés at embassies and high commissions in London. But in the event it emerged that very few had education attachés.
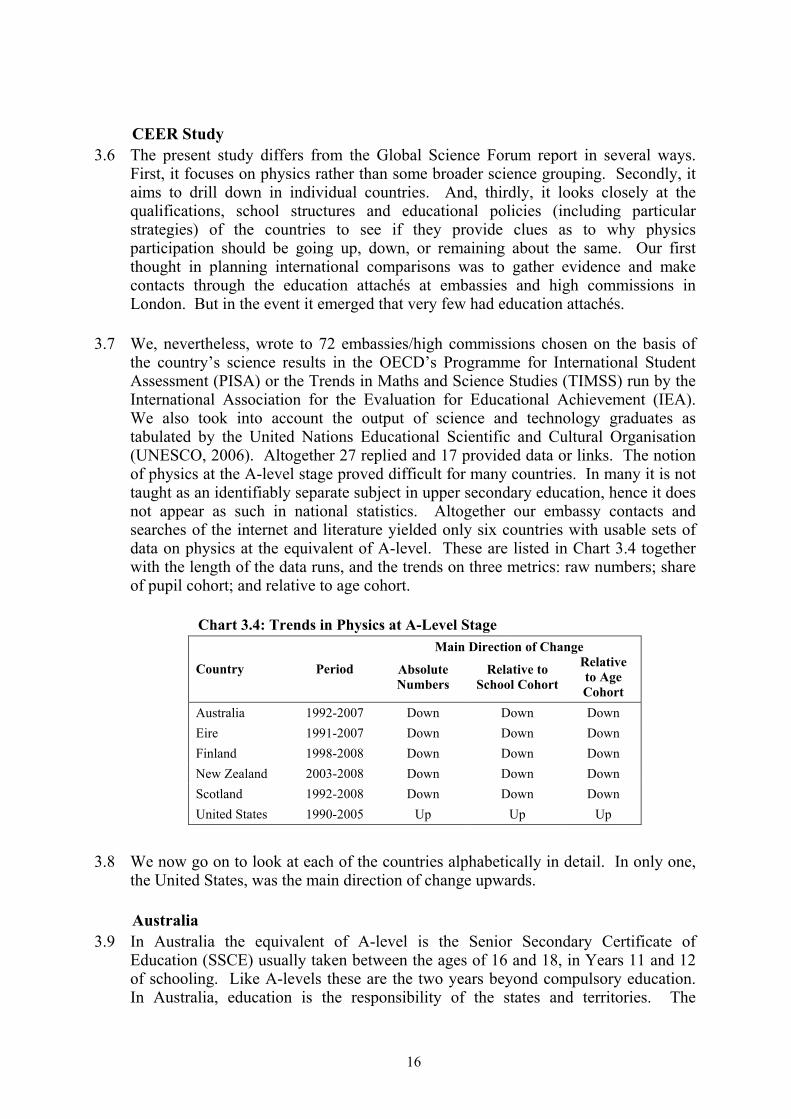
3.7 We, nevertheless, wrote to 72 embassies/high commissions chosen on the basis of the country’s science results in the OECD’s Programme for International Student Assessment (PISA) or the Trends in Maths and Science Studies (TIMSS) run by the International Association for the Evaluation for Educational Achievement (IEA). We also took into account the output of science and technology graduates as tabulated by the United Nations Educational Scientific and Cultural Organisation (UNESCO, 2006). Altogether 27 replied and 17 provided data or links. The notion of physics at the A-level stage proved difficult for many countries. In many it is not taught as an identifiably separate subject in upper secondary education, hence it does not appear as such in national statistics. Altogether our embassy contacts and searches of the internet and literature yielded only six countries with usable sets of data on physics at the equivalent of A-level. These are listed in Chart 3.4 together with the length of the data runs, and the trends on three metrics: raw numbers; share of pupil cohort; and relative to age cohort.
Chart 3.4: Trends in Physics at A-Level Stage Main Direction of Change
Country Period Absolute Numbers
Relative to School Cohort
Relative to Age Cohort
Australia 1992-2007 Down Down Down Eire 1991-2007 Down Down Down Finland 1998-2008 Down Down Down New Zealand 2003-2008 Down Down Down Scotland 1992-2008 Down Down Down United States 1990-2005 Up Up Up
3.8 We now go on to look at each of the countries alphabetically in detail. In only one, the United States, was the main direction of change upwards.
Australia 3.9 In Australia the equivalent of A-level is the Senior Secondary Certificate of
Education (SSCE) usually taken between the ages of 16 and 18, in Years 11 and 12 of schooling. Like A-levels these are the two years beyond compulsory education. In Australia, education is the responsibility of the states and territories. The
16
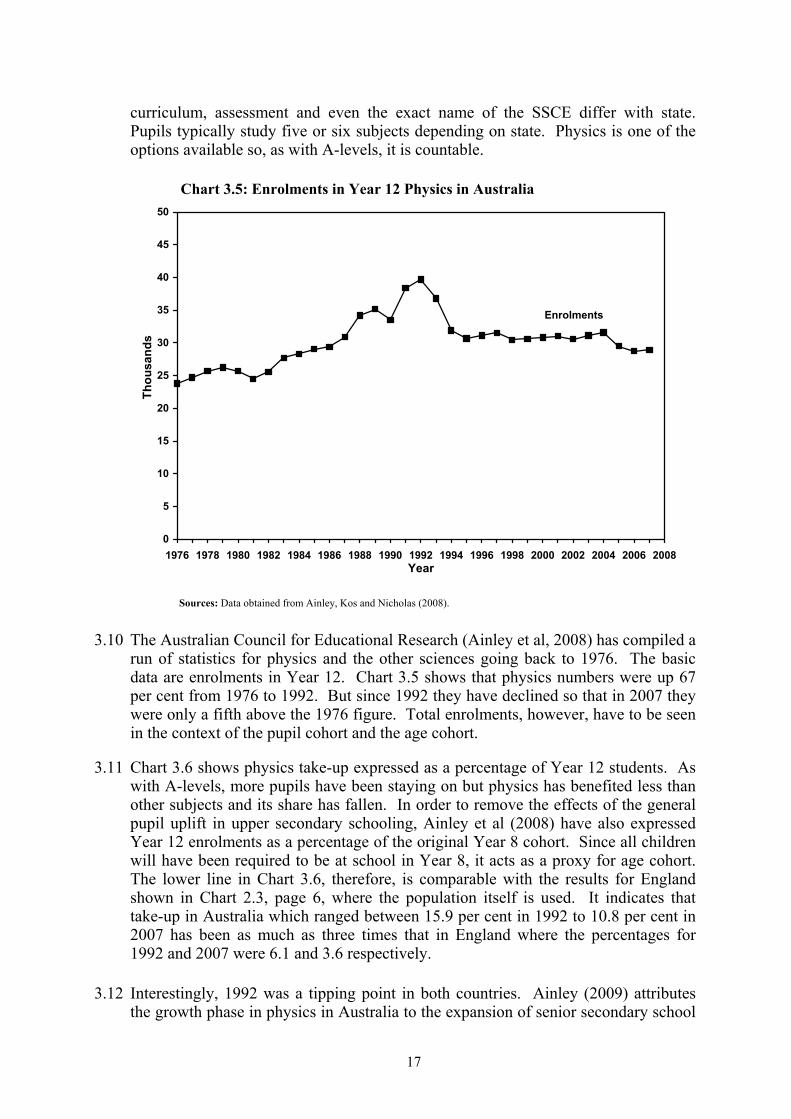
curriculum, assessment and even the exact name of the SSCE differ with state. Pupils typically study five or six subjects depending on state. Physics is one of the options available so, as with A-levels, it is countable.
Chart 3.5: Enrolments in Year 12 Physics in Australia
0
5
10
15
20
25
30
35
40
45
50
1976 1978 1980 1982 1984 1986 1988 1990 1992 1994 1996 1998 2000 2002 2004 2006 2008Year
Thou
sand
s
Enrolments
Sources: Data obtained from Ainley, Kos and Nicholas (2008).
3.10 The Australian Council for Educational Research (Ainley et al, 2008) has compiled a run of statistics for physics and the other sciences going back to 1976. The basic data are enrolments in Year 12. Chart 3.5 shows that physics numbers were up 67 per cent from 1976 to 1992. But since 1992 they have declined so that in 2007 they were only a fifth above the 1976 figure. Total enrolments, however, have to be seen in the context of the pupil cohort and the age cohort.
3.11 Chart 3.6 shows physics take-up expressed as a percentage of Year 12 students. As with A-levels, more pupils have been staying on but physics has benefited less than other subjects and its share has fallen. In order to remove the effects of the general pupil uplift in upper secondary schooling, Ainley et al (2008) have also expressed Year 12 enrolments as a percentage of the original Year 8 cohort. Since all children will have been required to be at school in Year 8, it acts as a proxy for age cohort. The lower line in Chart 3.6, therefore, is comparable with the results for England shown in Chart 2.3, page 6, where the population itself is used. It indicates that take-up in Australia which ranged between 15.9 per cent in 1992 to 10.8 per cent in 2007 has been as much as three times that in England where the percentages for 1992 and 2007 were 6.1 and 3.6 respectively.
3.12 Interestingly, 1992 was a tipping point in both countries. Ainley (2009) attributes the growth phase in physics in Australia to the expansion of senior secondary school
17
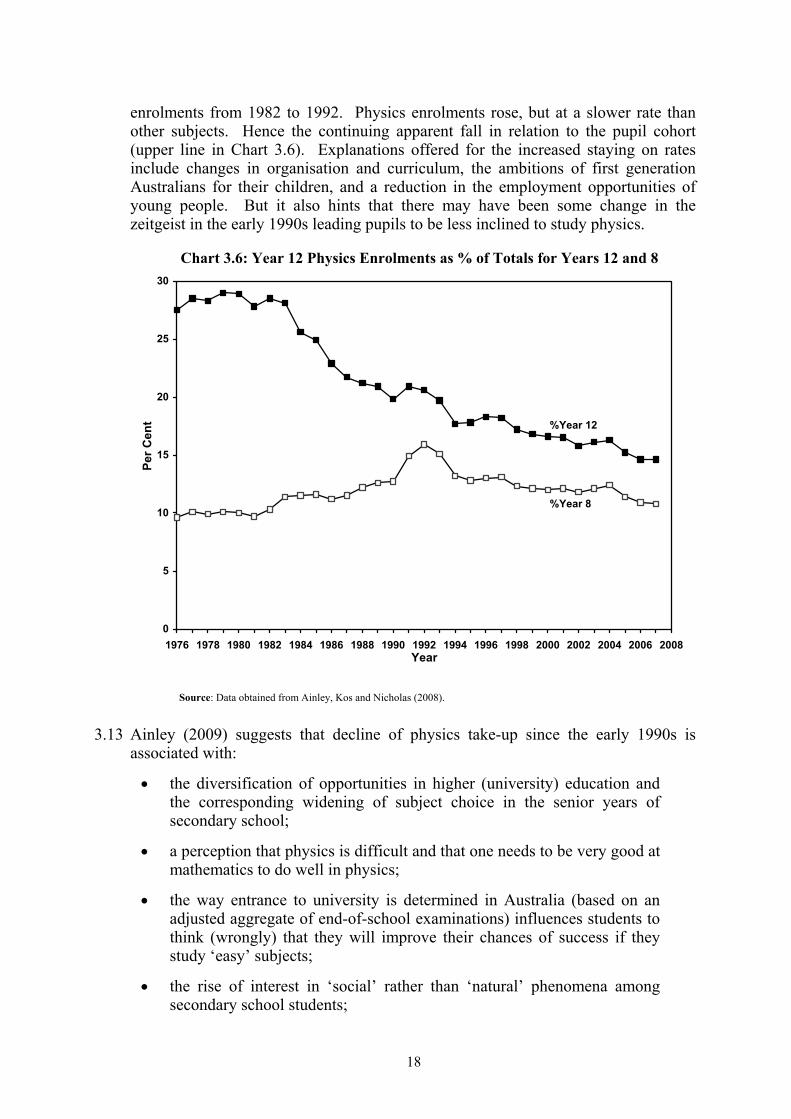
enrolments from 1982 to 1992. Physics enrolments rose, but at a slower rate than other subjects. Hence the continuing apparent fall in relation to the pupil cohort (upper line in Chart 3.6). Explanations offered for the increased staying on rates include changes in organisation and curriculum, the ambitions of first generation Australians for their children, and a reduction in the employment opportunities of young people. But it also hints that there may have been some change in the zeitgeist in the early 1990s leading pupils to be less inclined to study physics.
Chart 3.6: Year 12 Physics Enrolments as % of Totals for Years 12 and 8
0
5
10
15
20
25
30
1976 1978 1980 1982 1984 1986 1988 1990 1992 1994 1996 1998 2000 2002 2004 2006 2008Year
Per C
ent
%Year 8
%Year 12
Source: Data obtained from Ainley, Kos and Nicholas (2008).
3.13 Ainley (2009) suggests that decline of physics take-up since the early 1990s is associated with:
• the diversification of opportunities in higher (university) education and the corresponding widening of subject choice in the senior years of secondary school;
• a perception that physics is difficult and that one needs to be very good at mathematics to do well in physics;
• the way entrance to university is determined in Australia (based on an adjusted aggregate of end-of-school examinations) influences students to think (wrongly) that they will improve their chances of success if they study ‘easy’ subjects;
• the rise of interest in ‘social’ rather than ‘natural’ phenomena among secondary school students;
18
• science (and especially physics) curricula in Australia have been either static (not kept up with advances in the discipline) or have become increasingly ‘fact-oriented’ and closely specified.
Eire 3.14 The equivalent of A-level in Eire is the Leaving Certificate (LC) taken in the last
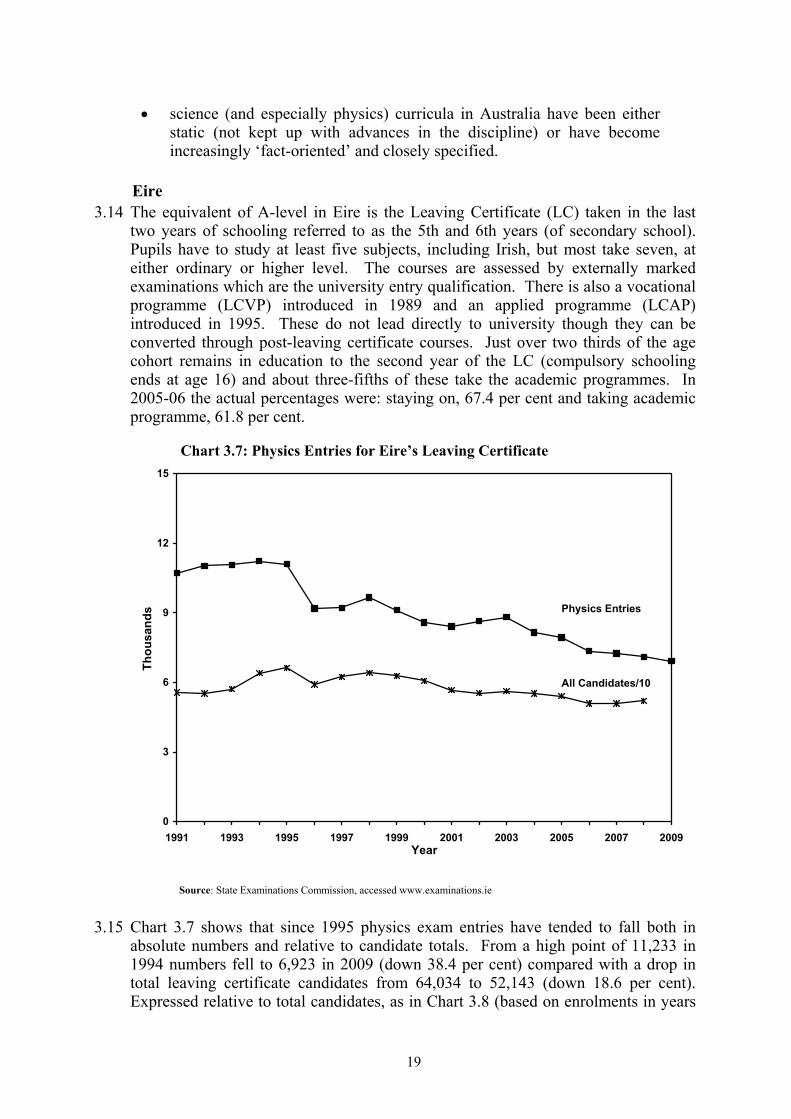
two years of schooling referred to as the 5th and 6th years (of secondary school). Pupils have to study at least five subjects, including Irish, but most take seven, at either ordinary or higher level. The courses are assessed by externally marked examinations which are the university entry qualification. There is also a vocational programme (LCVP) introduced in 1989 and an applied programme (LCAP) introduced in 1995. These do not lead directly to university though they can be converted through post-leaving certificate courses. Just over two thirds of the age cohort remains in education to the second year of the LC (compulsory schooling ends at age 16) and about three-fifths of these take the academic programmes. In 2005-06 the actual percentages were: staying on, 67.4 per cent and taking academic programme, 61.8 per cent.
Chart 3.7: Physics Entries for Eire’s Leaving Certificate
0
3
6
9
12
15
1991 1993 1995 1997 1999 2001 2003 2005 2007 2009Year
Thou
sand
s Physics Entries
All Candidates/10
Source: State Examinations Commission, accessed www.examinations.ie
3.15 Chart 3.7 shows that since 1995 physics exam entries have tended to fall both in absolute numbers and relative to candidate totals. From a high point of 11,233 in 1994 numbers fell to 6,923 in 2009 (down 38.4 per cent) compared with a drop in total leaving certificate candidates from 64,034 to 52,143 (down 18.6 per cent). Expressed relative to total candidates, as in Chart 3.8 (based on enrolments in years
19
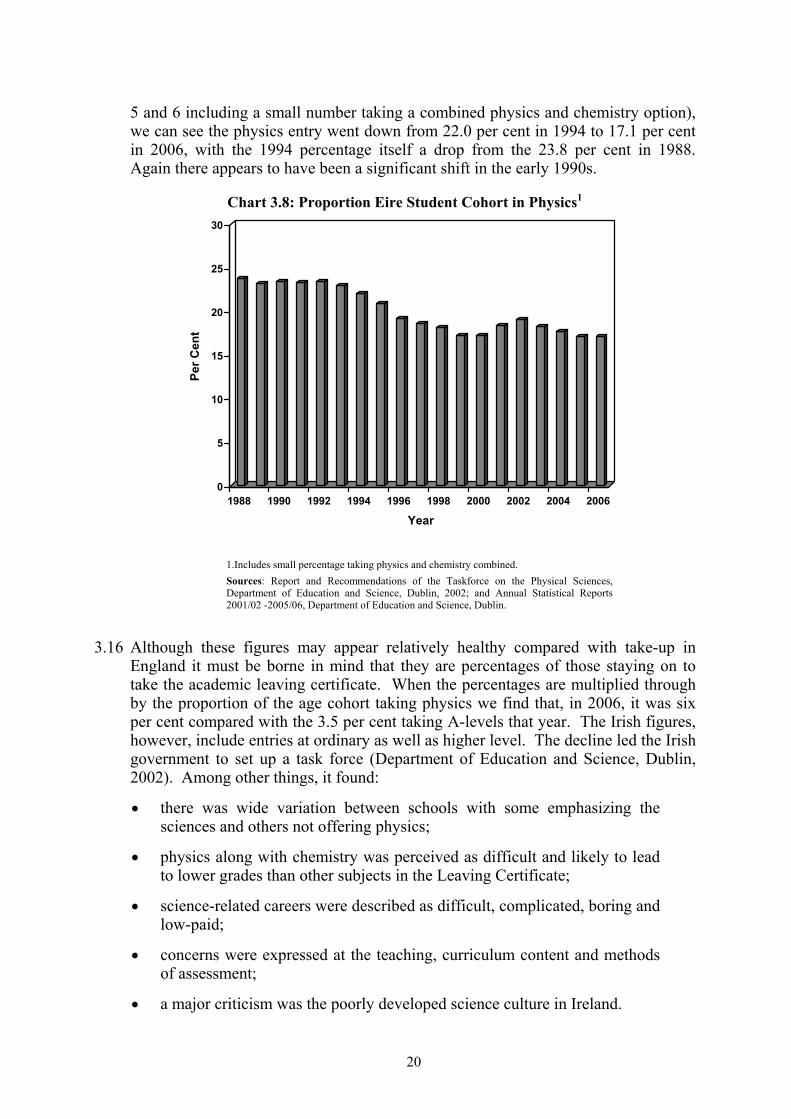
5 and 6 including a small number taking a combined physics and chemistry option), we can see the physics entry went down from 22.0 per cent in 1994 to 17.1 per cent in 2006, with the 1994 percentage itself a drop from the 23.8 per cent in 1988. Again there appears to have been a significant shift in the early 1990s.
Chart 3.8: Proportion Eire Student Cohort in Physics1
0
5
10
15
20
25
30
Per C
ent
1988 1990 1992 1994 1996 1998 2000 2002 2004 2006
Year
1.Includes small percentage taking physics and chemistry combined. Sources: Report and Recommendations of the Taskforce on the Physical Sciences, Department of Education and Science, Dublin, 2002; and Annual Statistical Reports 2001/02 -2005/06, Department of Education and Science, Dublin.
3.16 Although these figures may appear relatively healthy compared with take-up in England it must be borne in mind that they are percentages of those staying on to take the academic leaving certificate. When the percentages are multiplied through by the proportion of the age cohort taking physics we find that, in 2006, it was six per cent compared with the 3.5 per cent taking A-levels that year. The Irish figures, however, include entries at ordinary as well as higher level. The decline led the Irish government to set up a task force (Department of Education and Science, Dublin, 2002). Among other things, it found:
• there was wide variation between schools with some emphasizing the sciences and others not offering physics;
• physics along with chemistry was perceived as difficult and likely to lead to lower grades than other subjects in the Leaving Certificate;
• science-related careers were described as difficult, complicated, boring and low-paid;
• concerns were expressed at the teaching, curriculum content and methods of assessment;
• a major criticism was the poorly developed science culture in Ireland.
20
It concluded that, “no single action will achieve the desired impact on take-up. The problem is multifaceted and consequently too so must be the solution”.
Finland 3.17 Upper secondary schooling in Finland generally lasts three years from age 16 to 19.
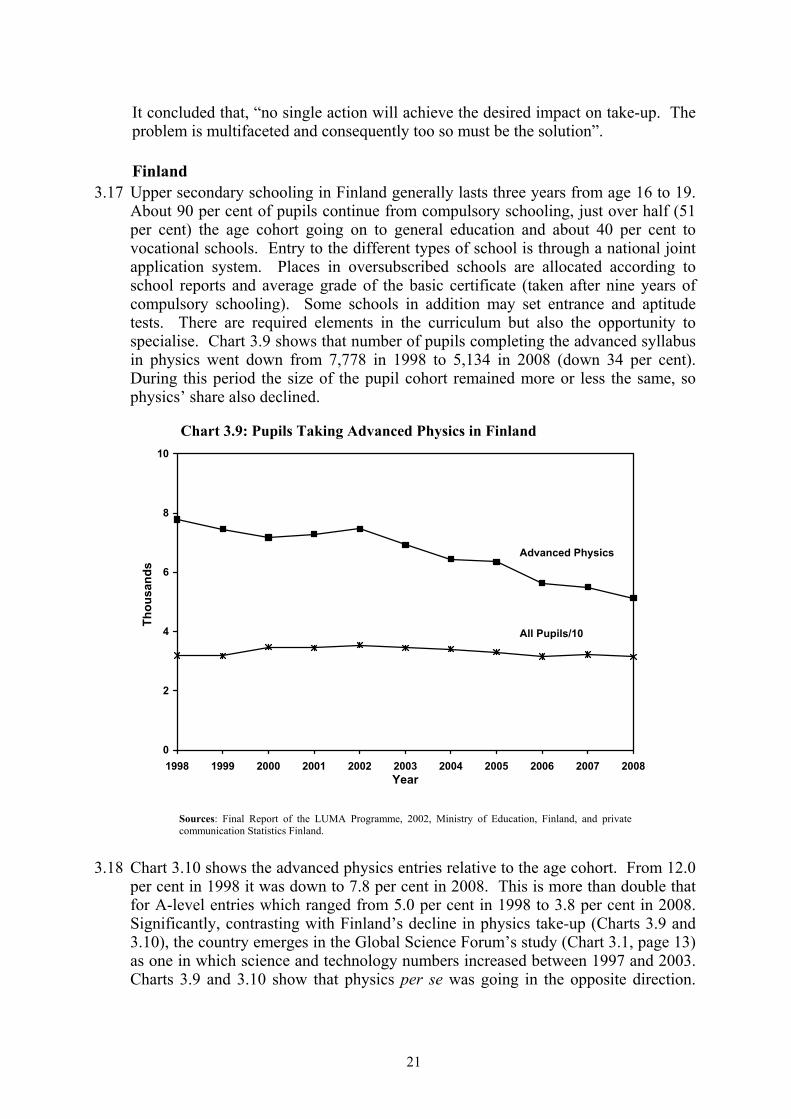
About 90 per cent of pupils continue from compulsory schooling, just over half (51 per cent) the age cohort going on to general education and about 40 per cent to vocational schools. Entry to the different types of school is through a national joint application system. Places in oversubscribed schools are allocated according to school reports and average grade of the basic certificate (taken after nine years of compulsory schooling). Some schools in addition may set entrance and aptitude tests. There are required elements in the curriculum but also the opportunity to specialise. Chart 3.9 shows that number of pupils completing the advanced syllabus in physics went down from 7,778 in 1998 to 5,134 in 2008 (down 34 per cent). During this period the size of the pupil cohort remained more or less the same, so physics’ share also declined.
Chart 3.9: Pupils Taking Advanced Physics in Finland
0
2
4
6
8
10
1998 1999 2000 2001 2002 2003 2004 2005 2006 2007 2008Year
Thou
sand
s
Advanced Physics
All Pupils/10
Sources: Final Report of the LUMA Programme, 2002, Ministry of Education, Finland, and private communication Statistics Finland.
3.18 Chart 3.10 shows the advanced physics entries relative to the age cohort. From 12.0 per cent in 1998 it was down to 7.8 per cent in 2008. This is more than double that for A-level entries which ranged from 5.0 per cent in 1998 to 3.8 per cent in 2008. Significantly, contrasting with Finland’s decline in physics take-up (Charts 3.9 and 3.10), the country emerges in the Global Science Forum’s study (Chart 3.1, page 13) as one in which science and technology numbers increased between 1997 and 2003. Charts 3.9 and 3.10 show that physics per se was going in the opposite direction.
21
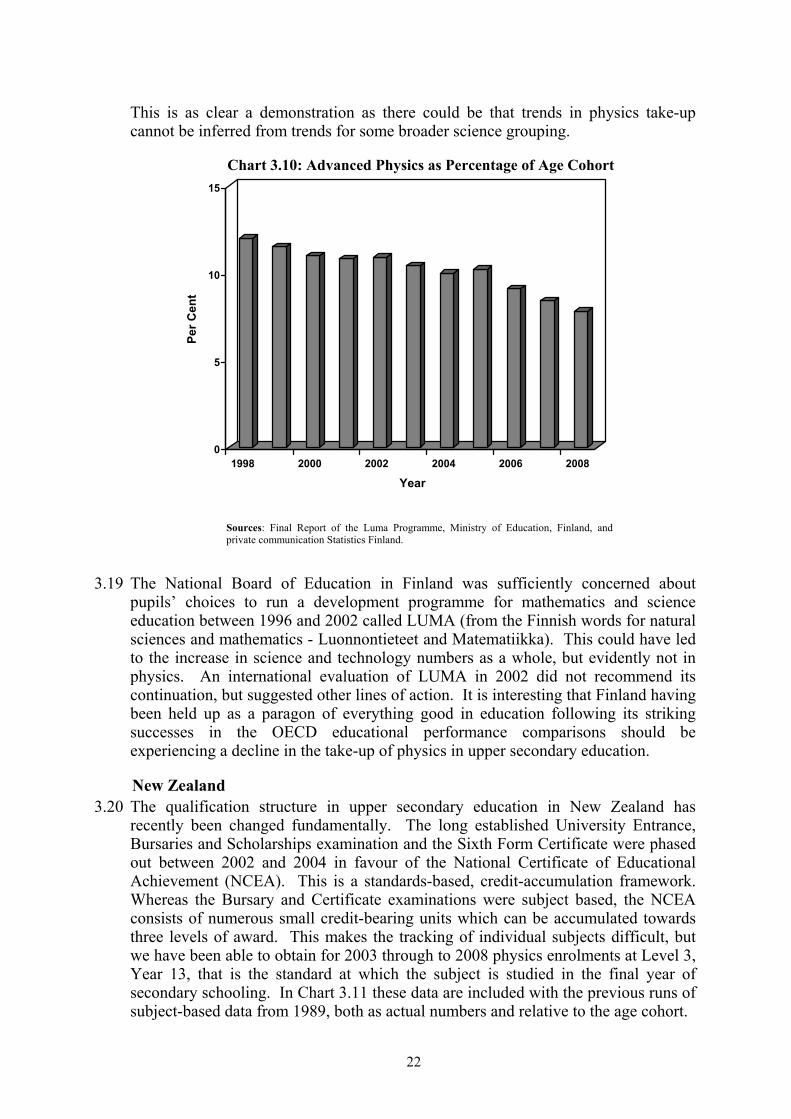
This is as clear a demonstration as there could be that trends in physics take-up cannot be inferred from trends for some broader science grouping.
Chart 3.10: Advanced Physics as Percentage of Age Cohort
0
5
10
15Pe
r Cen
t
1998 2000 2002 2004 2006 2008
Year
Sources: Final Report of the Luma Programme, Ministry of Education, Finland, and private communication Statistics Finland.
3.19 The National Board of Education in Finland was sufficiently concerned about pupils’ choices to run a development programme for mathematics and science education between 1996 and 2002 called LUMA (from the Finnish words for natural sciences and mathematics - Luonnontieteet and Matematiikka). This could have led to the increase in science and technology numbers as a whole, but evidently not in physics. An international evaluation of LUMA in 2002 did not recommend its continuation, but suggested other lines of action. It is interesting that Finland having been held up as a paragon of everything good in education following its striking successes in the OECD educational performance comparisons should be experiencing a decline in the take-up of physics in upper secondary education.
New Zealand 3.20 The qualification structure in upper secondary education in New Zealand has
recently been changed fundamentally. The long established University Entrance, Bursaries and Scholarships examination and the Sixth Form Certificate were phased out between 2002 and 2004 in favour of the National Certificate of Educational Achievement (NCEA). This is a standards-based, credit-accumulation framework. Whereas the Bursary and Certificate examinations were subject based, the NCEA consists of numerous small credit-bearing units which can be accumulated towards three levels of award. This makes the tracking of individual subjects difficult, but we have been able to obtain for 2003 through to 2008 physics enrolments at Level 3, Year 13, that is the standard at which the subject is studied in the final year of secondary schooling. In Chart 3.11 these data are included with the previous runs of subject-based data from 1989, both as actual numbers and relative to the age cohort.
22

Chart 3.11: School Final Year Physics Enrolments1 New Zealand
0
5
10
15
20
1989 1991 1993 1995 1997 1999 2001 2003 2005 2007 2009Year
Thou
sand
s/Pe
r Cen
t
Per Cent Age Cohort
Actual Enrolments
1. 1989-1995 pupils in Form 7, 1996-2002, pupils in Year 13+, 2003-2008 pupils in National Certificate of Educational Achievement studying physics at Level 3, the standard of year 13. Source: New Zealand Ministry of Education website at www. Education counts.gov.nz.; national population estimates by age at 30 June, www.stats.gov.govt.nz.
3.21 Before the reforms, physics participation in New Zealand had increased year-by-year, rising by over 40 per cent from 1989 to 2002. There was no great increase in the age cohort during this period so the growth was not driven by demography. Since the NCEA was introduced, however, physics numbers have fallen. This occurred in the first two years and since 2005 there has been some recovery. But since 2000 the population of 18-year-olds has gone up by a fifth, so relative to the age cohort, as shown by the upper line in Chart 3.11, the fall is even sharper.
3.22 Chart 3.12 puts the NCEA data on a pupil cohort basis. Since the NCEA has greatly extended the range of possible studies more young people are staying on at school emphasizing physics’ relative decline. Nevertheless, as proportions of the pupil and age cohorts, physics take-up in New Zealand remains very strong with in 2008 nearly a fifth of Year 13 taking, or having taken, some physics to A-level standard. This continues through to university where with a population about a fifteenth of that of the UK (around 4 million compared with 61 million), New Zealand has about half the number of domestic university physics students (4,200 against 8,600).
3.23 New Zealand was one of the more difficult countries to classify. Physics at A-level standard showed continuous growth from 1989 to 2002 and the subsequent dip could be due to teething problems with the NCEA or the technical difficulty of counting a single subject among the vast array of unit options. Nevertheless, in the most recent figures physics participation does seem to be falling on all three measures. New Zealand does not seem to have experienced the decline in physics take up in upper secondary in the early 1990s as England and other countries we have considered did. But it finds itself among the physics fallers because of a change in the structure of
23
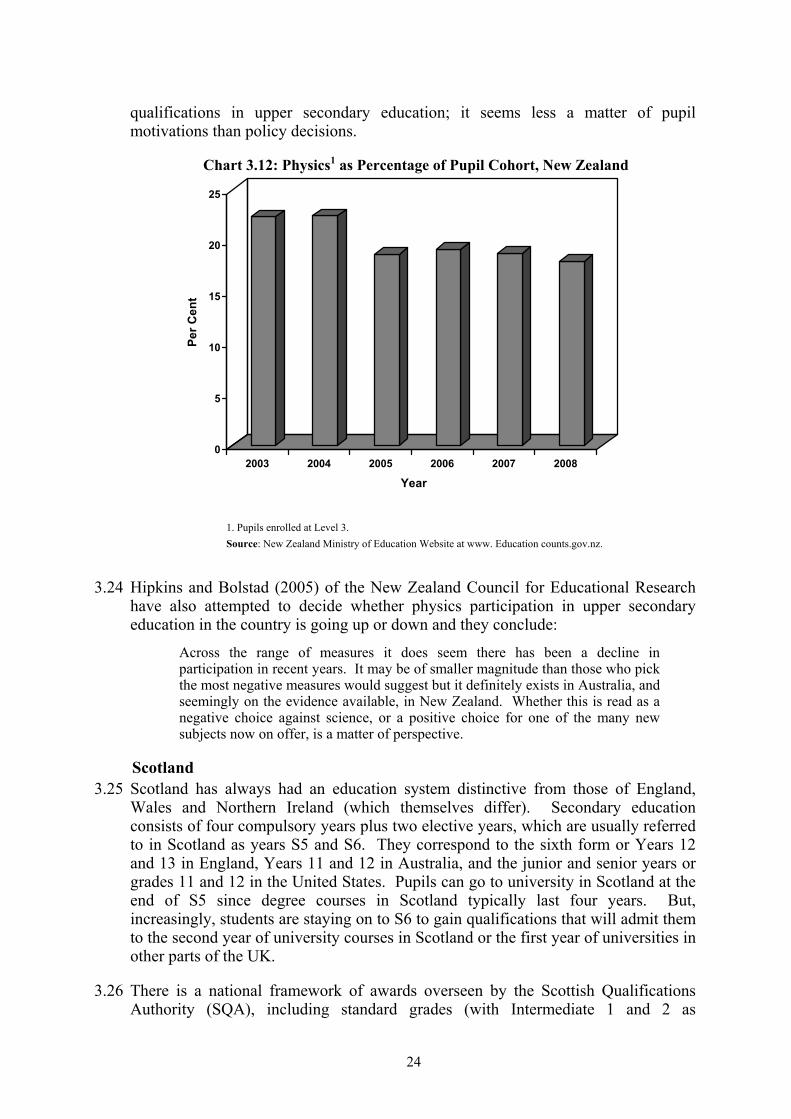
qualifications in upper secondary education; it seems less a matter of pupil motivations than policy decisions.
Chart 3.12: Physics1 as Percentage of Pupil Cohort, New Zealand
0
5
10
15
20
25Pe
r Cen
t
2003 2004 2005 2006 2007 2008
Year
1. Pupils enrolled at Level 3. Source: New Zealand Ministry of Education Website at www. Education counts.gov.nz.
3.24 Hipkins and Bolstad (2005) of the New Zealand Council for Educational Research have also attempted to decide whether physics participation in upper secondary education in the country is going up or down and they conclude:
Across the range of measures it does seem there has been a decline in participation in recent years. It may be of smaller magnitude than those who pick the most negative measures would suggest but it definitely exists in Australia, and seemingly on the evidence available, in New Zealand. Whether this is read as a negative choice against science, or a positive choice for one of the many new subjects now on offer, is a matter of perspective.
Scotland 3.25 Scotland has always had an education system distinctive from those of England,
Wales and Northern Ireland (which themselves differ). Secondary education consists of four compulsory years plus two elective years, which are usually referred to in Scotland as years S5 and S6. They correspond to the sixth form or Years 12 and 13 in England, Years 11 and 12 in Australia, and the junior and senior years or grades 11 and 12 in the United States. Pupils can go to university in Scotland at the end of S5 since degree courses in Scotland typically last four years. But, increasingly, students are staying on to S6 to gain qualifications that will admit them to the second year of university courses in Scotland or the first year of universities in other parts of the UK.
3.26 There is a national framework of awards overseen by the Scottish Qualifications Authority (SQA), including standard grades (with Intermediate 1 and 2 as
24

alternatives) taken in S4, highers in S5 and S6, and advanced highers in S6. Typically students take eight or nine standard grades and five or six highers. In terms of England’s qualifications, highers come between GCSEs and A-levels, with AS-levels as the nearest equivalent. The current system of qualifications has operated in Scotland since 1999 (first results in 2000) when the higher was re-constituted and the old Certificate of Sixth Year Study (CSYS) was replaced by the advanced higher. These changes were brought about by the same thinking that prompted the introduction of the NCEA in New Zealand (Smithers, 1997b, 2000).
Chart 3.13: Physics Entries1 for Scottish Highers and Advanced Highers
0
3
6
9
12
15
1986 1988 1990 1992 1994 1996 1998 2000 2002 2004 2006 2008 2010Year
Thou
sand
s
Physics Advanced Higher
Physics Highers
Certificate of Sixth Year Studies
17-yr-olds/10
1.No data published for the year 2000 in the transition from the Certificate of Sixth Year Studies to the Advanced Higher. Sources: Scottish Qualifications Authority online statistics; population data from General Register Office for Scotland online statistics.
3.27 Chart 3.13 shows the trends in physics entries in highers (old and new) and the CSYS and advanced higher over the 23 years since 1986, set against the population of 17-year-olds. Again, since the early 1990s physics take-up has tended to go down year by year. At first this was under the old qualifications structure, but as in New Zealand the decline has been exacerbated as the new structure came into effect. Leaving aside the first year of results, 2000, which is atypical, physics highers have declined from 10,015 in 2001 to 9,001 in 2009 (down 10.1 per cent). Over the same period, there has been some rise in physics advanced highers - from 1,026 in 2001 to 1,550 in 2009 - but not enough to compensate.
3.28 Overall the percentage of the 17-year-old population sitting highers in physics has gone down from 15.1 in 1986 to 13.6 in 2009. This, however, is considerably more than the 3.9 per cent A-level physics entries in 2009 in England. Even if we make the more realistic comparison with England’s AS-level it stands up well against the 5.6 per cent. But if we base the comparison on advanced highers then the picture
25
looks less rosy with an uptake of only 2.1 per cent. This compares with the 3.9 per cent in England and 3.1 per cent in the United States.
United States 3.29 There has long been concern in the United States about student participation and
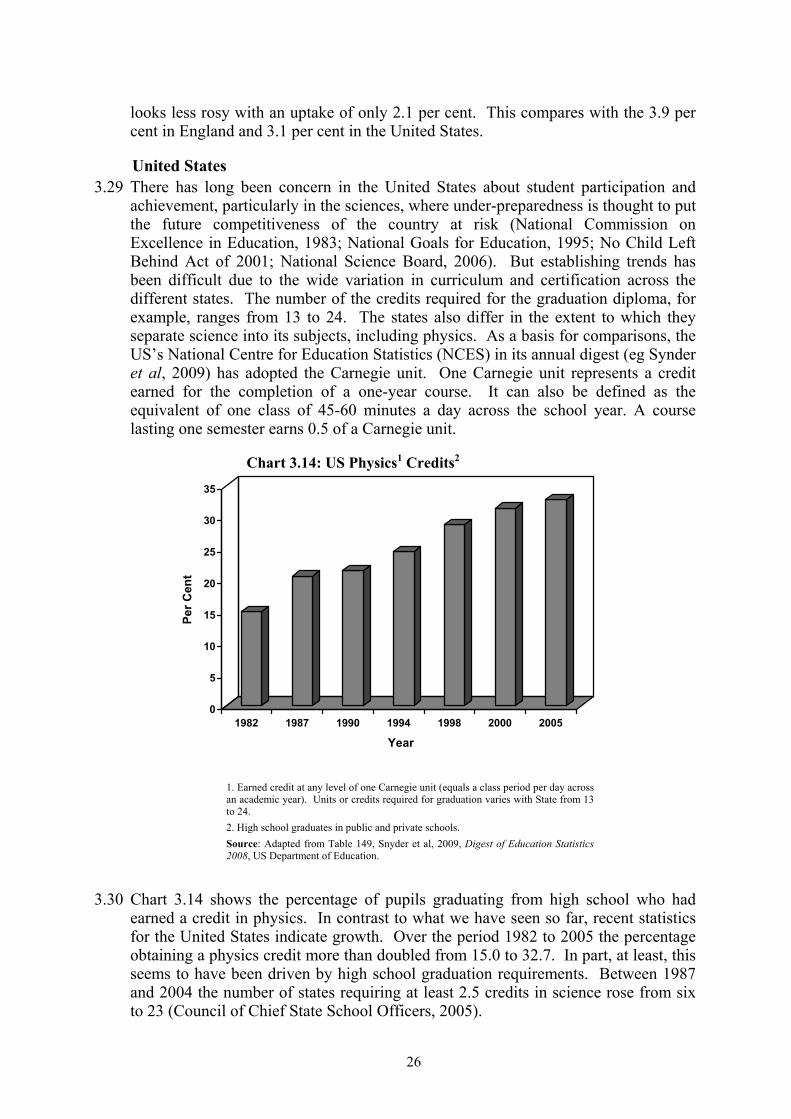
achievement, particularly in the sciences, where under-preparedness is thought to put the future competitiveness of the country at risk (National Commission on Excellence in Education, 1983; National Goals for Education, 1995; No Child Left Behind Act of 2001; National Science Board, 2006). But establishing trends has been difficult due to the wide variation in curriculum and certification across the different states. The number of the credits required for the graduation diploma, for example, ranges from 13 to 24. The states also differ in the extent to which they separate science into its subjects, including physics. As a basis for comparisons, the US’s National Centre for Education Statistics (NCES) in its annual digest (eg Synder et al, 2009) has adopted the Carnegie unit. One Carnegie unit represents a credit earned for the completion of a one-year course. It can also be defined as the equivalent of one class of 45-60 minutes a day across the school year. A course lasting one semester earns 0.5 of a Carnegie unit.
Chart 3.14: US Physics1 Credits2
0
5
10
15
20
25
30
35
Per C
ent
1982 1987 1990 1994 1998 2000 2005
Year
1. Earned credit at any level of one Carnegie unit (equals a class period per day across an academic year). Units or credits required for graduation varies with State from 13 to 24. 2. High school graduates in public and private schools. Source: Adapted from Table 149, Snyder et al, 2009, Digest of Education Statistics 2008, US Department of Education.
3.30 Chart 3.14 shows the percentage of pupils graduating from high school who had earned a credit in physics. In contrast to what we have seen so far, recent statistics for the United States indicate growth. Over the period 1982 to 2005 the percentage obtaining a physics credit more than doubled from 15.0 to 32.7. In part, at least, this seems to have been driven by high school graduation requirements. Between 1987 and 2004 the number of states requiring at least 2.5 credits in science rose from six to 23 (Council of Chief State School Officers, 2005).
26
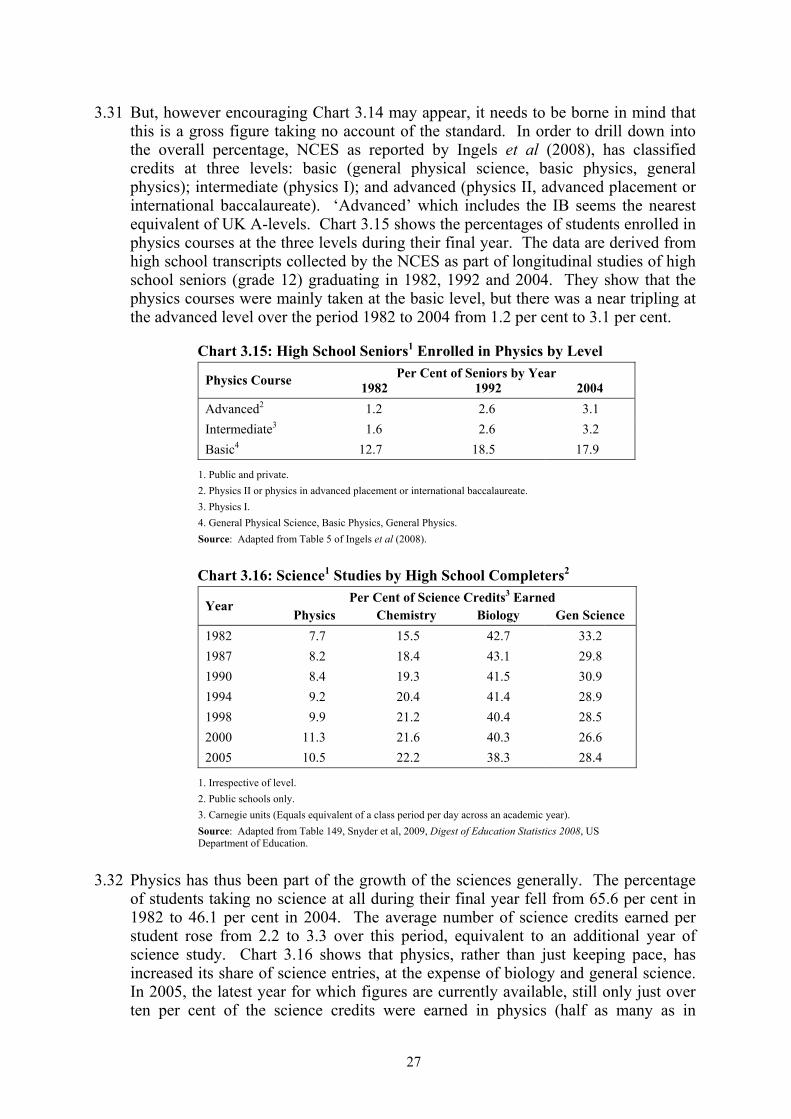
3.31 But, however encouraging Chart 3.14 may appear, it needs to be borne in mind that this is a gross figure taking no account of the standard. In order to drill down into the overall percentage, NCES as reported by Ingels et al (2008), has classified credits at three levels: basic (general physical science, basic physics, general physics); intermediate (physics I); and advanced (physics II, advanced placement or international baccalaureate). ‘Advanced’ which includes the IB seems the nearest equivalent of UK A-levels. Chart 3.15 shows the percentages of students enrolled in physics courses at the three levels during their final year. The data are derived from high school transcripts collected by the NCES as part of longitudinal studies of high school seniors (grade 12) graduating in 1982, 1992 and 2004. They show that the physics courses were mainly taken at the basic level, but there was a near tripling at the advanced level over the period 1982 to 2004 from 1.2 per cent to 3.1 per cent.
Chart 3.15: High School Seniors1 Enrolled in Physics by Level
Per Cent of Seniors by Year Physics Course 1982 1992 2004 Advanced2 1.2 2.6 3.1 Intermediate3 1.6 2.6 3.2 Basic4 12.7 18.5 17.9
1. Public and private. 2. Physics II or physics in advanced placement or international baccalaureate. 3. Physics I. 4. General Physical Science, Basic Physics, General Physics. Source: Adapted from Table 5 of Ingels et al (2008).
Chart 3.16: Science1 Studies by High School Completers2 Per Cent of Science Credits3 Earned Year
Physics Chemistry Biology Gen Science 1982 7.7 15.5 42.7 33.2 1987 8.2 18.4 43.1 29.8 1990 8.4 19.3 41.5 30.9 1994 9.2 20.4 41.4 28.9 1998 9.9 21.2 40.4 28.5 2000 11.3 21.6 40.3 26.6 2005 10.5 22.2 38.3 28.4
1. Irrespective of level. 2. Public schools only. 3. Carnegie units (Equals equivalent of a class period per day across an academic year). Source: Adapted from Table 149, Snyder et al, 2009, Digest of Education Statistics 2008, US Department of Education.
3.32 Physics has thus been part of the growth of the sciences generally. The percentage of students taking no science at all during their final year fell from 65.6 per cent in 1982 to 46.1 per cent in 2004. The average number of science credits earned per student rose from 2.2 to 3.3 over this period, equivalent to an additional year of science study. Chart 3.16 shows that physics, rather than just keeping pace, has increased its share of science entries, at the expense of biology and general science. In 2005, the latest year for which figures are currently available, still only just over ten per cent of the science credits were earned in physics (half as many as in
27
chemistry and a third of those in biology), but this is almost half as many again as in 1982.
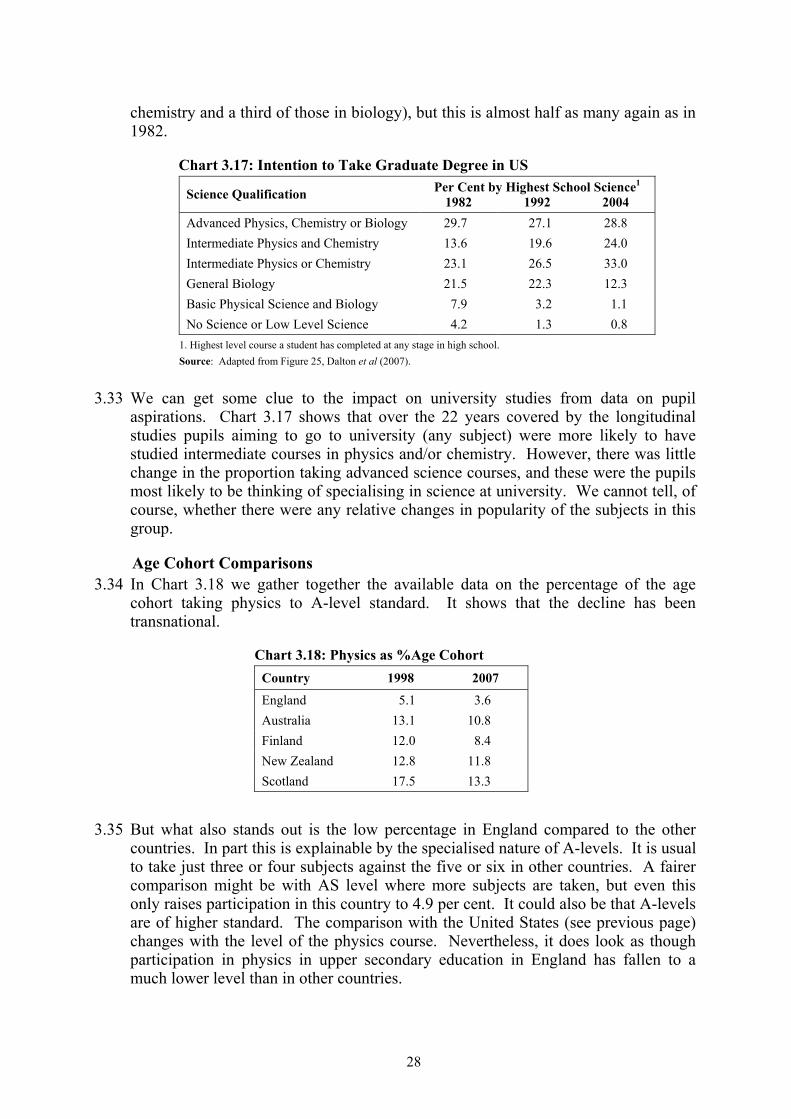
Chart 3.17: Intention to Take Graduate Degree in US
Per Cent by Highest School Science1 Science Qualification 1982 1992 2004 Advanced Physics, Chemistry or Biology 29.7 27.1 28.8 Intermediate Physics and Chemistry 13.6 19.6 24.0 Intermediate Physics or Chemistry 23.1 26.5 33.0 General Biology 21.5 22.3 12.3 Basic Physical Science and Biology 7.9 3.2 1.1 No Science or Low Level Science 4.2 1.3 0.8
1. Highest level course a student has completed at any stage in high school. Source: Adapted from Figure 25, Dalton et al (2007).
3.33 We can get some clue to the impact on university studies from data on pupil aspirations. Chart 3.17 shows that over the 22 years covered by the longitudinal studies pupils aiming to go to university (any subject) were more likely to have studied intermediate courses in physics and/or chemistry. However, there was little change in the proportion taking advanced science courses, and these were the pupils most likely to be thinking of specialising in science at university. We cannot tell, of course, whether there were any relative changes in popularity of the subjects in this group.
Age Cohort Comparisons 3.34 In Chart 3.18 we gather together the available data on the percentage of the age
cohort taking physics to A-level standard. It shows that the decline has been transnational.
Chart 3.18: Physics as %Age Cohort Country 1998 2007
England 5.1 3.6 Australia 13.1 10.8 Finland 12.0 8.4 New Zealand 12.8 11.8 Scotland 17.5 13.3
3.35 But what also stands out is the low percentage in England compared to the other countries. In part this is explainable by the specialised nature of A-levels. It is usual to take just three or four subjects against the five or six in other countries. A fairer comparison might be with AS level where more subjects are taken, but even this only raises participation in this country to 4.9 per cent. It could also be that A-levels are of higher standard. The comparison with the United States (see previous page) changes with the level of the physics course. Nevertheless, it does look as though participation in physics in upper secondary education in England has fallen to a much lower level than in other countries.
28
Résumé 3.36 Our apparently simple question about how does physics participation in England
compare with that in other countries is, in fact, far from simple. The Global Science Forum in looking at ‘science and technology orientation’ at the A-level stage found consistent runs of data hard to come by, fluctuations and variations from year to year, and differences according to the metric used. Nevertheless, taking science and technology numbers as a whole, between 1997 and 2003 three countries - Israel, Germany and Finland - showed substantial increases while six reported falls, the major decreases being in Korea, Norway and Belgium Flanders.
3.37 Our extensive searches yielded six countries in which physics take-up was both identifiable (it is often taken as part of a larger science grouping) and had been recorded over a run of years. In five - Australia, Eire, Finland, New Zealand and Scotland - the recent trend has been downwards, and only in the United States were numbers increasing. Trends in physics cannot be inferred from changes in the sciences and technology generally. The OECD (2008b) reported, for example, that numbers in the broader category were rising at a time when we found physics take-up to be falling. Age cohort comparisons indicate that less than half the pupils take physics at A-level than take the equivalent qualification in other countries where physics is identifiable. This could because A-levels are of higher standard, that pupils chose fewer subjects or that there is even less interest in physics in this country than elsewhere.
3.38 Some of the changes in direction in physics take-up could be traced to changes in educational requirements or organisation. The increase in physics take-up in the United States seems to be associated with extra science credits necessary for high school graduation. The recent drop in New Zealand seems connected with the switch from an A-level-type examination to a credit accumulation framework, the National Certificate of Educational Achievement. Intriguingly, however, Australia, Eire, Finland and Scotland, like England, tipped from growth to decline in the early 1990’s raising the possibility that there was something in the zeitgeist leading pupils to turn away from physics to other subjects.
29
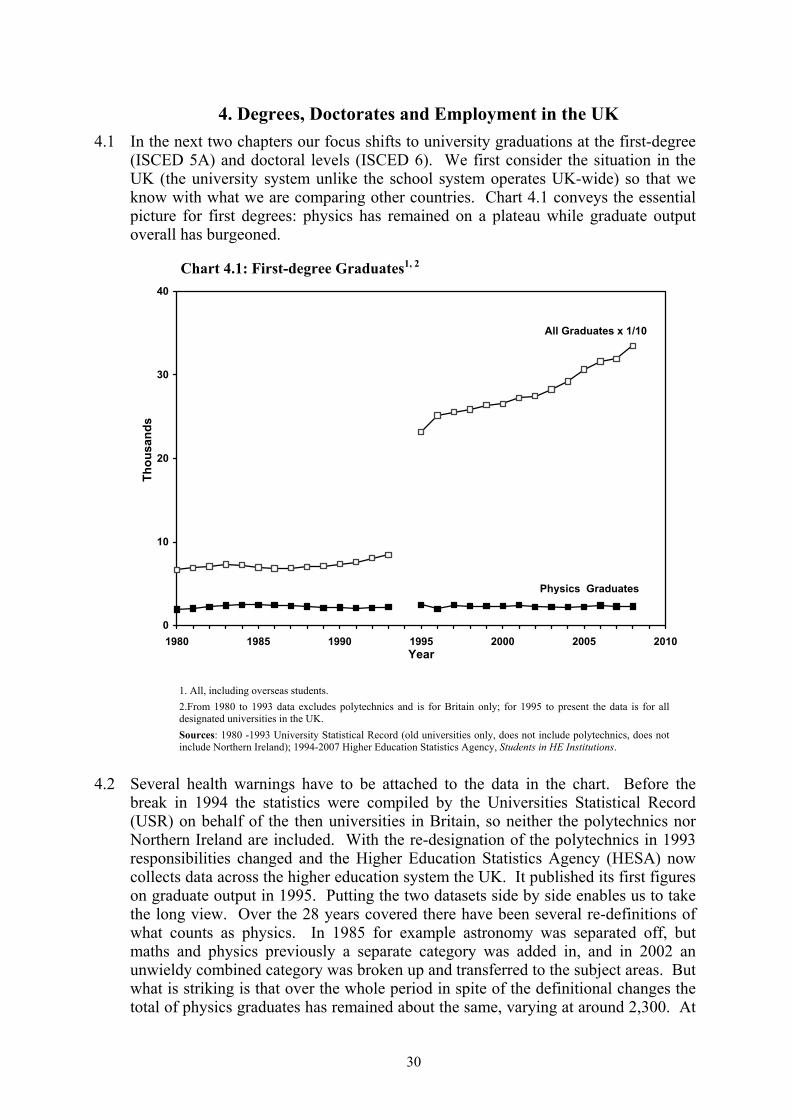
4. Degrees, Doctorates and Employment in the UK 4.1 In the next two chapters our focus shifts to university graduations at the first-degree
(ISCED 5A) and doctoral levels (ISCED 6). We first consider the situation in the UK (the university system unlike the school system operates UK-wide) so that we know with what we are comparing other countries. Chart 4.1 conveys the essential picture for first degrees: physics has remained on a plateau while graduate output overall has burgeoned.
Chart 4.1: First-degree Graduates1, 2
0
10
20
30
40
1980 1985 1990 1995 2000 2005 2010Year
Thou
sand
s
Physics Graduates
All Graduates x 1/10
1. All, including overseas students. 2.From 1980 to 1993 data excludes polytechnics and is for Britain only; for 1995 to present the data is for all designated universities in the UK. Sources: 1980 -1993 University Statistical Record (old universities only, does not include polytechnics, does not include Northern Ireland); 1994-2007 Higher Education Statistics Agency, Students in HE Institutions.
4.2 Several health warnings have to be attached to the data in the chart. Before the break in 1994 the statistics were compiled by the Universities Statistical Record (USR) on behalf of the then universities in Britain, so neither the polytechnics nor Northern Ireland are included. With the re-designation of the polytechnics in 1993 responsibilities changed and the Higher Education Statistics Agency (HESA) now collects data across the higher education system the UK. It published its first figures on graduate output in 1995. Putting the two datasets side by side enables us to take the long view. Over the 28 years covered there have been several re-definitions of what counts as physics. In 1985 for example astronomy was separated off, but maths and physics previously a separate category was added in, and in 2002 an unwieldy combined category was broken up and transferred to the subject areas. But what is striking is that over the whole period in spite of the definitional changes the total of physics graduates has remained about the same, varying at around 2,300. At
30
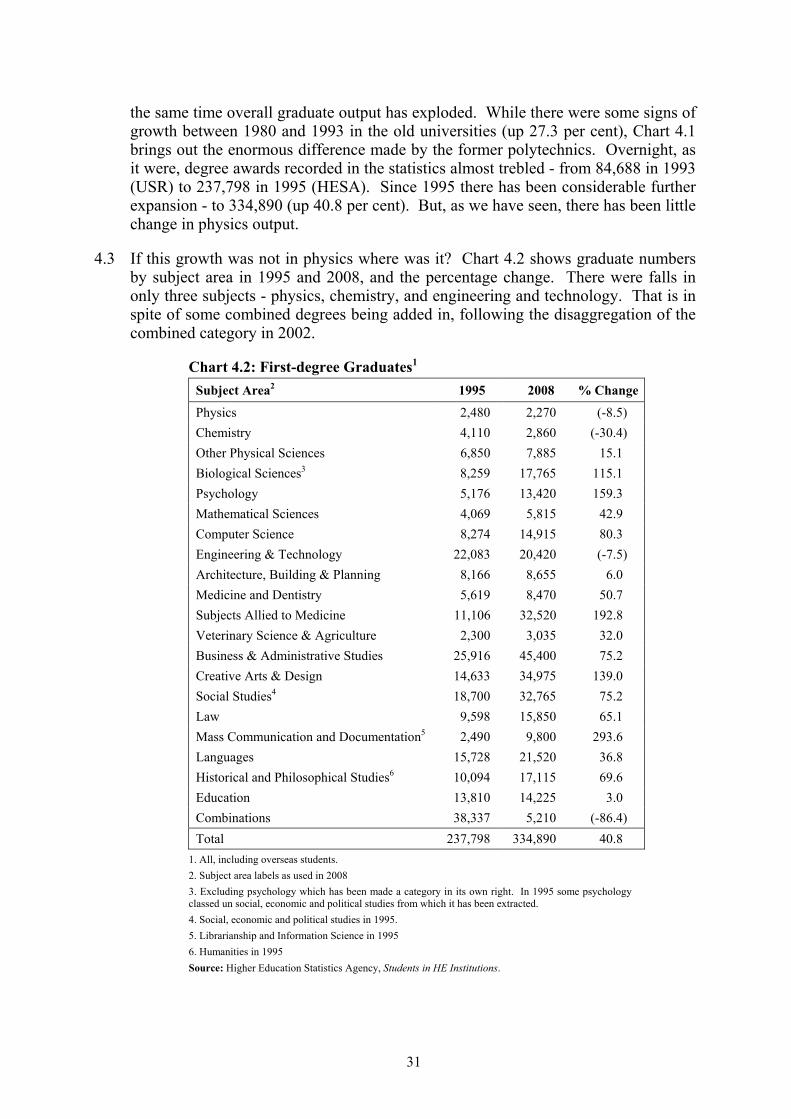
the same time overall graduate output has exploded. While there were some signs of growth between 1980 and 1993 in the old universities (up 27.3 per cent), Chart 4.1 brings out the enormous difference made by the former polytechnics. Overnight, as it were, degree awards recorded in the statistics almost trebled - from 84,688 in 1993 (USR) to 237,798 in 1995 (HESA). Since 1995 there has been considerable further expansion - to 334,890 (up 40.8 per cent). But, as we have seen, there has been little change in physics output.
4.3 If this growth was not in physics where was it? Chart 4.2 shows graduate numbers by subject area in 1995 and 2008, and the percentage change. There were falls in only three subjects - physics, chemistry, and engineering and technology. That is in spite of some combined degrees being added in, following the disaggregation of the combined category in 2002.
Chart 4.2: First-degree Graduates1 Subject Area2 1995 2008 % Change
Physics 2,480 2,270 (-8.5) Chemistry 4,110 2,860 (-30.4) Other Physical Sciences 6,850 7,885 15.1 Biological Sciences3 8,259 17,765 115.1 Psychology 5,176 13,420 159.3 Mathematical Sciences 4,069 5,815 42.9 Computer Science 8,274 14,915 80.3 Engineering & Technology 22,083 20,420 (-7.5) Architecture, Building & Planning 8,166 8,655 6.0 Medicine and Dentistry 5,619 8,470 50.7 Subjects Allied to Medicine 11,106 32,520 192.8 Veterinary Science & Agriculture 2,300 3,035 32.0 Business & Administrative Studies 25,916 45,400 75.2 Creative Arts & Design 14,633 34,975 139.0 Social Studies4 18,700 32,765 75.2 Law 9,598 15,850 65.1 Mass Communication and Documentation5 2,490 9,800 293.6 Languages 15,728 21,520 36.8 Historical and Philosophical Studies6 10,094 17,115 69.6 Education 13,810 14,225 3.0 Combinations 38,337 5,210 (-86.4) Total 237,798 334,890 40.8
1. All, including overseas students. 2. Subject area labels as used in 2008 3. Excluding psychology which has been made a category in its own right. In 1995 some psychology classed un social, economic and political studies from which it has been extracted. 4. Social, economic and political studies in 1995. 5. Librarianship and Information Science in 1995 6. Humanities in 1995 Source: Higher Education Statistics Agency, Students in HE Institutions.
31
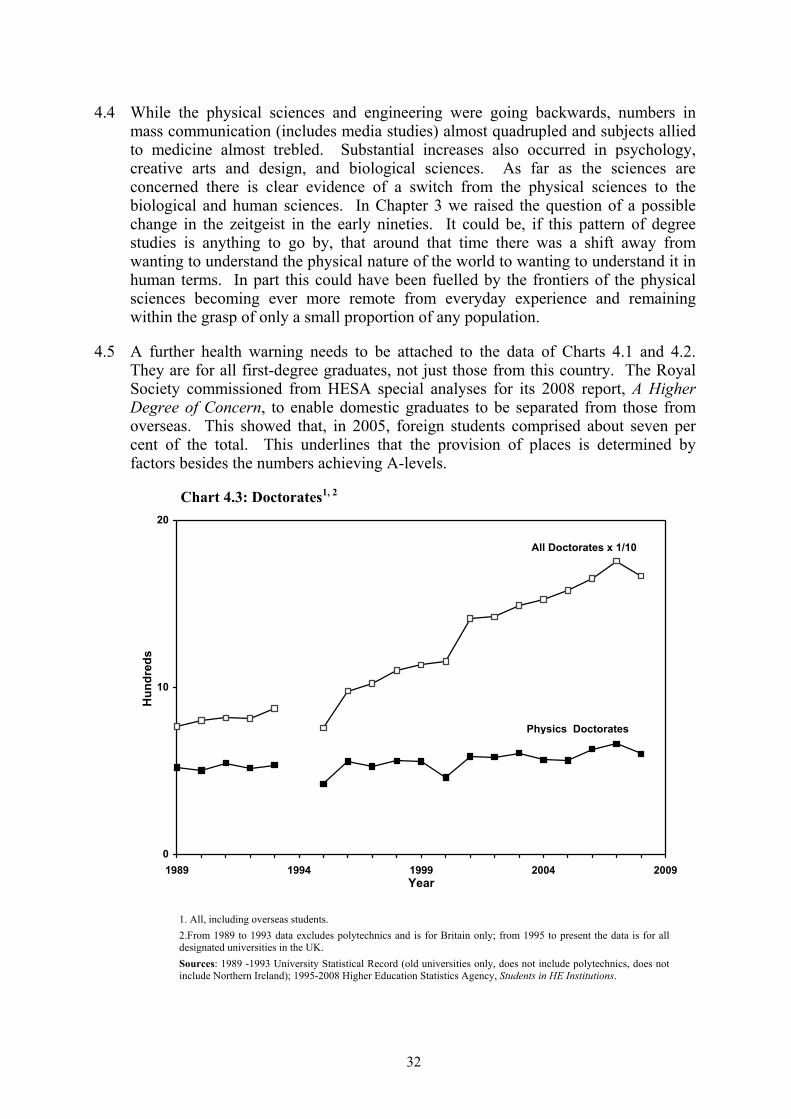
4.4 While the physical sciences and engineering were going backwards, numbers in mass communication (includes media studies) almost quadrupled and subjects allied to medicine almost trebled. Substantial increases also occurred in psychology, creative arts and design, and biological sciences. As far as the sciences are concerned there is clear evidence of a switch from the physical sciences to the biological and human sciences. In Chapter 3 we raised the question of a possible change in the zeitgeist in the early nineties. It could be, if this pattern of degree studies is anything to go by, that around that time there was a shift away from wanting to understand the physical nature of the world to wanting to understand it in human terms. In part this could have been fuelled by the frontiers of the physical sciences becoming ever more remote from everyday experience and remaining within the grasp of only a small proportion of any population.
4.5 A further health warning needs to be attached to the data of Charts 4.1 and 4.2. They are for all first-degree graduates, not just those from this country. The Royal Society commissioned from HESA special analyses for its 2008 report, A Higher Degree of Concern, to enable domestic graduates to be separated from those from overseas. This showed that, in 2005, foreign students comprised about seven per cent of the total. This underlines that the provision of places is determined by factors besides the numbers achieving A-levels.
Chart 4.3: Doctorates1, 2
0
10
20
1989 1994 1999 2004 2009Year
Hun
dred
s
Physics Doctorates
All Doctorates x 1/10
1. All, including overseas students. 2.From 1989 to 1993 data excludes polytechnics and is for Britain only; from 1995 to present the data is for all designated universities in the UK. Sources: 1989 -1993 University Statistical Record (old universities only, does not include polytechnics, does not include Northern Ireland); 1995-2008 Higher Education Statistics Agency, Students in HE Institutions.
32
4.6 Foreign students are even more important to doctoral research and output. The same Royal Society figures show that of the 560 PhDs awarded in physics in 2004-05, 190 were to students from abroad. Chart 4.3 shows doctorates conferred in physics and in all subjects since 1988-89. As with first degrees there is a striking contrast. The output of physics PhDs has remained much the same, with the elevation of the polytechnics making little difference. But PhD output overall has more than doubled. The ratio of first degree to doctoral places in physics has also remained much the same, at 4 to 1, over the twenty years. Again the number of places looks to be set by factors other than the availability of suitably qualified applicants.
4.7 One important factor is the demand for the graduates in the various fields of study. We can glimpse what this might be from the unemployment and salary statistics. Chart 4.4 shows the first destinations of first-degree graduates in 2003 and 2008 which is the length of the data run available keeping the subject definitions constant. Over the six years the pattern is stable. Just over half the total first-degree graduates enter full-time paid employment, just under a quarter undertake further study and training, and rather less than 10 per cent are unemployed and seeking work. There were, however, big differences with field of study.
4.8 The lowest unemployment percentages, signalling the highest demand, are in applied fields. In 2008, unemployment in medicine and dentistry was only 0.2 per cent, as it had been in 2003. Next lowest were education (3.2 per cent), subjects allied to medicine (4.4 per cent) and law (5.6 per cent). At the other end of the spectrum were computer science (14.6 per cent), creative arts and design (12.2 per cent) and mass communication and documentation, the group containing media studies (12.0 per cent). Rather surprisingly in view of the widespread feeling that there is a shortage of physics graduates, the unemployment level in both 2003 and 2008 was towards the upper end.
4.9 Physics is distinctive in what students do on completion. Chart 4.4 shows that in 2008 only a third of the graduates went into employment. In this it was at the bottom just above law (28 per cent). The reason that direct entry to employment is so low in physics and law is that the proportions going on to further study and training are so high. Again physics at 41 per cent comes second only to law at 54 per cent. Chemistry, biological sciences, and mathematical sciences are similar to physics in having a high proportion remaining in study and training. Medicine and dentistry and other applied fields stand out among the employment figures. Nearly 90 percent of the graduates in medicine in 2008 were in full time paid employment six months later. Next came subjects allied to medicine (69 per cent), education (64 per cent), veterinary science/agriculture (61 per cent) and engineering and technology (60 per cent).
4.10 In so far as the unemployment figures indicate demand, they do not provide evidence of a gross shortfall of physics graduates, which possibly explains why the output has remained much the same over the past 20 years. The impression that there is a severe shortage may come from the difficulty of getting well-qualified physics teachers. Smithers and Robinson (2005) found that nearly a quarter of 11-16 schools had no teacher who had studied physics to any level at university. In 2008 they
33
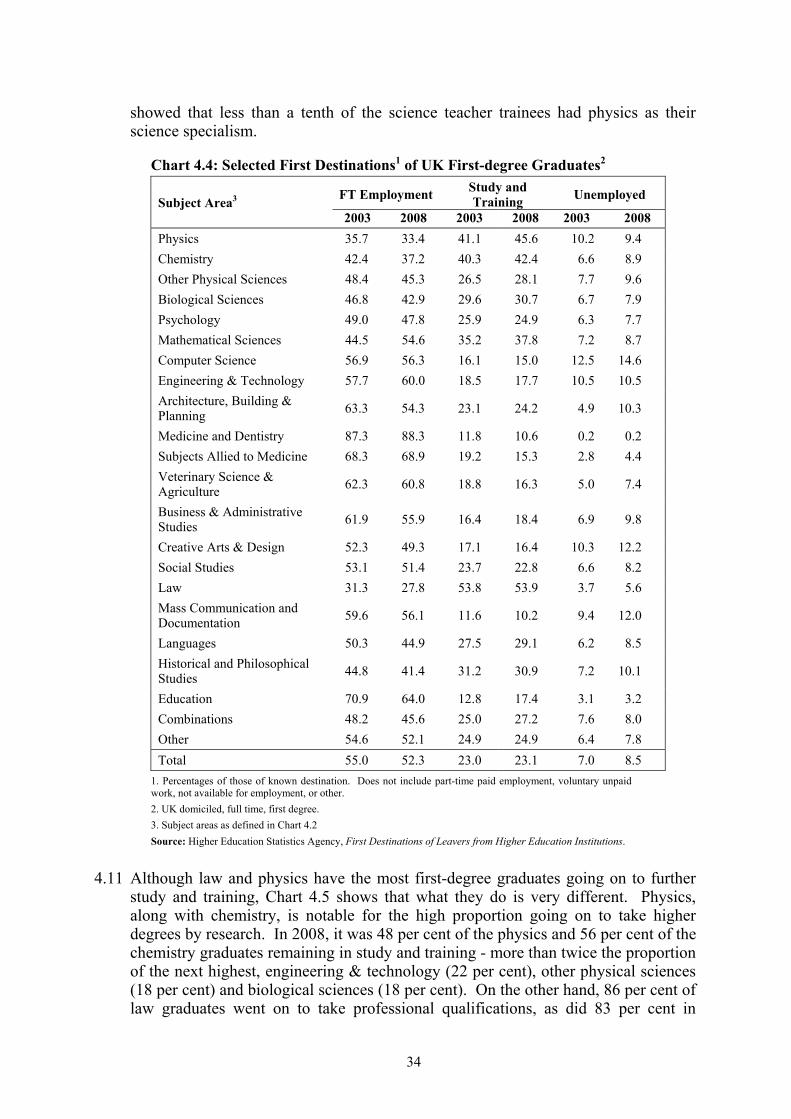
showed that less than a tenth of the science teacher trainees had physics as their science specialism.
Chart 4.4: Selected First Destinations1 of UK First-degree Graduates2
FT Employment Study and Training Unemployed Subject Area3
2003 2008 2003 2008 2003 2008 Physics 35.7 33.4 41.1 45.6 10.2 9.4 Chemistry 42.4 37.2 40.3 42.4 6.6 8.9 Other Physical Sciences 48.4 45.3 26.5 28.1 7.7 9.6 Biological Sciences 46.8 42.9 29.6 30.7 6.7 7.9 Psychology 49.0 47.8 25.9 24.9 6.3 7.7 Mathematical Sciences 44.5 54.6 35.2 37.8 7.2 8.7 Computer Science 56.9 56.3 16.1 15.0 12.5 14.6 Engineering & Technology 57.7 60.0 18.5 17.7 10.5 10.5 Architecture, Building & Planning 63.3 54.3 23.1 24.2 4.9 10.3
Medicine and Dentistry 87.3 88.3 11.8 10.6 0.2 0.2 Subjects Allied to Medicine 68.3 68.9 19.2 15.3 2.8 4.4 Veterinary Science & Agriculture 62.3 60.8 18.8 16.3 5.0 7.4
Business & Administrative Studies 61.9 55.9 16.4 18.4 6.9 9.8
Creative Arts & Design 52.3 49.3 17.1 16.4 10.3 12.2 Social Studies 53.1 51.4 23.7 22.8 6.6 8.2 Law 31.3 27.8 53.8 53.9 3.7 5.6 Mass Communication and Documentation 59.6 56.1 11.6 10.2 9.4 12.0
Languages 50.3 44.9 27.5 29.1 6.2 8.5 Historical and Philosophical Studies 44.8 41.4 31.2 30.9 7.2 10.1
Education 70.9 64.0 12.8 17.4 3.1 3.2 Combinations 48.2 45.6 25.0 27.2 7.6 8.0 Other 54.6 52.1 24.9 24.9 6.4 7.8 Total 55.0 52.3 23.0 23.1 7.0 8.5
1. Percentages of those of known destination. Does not include part-time paid employment, voluntary unpaid work, not available for employment, or other. 2. UK domiciled, full time, first degree. 3. Subject areas as defined in Chart 4.2 Source: Higher Education Statistics Agency, First Destinations of Leavers from Higher Education Institutions.
4.11 Although law and physics have the most first-degree graduates going on to further study and training, Chart 4.5 shows that what they do is very different. Physics, along with chemistry, is notable for the high proportion going on to take higher degrees by research. In 2008, it was 48 per cent of the physics and 56 per cent of the chemistry graduates remaining in study and training - more than twice the proportion of the next highest, engineering & technology (22 per cent), other physical sciences (18 per cent) and biological sciences (18 per cent). On the other hand, 86 per cent of law graduates went on to take professional qualifications, as did 83 per cent in
34
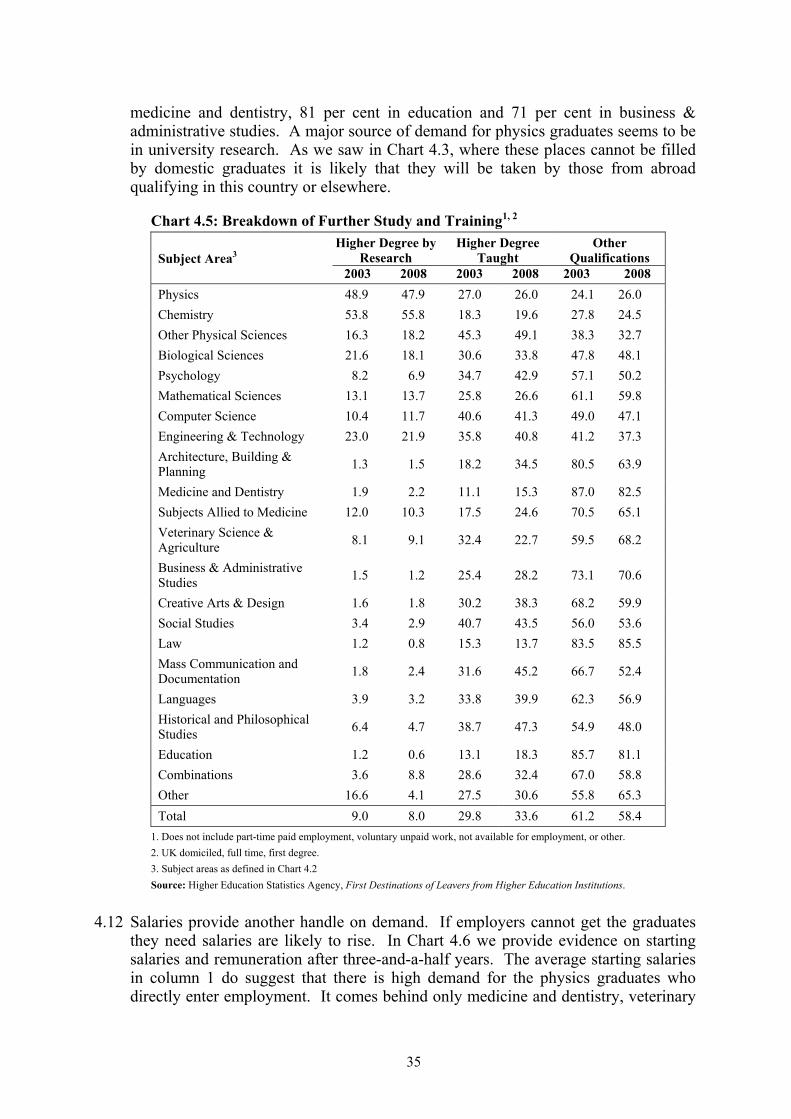
medicine and dentistry, 81 per cent in education and 71 per cent in business & administrative studies. A major source of demand for physics graduates seems to be in university research. As we saw in Chart 4.3, where these places cannot be filled by domestic graduates it is likely that they will be taken by those from abroad qualifying in this country or elsewhere.
Chart 4.5: Breakdown of Further Study and Training1, 2 Higher Degree by
Research Higher Degree
Taught Other
Qualifications Subject Area3 2003 2008 2003 2008 2003 2008
Physics 48.9 47.9 27.0 26.0 24.1 26.0 Chemistry 53.8 55.8 18.3 19.6 27.8 24.5 Other Physical Sciences 16.3 18.2 45.3 49.1 38.3 32.7 Biological Sciences 21.6 18.1 30.6 33.8 47.8 48.1 Psychology 8.2 6.9 34.7 42.9 57.1 50.2 Mathematical Sciences 13.1 13.7 25.8 26.6 61.1 59.8 Computer Science 10.4 11.7 40.6 41.3 49.0 47.1 Engineering & Technology 23.0 21.9 35.8 40.8 41.2 37.3 Architecture, Building & Planning 1.3 1.5 18.2 34.5 80.5 63.9
Medicine and Dentistry 1.9 2.2 11.1 15.3 87.0 82.5 Subjects Allied to Medicine 12.0 10.3 17.5 24.6 70.5 65.1 Veterinary Science & Agriculture 8.1 9.1 32.4 22.7 59.5 68.2
Business & Administrative Studies 1.5 1.2 25.4 28.2 73.1 70.6
Creative Arts & Design 1.6 1.8 30.2 38.3 68.2 59.9 Social Studies 3.4 2.9 40.7 43.5 56.0 53.6 Law 1.2 0.8 15.3 13.7 83.5 85.5 Mass Communication and Documentation 1.8 2.4 31.6 45.2 66.7 52.4
Languages 3.9 3.2 33.8 39.9 62.3 56.9 Historical and Philosophical Studies 6.4 4.7 38.7 47.3 54.9 48.0
Education 1.2 0.6 13.1 18.3 85.7 81.1 Combinations 3.6 8.8 28.6 32.4 67.0 58.8 Other 16.6 4.1 27.5 30.6 55.8 65.3 Total 9.0 8.0 29.8 33.6 61.2 58.4
1. Does not include part-time paid employment, voluntary unpaid work, not available for employment, or other. 2. UK domiciled, full time, first degree. 3. Subject areas as defined in Chart 4.2 Source: Higher Education Statistics Agency, First Destinations of Leavers from Higher Education Institutions.
4.12 Salaries provide another handle on demand. If employers cannot get the graduates they need salaries are likely to rise. In Chart 4.6 we provide evidence on starting salaries and remuneration after three-and-a-half years. The average starting salaries in column 1 do suggest that there is high demand for the physics graduates who directly enter employment. It comes behind only medicine and dentistry, veterinary
35

science and engineering and technology in the initial salary commanded. In terms of the salary of all graduates, either first degree or postgraduate, however it comes well down the list. This probably reflects the high proportion staying on to do research and the relatively low salaries paid to university staff.
Chart 4.6: Salaries by Field of Study %Earning £35,000+
Subject Area2 Average
Salaries1 in £
First Degree3 Postgrad4
Physics 22,542 - - Chemistry 20,509 - - Other Physical Sciences/All Physical Sciences 19,399 6.3 13.8 Biological Sciences 16,873 5.3 28.0 Psychology 16,528 - - Mathematical Sciences 22,350 19.2 46.7 Computer Science 21,094 11.3 35.6 Engineering & Technology 23,202 17.8 32.0 Architecture, Building & Planning 20,682 18.5 34.3 Medicine and Dentistry 29,041 58.0 26.5 Subjects Allied to Medicine 20,313 12.3 43.0 Veterinary Science 25,051 - - Agriculture 17,190 7.7 28.9 Business & Administrative Studies 19,552 12.7 33.3 Creative Arts & Design 16,231 3.1 20.7 Social Studies 20,486 10.9 24.7 Law 17,675 16.8 27.2 Mass Communication and Documentation 16,558 6.5 15.3 Languages 17,569 10.4 15.1 Historical and Philosophical Studies 17,454 11.2 10.6 Education 19,723 4.2 13.9 Combinations 17,614 16.3 - Total 19,724 11.7 22.7
1. Full-time, first-degree leavers in 2007-08 in full-time employment six months after graduating. 2. Subject areas as defined in Chart 4.2 3. UK domiciled leavers in 2004-05 with first degrees surveyed three and a half years on. 4. UK domiciled leavers in 2004-05 with postgraduate qualifications surveyed three and a half years on. Sources: Salaries of 2007-08 leavers Sunday Times on-line (accessed 13 September 2009) commissioned from HESA; Destination of Leavers from HE Institutions Longitudinal Survey of 2004-05 Cohort, Key Findings Report 2009, and online tables. HESA
Résumé 4.13 Over the thirty years from 1980 the number of physics graduates from UK
universities has remained close to 2,300. At the same time graduate output overall has risen dramatically, especially following the elevation of the former polytechnics. In the period 1995 to 2008 graduate numbers went up by 40 per cent, with falls in only three subjects - physics, chemistry and engineering.
36

4.14 Unemployment and salaries can be taken as indicators of the demand for graduates. The lowest unemployment percentages between 2003 and 2008 were in medicine and dentistry, education, subjects allied to medicine and law; and the highest in computer science, creative arts and design, and mass communication and documentation. With about ten per cent unemployment physics tended to be in the upper half of the range. The impression that there is a severe shortage of physics graduates may come from the undoubted difficulty of recruiting sufficient high quality teachers. Physics and teaching offer very different satisfactions so this may be an endemic problem (Smithers and Hill, 1989). The salaries of physics graduates, both first degree and doctoral, surveyed after three years were well below average, probably reflecting the high proportions in research and the low salaries paid to university staff.
37

5. Graduates and Doctorates in Other Countries (ISCED 5A and 6) 5.1 How typical is the UK? There have been three major studies of the changing output
of physics/physical sciences graduates. Chart 5.1 summarizes the results with the rises and falls denoted by the arrow heads pointing up or down. The first data column shows the findings of the MAPS, Mapping Physics Students in Europe project. This was conducted by the European Physical Society and gathered data on numbers of physics graduates in the period 1998-2002. It attempted to standardize the definition of physics studies by writing a five-line description, but did not distinguish bachelor’s and doctoral degrees. The second results column is an analysis we have conducted of information published on the Eurostat Data Explorer website which gives the numbers of physical science (ISC 44 - physics, chemistry, and earth sciences) first-degree graduates (ISCED 5A) in the period 1998 to 2007. The third results column presents data made available to us by the Global Science Forum which attempted to cover the output of physical science graduates (defined by the individual countries) in the period 1985-2003.
5.2 The different subject definitions, the different levels considered and the different periods covered mean that there is little consistency. But what does stand out is that when ‘physics’ is the focus a different picture emerges from when the subject area is ‘physical sciences’. The overall totals show that the predominant direction for physics per se was downward, but for the physical sciences there were increases. Of the 29 countries for which physics information was collected, nine showed increases and 20 falls. In contrast, among the 26 countries and regions for which physical science information is listed by Eurostat there were 17 rises and nine falls.
5.3 This pattern is borne out by the Global Science Forum data where over the 19-year period increases in the physical sciences outweighed declines. Of the seven countries with increases in physics graduate output who were included in the Eurostat listing, five showed physical science graduate increases also, but two, Italy and Sweden, had falls. Conversely, of the 20 showing physics falls, eight had rises in physical sciences. For five there was no equivalent information, in the remaining seven including the UK, but also Bulgaria, France, Hungary, Latvia, the Netherlands, and Spain, both physics graduates and physical science graduate numbers went down.
5.4 The period considered is also important. The most recent data are those in the second results column which refers to physical sciences for the period 1998-2007. Here the trends are generally upwards. In Belgium, Germany, Norway, this represents a reversal of what occurred between 1985 to 2003 (third results column). In France, the recent trend is down, but over the longer term it has been up. In the Netherlands there has been a long-term decline in physics and the physical sciences generally.
5.5 There is thus no simple answer as to whether the output of physics graduates across countries is going up, decreasing or staying the same. Chart 5.1 enables us to make comparisons of the direction of any change, but it gives no idea of magnitude. This is where we now turn.
38

Chart 5.1: Changing1 Participation Physics2 Phys Sci3 Phys Sci4
1998-2002 1998-2007 1985-2003 Country Degree and Doctorate
Degree Degree
Australia ∆ Austria ▼ ∆ Belgium ▼ ∆ ▼ Bulgaria ▼ ▼ Czech ∆ ∆ Denmark ∆ ∆ ∆ Estonia ▼ ∆ Finland ▼ ∆ ∆ France ▼ ▼ ∆ Germany ▼ ∆ ▼ Greece ▼ Hungary ▼ ▼ Iceland ∆ Ireland ▼ Italy ∆ ▼ Korea ▼ Latvia ▼ ▼ Lithuania ∆ ∆ Macedonia ∆ Moldova ▼ Netherlands ▼ ▼ ▼ Norway ∆ ∆ ▼ Poland ▼ ∆ Portugal ▼ ∆ ∆ Romania ▼ Slovak ▼ ∆ Slovenia ∆ ∆ Spain ▼ ▼ Sweden ∆ ▼ Switzerland ∆ Turkey ∆ ∆ UK ▼ ▼ USA ∆ ∆ Ukraine ▼ Total ▼ ∆ ∆
1. ▼ denotes decrease, ∆ denotes increase, blank denotes insufficient data. 2. Troendle, G. (2004) Mapping Physics Students in Europe, European Physical Society. 3. Eurostat - Data Explorer. 4. Global Science Forum.
39

MAPS Study 5.6 The MAPS study (Troendle, 2004) approached 32 European countries for, among
other things, information on the number of students obtaining a physics degree in the five years 1997/98 to 2001/02. Of those countries, Croatia and Serbia provided only partial information and Albania combined biology and physics. The numbers of physics graduates - both first and higher degrees - of the other 29 are shown in Chart 5.2.
Chart 5.2: MAPS Study - Physics Graduates1 Country 1998 2002 % Change
Lithuania 86 111 29.1 Slovenia 38 44 15.8 Macedonia 64 71 10.9 Italy 1087 1164 7.1 Norway 132 141 6.8 Sweden 187 199 6.4 Switzerland 317 329 3.8 Czech 279 289 3.6 Denmark 321 326 1.6 Belgium 352 343 -2.6 UK 944 915 -3.1 Slovak 138 132 -4.3 Moldova 176 168 -4.5 Finland 165 157 -4.8 The Netherlands 353 334 -5.4 Ukraine 1337 1263 -5.5 Estonia 58 54 -6.9 Austria 291 267 -8.2 Romania 271 248 -8.5 Poland 772 691 -10.5 Portugal 284 252 -11.3 Latvia 101 89 -11.9 France 1701 1469 -13.6 Hungary 399 339 -15.0 Greece 364 305 -16.2 Spain 631 527 -16.5 Ireland 104 83 -20.2 Bulgaria 217 172 -20.7 Germany 4,651 2,852 -38.7 Total 15,820 13,334 -15.7
1. First and Higher Degrees. Source: Troendle, G. (2004) Mapping Physics Students in Europe, European Physical Society.
5.7 It shows that magnitude of the changes range from an increase of 29 per cent in Lithuania to a decrease of 39 per cent in Germany. Since nearly 30 per cent of the
40

physics graduates in 1998 were in Germany the sharp fall there brings down the total to show a decrease of 16 per cent overall. The nine countries bucking the trend were mainly Scandinavian (Norway, Sweden and Denmark) or emerging European (Lithuania, Czech Republic, Slovenia and Macedonia). The only country with more than a thousand graduates to show an increase was Italy. Switzerland was the other country showing gains. The 20 countries reporting decreases included - besides Germany - France, the Netherlands, Belgium, Spain, Austria and Finland. The UK was recorded as showing a fall of about three per cent.
5.8 But the figures for the UK are puzzling. As we showed in Chapter 4, the output of first-degree physics graduates has tended to be close to 2,300 for thirty years or more. MAPS, however, reports the outputs to be 944 in 1998 and 915 in 2002. Tracking these back we find them to be the numbers displayed on the Institute of Physics’ website for higher degrees. The data for bachelor’s degrees alongside them has been overlooked. The confusion seems to have arisen because the MAPS study specifies that it wants data for ISCED Levels 6 and 7 which it defines as respectively bachelor’s and doctor’s degrees. But since 1997 these qualifications have been classified by the OECD as Levels 5A and 6. Somewhere along the line the UK’s bachelor’s degrees have been omitted contrary to what was intended.
5.9 The same definitional difficulties apply to other countries. In Germany, for example, the original MAPS figures include those obtaining a degree for school teaching alongside the subject specialists, which we have been able to remove. The MAPS analysis does tend to show that the physics graduate output of Europe fell somewhat from 1998 to 2002 although with differences between countries. It has been influential in the thinking of the European Commission on graduate supply and it has fed into the deliberations of the High Level Group on Increasing Human Resources for Science and Technology in Europe chaired by Gago (2004). But the main lessons to emerge from it are the need for clear and standardized definitions and for these to be consistently applied. The harmonisation of university qualifications through the Bologna process will make it easier to compare them. There are already standardised fields of education and training (Andersson and Olsson, 1999) and standardized levels (OECD, 2004). These are adopted in the publication of Eurostat statistics, but not universally.
Eurostat 5.10 Eurostat is the Statistical Office of the European Union charged with providing
statistics to enable comparisons to be made between countries and regions. On its website it conveniently displays data on graduates by field of education and level. Among the listings there is a table for graduates in the physical sciences (ISC 44) at level ISCED 5A for the years from 1998 to 1997. Level 5A includes bachelor’s degrees, the German ‘Diplom’ and the French ‘Licence’, but also some second and higher theoretically based programmes such as taught master’s degrees and the French ‘Maîtrise’. In all, it lists 38 countries and regions including the United States and Japan for comparison and an overall total for the European Union. Of those, there were complete sets of data for 25 countries running from 1998 or occasionally 1999. In addition to the physical scientist graduate numbers, total ISCED 5A graduates are provided. Chart 5.3 shows the changes in output from 1998 to 2007 listed in order of the biggest increase. In addition to the changes in raw numbers, the
41
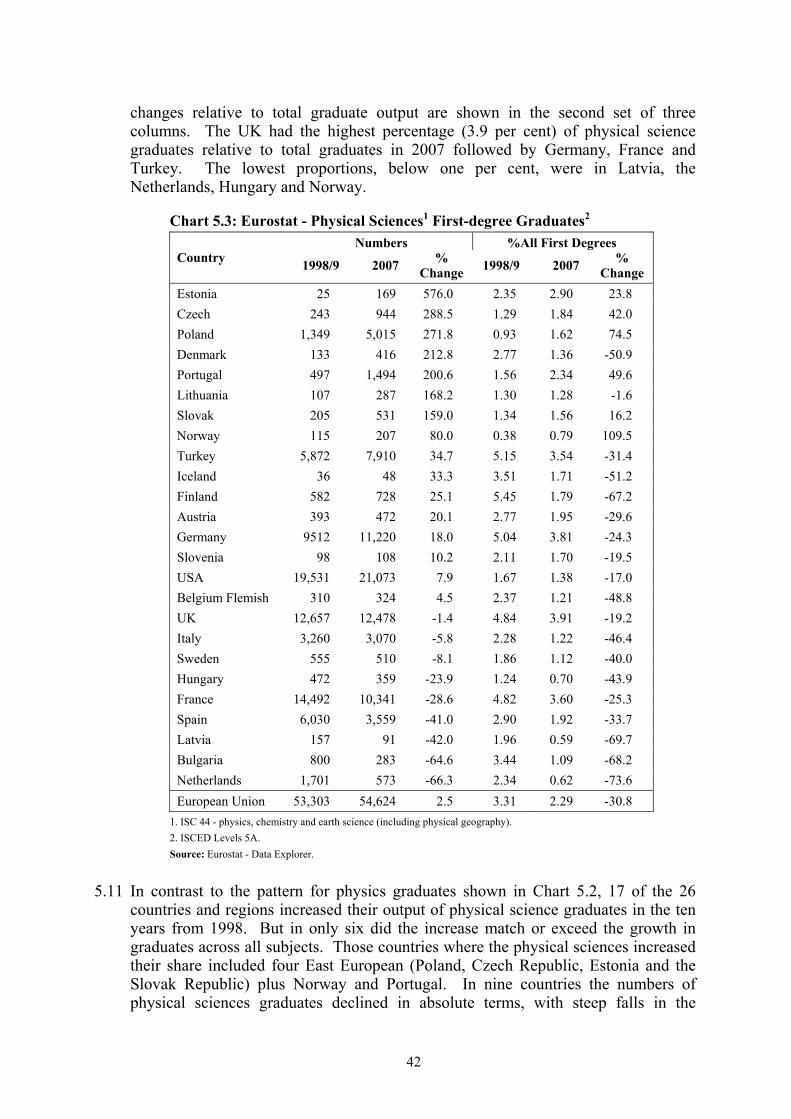
changes relative to total graduate output are shown in the second set of three columns. The UK had the highest percentage (3.9 per cent) of physical science graduates relative to total graduates in 2007 followed by Germany, France and Turkey. The lowest proportions, below one per cent, were in Latvia, the Netherlands, Hungary and Norway.
Chart 5.3: Eurostat - Physical Sciences1 First-degree Graduates2 Numbers %All First Degrees
Country 1998/9 2007 % Change 1998/9 2007 %
Change Estonia 25 169 576.0 2.35 2.90 23.8 Czech 243 944 288.5 1.29 1.84 42.0 Poland 1,349 5,015 271.8 0.93 1.62 74.5 Denmark 133 416 212.8 2.77 1.36 -50.9 Portugal 497 1,494 200.6 1.56 2.34 49.6 Lithuania 107 287 168.2 1.30 1.28 -1.6 Slovak 205 531 159.0 1.34 1.56 16.2 Norway 115 207 80.0 0.38 0.79 109.5 Turkey 5,872 7,910 34.7 5.15 3.54 -31.4 Iceland 36 48 33.3 3.51 1.71 -51.2 Finland 582 728 25.1 5.45 1.79 -67.2 Austria 393 472 20.1 2.77 1.95 -29.6 Germany 9512 11,220 18.0 5.04 3.81 -24.3 Slovenia 98 108 10.2 2.11 1.70 -19.5 USA 19,531 21,073 7.9 1.67 1.38 -17.0 Belgium Flemish 310 324 4.5 2.37 1.21 -48.8 UK 12,657 12,478 -1.4 4.84 3.91 -19.2 Italy 3,260 3,070 -5.8 2.28 1.22 -46.4 Sweden 555 510 -8.1 1.86 1.12 -40.0 Hungary 472 359 -23.9 1.24 0.70 -43.9 France 14,492 10,341 -28.6 4.82 3.60 -25.3 Spain 6,030 3,559 -41.0 2.90 1.92 -33.7 Latvia 157 91 -42.0 1.96 0.59 -69.7 Bulgaria 800 283 -64.6 3.44 1.09 -68.2 Netherlands 1,701 573 -66.3 2.34 0.62 -73.6 European Union 53,303 54,624 2.5 3.31 2.29 -30.8
1. ISC 44 - physics, chemistry and earth science (including physical geography). 2. ISCED Levels 5A. Source: Eurostat - Data Explorer.
5.11 In contrast to the pattern for physics graduates shown in Chart 5.2, 17 of the 26 countries and regions increased their output of physical science graduates in the ten years from 1998. But in only six did the increase match or exceed the growth in graduates across all subjects. Those countries where the physical sciences increased their share included four East European (Poland, Czech Republic, Estonia and the Slovak Republic) plus Norway and Portugal. In nine countries the numbers of physical sciences graduates declined in absolute terms, with steep falls in the
42
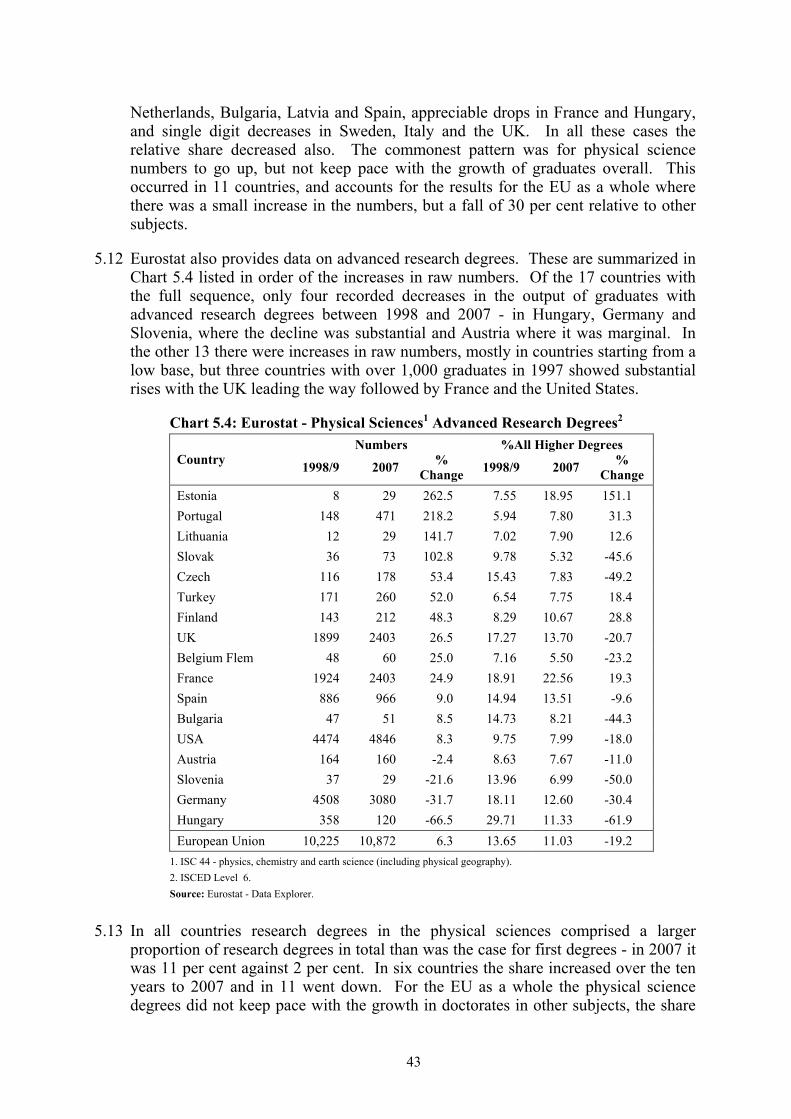
Netherlands, Bulgaria, Latvia and Spain, appreciable drops in France and Hungary, and single digit decreases in Sweden, Italy and the UK. In all these cases the relative share decreased also. The commonest pattern was for physical science numbers to go up, but not keep pace with the growth of graduates overall. This occurred in 11 countries, and accounts for the results for the EU as a whole where there was a small increase in the numbers, but a fall of 30 per cent relative to other subjects.
5.12 Eurostat also provides data on advanced research degrees. These are summarized in Chart 5.4 listed in order of the increases in raw numbers. Of the 17 countries with the full sequence, only four recorded decreases in the output of graduates with advanced research degrees between 1998 and 2007 - in Hungary, Germany and Slovenia, where the decline was substantial and Austria where it was marginal. In the other 13 there were increases in raw numbers, mostly in countries starting from a low base, but three countries with over 1,000 graduates in 1997 showed substantial rises with the UK leading the way followed by France and the United States.
Chart 5.4: Eurostat - Physical Sciences1 Advanced Research Degrees2 Numbers %All Higher Degrees
Country 1998/9 2007 % Change 1998/9 2007 %
Change Estonia 8 29 262.5 7.55 18.95 151.1 Portugal 148 471 218.2 5.94 7.80 31.3 Lithuania 12 29 141.7 7.02 7.90 12.6 Slovak 36 73 102.8 9.78 5.32 -45.6 Czech 116 178 53.4 15.43 7.83 -49.2 Turkey 171 260 52.0 6.54 7.75 18.4 Finland 143 212 48.3 8.29 10.67 28.8 UK 1899 2403 26.5 17.27 13.70 -20.7 Belgium Flem 48 60 25.0 7.16 5.50 -23.2 France 1924 2403 24.9 18.91 22.56 19.3 Spain 886 966 9.0 14.94 13.51 -9.6 Bulgaria 47 51 8.5 14.73 8.21 -44.3 USA 4474 4846 8.3 9.75 7.99 -18.0 Austria 164 160 -2.4 8.63 7.67 -11.0 Slovenia 37 29 -21.6 13.96 6.99 -50.0 Germany 4508 3080 -31.7 18.11 12.60 -30.4 Hungary 358 120 -66.5 29.71 11.33 -61.9 European Union 10,225 10,872 6.3 13.65 11.03 -19.2
1. ISC 44 - physics, chemistry and earth science (including physical geography). 2. ISCED Level 6. Source: Eurostat - Data Explorer.
5.13 In all countries research degrees in the physical sciences comprised a larger proportion of research degrees in total than was the case for first degrees - in 2007 it was 11 per cent against 2 per cent. In six countries the share increased over the ten years to 2007 and in 11 went down. For the EU as a whole the physical science degrees did not keep pace with the growth in doctorates in other subjects, the share
43
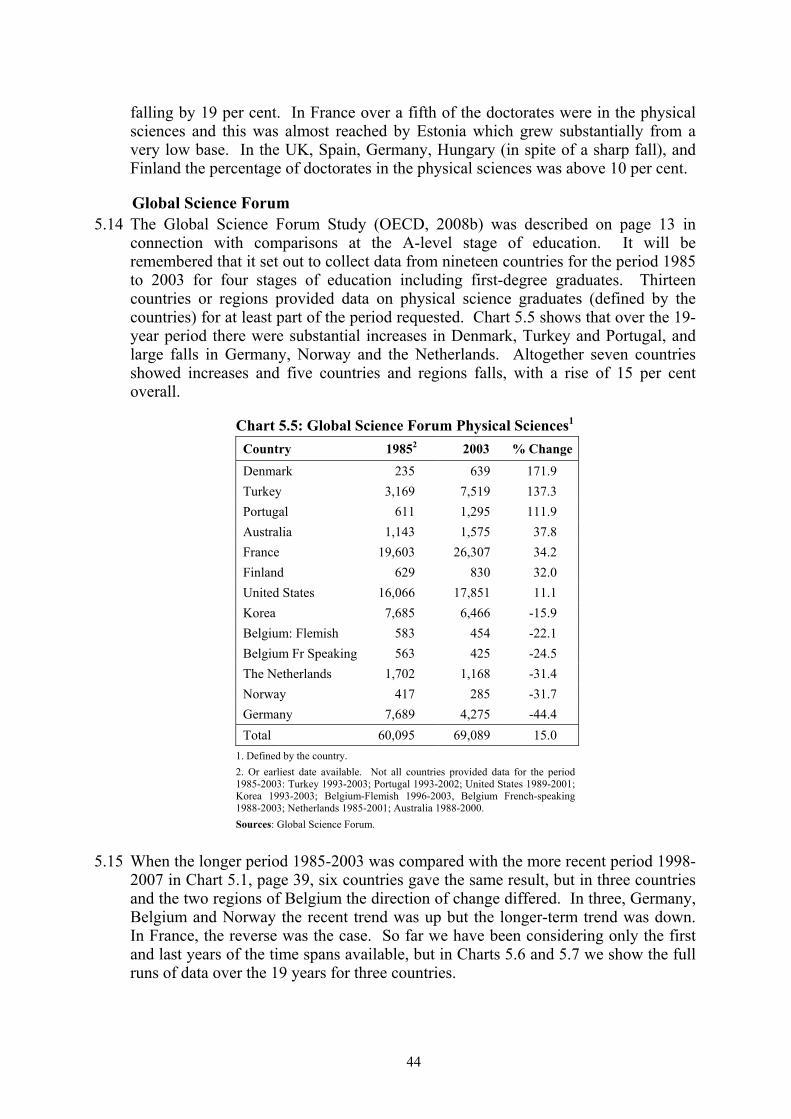
falling by 19 per cent. In France over a fifth of the doctorates were in the physical sciences and this was almost reached by Estonia which grew substantially from a very low base. In the UK, Spain, Germany, Hungary (in spite of a sharp fall), and Finland the percentage of doctorates in the physical sciences was above 10 per cent.
Global Science Forum 5.14 The Global Science Forum Study (OECD, 2008b) was described on page 13 in
connection with comparisons at the A-level stage of education. It will be remembered that it set out to collect data from nineteen countries for the period 1985 to 2003 for four stages of education including first-degree graduates. Thirteen countries or regions provided data on physical science graduates (defined by the countries) for at least part of the period requested. Chart 5.5 shows that over the 19-year period there were substantial increases in Denmark, Turkey and Portugal, and large falls in Germany, Norway and the Netherlands. Altogether seven countries showed increases and five countries and regions falls, with a rise of 15 per cent overall.
Chart 5.5: Global Science Forum Physical Sciences1 Country 19852 2003 % Change
Denmark 235 639 171.9 Turkey 3,169 7,519 137.3 Portugal 611 1,295 111.9 Australia 1,143 1,575 37.8 France 19,603 26,307 34.2 Finland 629 830 32.0 United States 16,066 17,851 11.1 Korea 7,685 6,466 -15.9 Belgium: Flemish 583 454 -22.1 Belgium Fr Speaking 563 425 -24.5 The Netherlands 1,702 1,168 -31.4 Norway 417 285 -31.7 Germany 7,689 4,275 -44.4 Total 60,095 69,089 15.0
1. Defined by the country. 2. Or earliest date available. Not all countries provided data for the period 1985-2003: Turkey 1993-2003; Portugal 1993-2002; United States 1989-2001; Korea 1993-2003; Belgium-Flemish 1996-2003, Belgium French-speaking 1988-2003; Netherlands 1985-2001; Australia 1988-2000. Sources: Global Science Forum.
5.15 When the longer period 1985-2003 was compared with the more recent period 1998-2007 in Chart 5.1, page 39, six countries gave the same result, but in three countries and the two regions of Belgium the direction of change differed. In three, Germany, Belgium and Norway the recent trend was up but the longer-term trend was down. In France, the reverse was the case. So far we have been considering only the first and last years of the time spans available, but in Charts 5.6 and 5.7 we show the full runs of data over the 19 years for three countries.
44

Chart 5.6: First-degree Physical Sciences Graduates
0
5
10
15
20
25
30
35
40
45
1985 1988 1991 1994 1997 2000 2003Year
Thou
sand
s
Germany
France
Finland
Source: Global Science Forum.
Chart 5.7: Physical Sciences Doctorates
0
1
2
3
4
5
1985 1988 1991 1994 1997 2000 2003Year
Thou
sand
s
Germany
France
Finland
Sources: Global Science Forum.
45

5.16 Charts 5.6 and 5.7 underline that in discussing subject trends the period considered is crucial. Chart 5.6 shows that first-degree physical science graduates in France more than doubled from 1985 to 1995 (up 22,124), but fell almost as dramatically to 2003 (down 15,420). In Germany there was an increase of 3,782 from 1985 to 1992 followed by a drop of 7,196 to 2003. In Finland from a very low base there was a dip in the period 1987 to 1992, since when there has been some increase. The changes within countries seem associated with particular factors. The Global Science Forum (OECD, 2008b) explains decline in Germany partly in terms of a significant drop in the 20-24 year-old population between 1993 and 1999.
5.17 The European Commission’s High Level Group (Gago, 2004) wrote brief case studies of France and Germany based on the MAPS study. They reported that the student population in France increased by nearly 60 per cent between 1981 and 1996 but since then it has, if anything, fallen somewhat. Our graph shows that the physical sciences ran ahead of the general increase to 1995, but subsequently dropped more steeply. The High Level group (page 34) puts this down to “poor prospects for scientific employment as the result of restrictions in particular in the public sector which makes up half the R&D employment in this country”. In discussing the pattern in Germany the High Level Group is able to show that enrolments decrease as unemployment rises and increase when a shortage of graduates is perceived. The Group cites with approval an observation of the European Economic and Social Committee (595/2000, page 15) that: “there should also be discussion about how unfavourable (e.g. for career choice) free-market employment cycles can be adequately offset by government ‘anticyclical’ programmes so as to protect human capital”.
5.18 Chart 5.7 shows that there were similar phases of growth and decline at the PhD level. In Germany output more than doubled from 1985 to 2000 (up by 2,318) only to fall by 1,205 by 2003. In France, in the data available, output reached a reached in 1997 but fell 35 per cent to 2003. In both countries it is likely the trends were influenced by the same factors as those affecting first-degree studies, but in the case of Germany at least there appears to have been a lag as the earlier increased supply of bachelor’s graduates fed through. Finland’s output is in penny numbers compared to Germany and France. From a low of 84 in 1989 PhD physical science output had about doubled to 160 in 2003. But this gain of 76 is only 3.7 per cent of the losses in France and Germany over the same period.
5.19 We saw in Charts 5.3 and 5.4 that a factor in the output trajectories was the growth in other fields, so that the physical sciences’ share declined. The Global Science Forum compared the fields of young graduates (both first and higher degrees) with those in the 55-64 age group. They found that social sciences, businesses and law attracted over three times as many young people as those in the older age group. Altogether these fields comprised 29 per cent of the populations of the participating countries educated to Levels 5A and 6 compared with 15 per cent in education, 14 per cent in engineering and 13 per cent in arts and humanities, with science at only 11 per cent.
46

United States 5.20 The contrast between physics/physical sciences and other fields is borne out by data
from the United States. Charts 5.8 and 5.9 shows that at both bachelor’s and doctoral levels physics output over the forty years from 1966 to 2006 varies within quite narrow limits while degrees overall have bounded upwards. At the bachelor’s level the number of physics degrees awarded in 2006 was almost the same as were awarded forty years earlier - 4,577 in 2006, 4,608 in 1966. Meanwhile, degrees in all fields had nearly trebled from 524,008 to 1,473,735. 1966 was a poor year for physics doctorates, but the output in 2006 of 1,365 was almost the same as that in 1968 of 1,338. Doctorates generally did not increase as spectacularly as bachelor’s degrees, but they still doubled from 22,937 in 1968 to 45,596 in 2006.
5.21 The pattern shown in Charts 5.8 and 5.9 for the United States is redolent of that for the UK presented in Charts 4.1 and 4.3. The supply of physics graduates has remained much the same over long periods. What is it that is holding the output more or less constant? It does not appear to be the numbers becoming qualified in upper secondary education, because as we saw in Chapter 3 the predominant recent trend in the UK has been down and that in the United States up. But the constraint could be at the more fundamental level of the proportion of the population capable of taking physics to a high level. Demand, however, is also important. In this chapter rises and falls in physical science degrees in France and Germany have been linked to career opportunities which in turn have been affected by investment in research and development.
5.22 What is true of the United States and the UK is not necessarily true of other countries, though the US is the largest and the UK is among the top educators of physicists in the world. In planning this chapter we originally intended to follow through those countries for which we had been able to obtain information on physics qualifications in upper secondary schooling discussed in Chapter 3. But it proved surprisingly difficult to get data on countries other than the United States. Australia re-classified its degree fields in 2002, leaving a sharp cut-off. New Zealand also re-classified and its published statistics only go back to 2002. Ireland’s available data run only from 2004 to 2007 and in that period physics degrees fluctuate around 120. For Finland we could not disaggregate the physics awards from the physical science awards covered in Charts 5.6 and 5.7.
5.23 But our comparative analysis of trends in physics/physical science graduates does embrace 34 countries including most of the major providers (though not Russia, India or China). The pattern which emerges is that at different times output can go up or down, but this appears to be within a relatively small range. In order to understand what holds output within this range it will be necessary to drill down in detail into more individual countries. But, as we found for the UK (Chapter 4) and the United States, there is an apparent disconnect between upper secondary schooling and university. In the face of some quite dramatic changes in physics take-up at school, university graduations in the subject have remained more or less the same. This may mean that while changes in student preferences come into play when there is a choice of the subjects at school, the number of university places and take-up is determined more by demand factors.
47
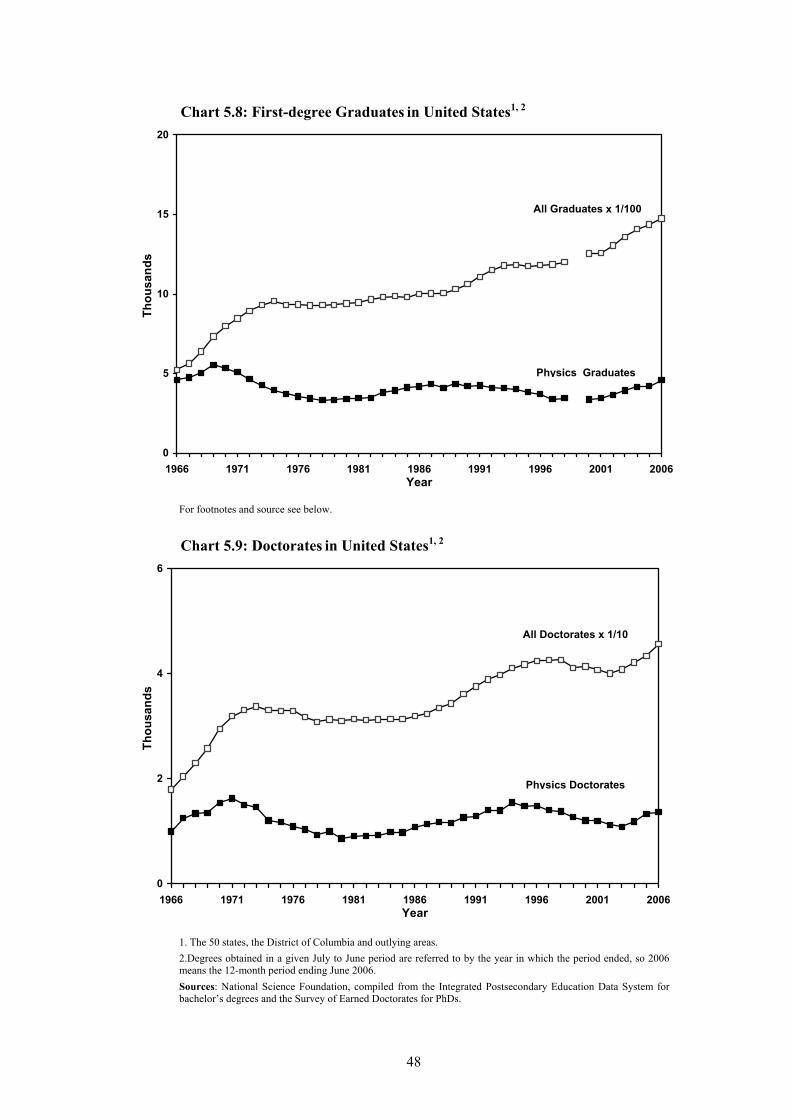
Chart 5.8: First-degree Graduates in United States1, 2
0
5
10
15
20
1966 1971 1976 1981 1986 1991 1996 2001 2006Year
Thou
sand
s
Physics Graduates
All Graduates x 1/100
For footnotes and source see below.
Chart 5.9: Doctorates in United States 1, 2
0
2
4
6
1966 1971 1976 1981 1986 1991 1996 2001 2006Year
Thou
sand
s
Physics Doctorates
All Doctorates x 1/10
1. The 50 states, the District of Columbia and outlying areas. 2.Degrees obtained in a given July to June period are referred to by the year in which the period ended, so 2006 means the 12-month period ending June 2006. Sources: National Science Foundation, compiled from the Integrated Postsecondary Education Data System for bachelor’s degrees and the Survey of Earned Doctorates for PhDs.
48
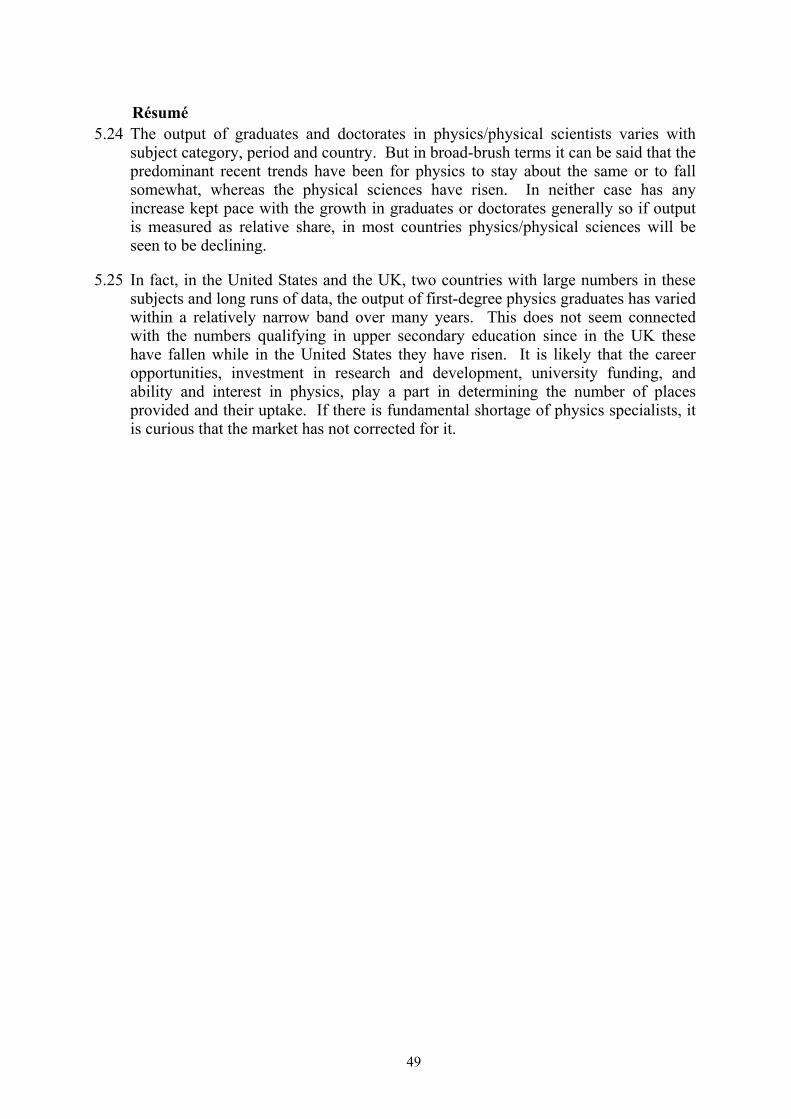
Résumé 5.24 The output of graduates and doctorates in physics/physical scientists varies with
subject category, period and country. But in broad-brush terms it can be said that the predominant recent trends have been for physics to stay about the same or to fall somewhat, whereas the physical sciences have risen. In neither case has any increase kept pace with the growth in graduates or doctorates generally so if output is measured as relative share, in most countries physics/physical sciences will be seen to be declining.
5.25 In fact, in the United States and the UK, two countries with large numbers in these subjects and long runs of data, the output of first-degree physics graduates has varied within a relatively narrow band over many years. This does not seem connected with the numbers qualifying in upper secondary education since in the UK these have fallen while in the United States they have risen. It is likely that the career opportunities, investment in research and development, university funding, and ability and interest in physics, play a part in determining the number of places provided and their uptake. If there is fundamental shortage of physics specialists, it is curious that the market has not corrected for it.
49

6. The Science Dilemma 6.1 A European Summit in Lisbon in 2000 set the goal of making Europe in the ten
years to 2010, “the most competitive and dynamic knowledge-based economy in the world capable of sustainable economic growth with more and better jobs and greater social cohesion.” It envisaged an ambitious expansion of science and technology education and research and development, with 1.2 million additional research personnel being recruited.
6.2 Chart 6.1 compiled from the latest Eurostat statistics shows that in the European Union as a whole the output of science, maths and technology graduates increased by 52 per cent over the ten years to 2007.
Chart 6.1: % STEM Graduates1 Country 1998 2007 Change
Portugal 0.52 1.81 1.29 Estonia 0.33 1.33 1.00 Poland 0.49 1.39 0.90 Lithuania 0.93 1.81 0.88 Denmark 0.81 1.64 0.83 Romania 0.42 1.19 0.77 Slovak Republic 0.43 1.19 0.76 Czech Republic 0.46 1.20 0.74 Sweden 0.79 1.36 0.57 Spain 0.80 1.12 0.32 Iceland 0.70 1.02 0.32 Austria 0.79 1.10 0.31 Latvia 0.61 0.92 0.31 Italy 0.51 0.82 0.31 Finland 1.59 1.88 0.29 The Netherlands 0.60 0.89 0.29 Bulgaria 0.55 0.84 0.29 Germany 0.88 1.14 0.26 Turkey 0.42 0.67 0.25 Japan 1.23 1.44 0.21 UK 1.55 1.75 0.20 France 1.85 2.05 0.20 Slovenia 0.80 0.98 0.18 Norway 0.75 0.93 0.18 Hungary 0.50 0.64 0.14 United States 0.92 1.01 0.09 Ireland 2.29 1.87 -0.42 European Union 0.88 1.34 0.46
1. Science, maths and technology graduates (ISCED 5 and 6) as percentage of the population aged 20-29. Source: Eurostat - Data Explorer.
50
6.3 This is impressive growth with countries like Portugal, Estonia and Poland doubling or trebling their output from very low bases. Chart 6.1 can be compared with Chart 5.3, page 42, which shows the increase over the same period just for the physical sciences. While all countries except Ireland recorded a greater output of STEM graduates generally, and the physical sciences shared in this growth in some countries, in others like the Netherlands, Latvia, Spain, France and Hungary falls in the physical sciences were masked by the trend overall. As regards the physical sciences, the Eurostat figures for the European Union as whole for the period 1998-2007 (Charts 5.3, 5.4) show relatively little growth either at first or higher degree levels.
6.4 But what is striking also about Chart 6.1 is even with the expansion how few of the population hold science, maths and technology degrees. Across the countries considered the proportion of 20-29 year-olds with STEM degrees in 2007 ranged from 0.64 per cent in Hungary to 2.05 per cent in France, with in the European Union as whole 1.34 per cent. This poses something of a dilemma. Should science education be geared more to identifying and developing the researchers and specialists of the future who will make a disproportionate contribution to a country’s economic and intellectual health, or should the emphasis be more on science for citizens so that all can participate in a society’s decision-making about scientific issues?
6.5 The thrust of a report by the European Commission’s High Level Group (Gago, 2004) was that there is “a crisis in the production of human resources for science, engineering and technology”. But the other side of the dilemma is clearly put by a report on two seminars convened by the Nuffield Foundation (Osborne and Dillon, 2008) bringing together science educators from across Europe. Its first recommendation was that: “the primary goal of science education across the EU should be to educate students both about major explanations of the material world that science offers and about the way science works. Science courses whose basic aim is to provide a foundational education for future scientists and engineers should be optional.”
6.6 The European High Level Group also notes that many countries suffer acute shortages of specialist science teachers, particularly in physics. “In the long run, the future lack of well qualified SET teachers may be even more serious than the current demand for researchers and scientists.” Given that there are not enough specialist teachers to go round, the dilemma, therefore, has a practical aspect: how should the teachers be deployed? Should the education system be organised to bring together the most able pupils with the teachers having the highest levels of subject expertise? Some countries have different types of secondary school according to abilities. In Germany, Austria, the Netherlands and Hungary, among others, admission to secondary school is determined in part by prior attainment. Overall, therefore, and not just for the sciences, the system brings together academic pupils and academic teachers. Not all countries, however, have early between-school differentiation and the dilemma has to be resolved within schools. Some, Finland, for example, which defers selection until upper secondary education have been notably successful in international comparisons.
51
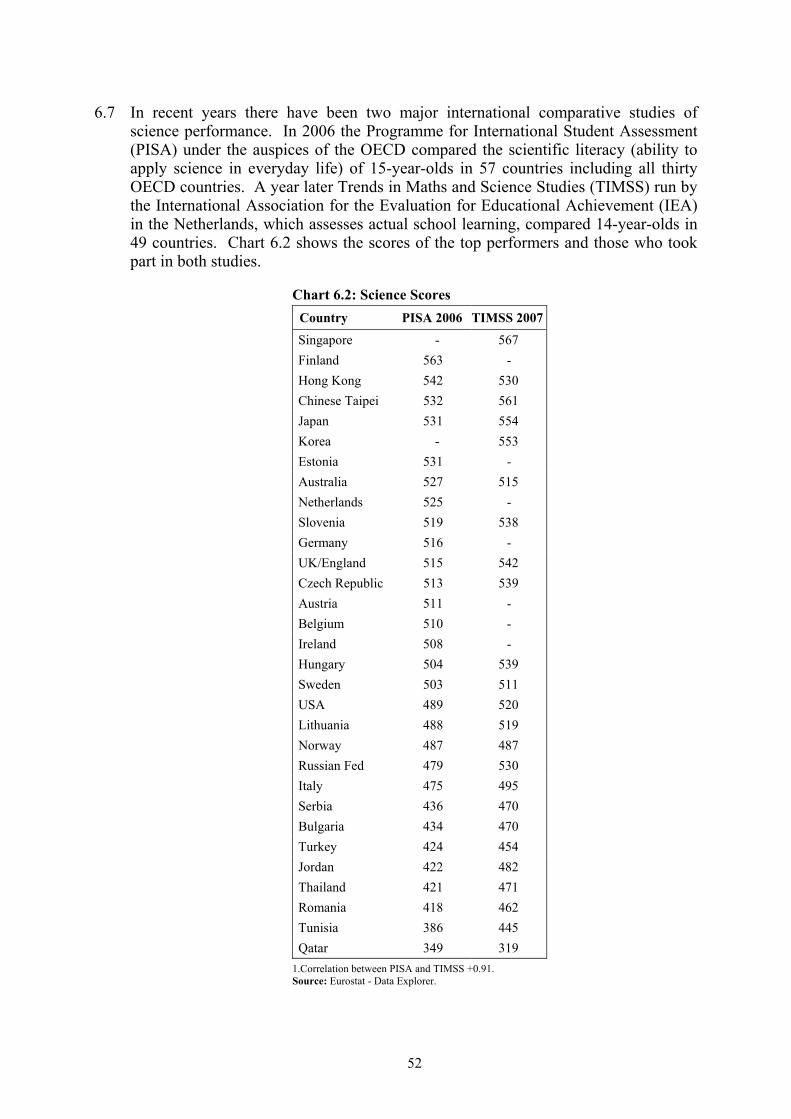
6.7 In recent years there have been two major international comparative studies of science performance. In 2006 the Programme for International Student Assessment (PISA) under the auspices of the OECD compared the scientific literacy (ability to apply science in everyday life) of 15-year-olds in 57 countries including all thirty OECD countries. A year later Trends in Maths and Science Studies (TIMSS) run by the International Association for the Evaluation for Educational Achievement (IEA) in the Netherlands, which assesses actual school learning, compared 14-year-olds in 49 countries. Chart 6.2 shows the scores of the top performers and those who took part in both studies.
Chart 6.2: Science Scores Country PISA 2006 TIMSS 2007
Singapore - 567 Finland 563 - Hong Kong 542 530 Chinese Taipei 532 561 Japan 531 554 Korea - 553 Estonia 531 - Australia 527 515 Netherlands 525 - Slovenia 519 538 Germany 516 - UK/England 515 542 Czech Republic 513 539 Austria 511 - Belgium 510 - Ireland 508 - Hungary 504 539 Sweden 503 511 USA 489 520 Lithuania 488 519 Norway 487 487 Russian Fed 479 530 Italy 475 495 Serbia 436 470 Bulgaria 434 470 Turkey 424 454 Jordan 422 482 Thailand 421 471 Romania 418 462 Tunisia 386 445 Qatar 349 319
1.Correlation between PISA and TIMSS +0.91. Source: Eurostat - Data Explorer.
52

6.8 In spite of their different aims and different age groupings, the PISA and TIMSS science scores correlate strongly, at +0.91, for the 22 countries taking part in both. But the PISA 2006 science scores bear only a weak relationship with the participation levels shown in Chart 6.1 (P<0.066, N=28, not significant). It is striking how both lists are dominated by the Asian countries that took part, and the average performance seems to say more about national characteristics than the organisation of schooling. Both selective and mixed ability European systems performed above average in PISA (few took part in TIMSS). It is difficult, therefore, to trace participation and performance in the sciences back to the general shape of the school system, but an emerging approach to the science dilemma is to set up specialist science schools that select the most able. We consider these in detail in the next chapter.
Résumé 6.9 Only a very small proportion of any population study maths, science and technology
to a high level. Statistics for the European Union show that on average 1.34 per cent of 20-29 year-olds in 2007 held degrees in science, maths and technology, ranging from 2.05 per cent in France to 0.64 per cent in Hungary. So should school science education be geared mainly to the science professionals of the future or science for citizens so that all can participate in a society’s decision-making about scientific issues: or are both ends compatible within a properly organised system? Another dimension to the dilemma is that often there are not enough high quality physics teachers to go round, so are the best teachers and the best pupils to be brought together in some way? Many countries have selection by ability, some in lower secondary education, for example Germany, the Netherlands, Austria and Hungary and others in upper secondary education, for example, Finland. Both selective and deferred selection systems can do well in the PISA and TIMSS comparisons of science performance.
53
7. Specialist Science Schools 7.1 A number of countries have addressed the science dilemma by having specialist
science schools for the especially able. As with many innovations the first were in the United States, where in 1972 three schools, each with a distinguished history - Stuyvesant, Brooklyn Tech and Bronx High School of Science - became specialised science schools of the New York City Department of Education setting a common competitive examination. They are open to New York residents and are public schools charging no tuition fees. Asian nations that lead in the PISA and TIMSS comparisons, like Korea, Japan and Singapore, have also chosen to have science schools for the gifted. But it is not just the top performers that have been attracted. Bronx High School has been the inspiration for specialist science schools in the Philippines and Turkey. Australia is unusual in having a specialist science school where admission is on the basis of interest rather than ability.
United States 7.2 Currently there are approaching one hundred schools in the United States
specialising in science, maths and technology. Out of the 50 states, 30 have so far established such schools. They are unevenly spread, some states such as Arkansas and California have only one institution, others several, for example Michigan has eleven and Georgia six. The largest concentration, 14, is in Virginia. Between them they provide for some 47,000 pupils. However this has to be seen against a background of nearly 20,000 public high schools and 15 million pupils in grades 9-12, and 3 million in grade 12 alone. About three-quarters of the schools are full-day schools and the rest half-day schools. Just under one fifth are residential, (Atkinson et al 2007). The majority are aimed at grades 9 to 12 (ages 14 to 17/18). Some examples are described in Boxes 7.1 and 7.2.
7.3 Many of the specialist schools were established in the 1980s in response to the growing concern about the competitiveness of the US economy. A number of states set up new public high schools specialising in science, maths and technology. By 1988 there were 15. These schools began to liaise with one another and became the founding members of the National Consortium for Specialised Secondary Schools of Mathematics Science and Technology (NCSSSMT). In addition to the 95 current full members there are over one hundred affiliate members, colleges, universities, foundations, corporations and summer programmes. A further strand in the establishment of specialist schools was the funding allocated by Congress for magnet schools of mathematics and science to assist school districts under the supervision of the courts with the desegregation plans of the late 1980s. Many of the science and technology magnet schools were placed on high school campuses with disproportionate numbers of African American students in order to bring non-black students into them.
7.4 Unlike the ordinary public high schools, the specialist schools have a selective intake. In New York, for example, eighth and ninth graders residing in New York City can take the Specialised High School Admissions Test (SHSAT), which is used to determine admission to the eight specialist schools. About one in five of the applicants (for example 6,100 out of 29,000 in 2008) are successful. Stuyvesant has the highest cut-off score followed by Bronx Science and Brooklyn. The specialist schools are distinctive from the comprehensive public high schools in a number of
54
other ways. The curriculum focuses extensively on STEM subjects to advanced placement level and beyond. The style of teaching and learning is less traditional with the emphasis on independent study. Most specialist schools have a graduation requirement of research in one of the specialist subject areas. In some schools students are assigned a research mentor whom they work closely with during their time at school. In connection with their research projects students take part in science fairs and research symposia and national competitions. The specialist schools have developed extensive partnerships with other organisations – universities, colleges, business and commercial bodies and alumni. These links provide support and funding in the long term and for specific once-off projects.
7.5 A report (Atkinson et al 2007) from the Information Technology and Innovation Foundation (ITIF) jointly with NCSSSMT argues the case for expanding the specialist schools initiative. It cites research by NCSSSMT (Thomas and Love, 2002a and 2002b) which showed that the schools were “highly effective at producing graduates not only with high levels of aptitude in STEM, but who go on to further study and careers in STEM”. The studies gathered data on students one and four years after high school graduation. Specialist school graduates were more likely to enrol in college within one year of graduation (99 per cent compared to 66 per cent nationally, more likely to complete college in four years (79 per cent compared to 65 per cent in private universities and 38 per cent in public), more likely to earn a master’s or doctoral degree (80 per cent compared to 10 per cent of 30-year-olds).
7.6 Proportionately many more maths and science school graduates obtain first and higher degrees in maths, science and technology than in the population as a whole, 56 per cent compared to 20 per cent, and particularly so for females. The report recommends that the enrolment in these specialist schools should be tripled by 2012 and increased eventually to 250,000 students. They believe “the National Science Foundation should play a key role in supporting and expanding such schools” and that “Congress should allocate $180 million a year for the next five years to the NSF to be matched by states and local school districts and industry and invested in both the creation of new Math and Science High Schools and the expansion of existing ones”.
7.7 The specialist schools also have their critics. There is the charge of elitism; that disproportionately they draw off funds from the general public schools and that school districts are reluctant to fund them because of the high costs of laboratory facilities and equipment. As a counter balance the specialist schools actively seek to enrol students from minorities, low-income homes and females. Currently NCSSSMT with external funding is carrying out a study “to identify and assess successful practices in reaching under-represented groups”. In addition the specialist schools serve as a testing ground for curricula and materials and provide in-classroom opportunities for high schools teachers and so act as a catalyst for the development and dissemination of good practice in teaching STEM subjects.
55
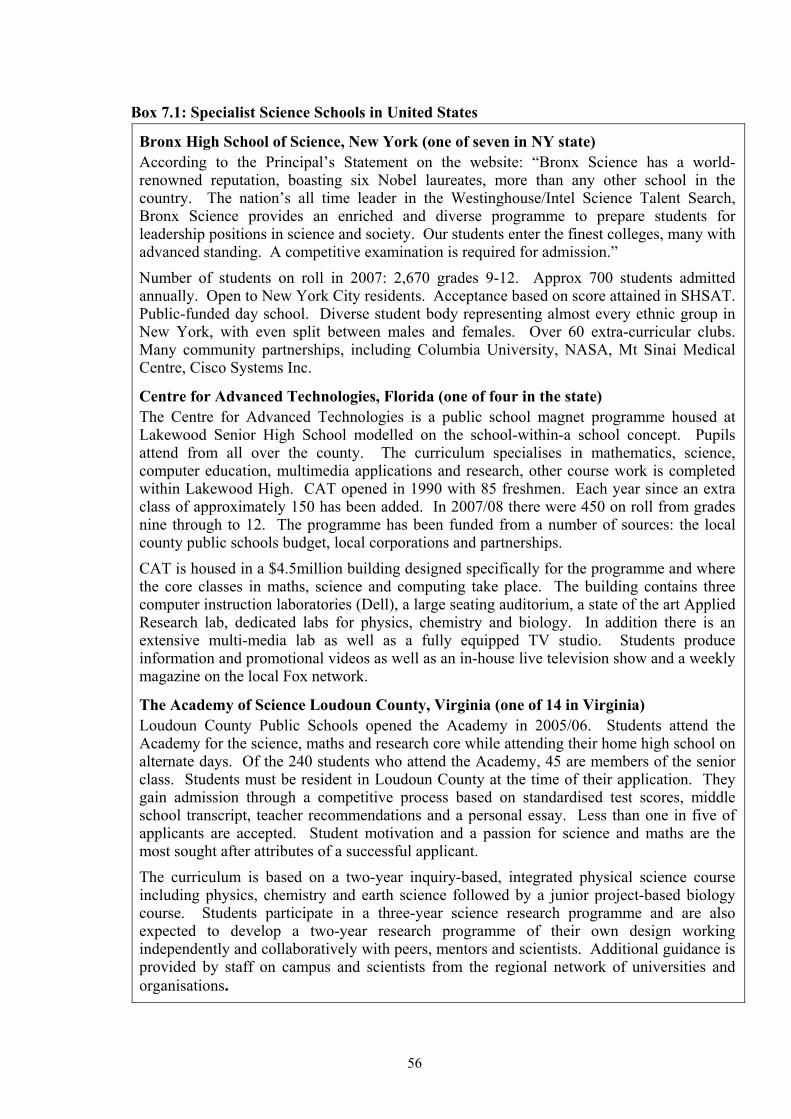
Box 7.1: Specialist Science Schools in United States
Bronx High School of Science, New York (one of seven in NY state) According to the Principal’s Statement on the website: “Bronx Science has a world-renowned reputation, boasting six Nobel laureates, more than any other school in the country. The nation’s all time leader in the Westinghouse/Intel Science Talent Search, Bronx Science provides an enriched and diverse programme to prepare students for leadership positions in science and society. Our students enter the finest colleges, many with advanced standing. A competitive examination is required for admission.” Number of students on roll in 2007: 2,670 grades 9-12. Approx 700 students admitted annually. Open to New York City residents. Acceptance based on score attained in SHSAT. Public-funded day school. Diverse student body representing almost every ethnic group in New York, with even split between males and females. Over 60 extra-curricular clubs. Many community partnerships, including Columbia University, NASA, Mt Sinai Medical Centre, Cisco Systems Inc.
Centre for Advanced Technologies, Florida (one of four in the state) The Centre for Advanced Technologies is a public school magnet programme housed at Lakewood Senior High School modelled on the school-within-a school concept. Pupils attend from all over the county. The curriculum specialises in mathematics, science, computer education, multimedia applications and research, other course work is completed within Lakewood High. CAT opened in 1990 with 85 freshmen. Each year since an extra class of approximately 150 has been added. In 2007/08 there were 450 on roll from grades nine through to 12. The programme has been funded from a number of sources: the local county public schools budget, local corporations and partnerships. CAT is housed in a $4.5million building designed specifically for the programme and where the core classes in maths, science and computing take place. The building contains three computer instruction laboratories (Dell), a large seating auditorium, a state of the art Applied Research lab, dedicated labs for physics, chemistry and biology. In addition there is an extensive multi-media lab as well as a fully equipped TV studio. Students produce information and promotional videos as well as an in-house live television show and a weekly magazine on the local Fox network.
The Academy of Science Loudoun County, Virginia (one of 14 in Virginia) Loudoun County Public Schools opened the Academy in 2005/06. Students attend the Academy for the science, maths and research core while attending their home high school on alternate days. Of the 240 students who attend the Academy, 45 are members of the senior class. Students must be resident in Loudoun County at the time of their application. They gain admission through a competitive process based on standardised test scores, middle school transcript, teacher recommendations and a personal essay. Less than one in five of applicants are accepted. Student motivation and a passion for science and maths are the most sought after attributes of a successful applicant. The curriculum is based on a two-year inquiry-based, integrated physical science course including physics, chemistry and earth science followed by a junior project-based biology course. Students participate in a three-year science research programme and are also expected to develop a two-year research programme of their own design working independently and collaboratively with peers, mentors and scientists. Additional guidance is provided by staff on campus and scientists from the regional network of universities and organisations.
56

Box 7.2: Specialist Science Schools in the United States
Oklahoma School of Science and Mathematics (the only one in the state) The school was established by legislative action in 1983. The first class of 44 seniors graduated in 1992. It is designed as a two-year residential public high school for 300 academically gifted students in maths and science. Approximately 70-80 students are selected each year from an applicant pool of about 300. Selection is highly competitive based on written essays, parental statement, recommendations from teachers in English, maths and science, headteacher, counsellor, student transcript and ACT score. All the applications, which come from across the state, are screened blindly.
The California Academy of Mathematics and Science (the only one in the state) CAMS is a four-year public comprehensive high school located on the campus of California State University in Carson City. It is a regional magnet school, which “seeks out and admits students with talent and passion for math and science”. Public and private school students who are currently in the eighth grade can apply as long as they live in one of the school districts that make-up the CAMS attendance area. About 1000 students apply each year and just over 160 are admitted. To gain admission students need a strong academic record, especially in math and science, above average test scores, excellent behaviour record and recommendations. All CAMS students take math, science English and social science each year. Graduates from the Academy complete five years of science and four years of math and two years of the same foreign language. They also take a specialised math programme called Interactive Math Program (IMP). Students begin to take university classes in their junior year providing they have reached the required standard. Students are not charged for tuition but are responsible for buying their own textbooks and for a minimal university fee (usually less than $5). About 95% of all CAMS graduates have gone on to four-year colleges and universities directly after graduating including many of the most prestigious, Caltech, MIT, Harvard, UC Berkeley UCLA, Cornell and Stanford.
Illinois Mathematics and Science Academy, Aurora (one of two in the state) The Academy opened in 1986 and is largely funded by the state. Supplementary funds are also obtained from local, state and federal sources to support particular programmes and projects, and private donations. Tuition is free, but there is an annual student fee based on family size and income. Ninth-graders are eligible to apply. Admission is competitive. Selection criteria include demonstrated interest and talent in mathematics and science, grades, teacher evaluations, a current SAT reasoning test score, personal essays and involvement in leadership and co-curricular activities. Currently there are about 650 residential students on roll in grades 10 through to 12. The students attend from communities throughout Illinois. IMSA’s students have gained numerous awards from national and global competitions, such as the Intel Science Search, the Siemens Competition in Math, Science and Technology and the International Physics Olympiad. The Academy has been named among the top public college preparatory programmes by Newsweek Magazine and the Wall Street Journal rankings. IMSA offers a wide range of State-wide programmes, for example an after-school enrichment programme for late elementary (grades 4-5) and middle school pupils (grades 6-8), the Problem-Based Learning Network offering instruction and support for teachers to improve student achievement. Recently IMSA has opened two field offices in the Chicago area to extend the professional development programme and to act as a central hub for resources and community-based science and maths enrichment programmes.
57

7.8 The specialist science and maths schools have many common characteristics though there is a plurality of sources of funding and governance structures differ widely, for example, through colleges, universities, and local boards. This diversity, rather than being strength, raises issues about their sustainability in terms of public support and funding. The wisdom of focusing intensively on science and maths from age 14 has also been queried. Powell (2005) found that some students blossomed under pressure and would have felt under-nourished in ordinary high school, but others lost their confidence, felt inadequate compared to some of their ‘nerdy’ fellow students and hated the whole experience.
Korea 7.9 Overall there are about 2,000 high schools in Korea, educating about two million students.
Of these 92 are specialist - in subjects like foreign languages, science and maths, arts, and physical education. The largest group are the foreign language high schools with 30 schools and over 25,000 pupils. The first specialist science high school was established in 1983 and by 2008 there were 21 catering for about 4,000 students. All are supported by public funds and supervised by the regional and metropolitan education offices. In Korea pupils attend middle schools to age 15 and then can opt for high school education lasting three years to age 19. Over 90 per cent of them do, with the rate doubling in the past twenty years, (Korea Ministry of Education, Science and Technology, 2009).
7.10 Admission to specialist science high schools is either by ‘special screening’ taking into account the student’s middle school record, participation in major national scientific competitions and success at national scientific fairs or ‘general screening’ dependent on a review of the middle school record and an interview, (Korean Ministry of Education, Science and Technology, 2005). From the science high schools students can seek to move directly to an honours degree course at KAIST after two years, and some 40-45 per cent do. As an example we can take the Seoul Science High School described in Box 7.3.
Box 7.3: Seoul Science High School
Seoul Science High School is one of the most prestigious in the country. It was established in 1989 for students from ages 15 to 19. This school selects the top three per cent of middle school graduates in its catchment area. There are 150 students in each of years one and two with about 50 staying on to complete a third year. The school has a strong international reputation. Its students participate and win awards in national and international science competitions. Usually, a quarter to a half of Korea’s international science Olympians are from this school. Besides gaining admission to Korea’s top universities, such as Seoul National University, Korea Advanced Institute of Science and Technology (KAIST) and Pohang University of Science and Technology (POSTECH), its students are also to be found overseas, especially in the leading USA institutions.
7.11 The identification and fostering of scientific talent in specialist schools formed part of the Korean government’s four-year plan, running from 2003 to 2007, for ‘Promoting Science Education in Primary and Secondary Schools Centred on Exploration and Experimentation’. This has involved refurbishment of labs, concentration of teaching, learning and research exemplars in outstanding schools, the development and distribution of teaching materials, extra-curricular activities and the establishment of science education research institutes. The overall strategy is to “cultivate sophisticated human resources”. The Science High School Development Plan is aimed at expanding the general high schools
58
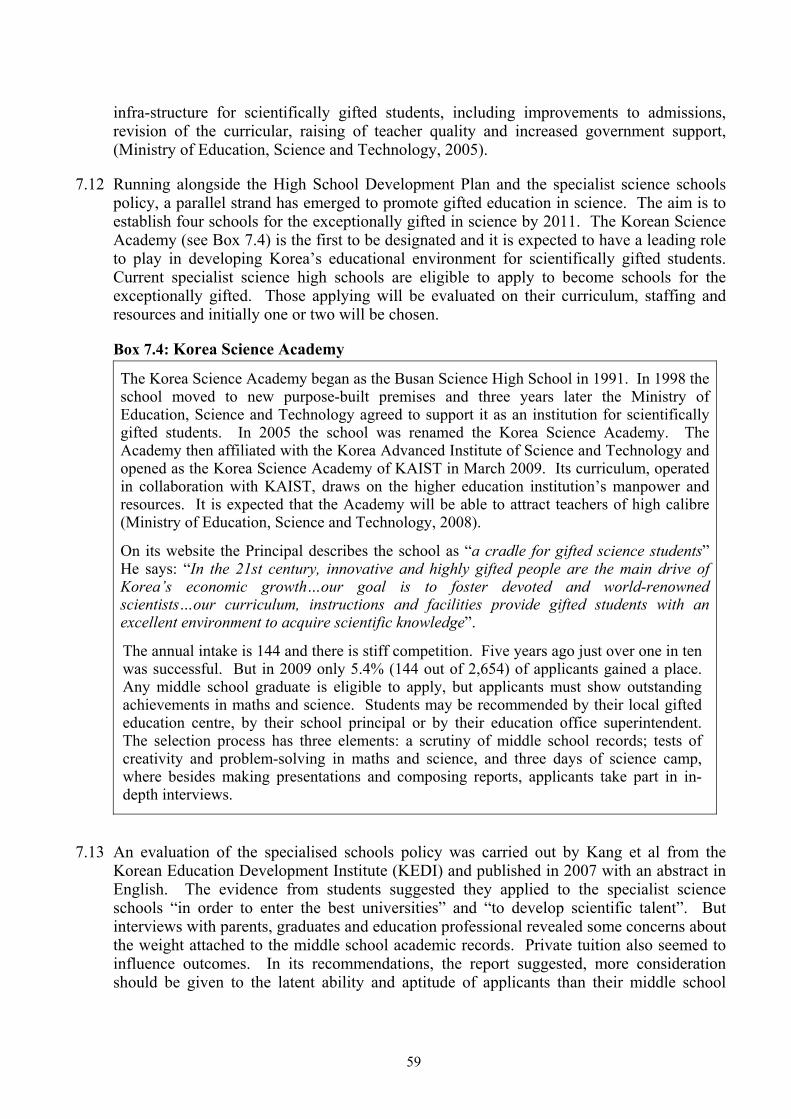
infra-structure for scientifically gifted students, including improvements to admissions, revision of the curricular, raising of teacher quality and increased government support, (Ministry of Education, Science and Technology, 2005).
7.12 Running alongside the High School Development Plan and the specialist science schools policy, a parallel strand has emerged to promote gifted education in science. The aim is to establish four schools for the exceptionally gifted in science by 2011. The Korean Science Academy (see Box 7.4) is the first to be designated and it is expected to have a leading role to play in developing Korea’s educational environment for scientifically gifted students. Current specialist science high schools are eligible to apply to become schools for the exceptionally gifted. Those applying will be evaluated on their curriculum, staffing and resources and initially one or two will be chosen.
Box 7.4: Korea Science Academy
The Korea Science Academy began as the Busan Science High School in 1991. In 1998 the school moved to new purpose-built premises and three years later the Ministry of Education, Science and Technology agreed to support it as an institution for scientifically gifted students. In 2005 the school was renamed the Korea Science Academy. The Academy then affiliated with the Korea Advanced Institute of Science and Technology and opened as the Korea Science Academy of KAIST in March 2009. Its curriculum, operated in collaboration with KAIST, draws on the higher education institution’s manpower and resources. It is expected that the Academy will be able to attract teachers of high calibre (Ministry of Education, Science and Technology, 2008).
On its website the Principal describes the school as “a cradle for gifted science students” He says: “In the 21st century, innovative and highly gifted people are the main drive of Korea’s economic growth…our goal is to foster devoted and world-renowned scientists…our curriculum, instructions and facilities provide gifted students with an excellent environment to acquire scientific knowledge”.
The annual intake is 144 and there is stiff competition. Five years ago just over one in ten was successful. But in 2009 only 5.4% (144 out of 2,654) of applicants gained a place. Any middle school graduate is eligible to apply, but applicants must show outstanding achievements in maths and science. Students may be recommended by their local gifted education centre, by their school principal or by their education office superintendent. The selection process has three elements: a scrutiny of middle school records; tests of creativity and problem-solving in maths and science, and three days of science camp, where besides making presentations and composing reports, applicants take part in in-depth interviews.
7.13 An evaluation of the specialised schools policy was carried out by Kang et al from the Korean Education Development Institute (KEDI) and published in 2007 with an abstract in English. The evidence from students suggested they applied to the specialist science schools “in order to enter the best universities” and “to develop scientific talent”. But interviews with parents, graduates and education professional revealed some concerns about the weight attached to the middle school academic records. Private tuition also seemed to influence outcomes. In its recommendations, the report suggested, more consideration should be given to the latent ability and aptitude of applicants than their middle school
59
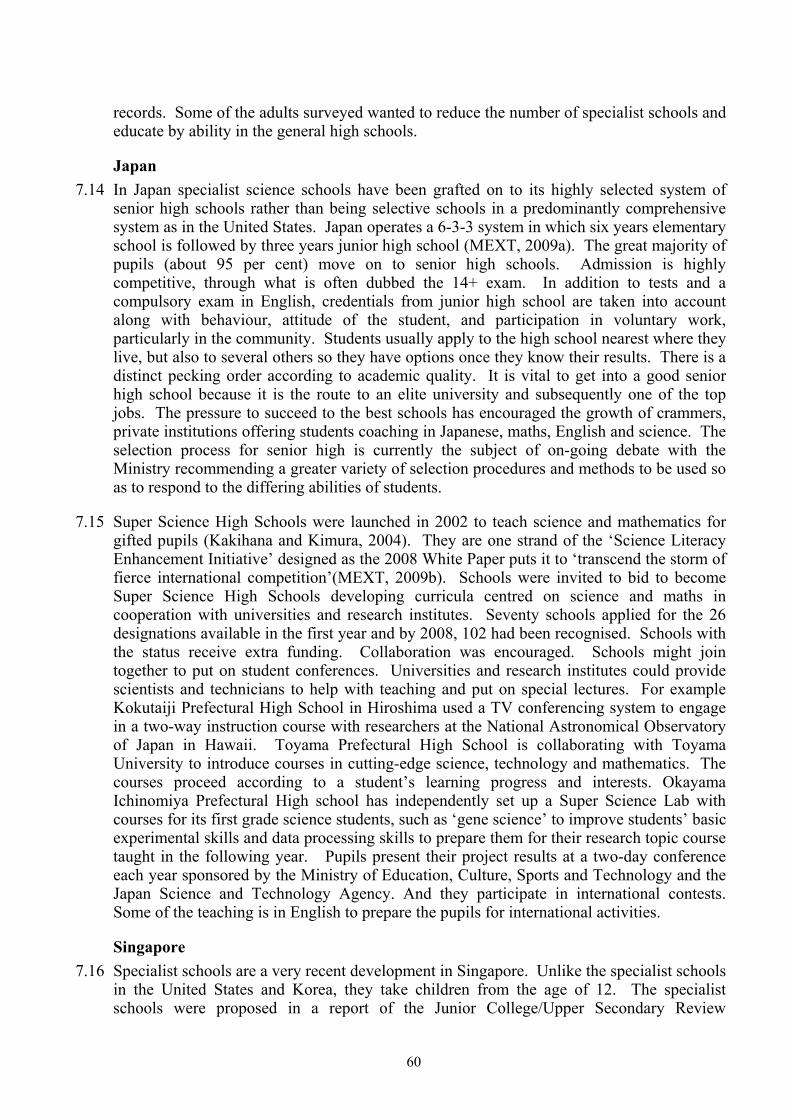
records. Some of the adults surveyed wanted to reduce the number of specialist schools and educate by ability in the general high schools.
Japan 7.14 In Japan specialist science schools have been grafted on to its highly selected system of
senior high schools rather than being selective schools in a predominantly comprehensive system as in the United States. Japan operates a 6-3-3 system in which six years elementary school is followed by three years junior high school (MEXT, 2009a). The great majority of pupils (about 95 per cent) move on to senior high schools. Admission is highly competitive, through what is often dubbed the 14+ exam. In addition to tests and a compulsory exam in English, credentials from junior high school are taken into account along with behaviour, attitude of the student, and participation in voluntary work, particularly in the community. Students usually apply to the high school nearest where they live, but also to several others so they have options once they know their results. There is a distinct pecking order according to academic quality. It is vital to get into a good senior high school because it is the route to an elite university and subsequently one of the top jobs. The pressure to succeed to the best schools has encouraged the growth of crammers, private institutions offering students coaching in Japanese, maths, English and science. The selection process for senior high is currently the subject of on-going debate with the Ministry recommending a greater variety of selection procedures and methods to be used so as to respond to the differing abilities of students.
7.15 Super Science High Schools were launched in 2002 to teach science and mathematics for gifted pupils (Kakihana and Kimura, 2004). They are one strand of the ‘Science Literacy Enhancement Initiative’ designed as the 2008 White Paper puts it to ‘transcend the storm of fierce international competition’(MEXT, 2009b). Schools were invited to bid to become Super Science High Schools developing curricula centred on science and maths in cooperation with universities and research institutes. Seventy schools applied for the 26 designations available in the first year and by 2008, 102 had been recognised. Schools with the status receive extra funding. Collaboration was encouraged. Schools might join together to put on student conferences. Universities and research institutes could provide scientists and technicians to help with teaching and put on special lectures. For example Kokutaiji Prefectural High School in Hiroshima used a TV conferencing system to engage in a two-way instruction course with researchers at the National Astronomical Observatory of Japan in Hawaii. Toyama Prefectural High School is collaborating with Toyama University to introduce courses in cutting-edge science, technology and mathematics. The courses proceed according to a student’s learning progress and interests. Okayama Ichinomiya Prefectural High school has independently set up a Super Science Lab with courses for its first grade science students, such as ‘gene science’ to improve students’ basic experimental skills and data processing skills to prepare them for their research topic course taught in the following year. Pupils present their project results at a two-day conference each year sponsored by the Ministry of Education, Culture, Sports and Technology and the Japan Science and Technology Agency. And they participate in international contests. Some of the teaching is in English to prepare the pupils for international activities.
Singapore 7.16 Specialist schools are a very recent development in Singapore. Unlike the specialist schools
in the United States and Korea, they take children from the age of 12. The specialist schools were proposed in a report of the Junior College/Upper Secondary Review
60
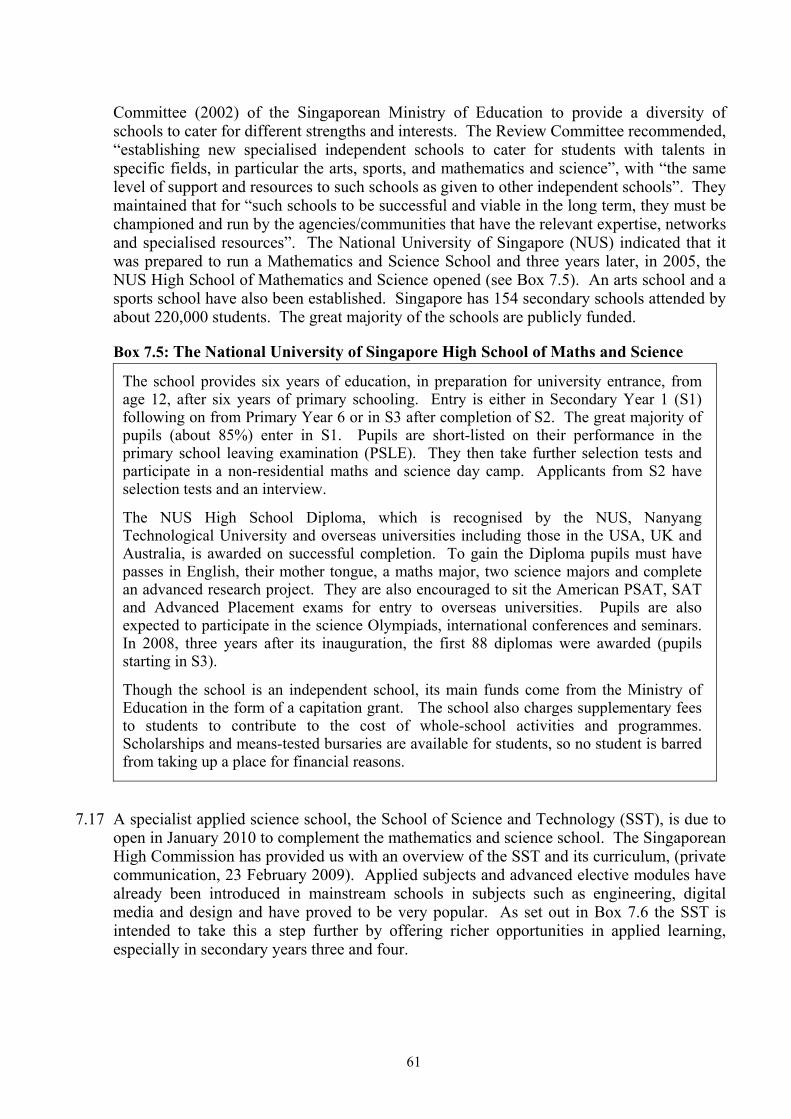
Committee (2002) of the Singaporean Ministry of Education to provide a diversity of schools to cater for different strengths and interests. The Review Committee recommended, “establishing new specialised independent schools to cater for students with talents in specific fields, in particular the arts, sports, and mathematics and science”, with “the same level of support and resources to such schools as given to other independent schools”. They maintained that for “such schools to be successful and viable in the long term, they must be championed and run by the agencies/communities that have the relevant expertise, networks and specialised resources”. The National University of Singapore (NUS) indicated that it was prepared to run a Mathematics and Science School and three years later, in 2005, the NUS High School of Mathematics and Science opened (see Box 7.5). An arts school and a sports school have also been established. Singapore has 154 secondary schools attended by about 220,000 students. The great majority of the schools are publicly funded.
Box 7.5: The National University of Singapore High School of Maths and Science
The school provides six years of education, in preparation for university entrance, from age 12, after six years of primary schooling. Entry is either in Secondary Year 1 (S1) following on from Primary Year 6 or in S3 after completion of S2. The great majority of pupils (about 85%) enter in S1. Pupils are short-listed on their performance in the primary school leaving examination (PSLE). They then take further selection tests and participate in a non-residential maths and science day camp. Applicants from S2 have selection tests and an interview.
The NUS High School Diploma, which is recognised by the NUS, Nanyang Technological University and overseas universities including those in the USA, UK and Australia, is awarded on successful completion. To gain the Diploma pupils must have passes in English, their mother tongue, a maths major, two science majors and complete an advanced research project. They are also encouraged to sit the American PSAT, SAT and Advanced Placement exams for entry to overseas universities. Pupils are also expected to participate in the science Olympiads, international conferences and seminars. In 2008, three years after its inauguration, the first 88 diplomas were awarded (pupils starting in S3).
Though the school is an independent school, its main funds come from the Ministry of Education in the form of a capitation grant. The school also charges supplementary fees to students to contribute to the cost of whole-school activities and programmes. Scholarships and means-tested bursaries are available for students, so no student is barred from taking up a place for financial reasons.
7.17 A specialist applied science school, the School of Science and Technology (SST), is due to open in January 2010 to complement the mathematics and science school. The Singaporean High Commission has provided us with an overview of the SST and its curriculum, (private communication, 23 February 2009). Applied subjects and advanced elective modules have already been introduced in mainstream schools in subjects such as engineering, digital media and design and have proved to be very popular. As set out in Box 7.6 the SST is intended to take this a step further by offering richer opportunities in applied learning, especially in secondary years three and four.
61
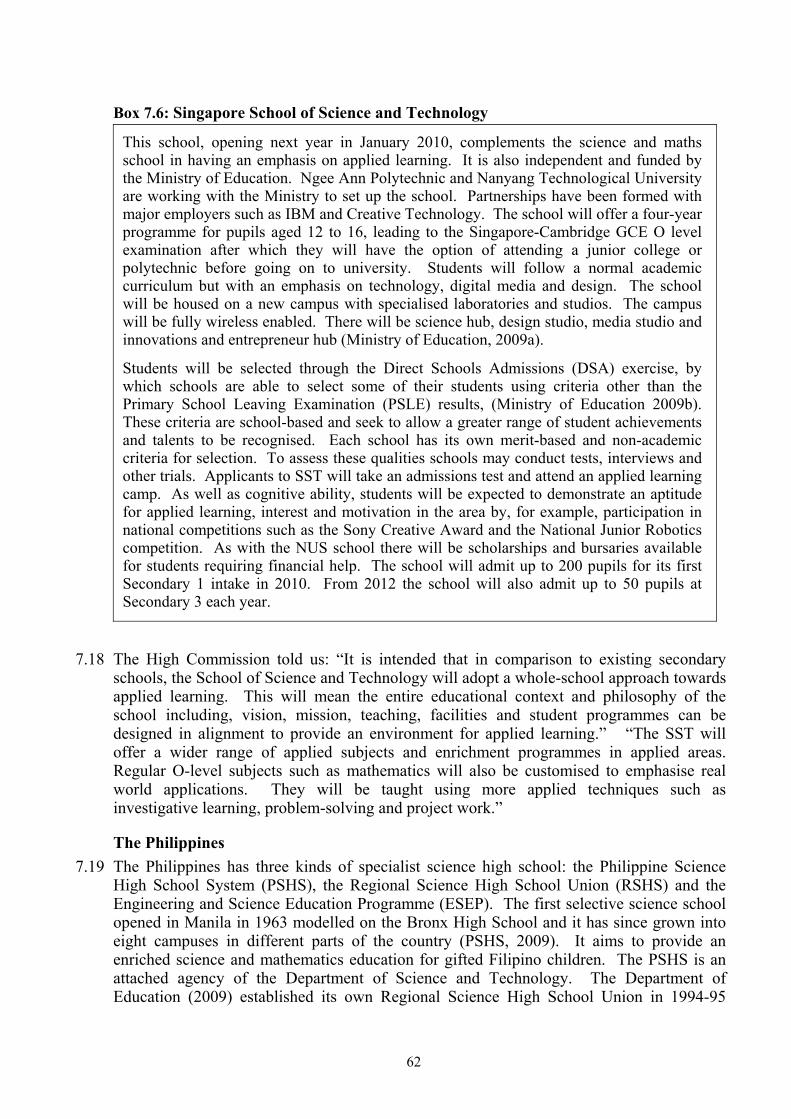
Box 7.6: Singapore School of Science and Technology
This school, opening next year in January 2010, complements the science and maths school in having an emphasis on applied learning. It is also independent and funded by the Ministry of Education. Ngee Ann Polytechnic and Nanyang Technological University are working with the Ministry to set up the school. Partnerships have been formed with major employers such as IBM and Creative Technology. The school will offer a four-year programme for pupils aged 12 to 16, leading to the Singapore-Cambridge GCE O level examination after which they will have the option of attending a junior college or polytechnic before going on to university. Students will follow a normal academic curriculum but with an emphasis on technology, digital media and design. The school will be housed on a new campus with specialised laboratories and studios. The campus will be fully wireless enabled. There will be science hub, design studio, media studio and innovations and entrepreneur hub (Ministry of Education, 2009a).
Students will be selected through the Direct Schools Admissions (DSA) exercise, by which schools are able to select some of their students using criteria other than the Primary School Leaving Examination (PSLE) results, (Ministry of Education 2009b). These criteria are school-based and seek to allow a greater range of student achievements and talents to be recognised. Each school has its own merit-based and non-academic criteria for selection. To assess these qualities schools may conduct tests, interviews and other trials. Applicants to SST will take an admissions test and attend an applied learning camp. As well as cognitive ability, students will be expected to demonstrate an aptitude for applied learning, interest and motivation in the area by, for example, participation in national competitions such as the Sony Creative Award and the National Junior Robotics competition. As with the NUS school there will be scholarships and bursaries available for students requiring financial help. The school will admit up to 200 pupils for its first Secondary 1 intake in 2010. From 2012 the school will also admit up to 50 pupils at Secondary 3 each year.
7.18 The High Commission told us: “It is intended that in comparison to existing secondary schools, the School of Science and Technology will adopt a whole-school approach towards applied learning. This will mean the entire educational context and philosophy of the school including, vision, mission, teaching, facilities and student programmes can be designed in alignment to provide an environment for applied learning.” “The SST will offer a wider range of applied subjects and enrichment programmes in applied areas. Regular O-level subjects such as mathematics will also be customised to emphasise real world applications. They will be taught using more applied techniques such as investigative learning, problem-solving and project work.”
The Philippines 7.19 The Philippines has three kinds of specialist science high school: the Philippine Science
High School System (PSHS), the Regional Science High School Union (RSHS) and the Engineering and Science Education Programme (ESEP). The first selective science school opened in Manila in 1963 modelled on the Bronx High School and it has since grown into eight campuses in different parts of the country (PSHS, 2009). It aims to provide an enriched science and mathematics education for gifted Filipino children. The PSHS is an attached agency of the Department of Science and Technology. The Department of Education (2009) established its own Regional Science High School Union in 1994-95
62
when 11 specialist schools were designated. There are now 17, one in each region. The schools offer a four-year course, after the end of compulsory elementary schooling, which concentrates on the science and mathematics for 12/13 to 15/16 year olds. Applicants are usually in the top ten per cent of the ability range and have to be recommended by their elementary school principal. There is a three-stage entry procedure: mental ability and aptitude tests; tests in science, mathematics and English; and the final stage, interviews with applicants and parents. There is another network of over 100 high schools specialising in science, both publicly and privately funded, which make-up the Engineering and Science Education Programme (ESEP) again supervised by the Department of Education. The curriculum in the ESEP schools is oriented to science and mathematics, but to a less demanding standard than in the other two types. Thus while it is possible to move from a PSHS or a RSHS school to an ESEP, transfer in the opposite direction is not possible.
Turkey 7.20 In Turkey after the end of compulsory schooling at age 14 pupils can choose to continue
their education at senior high school for another four years to age 18. There are six different types of public and private high school but the most prestigious are the publicly funded science high schools (Dogan, Oruncak and Gunbayi, 2002). In 2002 (the latest figures available) there were 54 of them, about one per cent of the total number of senior high schools and about 0.5 per cent of students. Entry is competitive. At the end of compulsory schooling applicants with good grades are eligible to sit the government entrance exam to obtain a place. The latest figures show that, in 2001, 247,821 students took the exam and about 1.5 per cent gained admission. Students attend for four years and study a broad science curriculum and foreign languages. The system of science high schools is well established in Turkey. The pioneer, Ankara Science High School, a public boarding school, was established in 1964 with funding from the Ford foundation. It is modelled on the Bronx Science High School in New York.
Australia 7.21 A rather different type of specialist science school has opened in Australia. It does not
select on academic ability, but is open to all those who can demonstrate an interest in science and maths. The Australian Science and Mathematics School (ASMS, 2008) opened in 2003 as a co-educational public school in new, purpose built premises on the campus of Flinders University in South Australia. The school, in partnership with the University, is responsible for leading the reform of science and maths education across South Australia. Pupils come from all over the state and overseas. In its first two years of operation the school enrolled 165 16- and 17-year-olds into Years 10 and 11. Subsequently in 2004 entry has been available to year 12 students. In total 252 were enrolled in 2008, a slight dip compared to the previous year.
7.22 In addition to curriculum innovation, such as the development of new courses, for example, in nanotechnology and biotechnology, the school provides professional development for teachers and outreach programmes to other schools. ASMS also puts on conferences, seminars and workshops for students and teachers. One of the goals of ASMS is to prepare students for university especially in the sciences and mathematics. The school’s most recent annual report, 2008, shows that 94% of all the graduates from Year 12 went on to tertiary study predominantly in the sciences and engineering.
63

Résumé 7.23 One solution to the science dilemma is to have specialist science schools for the especially
able. The United States, Korea, Japan, Singapore, the Philippines and Turkey are among those who have chosen this path. Specialist science schools can be highly selective. The Bronx High School of Science in New York takes 700 science students a year from over 25,00 applicants. The Seoul Science School in Korea is designed for the top three per cent, and the Regional Science High Schools in the Philippines for the top ten per cent. Admission can be by an entrance test as in New York, Japan and Turkey, or recommendation plus a battery of assessments as in Korea, Singapore, and the Philippines. The science schools tend to be high schools, but in Singapore entry is either at the age of 12 or 14. In the Philippines it is from age 12. The schools can be established by individual initiative or government policy. The Bronx High School was established in 1938 by the Board of Education in New York and has been the inspiration for science schools in the Philippines and Turkey. Japan created science schools through a bidding process among its high schools. Singapore encouraged its National University to take the lead. Australia has a specialist science school attached to Flinders University, but unusually it selects on interest in science rather than ability, and is a test bed for curriculum development. Research in the United States found that science schools are “highly effective at producing graduates not only with high levels of aptitude in STEM, but who go on to further study and careers in STEM. The individual records of these schools are impressive with the Bronx High counting six Nobel laureates among its former pupils.
64

8. National Strategies and Initiatives 8.1 Selective Science Schools are not the only way in which countries have responded to
the generally felt imperative, stemming from the Lisbon Strategy/Agenda/Process and elsewhere, to encourage interest in science and technology and increase the number of science professionals. There have been broad national strategies and a variety of initiatives. Physics tends not to be targeted specifically, but is part of the general drive to increase interest and performance in science.
• National Strategies, e.g. the Netherlands and Japan.
• Science for the Gifted, e.g. Chapter 7 and the Netherlands.
• Science for All, e.g. France, Norway and Iceland.
• Course Structures, e.g. Eire.
• Curriculum Content, e.g. Finland.
• Teachers, eg Japan, Norway, Iceland, and Finland.
• Wider Participation, e.g. United States and European Union.
Britain has its own versions of most of these approaches. In this chapter we describe how they have been implemented in other countries and, in the next, we ask what lessons can be drawn.
National Strategies 8.2 Both the Netherlands and Japan have recently embarked on wide-ranging national
strategies aimed at improving participation and performance in STEM subjects. Both have science schools as part of that strategy, but in different roles. We have already encountered Japan’s Super Science High Schools for the gifted in Chapter 7. In the Netherlands ‘Universum’ science schools have been funded as catalysts for improving science for all.
Netherlands 8.3 Taking its cue from the Lisbon Agenda, in 2004 the Dutch government “formulated
its ambition to become a prominent knowledge economy and a leader in the areas of education, research and innovation” and “to be economically competitive and socially innovative” (Ministry of Economic Affairs, 2006). The Netherlands has experienced some of the sharpest falls in science and technology participation in recent years. As part of a general drive to reverse this trend, the Dutch government launched in 2004 a National Action Plan on Science and Technology (the Delta Plan). Taking the level reached in 2000 as a baseline, the aim of the Plan is to increase enrolment and progression through maths, science and technology by 15 per cent by 2010. A Science and Technology Platform (Platform Bèta Techniek, 2009) has been set up to develop programmes throughout the education system, tailored to various sectors of education and the labour market.
8.4 There are three strands to secondary education in the Netherlands - VWO, HAVO and VMBO are the acronyms for long Dutch names. VWO schools lead to the top research universities, HAVO schools to the polytechnics and the VMBO to
65
employment qualifications. Primary schools advise parents as to the type of secondary education most suited to their child on the basis of performance in a national test taken in the final year of primary education and on teacher assessment. In 2007, in the final year of compulsory schooling, 23.5 per cent were at VWO, 31.9 per cent, HAVO and 44.5 per cent on VMBO programmes. In upper secondary education VWO students specialise for three years and HAVO students for two years in one of four subject clusters (profielen): science and technology; science and health; economics and society; and culture and society. These emphasize particular fields within a general education and prepare pupils for higher education. In the science and technology cluster physics is a compulsory subject along with chemistry and mathematics. (There is some physics also in the science and health cluster, but here it is optional.)
8.5 Platform Bèta Techniek is a foundation with an independent board and receives government funding of about 60 million euros a year. The organisation advises the government on maths, science and technology issues in education and works in close collaboration with schools, higher education and industry. Prior to 2004 there was no clearly defined policy in relation to schools. According to Vermeulen (2008), a senior policymaker for the Science and Technology Platform, and from whom much of the following description has been taken, there had been many good initiatives but they were largely uncoordinated and there was no cooperation with business. The Delta Plan applies an integrated strategy throughout from primary education through to the labour market, with responsibility shared between education, business and government. Its implementation is based on a yearly plan approved by the Ministries of Education, Economic Affairs and parliament. The Plan incorporates a number of strands covering different sectors of education: in schools at the primary level there is VTB - ‘Broadening Technology in Primary Education’ programme; at the secondary level for the HAVO and VWO pathways there is the development of ‘Universum’ or science schools; for vocational education, VMBO and beyond, there is the ‘Ambitie’ or Ambition programme; the ‘Sprint’ programme focuses on higher education; and ‘Jet-Net’ on business education links.
Primary Education 8.6 VTB is intended to improve young children’s attitudes towards science and
technology. The programme focuses on helping primary schools integrate science and technology into their teaching. Over a three-year period the schools receive financial, organisational and subject specific support. By 2008 one third, (2,530 out of 7,500) of primary schools were participating. An additional element of the programme VTB Plus involves in-service training for 5,000 primary school teachers and 5,000 teacher trainees.
Science Schools 8.7 In general secondary education the development of ‘Universum’ schools aims to
establish innovation in maths, science and technology as part of the school’s policy. More specifically the programme is targeted at increasing enrolment in the ‘science profile’ for HAVO and VWO. The ‘profile’ is a combination of the science subject clusters, ‘science and technology’ and ‘science and health’. Schools are offered a framework for success based on a number of themes, for example, curriculum innovation, organisational change, professional development and collaborative
66
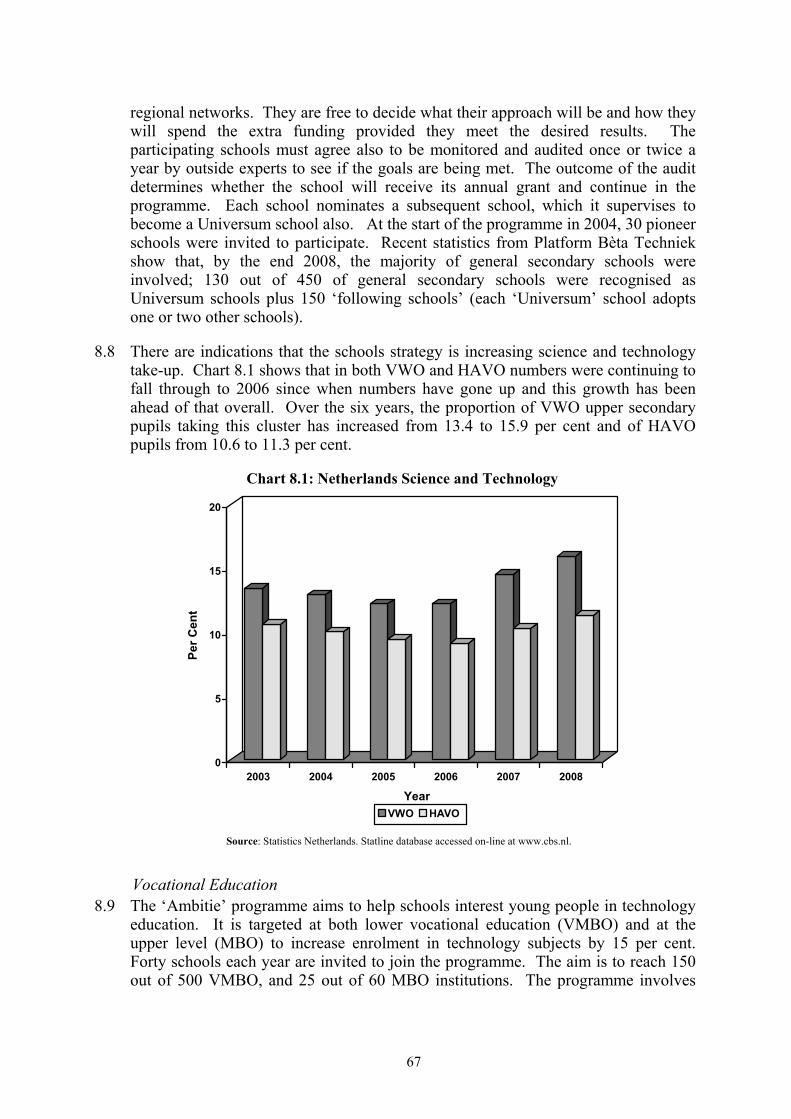
regional networks. They are free to decide what their approach will be and how they will spend the extra funding provided they meet the desired results. The participating schools must agree also to be monitored and audited once or twice a year by outside experts to see if the goals are being met. The outcome of the audit determines whether the school will receive its annual grant and continue in the programme. Each school nominates a subsequent school, which it supervises to become a Universum school also. At the start of the programme in 2004, 30 pioneer schools were invited to participate. Recent statistics from Platform Bèta Techniek show that, by the end 2008, the majority of general secondary schools were involved; 130 out of 450 of general secondary schools were recognised as Universum schools plus 150 ‘following schools’ (each ‘Universum’ school adopts one or two other schools).
8.8 There are indications that the schools strategy is increasing science and technology take-up. Chart 8.1 shows that in both VWO and HAVO numbers were continuing to fall through to 2006 since when numbers have gone up and this growth has been ahead of that overall. Over the six years, the proportion of VWO upper secondary pupils taking this cluster has increased from 13.4 to 15.9 per cent and of HAVO pupils from 10.6 to 11.3 per cent.
Chart 8.1: Netherlands Science and Technology
0
5
10
15
20
Per C
ent
2003 2004 2005 2006 2007 2008
YearVWO HAVO
Source: Statistics Netherlands. Statline database accessed on-line at www.cbs.nl.
Vocational Education 8.9 The ‘Ambitie’ programme aims to help schools interest young people in technology
education. It is targeted at both lower vocational education (VMBO) and at the upper level (MBO) to increase enrolment in technology subjects by 15 per cent. Forty schools each year are invited to join the programme. The aim is to reach 150 out of 500 VMBO, and 25 out of 60 MBO institutions. The programme involves
67

strong collaboration with other organisations and businesses. As with the Universum schools monitoring and audit is an important part of the programme.
Higher Education 8.10 In higher education the ‘Sprint’ programme offers advice, support and expertise to
universities (WO) and the higher professional institutes (HBO). By 2008 all ten WO and 18 HBO were involved. Additional activities associated with this programme include a teacher mobility scheme between schools and universities, and a student- pupil mentoring scheme helping pupils unsure what to study in the last two years of secondary education. The government wants ‘Sprint’ to deliver a 15 per cent increase in enrolment in maths, science and technology in 2007 compared to 2000 and a 15 per cent increase in graduate output by 2010.
Business Links 8.11 A further development, ‘Jet-Net’ puts major Dutch companies in touch with schools
to offer advice and support for the curriculum, and to help pupils gain a better understanding of careers in science and technology. There are a number of national events such as Jet-Net Career Day, Jet-Net Teachers’ Day and Jet-Net Girls’ day. Other activities, involving collaboration between schools, include workshops, guest lectures and conferences. In 2002, when Jet-Net started, five companies were involved. By 2008 there were 35 linked with 150 schools.
Japan 8.12 Japan launched a Science Literacy Enhancement Initiative in 2002 with two
overarching aims: to improve pupil’s interest in science and technology and to “develop talented children’s individuality and capabilities”. It has a number of strands (MEXT, 2009b).
Science Partnership Programme 8.13 The Partnership Programme aims to promote interest in science and technology
through collaboration between universities, science centres, museums and other scientific bodies and the elementary, junior and senior high schools. It encourages activities, such as observations and experiments supervised by researchers, training of teachers for such lessons, and special courses and attendance at science camps. In 2008 about 90,000 students were expected to take part in 1,077 projects approved by the Japan Science and Technology Agency. Three-day camps for students from high schools and technical colleges are held in universities and science centres during the school holidays, which include hands-on sessions and discussions with scientists.
Science and Mathematics Literacy Enhancement Model Area Programme. 8.14 Based on proposals from local government, this programme aims to combine local
educational resources to foster pupils’ intellectual curiosity about science. The initiatives include the development and utilisation of localised science and mathematical educational materials based on the collaboration of schools, universities, science museums and the co-operation of teachers, museum employees, researchers and local volunteers. The programme is being trialled in 20 regions.
68

Enhancement of Facilities, Equipment and Materials 8.15 Based on the Act for Promotion of Science Education, efforts are underway to
systematically enhance the facilities and equipment used in all phases of schooling. There is insufficient equipment in schools and much of it is out-dated. The Japan Science and Technology Agency (JST) is developing the use of advanced digital materials for science and technology education in schools. JSA provides materials and equipment to schools nationwide and conducts demonstration tests and pilots the equipment for use in schools
Super Science High Schools 8.16 Within the programme to promote interest in science and technology Japan, as we
have seen, has funded some schools to become Super Science High Schools to promote the development of talented children’s individuality and capabilities. With support from the Ministry (MEXT) and the JSA, the science schools provide an enriched curriculum in science and technology and mathematics; conduct lessons in English; develop teaching methods and materials to enhance creative and independent thinking; participate in international competitions; and collaborate with other high schools in the community and with the universities, research institutes and businesses.
Japan Science and Technology Agency 8.17 The JSA (2009) has a wide range of projects to foster the next generation of leaders
and promote public understanding of science and technology. It is encouraging high-school students and even younger children to take part in international science and technology competitions in seven fields - maths, chemistry, biology, physics, informatics, robotics and theme research in order to provide them with opportunities to experience advanced learning. The Agency also provides support in collaboration with the universities and science centres and Boards of Education for training courses in maths and science for junior and senior high school teachers. The courses are focussed on the problem-solving approach including field observations and experiments. The courses are mandatory for all science teachers in public junior high schools. The Agency also sponsors the Science Education Assistant Allocation Project. University students, retired educators, experts in local communities, former researchers, engineers, business men provide expertise and advice to elementary school students and teachers, mainly in Grades 5 and 6.
Science for the Gifted 8.18 As we saw in Chapter 7 a number of countries provide science education for the
especially able in specialist science schools. In others the gifted are catered for through masterclasses (Adamczyk and Willson, 2004) or enrichment projects (Taber and Riga (2006). But against the background of the Universum schools, Utrecht University has arrived at a somewhat different model of specialised provision. The University and 26 VWO schools joined together to form the Junior College Utrecht, JCU (Valk, Berg and Eijkelhof, 2007). It has two purposes: first to offer a challenging science education to talented 17-18 year-olds (grades 11 and 12) in an academic environment; and, secondly, to be a laboratory for innovation in school science. Pupils attend Utrecht University for two days a week for science and other lessons and the partner schools for three for the rest of the curriculum. Science teaching is provided by university and school staff. Pupils are selected first by their
69
schools and then through intake interviews. In its pilot year, 2004, 75 gifted pupils were selected by their schools to apply, and 23 students from 13 schools were accepted. They completed in 2006. Of the 23, 19 went to university, 18 to do science and one economics, and four took gap years. Of the 19, eight went to Utrecht and 11 to other universities, including six who wanted to study engineering which Utrecht does not do. The target figure for each cohort is now 50 making 100 pupils in all. Although more schools are wanting to join the costs are substantial and the current plan is to keep the intake to 100 and adapt the JCU enrichment materials so that the gifted and talented can be provided for in their regular schools.
Science for All 8.19 Other strategies and initiatives emphasize science for all. Initiatives can be
voluntary or government-led; target the young or a spread of ages.
Les Petits Débrouillards 8.20 This is a voluntary creative science scheme, which aims to make science interesting
and fun for children. Originally founded in Quebec in 1981 it has spread to over 15 other countries including France, Germany and Belgium. The association organises science-based activities for children out of school time and in the school holidays. The children meet up together, often on a weekly basis and carry out experiments. They also get involved in other activities such as Science Days (Fêtes de la Science). In France the association is present in most regions where it provides specific training for over 3,000 volunteers every year, teachers, educators and scientists, to demonstrate science to children, some of whom have just started school. The French Association’s activities are overseen by a national committee of eminent scientists, including Nobel laureates, who ensure the activities and training offered are scientifically rigorous. In 2005 volunteers from France visited Liverpool (Liverpool City Council, 2005) in the UK to train volunteers on running workshops. They were taught simple demonstrations illustrating basic scientific laws like gravity, density and surface tension, for example, how to create a fountain with a glass of water and straw, how to make pepper dance and how to blow up a balloon without breathing in to it.
Norway 8.21 In 2006 the Ministry of Education and Research (MER, 2006) announced a major
policy initiative to tackle the shortfall in expertise in mathematics, science and technology (MST). Core elements of the policy were aimed at increasing competence in MST, increasing recruitment to MST and instilling positive attitudes to MST in everyone in education and among the general public. It was conceived as an overarching strategy covering the whole of education through into everyday life. A national forum was convened including business, industrial associations, the labour unions, the education sector and other non-government organisations to take part in a national dialogue about the education system and MST competence. It was recognised that there would be a need at the local level for education, trade and industry to co-operate and interact, in other words a joint promotion. It was decided the strategy would run for three years from 2006 to 2009. After which it would be evaluated to decide whether the strategy should be continued in whole or part and what changes would be required. There are annual action plans against which the strategy is monitored.
70

8.22 There is an extensive list of goals and sub-goals.
• Strengthen MST in kindergartens and primary and secondary education (one of the six sub-goals is to increase the number of instruction hours in MST in primary and lower secondary school and another to increase recruitment to the programme subject areas in upper secondary, especially among girls.)
• Improve teachers’ qualifications and teacher training (e.g. increase the recruitment of students in teacher training who chose MST with particular emphasis on the natural sciences; improve teachers’ qualifications in MST through targeted continuing education and training of teachers).
• Development of MST in higher education and research (e.g. increase recruitment of students to programmes of study in MST and engineering at universities and colleges; improve the quality of instruction in MST in higher education and increase student’s motivation to learn and sense of relevance of MST).
• Provide Norwegian working life with the MST competence that is needed (e.g. promote the development of centres of excellence where Norway has especially favourable conditions for competing internationally; try out models for careers counselling with emphasis on MST).
• Increase the MST competence and improve the communication to the general public (e.g. increase the MST competence among decision-makers and the media; develop arenas for experiencing and learning MST competence outside the school).
8.23 To help judge the success of the strategy each goal and its associated sub-goals have ‘indicators’ or targets to be met. The target for strengthening MST in schools is that Norway should score in the top third compared to other OECD countries. On teaching, the target is that the number of teachers in primary and lower secondary school with high qualifications in MST (60 credits) should have increased by 20 per cent by 2009.
Iceland 8.24 Following the Lisbon Agenda, a key aim of the Ministry of Education in Iceland has
been to increase the number of students studying the maths, science and technology, though no specific targets have been published. Iceland is a small country with a population of less than a third of a million (315,459 in 2008). There are only 34 upper secondary schools (lower secondary is combined with primary), of which nine are grammar schools and seven private. All pupils have a legal right to upper secondary education which normally lasts four years from age 16 to 20, and the staying-on rate is around 90 per cent, though with high dropout particularly from the vocational lines. There are four branches of study: academic; artistic; vocational and a shorter programme of 1-2 years for pupils who need further preparation or are undecided. The academic strand offers a choice of five programmes: natural sciences; social sciences; foreign languages; business and economics; and ICT (currently being trialled). Each programme consists of a core of about 70 per cent, with 21 per cent devoted to elected fields, and 9 per cent free selection. Those
71
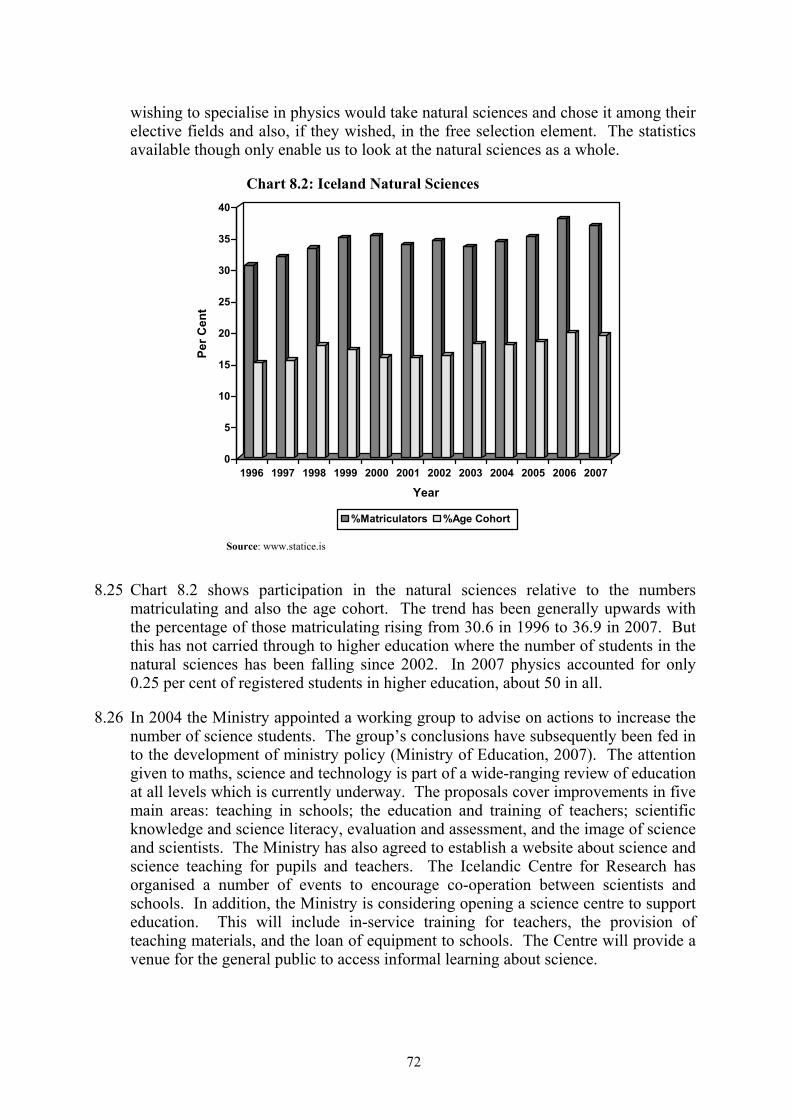
wishing to specialise in physics would take natural sciences and chose it among their elective fields and also, if they wished, in the free selection element. The statistics available though only enable us to look at the natural sciences as a whole.
Chart 8.2: Iceland Natural Sciences
0
5
10
15
20
25
30
35
40Pe
r Cen
t
1996 1997 1998 1999 2000 2001 2002 2003 2004 2005 2006 2007
Year
%Matriculators %Age Cohort
Source: www.statice.is
8.25 Chart 8.2 shows participation in the natural sciences relative to the numbers matriculating and also the age cohort. The trend has been generally upwards with the percentage of those matriculating rising from 30.6 in 1996 to 36.9 in 2007. But this has not carried through to higher education where the number of students in the natural sciences has been falling since 2002. In 2007 physics accounted for only 0.25 per cent of registered students in higher education, about 50 in all.
8.26 In 2004 the Ministry appointed a working group to advise on actions to increase the number of science students. The group’s conclusions have subsequently been fed in to the development of ministry policy (Ministry of Education, 2007). The attention given to maths, science and technology is part of a wide-ranging review of education at all levels which is currently underway. The proposals cover improvements in five main areas: teaching in schools; the education and training of teachers; scientific knowledge and science literacy, evaluation and assessment, and the image of science and scientists. The Ministry has also agreed to establish a website about science and science teaching for pupils and teachers. The Icelandic Centre for Research has organised a number of events to encourage co-operation between scientists and schools. In addition, the Ministry is considering opening a science centre to support education. This will include in-service training for teachers, the provision of teaching materials, and the loan of equipment to schools. The Centre will provide a venue for the general public to access informal learning about science.
72
Course Structures Eire
8.27 A transitional year has been made available in Ireland between completing the three-year Junior Certificate and moving on to the two years of the Leaving Certificate. Unlike most countries Eire had five years of secondary education and the extra year seems to have been first brought in to put the country on the same footing as most other European countries. It was rolled out nationally in 1994. The Institute of Physics in Ireland provides a programme of support for the Transition Year. It lists universities and institutes that offer placements, work experiences and lectures. It publishes a set of 18 profiles of the ‘day in the life’ of various working physicists and has compiled a directory of employers that offer work placements or transition year programmes. It also publishes an annual leaflet of where physics can be studied at the third school level in Ireland. There are also links to transition year physics modules and project ideas. The transition is not examined but is assessed (although it cannot be failed) and its role is intended to be as a broad educational experience. Just how far the Institute of Physics programme to orientate pupils to physics has succeeded seems not to have been evaluated. But we did note in Chart 3.7 that physics entries in the Leaving Certificate have continued to drift downwards, though at a slower rate than ten years ago.
Curriculum Reform Finland
8.28 By the mid-nineties there was growing concern in Finland that the level of mathematical and scientific knowledge and expertise was below that of other countries. In 1996, the government through the Ministry of Education and the National Board of Education launched the Joint National Action LUMA programme (acronym of the Finnish words for natural sciences and mathematics) to develop the teaching in those subjects. Targets were set to increase the numbers: choosing the natural sciences and technology in the universities and polytechnics; taking advanced mathematics; choosing physics and chemistry tasks in the matriculation examination; maths and science teachers across all phases of schooling - and also gender equality.
8.29 The programme was also expected to increase the knowledge and skills of teachers and pupils in mathematics and the natural sciences, and particularly so in vocational education in relation to different occupations and for further study. Citizens would also have the opportunity to acquire the mathematical and scientific knowledge they needed. At upper secondary level a specific target for physics was to increase the numbers taking physics tasks in the general studies test section of the matriculation examination to 9,000, revised in 1998 to 12,000, (chemistry target 9,000 revised to 8,000 and the advanced syllabus in mathematics to 17,000 revised to 16,000). The targets for biology and physical geography (subjects included in the definition of natural sciences in Finland) were to remain at about 15,000. In addition, the intention was that more than 10,000 of those who completed upper secondary school education would have taken at least six advanced courses in physics and more than 8,000, three advanced courses in chemistry. Chart 3.9, page 21, however shows the numbers of pupils fell in the ten years to 1998.
73
8.30 An international evaluation of LUMA (Allen, Black and Wallin, 2002), while acknowledging the successes of the programme, did not recommend its continuation but suggested several ideas for future action. These included a review of the mathematics and science curricula so that they were more attractive and relevant to pupils and restructuring of the general studies section of the matriculation examination as well as other changes.
Teachers 8.31 In a report for McKinsey & Co, Barber and Mourshed (2007) asked how it was that
the top ten performing countries and provinces for education in the PISA and TIMSS comparisons (Alberta, Australia, Belgium, Finland, Hong Kong, Japan, Netherlands, New Zealand, Ontario, Singapore and South Korea) were performing better than the others. Of the things which they considered (they did not look at the curriculum or pedagogy), the three which mattered most were:
1) “getting the right people to become teachers;
2) developing them into effective instructors; and,
3) ensuring the system is able to deliver the best possible instruction for every child.”
They found that the top-performing systems recruit their teachers from the top third of graduates - top five per cent in South Korea, top ten per cent in Finland and top 30 per cent in Singapore and Hong Kong.
8.32 In our examples of national strategies for improving participation and performance in science subjects, most had a strand devoted to teachers and teaching. In Japan, the Science and Technology Agency provided courses which were mandatory for all science teachers in junior high schools in maths, science and technology. A major strand Norway’s strategy is to improve teachers’ qualification and teacher training. Even in Finland where the teachers come from among the top graduates in its LUMA project sought to increase the number of maths and science teachers across all phases of schooling.
8.33 Among the sciences the recruitment of physics teachers is especially problematic. It seems that the satisfactions of physics do not sit easily with the satisfactions of teaching (Smithers and Hill, 1989). Whereas physics is about abstract, numerical, impersonal patterns, teaching offers the pleasure of interacting with the somewhat messy world of young people and attending to their individual wants and needs. It is not that there aren’t people who enjoy both only that they are much less common than in English, the social sciences and biology. Chart 8.3 based on the 2007 TIMSS science comparisons shows that across a wide range of countries 14-year-olds are less likely to be taught by physicists than biologists or chemists. In the United States, Norway and Italy, less than ten per cent of the science teaching was by those with physics as a specialism. At the other end of the scale it was over 40 per cent in Sweden, Singapore and Chinese Taipei. England, in fact, is not very different from the international average in this respect, but at 64 per cent it is second only to Tunisia in the proportion of science lessons taught by biologists.
74
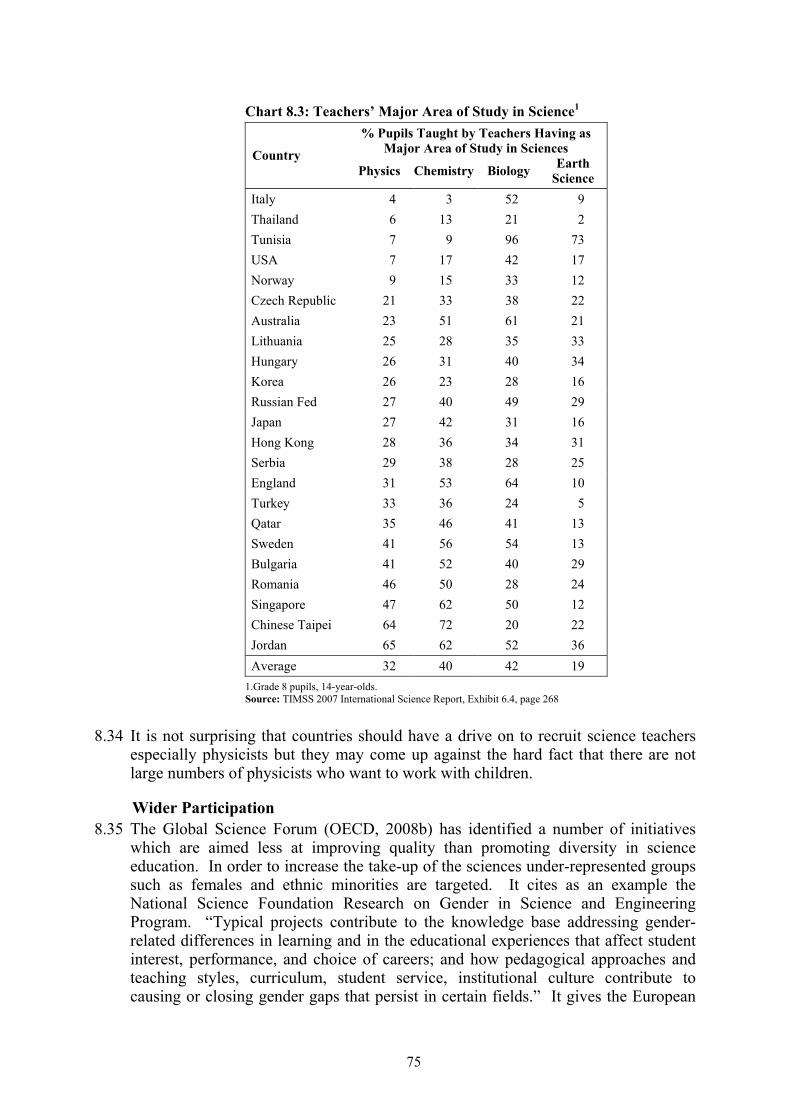
Chart 8.3: Teachers’ Major Area of Study in Science1 % Pupils Taught by Teachers Having as
Major Area of Study in Sciences Country Physics Chemistry Biology Earth
Science Italy 4 3 52 9 Thailand 6 13 21 2 Tunisia 7 9 96 73 USA 7 17 42 17 Norway 9 15 33 12 Czech Republic 21 33 38 22 Australia 23 51 61 21 Lithuania 25 28 35 33 Hungary 26 31 40 34 Korea 26 23 28 16 Russian Fed 27 40 49 29 Japan 27 42 31 16 Hong Kong 28 36 34 31 Serbia 29 38 28 25 England 31 53 64 10 Turkey 33 36 24 5 Qatar 35 46 41 13 Sweden 41 56 54 13 Bulgaria 41 52 40 29 Romania 46 50 28 24 Singapore 47 62 50 12 Chinese Taipei 64 72 20 22 Jordan 65 62 52 36 Average 32 40 42 19
1.Grade 8 pupils, 14-year-olds. Source: TIMSS 2007 International Science Report, Exhibit 6.4, page 268
8.34 It is not surprising that countries should have a drive on to recruit science teachers especially physicists but they may come up against the hard fact that there are not large numbers of physicists who want to work with children.
Wider Participation 8.35 The Global Science Forum (OECD, 2008b) has identified a number of initiatives
which are aimed less at improving quality than promoting diversity in science education. In order to increase the take-up of the sciences under-represented groups such as females and ethnic minorities are targeted. It cites as an example the National Science Foundation Research on Gender in Science and Engineering Program. “Typical projects contribute to the knowledge base addressing gender-related differences in learning and in the educational experiences that affect student interest, performance, and choice of careers; and how pedagogical approaches and teaching styles, curriculum, student service, institutional culture contribute to causing or closing gender gaps that persist in certain fields.” It gives the European
75
Commission’s project on Raising Awareness of Science and Technology Among Ethnic Minorities an example of an initiative designed to promote ethnic diversity. It was “based on a multi-level programme of activities, encompassing after-school sessions, info-days, seminars, consultative panels and exhibitions”. It is not all ethnic minorities, however, that are under-represented. As might be guessed from the performance of different countries Chinese and Indian children do well both generally and in the sciences, outscoring white British (DCSF, 2007). The Global Science Forum acknowledges the challenge. “The factors that affect (subject) choices and success…are difficult to act upon, and sometimes it is extremely hard even to distinguish the factors linked to gender, and ethnicity in particular from other socioeconomic factors, as a number of complex interactions are involved.”
Résumé 8.36 Specialist science schools are not the only means by which countries have sought to
enhance science participation and performance. There have been a range of national strategies and a variety of initiatives, some directed at the especially talented, but most concerned to raise levels overall. The Netherlands has a comprehensive National Action Plan ranging from primary school through to business links which aims to raise participation in maths, science and technology by 15 per cent over the ten years from 2000. Some grammar schools are funded as science schools to act as catalysts, but there is also a university-based consortium at Utrecht University providing for the 100 most gifted science pupils in partner schools. Japan has a Science Literacy Enhancement Initiative with the twin aims of raising interest and developing talented children’s individuality and capabilities.
8.37 A number of initiatives focus on teachers, recruiting more with science specialisms and improving training and support in employment. Attracting sufficient physics teachers is a problem experienced by many countries. In Italy, the United States and Norway less than ten per cent of 14-year-old pupils are taught by a teacher whose main area in science is physics. England is second only to Tunisia in the proportion of science teaching in the hands of biologists. Some initiatives have been directed to the curriculum, course structures and qualifications. The United States seems to have increased physics take-up by making more science a requirement for high school graduation. There are voluntary and out-of-school initiatives such as Les Petits Débrouillards which aims to make science interesting and fun for young children. It began in Quebec and has now spread to 15 countries. Not all initiatives have raising performance as their focus: a number are devoted to increasing diversity, like the American National Science Foundation Research on Gender in Science and Engineering Programme and European Commission’s Raising Awareness of Science and Technology Among Ethnic Minorities.
76

9. Policy Implications 9.1 The British government has become concerned at the continuing drop in A-level
physics entries and has set as a target that they will be increased to 35,000 by 2014 (DCSF, 2009a). This is a tall order. It represents an increase of some 20 per cent on the 2009 figure of 29,436. But it is not impossible since it would take entries back to the level they were at in 1995. The government is also seeking to boost chemistry and maths A-levels entries.
Current Policies 9.2 The strategy for achieving these increases has it roots in the Science and Innovation
Investment Framework 2004-14 and Science and Innovation Investment Framework 2004-14 Next Steps (HM Treasury 2004 and 2006). This led to the establishment of a Science, Technology, Engineering and Mathematics (STEM) programme underpinned by a High Level Strategy Group. The policies to improve physics participation and performance as they stood in March 2009 (DCSF, 2009a) include extra funding, a marketing campaign, incentives to train as teachers, more physics teachers, professional development for science teachers, and promotion of the three separate sciences at GCSE.
• Funding - £140 million strategy announced in January 2008 over the period 2008-11 doubling the amount spent in the previous three years.
• Publicity - campaign in the broadcast media to highlight the opportunities studying science subjects can open up.
• Incentives to Train - teacher training bursaries for maths and science of £9,000, ‘golden hellos’ of £5,000, and payments of additional £1,000 to teacher training providers for each physics and chemistry trainee teacher they recruit.
• More Physics Teachers - by 2014 the target is for 25 per cent of science teachers to have a specialism in physics compared with the 19 per cent which it is held to be at present.
• Professional Support - In partnership with the Wellcome Trust the DCSF has set up a national network of Science Learning Centres to provide professional development for science teachers, technicians and educators.
• Triple Science - from September 2008 all pupils achieving at least a level 6 at Key Stage 3 are entitled to study the three individual sciences for GCSE.
• School Science Strategy - the DCSF listing of science and mathematics policies does include the National Science Strategy, but the 2009 White Paper (DCSF, 2009b) has signalled the intention to phase it out. Science has been a strand in the Secondary National Strategy (originally Key Stage 3 Strategy) since 2001. It is structured around learning objectives and offers guidance on ‘key lines’ of progression and pupil tracking. It
77

links to a subject, curricular and pedagogic knowledge bank. It is non-statutory but it is backed by school inspections and schools have often treated it as compulsory. The DCSF claims that the strategy has contributed to both improved GCSE science results and a high ranking in the TIMSS 2007 science comparisons. Arguing that the programme is now ‘well embedded’, the DCSF in the White Paper announced the intention to switch from “centrally driven support programmes” to a “more tailored approach”.
Higher Education 9.3 The Brown government split higher education from school education and so far we
have considered only those science policies within the remit of the Department of Children Schools and Families. When school and higher education were in the one department, the Secretary of State for Education and Skills (as it was then) wrote in December 2004 to the Higher Education Funding Council for England requesting the Council’s view on “whether there are any higher education (HE) subjects or courses that are of national strategic importance, where intervention might be appropriate to enable them to be available …and the types of intervention which it believes could be considered. In response HEFCE set up a Strategically Important Subjects Advisory Group (HEFCE, 2008c). The STEM subjects were among those identified as vulnerable and over the seven years 2005-06 to 2011-12, among other things, extra funding has been/is being provided (HEFCE, 2008b):
• £100 million to support very high cost and vulnerable science;
• £29 million for addition student numbers (to date) for STEM subjects;
• £76 million for demand-raising and capacity building work in STEM;
• In physics specifically HEFCE has provided funding to promote regional collaborations between universities, including the South East Physics Network, the Midlands Physics Alliance and Great Western Research (HEFCE, 2008a).
9.4 The government also announced in summer 2009 that an extra 10,000 places for physics and other core STEM subjects (but excluding psychology, sports science and other popular subjects). However, although the universities would be able to charge tuition fees they would not receive the extra unit of resource to fund the places. A number of the pre-1992 universities declined their allocations and these numbers have been reallocated (STEM News, 2009).
Future Directions 9.5 Given the wide raft of policies one wonders what more could be done. But the
government is not satisfied. In 2008 it conducted a consultation on science and society as a result of which a Science and Learning Expert Group was set up under Sir Mark Walport, Director of the Welcome Trust (as one of five groups including one on science for all). The Expert Group’s remit as set out in a joint letter from DIUS and DCSF (2009) was to consult and make recommendations on science
78
learning for under-19s to ministers and relevant independent bodies. Paraphrasing, it was asked to advise on how:
• to build on the existing STEM programme “focusing in particular on how to extend the availability and take-up of opportunities for stretch and challenge of the most able learners”;
• “HE should engage with developments in school science curricula, qualifications and teaching to encourage smoother progression to HE STEM courses”;
• “to increase the numbers doing science A-levels”.
9.6 In taking these forward, the Expert Group identified three main strands (BIS, 2009):
• stretch and challenge for the more capable, including how to increase the numbers of young people taking science A-levels;
• partnerships between schools, universities and businesses - which must be real and enduring;
• professional development and teaching standards - historically the number of specialist science teachers in mainstream schools with sufficient in-depth subject knowledge to stretch and challenge the brightest students has been limited.
9.7 Stretching and challenging the most able is a recurring theme and it represents something of a shift. In addressing the science dilemma discussed in Chapter 6 recent British governments have shown more concern for the ordinarily intelligent than those especially talented. It can be argued that there is no fundamental contradiction, but not everyone can grasp calculus or the higher levels of science, and future scientists and engineers need to be sped on their way so they reach the frontiers at an age when they can make their contributions. Other countries are facing similar issues and there is much that can be learned from them though their solutions will not necessarily be transposable.
Specialist Science Schools 9.8 A number of countries including the United States, Japan, Korea and Singapore have
responded to the science dilemma and ensured ‘stretch and challenge’ by establishing specialist science schools. England has schools which are sometimes spoken of in the same breath, but they are quite different. England’s specialist science schools are explicitly non-selective. Curiously, they do not figure in the government’s statement of its science policies and achievements with which we began this chapter, probably because they had their origins elsewhere.
9.9 The Specialist Schools programme has evolved from the Technology Schools Initiative of the previous Conservative government. But as it has emerged it has come up against the Labour government’s discomfort with the notion of selection in education. Thus while most schools bear the name of particular subjects or fields, they are not able to identify and preferentially admit students with abilities and
79

interests in them. Smithers and Robinson (2009) found that the take-up of, and performance in, A-level physics was associated more with the ability of a school’s intake than its subject label. They found that some schools opted to become science schools because they were weak in the subject and hoped that the new status would help to boost their performance. It should not surprising, therefore, that some other types of specialist school, the music and language schools for example, have better science results than the science schools, which must be very confusing to parents.
9.10 We would argue on the basis of the experience of other countries that the role of the specialist schools, science schools in this case, needs to be re-thought. Conceivably, the meaningless subject labels should be phased out since they get in the way of a nationwide policy. But given the investment that has already gone into them the constructive question is: how can such schools be harnessed to provide stretch and challenge, and make a particular contribution to educating the science professionals of the future? It is not just a matter of quality, but providing the opportunities and stimulus for all to discover whether physics is for them. The great weakness of the present arrangements is that a potentially talented pupil in the sciences goes to an 11-16 sports school without any physics teachers and never becomes aware of his abilities and interests in the subject. By 16 the die is cast and many will have been lost before the opportunity arises of transfer to a sixth form with good science teachers. That is the real equity issue: how to give all children a chance to achieve excellence in science.
9.11 The evidence suggests that the loss of physics potential could be considerable. In Chapter 2 we saw that for various reasons the numbers studying A-level physics have halved since 1982, even allowing for the recent modest revival (Chart 2.1, page 4). The proportion of the age cohort currently studying physics to A-level standard is only a half to a third of that in other countries (Chart 3.18, page 28). We recommend that:
The role of the specialist science schools should be re-thought with a view to harnessing them to provide stretch and challenge for the most able and increasing the numbers of young people taking physics and other science A-levels.
9.12 How this is done will depend on what view of ‘the most able’ is taken. If like Korea we were thinking of the top three per cent it would need rather few specialist schools, but if it were 30 per cent it would involve more than the existing schools which bear the science label. Whatever the level, the key is allowing the schools to identify and recruit on ability and interest in the sciences. It can be difficult to think about this because memories of the 11+ tend to get in the way. But identification does not have to be by test and it does not have to be at age 11. Singapore admits at two ages, at 12 and 14, and it would be perfectly possible for science schools to continue as now at age 11 and then admit another strand at age 13 on the basis of talent for the subjects. Diagnosing talent could involve, as we saw in other countries, prior attainment, tests, interviews, camps or some combination of assessments. The schools - mainly but not exclusively existing science schools - to become the new science schools could be arrived at through some regional bidding process, which is something which worked well in Japan in establishing Super Science High Schools. This leads to our second recommendation which is:
80

The development of a network of specialist science schools with provision for the scientifically talented from age 13-14 should be explored.
9.13 An alternative or complementary approach that impressed us was the Junior College of Utrecht whereby the University came together with partner schools to teach the sciences to a high level. Two days were spent in the University and three in the schools with teaching being provided by university staff and the schools’ teachers. Selective specialist science schools have opened in association with universities also in the United States, Korea, Singapore and Australia. Universities in the UK have increasingly involved themselves in engaging with schools through masterclasses, funding teacher fellows, tutoring and mentoring, and initiatives of various kinds, but they are enhancements rather than structural in the way the Dutch and the other university-based schools are. England has never really come to terms with gifted and talented education because too often it is regarded as a bolt-on activity. We think there is a case for following other countries in trialling formal science partnerships between universities and schools.
Universities with leading physics departments should be invited to bid for funds to enable them to pilot partnerships with schools to provide high-level courses in the sciences.
9.14 Quantitatively they would only make a small contribution but qualitatively their impact could be considerable. University-based schools would also act as a test-bed and catalyst for curriculum development. Both the present government (DCSF, 2009b) and the Conservative Party (Gove, 2009) are in favour of more flexible models of schooling. The notion of university-based schools would seem to sit easily with their proposals.
Curriculum, Examinations and Qualifications 9.15 Another aspect of Britain’s emphasis on science for all rather than the specialists of
the future is the way examinations and qualifications have evolved with more attention being given to accessibility rather than excellence. A-levels began as university matriculation examinations which were adopted as school leaving certificates (Smithers and Robinson, 1991). They were high-level examinations, set by examination boards located in universities, which enabled students to be educated to degree standard in three years with few drop-outs. But following the merger of the O-level and CSE in 1986 to form GCSEs the universities have gradually become sidelined. Following the mergers of the academic and vocational awarding bodies, the universities have become even more remote from the process.
9.16 There have been numerous complaints from the universities and industry that A-levels have become too easy, especially after modularisation in 2000. Whatever the merits of those complaints it is certainly the case that many more candidates are being awarded the highest grade. Overall, A grades have trebled to 26.7 per cent from the initial 8.5 per cent (in 1965), and this is of more than twice as many entries. In physics, 32 per cent ‘As’ were awarded in 2009. Changes are in train with the number of modules being reduced from six to four and a grade above A, the A*, being introduced. But these modifications may not be radical enough.
81

9.17 We know from other countries that the nature of the curriculum, examinations and qualification can have a profound effect on pupils’ choices. This can be through changing the rules. The United States was the only country where we found physics participation in schools was going up, and this seemed to be associated with more science modules being needed to graduate from high school. In Eire pupils completing the Junior Certificate Examination are able to follow a Transition Year Programme which has increased the progression to third-level schools. In England, the government is seeking to reverse the swing away from the separate sciences to combined science by entitling all high performing science pupils to triple science courses. But more fundamental is what is taught and how it is examined. An important aim of the Junior College Utrecht is to narrow the gap between school and university education. In England that gap seems to have widened in recent years so the question is how to begin to close it. Our suggestion is that:
The role of the universities in setting and regulating A-level examinations be increased by requiring awarding bodies, the QCDA and Ofqual to have strong representation from them.
9.18 As the school and university sectors have grown further apart and A-levels no longer distinguish sufficiently well, universities have increasingly been turning to setting or buying in their own entry tests. This not only adds to the assessment burden on candidates, but is less robust than a fully-fledged national examination should be. There is a case for the involvement of the universities in A-levels going beyond working with existing examining and regulatory bodies to setting up a new examination board so that individual entrance tests would no longer be needed. We recommend that:
Universities explore the feasibility of establishing a new examination board that would offer A-levels, or an alternative entry qualification, that fully met their requirements in terms of standards and distinguishing between applicants, and obviate the need for individual entrance tests.
9.19 This also chimes in with the priorities for education of the Conservative Party. In reforming the curriculum and qualifications, it wants to give universities and employers “power over A-levels and vocational qualifications” (Gove, 2009).
Physics Teachers 9.20 In the first report in this series, Smithers and Robinson (2005), we demonstrated the
crucial importance of good physics teachers. We showed that after ability the expertise of the teachers was the most important factor in physics participation and performance. The schools that bucked the trend in having healthy physics take-up usually had a core of good specialist physics teachers, four or five in some cases (Smithers and Robinson, 2007). But we have also found that it is especially hard to recruit such teachers (Smithers and Robinson, 2008), probably because the attractions of physics are very different from those of teaching (Smithers and Hill, 1989). The Institute of Physics begins its submission to the Science and Learning Expert Group (IoP, 2009): “The major problem is the shortage of specialist physics teachers, which is highly unlikely to improve over the next decade.” This is borne
82

out by the present study of physics around the world where most countries seem to find it more difficult to recruit physics teachers than other science teachers.
9.21 In our report on the supply of physics teachers (Smithers and Robinson, 2008) we noted the wide range of measures and initiatives that had been put in place to increase the numbers including the Physics Enhancement Programme, Science Additional Specialism Programme, extended PGCE courses, booster courses, Student Associates Scheme, and Undergraduate Ambassadors Scheme. There are also financial initiatives for people to train as physics teachers and for training providers to recruit them. In time these various measures can be expected to ameliorate the shortage. But for the present it has to be accepted that there are not enough good physics teachers to go round and this has to the starting point when trying to ensure that all secondary school pupils have access to specialist physics teaching.
9.22 We have previously suggested that sixth-form and further education colleges, which are generally able to recruit high quality science staff, should be incentivized to work with schools. Paradoxically, sometimes well-qualified staff in these colleges find it difficult to attract students because they are reliant on 11-16 schools which may have no specialist physics teachers. In consequence, the pupils have little chance to discover whether they like physics and are good at it (Smithers and Robinson, 2006). It would make considerable sense for them to work more closely together. We know there are issues about the differing conditions of service of school teachers and further education lecturers, but it should not be too difficult to iron these out.
9.23 We have elsewhere suggested that there should be more sharing of teachers between schools and some schools could be recognized as Centres of Excellence in Physics Teaching and act as hubs for an area (Smithers and Robinson, 2008). In this report we have taken these ideas further in suggesting universities should be funded to enter into formal partnerships with schools to provide specialist teaching. There are thus a number of possibilities. We recommend that:
Accepting that good physics teachers are in short supply at present and are likely to remain so in the immediate future, models for ensuring that all secondary pupils have access to high quality specialist teachers should be trialled. These might include schools sharing teachers among themselves and working in partnership with the further education sector and universities.
9.24 If the proposals in this report for selective specialist science schools were accepted they could become hubs for science teaching in their localities. At the school system level there need not be the incompatibility between ‘stretch and challenge’ and ‘science for all’ that might be assumed.
University Places 9.25 The output of first-degree physics graduates in the UK and the United States, as we
saw in Chapter 5, has remained within relatively narrow bands over many years. It is puzzling that if there is a fundamental shortage of physics specialists why the market has not corrected for it through upward pressure on wages. Neither is
83
unemployment conspicuously lower. There is certainly a shortage of physics teachers but whether there is for physics specialists as a whole is a moot point. It may be that there is a shortage of pupils studying physics at A-level but not of physics graduates since A-level physics feeds into a wide variety of fields including the other physical sciences, engineering and maths.
9.26 Teitelbaum (2003) has argued powerfully that there is no overall global shortage of scientists at the doctoral level, though there may be local shortages. Osborne and Dillon (2008) suggest that in the UK shortages are more prevalent at the technician and intermediate levels of scientific and technological work. Sainsbury (2008) in his review of the government’s science and innovation policies was concerned at the lack of information on the supply and demand for STEM skills and recommended that HEFCE’s Strategically Important and Vulnerable Subject Advisory Group become an Advisory Group on Graduate Supply and Demand. HEFCE (2008c) accepted the recommendation but was conscious of the difficulties. We support Sainsbury’s recommendation, but would propose a more specific inquiry:
It is widely held that there is a shortage of physics graduates, but the evidence for this is not unequivocal. An investigation should be undertaken to better understand the demand for physics graduates and the factors affecting supply.
9.27 Why if there is a shortage has graduate output in the UK and USA not been corrected by the market? The constraints holding output to more or less the same levels could include, among other things: ability and interest in physics; numbers qualifying at school; university funding; investment in research and development; career opportunities and rewards. But it could also be that there is no real shortage, other than of physics graduates as teachers.
Evaluation 9.28 In reviewing science education policies from around the world we have been
overwhelmed by riches. There are numerous examples of national strategies embracing all stages of life from primary education to employment. There is an enormous range of initiatives designed to encourage interest in science, develop curricula and qualifications, recruit teachers, foster partnerships, widen access, and expand take-up in higher education. Some schemes emphasize finding and educating the science professionals of the future and others lifting the scientific understanding of the general population. It has been a major task to try to encompass all the schemes and ideas within a few brief readable pages. But what was less readily available, particularly at the level of national strategies and schemes, was clear evidence of what worked. Although it is important for governments to be seen to be doing things, it is even more important that they should be doing good things. We would urge therefore that:
All initiatives and strategies for improving physics participation and performance should set out the criteria by which they can be judged and they should be carefully monitored and evaluated.
84

Conclusion 9.29 Where it is possible to track physics participation at the A-level stage in other
countries the trend, as in England, since the early 1990’s has been generally downwards, even though the take-up of the physical sciences or some broader science grouping may have been rising. Most countries are implementing strategies or initiatives to promote participation and performance in the sciences and there are indications that the decline is being halted or even reversed. The UK government has a wide-ranging strategy for England and there have been small increases in A-level physics entries since 2006, but not enough to reach the target of 35,000 by 2014. More needs to be done and there are important lessons to be learned from other countries.
85
References Adamcyzk, P. and Willson, M. (2004). ‘Promoting learning out-of-school: the
masterclass experience’, School Science Review, 85 (313) 55-59.
Ainley, J., Kos, J. and Nicholas, M. (2008). Participation in Science, Mathematics and Technology in Australian Education. Melbourne: Australian Council for Educational Research.
Ainley, J (2009). Private communication, 13 April 2009.
Allen, A., Black, P. and Wallin, H. (2002). An Evaluation Report on the LUMA Programme. Prepared for the Ministry of Education. www.edu.fi/english/page.asp?path=500,5372,18762
Andersson, R. and Olsson, A-K (1999). Fields of Education and Training Manual. Luxembourg: Eurostat.
Atkinson, R.D., Hugo, J., Lundgren, D., Shapiro, M.J. and Thomas, J. (2007). Addressing the STEM Challenge by Expanding Speciality Math and Science High Schools. Washington, DC: The Information Technology and Innovation Foundation.
Australian Science and Mathematics School (2008). Annual Report. Adelaide: Government of South Australia, Department of Education and Children’s Services.
Barber, M. and Mourshed, M. (2007). How the World’ Best-Performing School Systems Come Out on Top. London: Mckinsey & Co.
Bologna Process (2009). Welcome to the Process of Creating the European Higher Education Area. www.ond.vlaanderen.be/hogeronderwijs/bologna/
Cambridge Assessment (2009). Science: A Valid Overview of Entries in Schools and Colleges. University of Cambridge Local Examinations Syndicate http://www.cambridgeassessment.org.uk/ca/News_Room/Latest_News/News?id=131342 .
Council of Chief State School Officers (2005). Key State Education Policies on PK-12 Education, 2004. Washington, DC, USA: CCSSO.
Dalton, B., Ingels, S.J., Downing, J., Bozick, R. and Owings, J. (2007). Advanced Mathematics and Science Coursetaking in the Spring High School Senior Classes of 1982, 1992 and 2004. NCES 2007-312. Washington, DC, USA: Institute of Educational Sciences, National Centre for Education Statistics, US Department of Education.
Department for Business Innovation and Skills (2009). Science and Learning Expert Group Consultation. http://interactive.bis.gov.uk/science and society/site/science and learning
DCSF (2007). National Curriculum Assessment, GCSE and Equivalent Attainment and Post-16 Attainment by Pupil Characteristics, in England 2006/07. Statistical First Release 38/2007.
86
DCSF (2008). Specialist Schools Programme - Guidance. http://www.standards.dcsf.gov.uk (accessed 23 October 2008).
DCSF (2009a). STEM, science and mathematics. DCSF News, 31 March 2009 http://www.dcsf.gov.uk/news/content.cfm?landing=stem_science_and_mathematics&type=4 (accessed 7 September 2009) (accessed 7 September 2009)
DCSF (2009b). Your Child, Your Schools, Our Future: Building a 21st Century Schools System. White Paper June 2009. Cm 7588. London: The Stationery Office.
DCSF-DIUS (2009). Science and Learning Expert Group: Draft Terms of Reference. Letter to Sir Mark Wolpert, 26 March 2009. http://interactive.bis.gov.uk/science and society/site/science and learning
Department of Education Republic of Philippines (2009). DepEd Updates. www.deped.gov.ph .
Department of Education and Science, Dublin (2002). Report and Recommendations of the Taskforce on the Physical Sciences. Dublin: The Stationery Office.
Department of Education and Science, Dublin (2002-06). Annual Statistical Reports. Dublin: The Stationery Office.
Dogan, M., Oruncak, B. and Gunbayi, I. (2002). ‘Problems and solutions for high school physics in Turkey’. Physics Education, 37, 543-546.
Eurostat - Data Explorer http://nui.epp.eurostat.ec.europa.eu/nui .
Fullarton, S., Walker, M., Ainley, J., and Hillman, K (2003). Patterns of Participation in Year 12. Melbourne: Australian Council for Educational Research.
Gago, J.M. (2004). Europe Needs More Scientists. Report of the High Level Group on Human Resources for Science and Technology in Europe. Brussels: Science and Society, European commission Community Research.
Gove, M. (2009). First Year Education Priorities for New Government. Speech to the Centre for Policy Studies, 5 November 2009. http://www.cps.org.uk/cps_catalog/First_Year_Education_Priorities_for_a_New_Government.html .
HEFCE (2008a). ‘HEFCE secures physics collaboration in South East England’, News, 7 April www.hefce.ac.uk/news/hefce/2008/sepnet.htm .
HEFCE (2008b). ‘Future brighter for science and other key vulnerable subjects’, News, 21 October www.hefce.ac.uk/news/hefce/2008/sivs.htm .
HEFCE (2008c). Strategically Important and Vulnerable Subjects: Final Report of the 2008 Advisory Group. Bristol: HEFCE.
HM Treasury (2004). Science and Innovation Investment Framework 2004-2014:. London: The Stationery Office.
HM Treasury (2006). Science and Innovation Investment Framework 2004-2014: Next Steps. London: The Stationery Office.
87

Hipkins, R. and Bolstad, R. (2005). Staying in Science: Students’ Participation in Secondary Education and On Transition to Tertiary Studies. Wellington: New Zealand Council for Educational Research.
Institute of Physics (2009). Science and Learning Group: Institute of Physics Comments to the Group, 29 September 2009 www.iop.org/activity/policy/Consultations/Education/.../file_36976.pdf .
Institute of Physics in Ireland (2009). Transition Year Physics. http://www.iopireland.org/activity/education/Transition_Year_Physics/page_25867.html .
Ingels,S.J., Dalton, B. and LoGerfo, L. (2008). Trends Among High School Seniors 1972-2004. NCES 2008-320. Washington, DC, USA: Institute of Educational Sciences, National Centre for Education Statistics, US Department of Education.
Japan Science and Technology Agency (2009). Support for Study of Science and Technology (Fostering the next generation of leaders in science and technology) http://rikai.jst.go.jp/eng/.
Kang, Y-l, Park, So-y, Jumg H-c, Park, Jin-a (2007). Research on the Appropriateness of Policies for Specialised High Schools. Seoul: KEDI.
Kakihana, K. and Kimura, S. (2004). Activities in New Curriculum for Gifted Students - Trials in Super Science High Schools in Japan. Tenth International Congress on Mathematical Education, July 4-11, 2004, Copenhagen, Denmark.
Korea Ministry of Education, Science and Technology (2005). Education for the Gifted and Science and Technology Education. http//English.mest.gov.kr .
Korea Ministry of Education, Science and Technology (2008). Policies in Place to Promote Gifted Education. Press Release August 28 http//English.mest.gov.kr .
Korea Ministry of Education, Science and Technology (2009). Brief Statistics on Korean Education. http//English.mest.gov.kr .
Lisbon European Council (2000). Presidency Conclusions. www.europarl.europa.eu/summits/lis1_en.htm#a .
Liverpool City Council (2005). Experiments with Kids. Press Release, 17 March www:lespetitsdebrouillards.org .
Martin, M.O., Mullis, I.V.S. and Foy, P. (2007). TIMSS 2007 International Science Report. Findings from the IES’s Trends in International Mathematics Study at the Fourth and Eighth Grades. Boston College, USA: TIMSS & PIRLS International Study Centre.
MEXT (2009a). Organization of the School System in Japan. http://www.mext.go.jp/english/ (accessed 22 October, 2009).
MEXT (2009b). White Paper on Science and Technology 2008 http://www.mext.go.jp/english/ (accessed 22 October, 2009).
88
Ministry of Economic Affairs (2006). Science, Technology and Innovation in the Netherlands: Policies, Facts and Figures. The Hague: MEA and Ministry of Education, Culture and Science.
Ministry of Education and Research, Norway (2006). A Joint Promotion of Mathematics, Science and Technology (MST). www.regjeringen.no/en .
Ministry of Education, Science and Culture, Iceland (2007). Education and Training 2010: the Development of Education Policy in Iceland in the Context of Europe. http://eng.menntamalaraduneyti.is/publications/.
National Academies (2007). Rising Above the Gathering Storm: Energizing and Employing America for a Brighter Economic Future. Washington, DC: The National Academies Press.
National Board of Education, Finland (2002). Finnish Knowledge in Mathmeatics and Sciences in 2002 - final Report of LUMA programme. Accessed at www.edu.fin/English/.
National Commission on Excellence in Education (1983). A Nation at Risk: The Imperative for Educational Reform. Washington, DC, USA: Government Printing Office.
National Education Goals Panel (1995). The National Education Goals Report. Washington, DC, USA: NEGP.
National Science Board (2006). America’s Pressing Challenge: Building a Stronger Foundation. Washington, DC, USA: National Science Foundation.
OECD (2004), Handbook for Internationally Comparative Education Statistics: Concepts Standard, Definitions and Classifications. Paris: OECD.
OECD (2006). Science Competences for Tomorrow’s World, Volume I - Analysis and Volume II - Data. Paris: OECD.
OECD (2008a). Education at a Glance, OECD Indicators. Paris: OECD.
OECD (2008b). Encouraging Student Interest in Science and Technology Studies. Gobal Science Forum. Paris: OECD.
Osborne, J. and Dillon, J. (2008). Science Education in Europe: Critical Reflections. London: The Nuffield Foundation.
Philippine Science High School (2009). The History of PSHS System http://www.pshs.edu.ph/index.php .
Platform Bèta Techniek (2009). A European Good Practice in Search of Exposure and Cooperation. The Hague: Platform Bèta Techniek.
Powell, K. (2005). ‘Hothouse high’, Nature, 435, 874-5.
The Royal Society (2008). A Higher Degree of Concern. Policy Document 02/08. London: The Royal Society.
Sainsbury. Lord. (2007). The Race to the Top: A Review of Government’s Science and Innovation Policies. London: HM Treasury.
89
Secondary Science Curriculum Review/Engineering Council (1987). Double Award Balanced Science: A Statement of Support. London: SSCR and Engineering Council.
Singaporean Ministry of Education (2002). Report of the Junior College/Upper Secondary Education Review Committee. www.moe.edu.sg/jcreview .
Singaporean Ministry of Education (2009a). School of Science and Technology. Singapore Set Up Entrepreneurship Advisory Council. Press Release 23 May 2009.
Singaporean Ministry of Education (2009b). Student Admissions. www.moe.edu.sg .
Smithers, A. (1997a). The supply of, and demand for, scientists and engineers. The Save British Science Lecture, Annual Meeting of the Association for Science Education, Birmingham, 2 January 1997. www.buckingham.ac.uk/education/research/ceer/publications.html .
Smithers, A. (1997b). The New Zealand Qualifications Framework. Wellington, NZ: Educational Forum.
Smithers, A. (2000). National Certificate of Educational Achievement. Wellington, NZ: Educational Forum.
Smithers, A. and Hill, S. (1989). ‘Recruitment to physics and maths teaching: a personality problem?’ Research Papers in Education, 4, 3-21.
Smithers, A. and Robinson, P. (1991). Beyond Compulsory Schooling. London: Council for Industry and Higher Education.
Smithers, A. and Robinson, P. (2005). Physics in Schools and Colleges: Teacher Deployment and Student Outcomes. Buckingham: The Carmichael Press.
Smithers, A. and Robinson, P. (2006). Physics in Schools and Universities: Policies and Patterns. Buckingham: The Carmichael Press.
Smithers, A. and Robinson, P. (2007). Physics in Schools III: Bucking the Trend. Buckingham: The Carmichael Press.
Smithers, A. and Robinson, P. (2008). Physics in Schools IV: Supply and Retention of Teachers. Buckingham: The Carmichael Press.
Smithers, A. and Robinson, P. (2009). Specialist Science Schools. Buckingham: The Carmichael Press.
Snyder, T.D., Dillow, S.A. and Hoffman, C.M. (2009). Digest of Education Statistics 2008. NCES 2009-020. Washington, DC, USA: Institute of Educational Sciences, National Centre for Education Statistics, US Department of Education.
STEM News (2009). 10,000 extra places for STEM. www.stemforum.org.uk/?page_id=167 .
Taber,K.S. and Riga, F. (2006). ‘Lessons from the ASCEND project: able pupils’ responses to an enrichment programme exploring the nature of science’, School Science Review, 87 (321) 97-106.
90
Teitelbaum, M. (2003). ‘Do we need more scientists?’ The Public Interest, 40-53, September 22.
Thomas, J. and Love, B.L. (2002a). ‘An analysis of post-graduation experiences among gifted secondary students’, National Consortium for Specialised Secondary Schools of Mathematics Science and Technology Journal 6.1.
Thomas, J. and Love, B.L. (2002b). ‘Longitudinal study of graduates: a three-year analysis of college freshmen and college seniors’, National Consortium for Specialised Secondary Schools of Mathematics Science and Technology Journal 7.2.
Troendle, G. (2004). Mapping Physics Students in Europe, France: European Physical Society.
UNESCO (2006). Tertiary Education/ ISCED 5 and 6/ Graduates by Broad Field of Education (Table 11). Institute for Statistics on-line database http://stats.uis.unesco.org
Valk, T.van der, Berg, E. van den, and Eijkelhof, H. (2007). ‘Junior College Utrecht: challenging talented secondary school students to study science, School Science Review, 88 (325) 63-71.
Vermeulen, M. (2008). How to Get Schools to Develop their Education and Teaching in Maths, Science and Technology: Experiences from the Netherlands. nts.ind.ku.dk/konferencer/oplaeg/Marjolijn-oplg.pdf/.
91

(BLANK PAGE)

(INSIDE BACK COVER BLANK)

(BACK COVER)
ISBN 978 1 907168-20-8
Carmichael Press, University of Buckingham, MK18 1EG