Embed Size (px)
Citation preview

1|P a g e
Page1
TriplePhysicsRequiredPracticalActivities–AlsagerSchoolRevisionGuide
RequiredPractical Page
Aninvestigationtodeterminethespecificheatcapacityofoneormorematerials.Theinvestigationwillinvolvelinkingthedecreaseofoneenergystore(orworkdone)totheincreaseintemperatureandsubsequentincreaseinthermalenergystored.https://www.youtube.com/watch?v=jW2ANwnfsUYhttps://www.youtube.com/watch?v=ZYSdBU0pLvc
3-9
Investigatetheeffectivenessofdifferentmaterialsasthermalinsulatorsandthefactorsthatmayaffectthethermalinsulationpropertiesofamaterial.https://www.youtube.com/watch?v=Pz08nd1hKXA
10-16
Usecircuitdiagramstosetupandcheckappropriatecircuitstoinvestigatethefactorsaffectingtheresistanceofelectricalcircuits.Thisshouldinclude:••3athelengthofawireatconstanttemperature••3bcombinationsofresistorsinseriesandparallel.https://www.youtube.com/watch?v=ZJKmovo-MoMhttps://www.youtube.com/watch?v=m_3JrA-sDEghttps://www.youtube.com/watch?v=XSukRnxGy5c
17-22
UsecircuitdiagramstoconstructappropriatecircuitstoinvestigatetheI–Vcharacteristicsofavarietyofcircuitelementsincluding:afilamentlampadiodearesistoratconstanttemperature.https://www.youtube.com/watch?v=1DI0By1Osrchttps://www.youtube.com/watch?v=1QtI15E-GMU
22-32
Useappropriateapparatustomakeandrecordthemeasurementsneededtodeterminethedensitiesofregularandirregularsolidobjectsandliquids.Volumeshouldbedeterminedfromthedimensionsofregularlyshapedobjectsandbyadisplacementtechniqueforirregularlyshapedobjects.Dimensionstobemeasuredusingappropriateapparatussuchasaruler,micrometerorVerniercallipers.https://www.youtube.com/watch?v=F7uto-YfSRc
32-36

2|P a g e
Page2
https://www.youtube.com/watch?v=lh4W-cXcsBQhttps://www.youtube.com/watch?v=Ypg6mRbEhWsInvestigatetherelationshipbetweenforceandextensionforaspring.https://www.youtube.com/watch?v=XoukVo6MR40https://www.youtube.com/watch?v=QQCJeAqBumE
37-45
Investigatetheeffectofvaryingtheforceontheaccelerationofanobjectofconstantmassandtheeffectofvaryingthemassofanobjectontheaccelerationproducedbyaconstantforce.https://www.youtube.com/watch?v=gaKXmWdmeVQ&list=PLM2vhNffrPZf2tUarsQounK6plAUim2z9https://www.youtube.com/watch?v=nRaJd59ooIE
46-54
Makeobservationstoidentifythesuitabilityofapparatustomeasurethefrequency,wavelengthandspeedofwavesinarippletankandwavesinasolidandtakeappropriatemeasurements.https://www.youtube.com/watch?v=kgL-hOBvQcchttps://www.youtube.com/watch?v=HANMKi6-Guk
49-54
Investigatethereflectionoflightbydifferenttypesofsurfaceandtherefractionoflightbydifferentsubstances.https://www.youtube.com/watch?v=XTMbYDrMr0whttps://www.youtube.com/watch?v=4VKtq6GMbDA&index=5&list=PLM2vhNffrPZf2tUarsQounK6plAUim2z9
55-61
Investigatehowtheamountofinfraredradiationabsorbedorradiatedbyasurfacedependsonthenatureofthatsurface.https://www.youtube.com/watch?v=ClRrU6JuBOchttps://www.youtube.com/watch?v=4Pz8xcEQtMU
61-71

3|P a g e
Page3
GCSEPhysicsrequiredpracticalactivity:SpecificheatcapacityYouareprovidedwiththefollowing:
• copperblockwrappedininsulation,withtwoholesforathermometerandheater
• thermometer
• pipettetoputwaterinthethermometerhole
• 30Wheater
• 12Vpowersupply
• insulationtowraparoundtheblocks
• ammeterandvoltmeter
• five4mmleads
• stopwatchorstopclock
• balance.
Readtheseinstructionscarefullybeforeyoustartwork.1. Measureandrecordthemassofthecopperblockinkg.2. Placeaheaterinthelargerholeintheblock.3. Connecttheammeter,powerpackandheaterinseries.4. Connectthevoltmeteracrossthepowerpack.
5. Usethepipettetoputasmallamountofoilintheotherhole.6. Putthethermometerinthishole.7. Switchthepowerpackto12V.Switchiton.8. Recordtheammeterandvoltmeterreadings.Theseshouldn’tchangeduringtheexperiment.9. Measurethetemperatureandswitchonthestopclock
V
A
12V

4|P a g e
Page4
10. Recordthetemperatureeveryminutefor10minutes.11. Calculatethepoweroftheheaterinwatts.
Todothis,multiplytheammeterreadingbythevoltmeterreading.Power=currentxpotentialdifference
12. Calculatetheworkdonebytheheater.Todothis,multiplythetimeinsecondsbythepoweroftheheater.
Workdone(j)=powerxtime13. Repeatthisexperimentwithdifferentmaterials
Questions
IstheammeterconnectedinSeriesorParallel?
Whatistheammeterusedtomeasure?
IsthevoltmeterconnectedinSeriesorParallel?
Whatisthevoltmeterusedtomeasure?
Ifyoudonotinsulatethemetalblock,thevaluewecalculateforspecificheatcapacitywillbehigherthanthetruevalue.Explainwhythemeatalblockneedstobeinsulated.

5|P a g e
Page5
Q1.(a) A student used the apparatus drawn below to investigate the heating effect of an electric heater.
(i) Before starting the experiment, the student drew Graph A.
Graph A shows how the student expected the temperature of the metal block to change after the heater was switched on.
Describe the pattern shown in Graph A.
...............................................................................................................
...............................................................................................................
...............................................................................................................
............................................................................................................... (2)

6|P a g e
Page6
(ii) The student measured the room temperature. He then switched the heater on and measured the temperature of the metal block every 50 seconds.
The student calculated the increase in temperature of the metal block and plotted Graph B.
After 300 seconds, Graph B shows the increase in temperature of the metal block is lower than the increase in temperature expected from Graph A.
Suggest one reason why.
...............................................................................................................
............................................................................................................... (1)
(iii) The power of the electric heater is 50 watts.
Calculate the energy transferred to the heater from the electricity supply in 300 seconds.
...............................................................................................................
...............................................................................................................
...............................................................................................................
Energy transferred = ........................................... J (2)

7|P a g e
Page7
(b) The student uses the same heater to heat blocks of different metals. Each time the heater is switched on for 300 seconds.
Each block of metal has the same mass but a different specific heat capacity.
Metal Specific heat capacity in J/kg°C
Aluminium 900
Iron 450
Lead 130
Which one of the metals will heat up the most?
Draw a ring around the correct answer.
aluminium Iron lead
Give, in terms of the amount of energy needed to heat the metal blocks, a reason for your answer.
........................................................................................................................
........................................................................................................................
........................................................................................................................
........................................................................................................................ (2)
(Total 7 marks)
2. A student investigated the specific heat capacity of metals.
(a) Describe an experiment the student could do to measure the specific heat capacity of a metal.
........................................................................................................................
........................................................................................................................
........................................................................................................................
........................................................................................................................
........................................................................................................................
........................................................................................................................
........................................................................................................................
........................................................................................................................
........................................................................................................................ (6)

8|P a g e
Page8
(b) The student calculated the specific heat capacity of four metals.
The table below shows the student’s results. Metal
Mass of material
in kg Time in minutes
Temperature chan
ge in °C
Change in thermal energy
in J
Calculated specific
heat capacity of material
in J / kg °C
Aluminium
1 10 2 4 780 2 390
Brass 1 10 4 4 660 1 165
Copper 1 10 4 600 657
Steel 1 10 5 4 690 938
Use data from the table above to calculate the temperature change for copper.
Use the correct equation from the Physics Equation Sheet.
........................................................................................................................
........................................................................................................................
........................................................................................................................
........................................................................................................................
Temperature change = ................................ °C (3)
(c) What is the independent variable in the student’s investigation?
Tick one box.
Mass of material
Power used
Time in minutes
Type of material
(1)

9|P a g e
Page9
(d) The student calculated the specific heat capacity of aluminium to be 2390 J / kg °C.
The ‘true’ specific heat capacity of aluminium is 900 J / kg °C.
Suggest why the student’s result for aluminium is different from the ‘true’ value.
........................................................................................................................
........................................................................................................................
........................................................................................................................
........................................................................................................................ (2)
(e) The teacher suggested that putting bubble wrap round the metal block would change the results.
How would using bubble wrap change the results?
Give a reason for your answer.
........................................................................................................................
........................................................................................................................
........................................................................................................................
........................................................................................................................ (2)
(Total 14 marks)

10|P a g e
Page10
GCSEPhysicsrequiredpracticalactivity2:Thermalinsulation
Requiredpracticalactivity Apparatusandtechniques
Investigatetheeffectivenessofdifferentmaterialsasthermalinsulatorsandthefactorsthatmayaffectthethermalinsulationpropertiesofamaterial.
AT1,AT5
1.Investigatingtheeffectivenessofdifferentmaterialsasthermalinsulators
Youwillmeasuretherateofcoolingofabeakerofhotwaterwheninsulatedwithdifferentmaterials.Youwillplotcoolingcurvestodeterminewhichisthebestthermalinsulator.
Riskassessment
Takegreatcarewhenpouringthenear-boilingwaterfromthekettle.Ifyousplashanyonyourself,immediatelywashtheaffectedareawithcoldwater.
Method
Youareprovidedwiththefollowing:
• largebeakereg800ml
• smallbeakereg250ml
• thermometer
• kettletoheatwater
• pieceofcardboard
• scissors
• stopclock
• selectionofinsulatingmaterials,egpolystyrenegranules,sawdust,bubblewrap,newspaper.
Readtheseinstructionscarefullybeforeyoustartwork.1. Putthesmallbeakerinsidethelargerbeaker.2. Usethekettletoboilwater.Put80mlofthishotwaterintothesmallbeaker.3. Useapieceofcardboardasalidforthelargebeaker.Thecardboardmusthaveaholeforthethermometer.4. Insertthethermometerthroughtheholeinthecardboardlidsothatitsbulbisinthehotwater.5. Recordthetemperatureofthewaterandstartthestopwatch.

11|P a g e
Page11
6. Record the temperature of the water every 5 minutes for 20 minutes Add your results to a table such as the one below.
Materialusedforinsulation
Temperaturein°C
AtthestartAfter5minutes
After10minutes
After15minutes
After20minutes
Noinsulation
Bubblewrapgranules
Newspaper
Polystyrene
Sawdust
7. Repeatsteps1‒6usingthedifferentmaterialseachtimetofillthespacebetweenthesmallandlargebeaker.
Makesureyouusethesamevolumeofwatereachtime.
8. Plotcoolingcurvegraphsforeachmaterialwith:
• ‘Temperature in °C’ on the y-axis
• ‘Time in minutes’ on the x-axis.
Useyourgraphstodeterminewhichmaterialisthebestinsulator.
Questions
• What is the independent variable?
• Is the independent variable a categoric or continuous variable? Justify your answer
• What is the dependent variable?
• What are the control variables?
• How will you use your results to determine which is the best insulator?
• Explain why in this method a smaller beaker was placed inside of a larger beaker and the gap filled with insulation

12|P a g e
Page12
Q1. (a) The diagram shows a ski jacket that has been designed to keep a skier warm. The jacket is made from layers of different materials.
(i) The inner layer is shiny to reduce heat transfer.
Which process of heat transfer will it reduce?
............................................................................................................... (1)
(ii) Why is the layer of fleece good at reducing the transfer of heat from a skier’s body?
...............................................................................................................
............................................................................................................... (1)

13|P a g e
Page13
(b) A student tested four different types of fleece, J, K, L and M, to find which would make the warmest jacket. Each type of fleece was wrapped around a can which was then filled with hot water. The temperature of the water was taken every two minutes for 20 minutes.
The graph shows the student’s results.
(i) In each test, the water cooled faster during the first five minutes than during the last five minutes. Why?
...............................................................................................................
............................................................................................................... (1)
(ii) To be able to compare the results, it was important to use the same volume of water in each test.
Give one other quantity that was the same in each test.
...............................................................................................................
...............................................................................................................

14|P a g e
Page14
(1)
(iii) Look at the graph line for fleece K.
Estimate what the temperature of the water in the can wrapped in fleece K would be after 40 minutes.
......................................................... (1)
(iv) Which type of fleece, J, K, L or M, should the student recommend to be used in the ski jacket?
.........................................................
Give a reason for your answer.
...............................................................................................................
...............................................................................................................
...............................................................................................................
............................................................................................................... (2)
(Total 7 marks)
Q2. A student had read about a glacier that had been covered in insulating material. The idea was to slow down the rate at which the glacier melts in the summer. She investigated this idea using the apparatus shown in the diagram.
(a) These are the steps taken by the student.
• Measure 30 cm3 of cold water into a boiling tube.
• Place the boiling tube 25 cm from an infra red lamp.
• Record the temperature of the water.
• Switch on the infra red lamp.
• Record the temperature of the water every minute for 5 minutes.
• Repeat with boiling tubes covered in different insulating materials.

15|P a g e
Page15
(i) Why did she use an infra red lamp?
................................................................................................................... (1)
(ii) Name one control variable in this investigation.
................................................................................................................... (1)
(iii) Give one advantage of using a temperature sensor and data logger instead of a glass thermometer to measure temperature.
...................................................................................................................
................................................................................................................... (1)
(b) The results of the investigation are shown in the graph.

16|P a g e
Page16
(i) Why did the student use a boiling tube with no insulation?
...................................................................................................................
................................................................................................................... (1)
(ii) From her results, what should she recommend is used to insulate the glacier?
................................................................................................................... (1)
(iii) Explain why the insulation recommended by the student will reduce the heat transfer from the Sun to the glacier.
...................................................................................................................
...................................................................................................................
...................................................................................................................
...................................................................................................................
................................................................................................................... (2)
(c) Explain, in terms of particles, how heat is transferred through the glass wall of a boiling tube.
.............................................................................................................................
.............................................................................................................................
.............................................................................................................................
............................................................................................................................. (2)
(Total 9 marks)

17|P a g e
Page17
GCSEPhysicsrequiredpracticalactivity3:Resistance
Requiredpracticalactivity Apparatusandtechniques
Usecircuitdiagramstosetupanappropriatecircuittoinvestigateafactor/thefactorsthataffecttheresistanceofanelectricalcircuit.Thisshouldinclude:
•thelengthofawireatconstanttemperature
•combinationsofresistorsinseriesandparallel.
AT1,AT6,AT7
Activity3:Investigatinghowtheresistanceofawirevarieswithitslength
Adimmerswitchallowsyoutocontrolthebrightnessofalamp.
Youwillinvestigatehowthedimmerswitchworks.Youwillconstructacircuittomeasurethepotentialdifferenceacrossawireandthecurrentinthewire.Youwilldothisfordifferentlengthsofwire.
Method
Youareprovidedwiththefollowing:
• abatteryorsuitablepowersupply
• ammeterormultimeter
• voltmeterormultimeter
• crocodileclips
• resistancewireegconstantan
• connectingleads.
1. Readtheseinstructionscarefullybeforeyoustartwork.
2. Setupthecircuitasshowninthediagram
3. Connecta10cmlengthofwireusingthecrocodileclips4. Recordthecurrentandpotentialdifferenceofthe10cmlengthofwire5. Usevoltage/currenttocalculateresistance6. Repeatforlengths20-80cm

18|P a g e
Page18
Recordinatablethe:
• length of the wire between the crocodile clips
• the readings on the ammeter
• the readings on the voltmeter.
Youwillneedfourcolumnsintotal.
Lengthofwireincm
PotentialdifferenceinV
CurrentinA
ResistanceinW
.
1. Calculate and record the resistance for each length of wire using the equation:
resistanceinW =potentialdifferenceinV
currentinA
2. Plot a graph with:
• ‘Resistance in W’ on the y-axis
• ‘Length of wire in cm’ on the x-axis.
3. You should be able to draw a straight line of best fit although it may not go through the origin.
Questions
• What is the independent variable?
• What is the range of the independent variable?
• What is the dependent variable?
• What are the control variables?

19|P a g e
Page19
• How do you connect an ammeter?
• How do you connect a voltmeter?
• If you connected your ammeter and it had a reading of 0.02 A even with the powerpack switched off,
what kind of error would this be called? Explain what you could do to prevent this error from affecting your results.
Q1.(a) A resistor is a component that is used in an electric circuit.
(i) Describe how a student would use the circuit to take the readings necessary to determine the resistance of resistor R.
................................................................................................................
................................................................................................................
................................................................................................................
................................................................................................................
................................................................................................................
................................................................................................................
................................................................................................................
................................................................................................................
................................................................................................................
................................................................................................................
................................................................................................................
................................................................................................................
................................................................................................................
................................................................................................................ (6)
20|P a g e
Page20
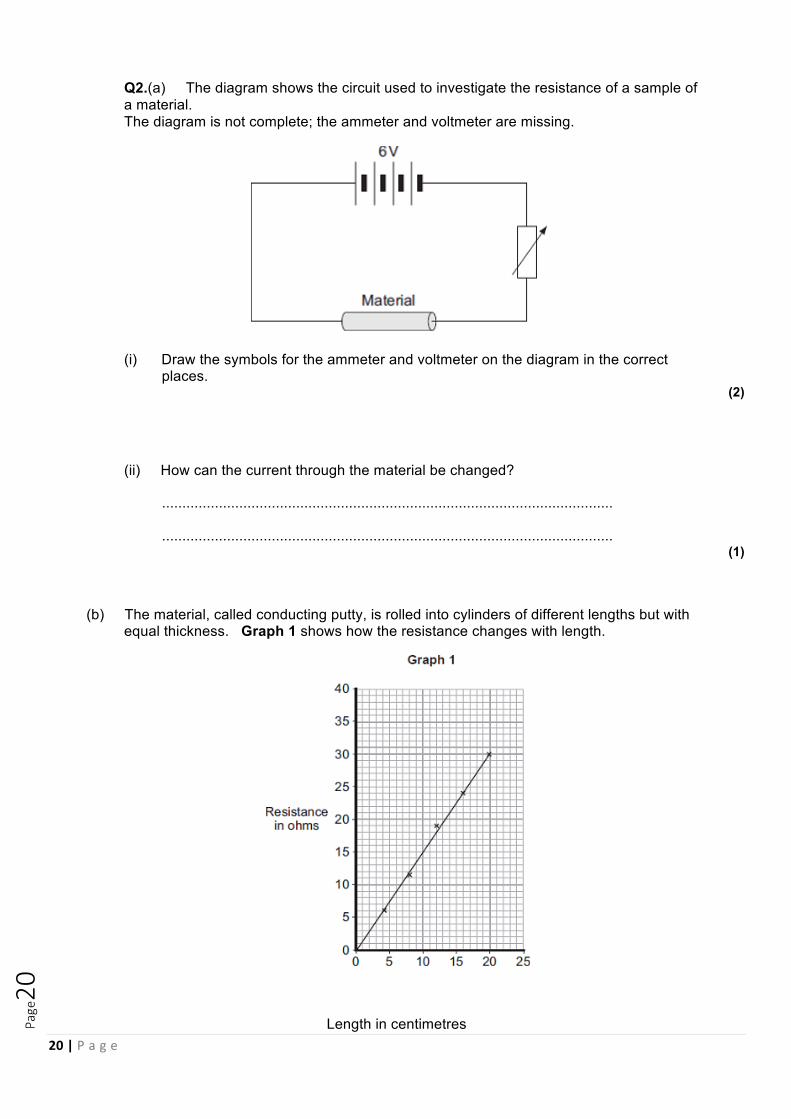
Q2.(a) The diagram shows the circuit used to investigate the resistance of a sample of a material. The diagram is not complete; the ammeter and voltmeter are missing.
(i) Draw the symbols for the ammeter and voltmeter on the diagram in the correct places.
(2)
(ii) How can the current through the material be changed?
...............................................................................................................
............................................................................................................... (1)
(b) The material, called conducting putty, is rolled into cylinders of different lengths but with equal thickness. Graph 1 shows how the resistance changes with length.
Length in centimetres
21|P a g e
Page21
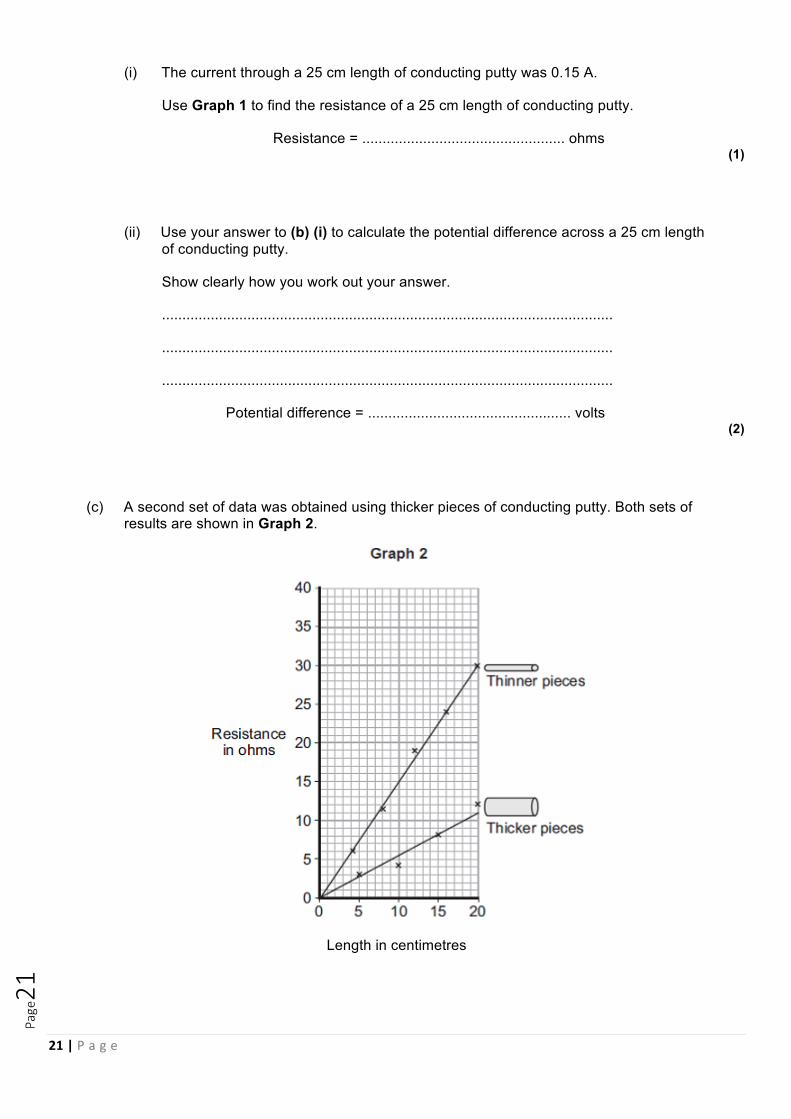
(i) The current through a 25 cm length of conducting putty was 0.15 A.
Use Graph 1 to find the resistance of a 25 cm length of conducting putty.
Resistance = .................................................. ohms (1)
(ii) Use your answer to (b) (i) to calculate the potential difference across a 25 cm length of conducting putty.
Show clearly how you work out your answer.
...............................................................................................................
...............................................................................................................
...............................................................................................................
Potential difference = .................................................. volts (2)
(c) A second set of data was obtained using thicker pieces of conducting putty. Both sets of results are shown in Graph 2.
Length in centimetres

22|P a g e
Page22
(i) What is the relationship between the resistance and the thickness of the conducting putty?
...............................................................................................................
............................................................................................................... (1)
(ii) Name one error that may have reduced the accuracy of the results.
............................................................................................................... (1)
(Total 8 marks)
GCSE-Physicsrequiredpracticalactivity:I-VCharacteristics
Requiredpracticalactivity Apparatusandtechniques
UsecircuitdiagramstoconstructappropriatecircuitstoinvestigatetheI-Vcharacteristicsofvarietyofcircuitelementsincludingafilamentlamp,adiodeandaresistoratconstanttemperature.
AT6,AT7
Therearethreeactivities.Ineachoneyouaregoingtomeasureelectriccurrentinacomponentasyouchangethepotentialdifference(Pd)acrossthecomponent
YouwillthenplotagraphofcurrentinanagainstpotentialdifferenceinV.Youwillinvestigatethebehaviourofaresistor,alampandadiode.
Method
1. Setuptheelectricalcircuitasshown.
2. Setthepowersupplytoalowvoltagesettinge.g.6V
3. Switchonthepowersupply.
4. Recordthecurrentandpotentialdifferencereadingsinasuitabletable.
5. Repeattheprocedurebyvaryingthecurrentusingthevariableresistor
A
V

23|P a g e
Page23
Nowrepeatthisprocedureforthesetwocircuitsalso:
Questions Draw the circuit symbol for a fixed resistor
Draw the circuit symbol for a diode Draw the circuit symbol for a filament bulb What is the circuit symbol for a variable resistor? How is the voltmeter connected? How is the ammeter connected? Explain why the variable resistor is included in the circuit. Sketch the shape of the VI graph for a. Fixed Resistor b. filament bulb c. diode
A
V
mA
V

24|P a g e
Page24
Q1.A student wants to investigate how the current through a filament lamp affects its resistance.
(a) Use the circuit symbols in the boxes to draw a circuit diagram that she could use.
12 V battery
variable resistor
filament lamp voltmeter ammeter
(2)
(b) Describe how the student could use her circuit to investigate how the current through a filament lamp affects its resistance.
.............................................................................................................................
.............................................................................................................................
.............................................................................................................................
.............................................................................................................................
.............................................................................................................................
.............................................................................................................................
.............................................................................................................................
............................................................................................................................. (4)
(c) The student’s results are shown in Figure 1.
Figure 1

25|P a g e
Page25
Describe how the resistance of the filament lamp changes as the current through it increases.
.............................................................................................................................
............................................................................................................................. (1)
(d) Use Figure 1 to estimate the resistance of the filament lamp when a current of 0.10 A passes through the lamp.
Resistance = .......................................... Ω (1)

26|P a g e
Page26
(e) The current-potential difference graphs of three components are shown in Figure 2.
Use answers from the box to identify each component.
diode filament lamp light dependent resistor
resistor at constant temperature thermistor
Figure 2
....................................................
....................................................
.................................................... (3)
(Total 11 marks)

27|P a g e
Page27
Q2.Electrical circuits have resistance.
(a) Draw a ring around the correct answer to complete the sentence.
When the resistance of a circuit increases, the current in the circuit
decreases.
increases.
stays the same.
(1)
(b) Use the correct answer from the box to complete each sentence.
a filament bulb an LED an LDR
An electrical component which has a resistance that increases as the
temperature increases is .................................................. .
An electrical component which emits light only when a current flows through it
in the forward direction is .................................................. . (2)
(c) When some metals are heated the resistance of the metal changes.
The equipment for investigating how the resistance of a metal changes when it is heated is shown in the diagram.

28|P a g e
Page28
In this question you will be assessed on using good English, organising information clearly and using specialist terms where appropriate.
Describe an investigation a student could do to find how the resistance of a metal sample varies with temperature. The student uses the equipment shown.
Include in your answer:
• how the student should use the equipment
• the measurements the student should make
• how the student should use these measurements to determine the resistance
• how to make sure the results are valid.
.........................................................................................................................
.........................................................................................................................
.........................................................................................................................
.........................................................................................................................
.........................................................................................................................
.........................................................................................................................
.........................................................................................................................
.........................................................................................................................
.........................................................................................................................
.........................................................................................................................
.........................................................................................................................
.........................................................................................................................
.........................................................................................................................
.........................................................................................................................
.........................................................................................................................
.........................................................................................................................
.........................................................................................................................
......................................................................................................................... (6)
29|P a g e
Page29
(d) The table shows some data for samples of four metals P, Q, R and S.
The metal samples all had the same cross-sectional area and were the same length.
Metal sample Resistance at
0°C in ohms
Resistance at 100°C in ohms
P 4.05 5.67
Q 2.65 3.48
R 6.0 9.17
S 1.70 2.23
A graph of the results for one of the metal samples is shown.
Temperature in °C
(i) Which metal sample, P, Q, R or S, has the data shown in the graph? (1)

30|P a g e
Page30
(ii) One of the results is anomalous. Circle this result on the graph. (1)
(iii) Suggest a reason for the anomalous result.
................................................................................................................
................................................................................................................ (1)
(iv) The same equipment used in the investigation could be used as a thermometer known as a ‘resistance thermometer.’
Suggest two disadvantages of using this equipment as a thermometer compared to a liquid-in-glass thermometer.
1 .............................................................................................................
................................................................................................................
2 .............................................................................................................
................................................................................................................ (2)
(Total 14 marks)

31|P a g e
Page31
Q3.A student investigated how current varies with potential difference for two different lamps.
Her results are shown in the figure below.
(a) Complete the circuit diagram for the circuit that the student could have used to obtain the results shown in the figure above.
(3)
(b) Which lamp will be brighter at any potential difference?
Explain your answer.
Use the figure above to aid your explanation
.............................................................................................................................
.............................................................................................................................
.............................................................................................................................
............................................................................................................................. (2)
(c) Lamp B has the higher resistance at any potential difference.
Explain how the figure above shows this.
.............................................................................................................................

32|P a g e
Page32
.............................................................................................................................
.............................................................................................................................
............................................................................................................................. (2)
(d) Both lamps behave like ohmic conductors through a range of values of potential difference.
Use the figure above to determine the range for these lamps.
Explain your answer.
.............................................................................................................................
.............................................................................................................................
.............................................................................................................................
.............................................................................................................................
.............................................................................................................................
............................................................................................................................. (3)
(Total 10 marks)
GCSEPhysicsrequiredpracticalactivity:Density
Requiredpracticalactivity Apparatusandtechniques
Useappropriateapparatustomakeandrecordthemeasurementsneededtodeterminethedensitiesofregularandirregularsolidobjectsandliquids.
Volumeshouldbedeterminedfromthedimensionsofregularlyshapedobjectsandbyadisplacementtechniqueforirregularlyshapedobjects.
Dimensionstobemeasuredusingappropriateapparatussuchasaruler,micrometreorVerniercallipers.
AT1
Identifyingasubstancefromitsdensity.
Therearethreeactivities.Ineachoneyouaregoingtomeasurethedensityofanobject.Youwillthenusethisvaluetofindoutwhatthesubstanceis.Youwillbeexpectedtoworkasaccuratelyaspossible.
Activity1:youwilldeterminethedensityofaregularshapedobjectusingarulerandbalance.
Activity2:youwillmeasurethemassofanobjectinthesamewayasactivity1.Youwillalsomeasureitsvolumefromtheamountofwateritdisplaces.Activity3:youwillfindthedensityofaliquid.

33|P a g e
Page33
Method
Activity1:Regularshapedobjects
Youareprovidedwiththefollowing:
• 30cmrulermarkedoffinmm
• digitalbalance
• regularshapedobjects.
1. Foreachobjectmeasurethe:
• length
• width
• height.
2. Recordyourresultsinatable.
Includecolumnsforvolume,mass,densityandsubstance.
• volume
• mass
• density
• substance.
3. Measurethemassofeachobjectusingthedigitalbalance.Recordtheresults.4. Calculateandrecordthevolumes(length´width´height).5. Calculateandrecordthedensities(mass÷volume).6. Usethetablebelowtoidentifythesubstanceeachobjectismadefrom.
Substance Aluminium Zinc Iron Copper Gold
Densitying/cm3 2.7 7.1 7.9 8.9 19.3
Activity2: Irregularshapedobjects.
Youareprovidedwiththefollowing:
• digitalbalance
• displacementcanandsomethingtostanditon(egabrick)
• variousmeasuringcylinders
• beakerofwaterandanextraemptybeaker
• papertowels

34|P a g e
Page34
• cottonorthinstring
• irregularlyshapedobjects.1. Measurethemassofoneoftheirregularshapedobjects.2. Recordyourresultinatable.
Itwillneedcolumnsfor:
• volume
• density
• mass
• substance.
3. Placeadisplacementcanonabrick.Putanemptybeakerunderthespoutandfillthecanwithwater.Watershouldbedrippingfromthespout.
4. Waituntilthewaterstopsdripping.Thenplaceameasuringcylinderunderthespoutinsteadofthebeaker.Choosethemeasuringcylinderyouthinkwillgivethemostprecisereading.
5. Tietheobjecttoapieceofcotton.Verycarefullyloweritintothedisplacementcansothatitiscompletelysubmerged.
Collectallofthewaterthatcomesoutofthespoutinthemeasuringcylinder.
6. Measureandrecordthevolumeofthecollectedwater.Thisvolumeisequaltothevolumeoftheobject. 7. Calculateandrecordthedensityoftheobject.
Trytofindoutwhatsubstanceitismadefrom.8. Repeatsteps1‒7forsomeotherobjects.
Remembertorefillthecaneachtime.

35|P a g e
Page35
Activity3–liquid
Youareprovidedwiththefollowing
• digitalbalance
• 250mlbeaker
• 100mlmeasuringcylinder
• suitableliquidegsugarsolution.
1. Measurethemassoftheemptybeaker.
2. Recordyourresultsinatable.
Yourtablewillneedcolumnsforthe:
• massoftheemptybeaker
• massofthebeakerwiththeliquidin
• massoftheliquid
• volumeoftheliquid
• densityoftheliquid.
3. Pourabout100mlofliquidintothemeasuringcylinder.Measureandrecordthevolume.4. Pourthisliquidintothebeaker.Measureandrecordthemassofthebeakerandliquid.5. Calculateandrecordthevolumeoftheliquid.6. Calculatethedensityoftheliquid.7. Thedensityofwateris1g/cm3.8. Determinethemassofsugarpercm3dissolvedinthewater.Assumethesugardoesnotaffectthevolumeof
thewater.

36|P a g e
Page36
Questions
Q1.A student wants to calculate the density of the two objects shown in the figure below.
© Whitehoune/iStock/Thinkstock, © Marc Dietrich/Hemera/Thinkstock
Describe the methods that the student should use to calculate the densities of the two objects.
.................................................................................................................................
.................................................................................................................................
.................................................................................................................................
.................................................................................................................................
.................................................................................................................................
.................................................................................................................................
.................................................................................................................................
.................................................................................................................................
.................................................................................................................................
................................................................................................................................. (Total 6 marks)

37|P a g e
Page37
GCSEPhysicsrequiredpracticalactivity:Forceandextension
Requiredpracticalactivity Apparatusandtechniques
Investigatetherelationshipbetweenforceandextensionforaspring. AT1,AT2
Makingandcalibratingaspringbalance(newtonmeter)
Youwillinvestigatetherelationshipbetweentheweighthungfromaspringandhowmuchlongerthespringgets(theextension).
Youwilluseyourresultstoplotagraphofextensionagainstweight.Thenyouwilluseyourgraphtofindtheweightofamysteryobject.
Method
Youareprovidedwiththefollowing:
• aspring
• ametreruler
• asplintandtapetoactasapointer
• a10Nweightstack
• aclampstand,withtwoclampsandbosses
• aheavyweighttopreventtheapparatustippingover
• amysteryobjecttoweigh.
1. Attachthetwoclampstotheclampstandusingthebosses.Thetopclampshouldbefurtheroutthanthelowerone.
2. Placetheclampstandneartheedgeofabench.Theendsoftheclampsneedtostickoutbeyondthebench.3. Placeaheavyweightonthebaseoftheclampstandtostoptheclampstandtippingover.

38|P a g e
Page38
4. Hangthespringfromthetopclamp.5. Attachtherulertothebottomclampwiththezeroonthescaleatthetopoftheruler.
Iftherearetwoscalesgoinginoppositedirections,youwillhavetoremembertoreadtheonethatincreasesgoingdown.
6. Adjusttherulersothatitisvertical.Thezeroonthescaleneedstobeatthesameheightasthetopofthespring.
7. Attachthesplintsecurelytothebottomofthespring.Makesurethatthesplintishorizontalandthatitrestsagainstthescaleoftheruler.
8. Takeareadingontheruler–thisisthelengthoftheunstretchedspring.9. Carefullyhookthebaseoftheweightstackontothebottomofthespring.Thisweighs1.0newton(1.0N).10. Takeareadingontheruler–thisisthelengthofthespringwhenaforceof1.0Nisappliedtoit.11. Addfurtherweights.Measurethelengthofthespringeachtime.12. Recordyourresultsinatablesuchastheonebelow.Youwillneedathirdcolumnfortheextension.Thisisthe
amountthestringhasstretched.Tocalculatethisyousubtractthelengthoftheunstretchedspringfromeachofyourlengthreadings.
WeightinN Lengthofspringincm Extensionofspringincm
13. Donotputtheapparatusawayyet.14. Plotagraphwith:
• ‘Extensionofspringincm’onthey-axis
• ‘WeightinN’onthex-axis.Hangtheunknownobjectonthespring.Measuretheextensionanduseyourgraphtodeterminetheobject’sweight.Checkitwithanewtonmeter.
Questions
Whataretheunitsofweight?
Whataretheunitsofmass?
Explainhowyouwillcalculatetheextensionofthespring?
Thisexperimentwillonlyworkupuntilthelimitofproportionality,explainwhatthismeans.

39|P a g e
Page39
Q1.A student suspended a spring from a laboratory stand and then hung a weight from the spring.
Figure 1 shows the spring before and after the weight is added.
Figure 1
(a) Which distance gives the extension of the spring?
Tick one box.
from J to K
from K to L
from J to L
(1)
(b) The student used the spring, a set of weights and a ruler to investigate how the extension of the spring depended on the weight hanging from the spring.
Figure 2 shows that the ruler is in a tilted position and not upright as it should be.
Figure 2

40|P a g e
Page40
How would leaving the ruler tilted affect the weight and extension data to be recorded by the student?
Use answers from the box to complete each sentence.
Each answer may be used once, more than once or not at all.
greater than the same as smaller than
The weight recorded by the student would be .......................................... the actual weight.
The extension recorded by the student would be .......................................... the actual weight.
(2)
(c) The student moves the ruler so that it is upright and not tilted.
The student then completed the investigation and plotted the data taken in a graph.
The student’s graph is shown in Figure 3.
Figure 3

41|P a g e
Page41
Use Figure 3 to determine the additional force needed to increase the extension of the spring from 5cm to 15cm.
Additional force = ............................................ N (1)
(d) What can you conclude from Figure 3 about the limit of proportionality of the spring? (1)
(e) The student repeated the investigation with three more springs, K, L and M.
The results for these springs are given in Figure 4.
Figure 4

42|P a g e
Page42
All three springs show the same relationship between the weight and extension.
What is that relationship?
Tick one box.
The extension increases non-linearly with the increasing weight.
The extension is inversely proportional to the weight.
The extension is directly proportional to the weight.
(1)
(f) Which statement, A, B or C, should be used to complete the sentence?
Write the correct letter, A, B or C, in the box below.
A a lower spring constant than
B the same spring constant as
C a greater spring constant than
From Figure 4 it can be concluded that spring M has the other two springs. (1)
(Total 7 marks)

43|P a g e
Page43
Q2.A student suspended a spring from a laboratory stand and then hung a weight from the spring.
Figure 1 shows the spring before and after the weight is added.
Figure 1
(a) Measure the extension of the spring shown in Figure 1.
Extension = ............................................... mm (1)
(b) The student used the spring, a set of weights and a ruler to investigate how the extension of the spring depended on the weight hanging from the spring.
Before starting the investigation the student wrote the following prediction:
The extension of the spring will be directly proportional to the weight hanging from the spring.
Figure 2 shows how the student arranged the apparatus.
Figure 2

44|P a g e
Page44
Before taking any measurements, the student adjusted the ruler to make it vertical.
Explain why adjusting the ruler was important.
.............................................................................................................................
.............................................................................................................................
.............................................................................................................................
............................................................................................................................. (2)
(c) The student measured the extension of the spring using a range of weights.
The student’s data is shown plotted as a graph in Figure 3.
Figure 3
What range of weight did the student use?
............................................................................................................................. (1)
(d) Why does the data plotted in Figure 3 support the student’s prediction?
.............................................................................................................................
............................................................................................................................. (1)
(e) Describe one technique that you could have used to improve the accuracy of the measurements taken by the student.
.............................................................................................................................
.............................................................................................................................

45|P a g e
Page45
.............................................................................................................................
............................................................................................................................. (2)
(f) The student continued the investigation by increasing the range of weights added to the spring.
All of the data is shown plotted as a graph in Figure 4.
Figure 4
At the end of the investigation, all of the weights were removed from the spring.
What can you conclude from Figure 4 about the deformation of the spring?
.............................................................................................................................
.............................................................................................................................
Give the reason for your conclusion.
.............................................................................................................................
............................................................................................................................. (2)
(Total 9 marks)

46|P a g e
Page46
GCSEPhysicsrequiredpracticalactivity:Acceleration
Requiredpracticalactivity Apparatusandtechniques
Investigatetheeffectofvaryingtheforceontheaccelerationofanobjectofconstantmassandtheeffectofvaryingthemassofanobjectontheaccelerationproducedbyaconstantforce.
AT1,AT2,AT3
Investigatingaccelerationusinganairtrackandlightgates.
Youwillinvestigatetherelationshipbetweentheaccelerationofanobjectandthesizeoftheforceactinguponit.
Youwilluseanairtrack.Thisproducesacushionofairwhichallowsgliderstomovealmostfrictionfree.
Youareprovidedwiththefollowing:
• linearairtrackandgliders
• vacuumcleaner
• benchpulley,stringandsmallweightstackeg1Ninstepsof0.2N
• card
• twoclampstands,withclampsandbosses
• twolightgates,interfaceandcomputer
• Adhesiveputtytoattachtheweightstotheglider.
1. Placetheairtrackonabenchandattachittothevacuumcleaner,seton‘blow’.2. Placeagliderontheairtrackandswitchonthevacuumcleaner.Theglidershouldliftupofftheairtrackand
befreetomove.3. Adjustthelegsoftheairtracksothattheglidermoveswithouttouchingandtheairtrackishorizontal.
Therearetwoseparateadjustmentstomake.Withthevacuumcleaneron:
• placethegliderabovetheadjusterthattiltstheairtrackfromsidetoside.Adjustthelengthoftheleguntilthegliderdoesnottouchthesides
• placethegliderinthemiddleoftheairtrack.Adjusttheotherleguntilthegliderdoesnotmovewhenreleased.
4. Cutoutapieceofcardmeasuring5cm´20cm.Putitinthegrooveontheglider.Thelongsideshouldbehorizontal.
5. Clampthetwolightgateshorizontally.Positionthemabovetheairtracksothatthecardpassesthroughthemastheglidermoves.
6. Connectthelightgatestotheinterfaceandcomputer.Startthesoftwarefortiming.
Youshouldhavetheopportunitytochooseaccelerationusingtwolightgates.
Typeinthelengthofthecard(20cm)whenaskedbythecomputer.

47|P a g e
Page47
7. Checkthemovementofthegliderbygentlypushingitalongthetrack.Thesoftwareneedstobeon.Theaccelerationshouldbeclosetozero.Switchoffthevacuumcleaner.
8. Attachthebenchpulleytotheendoftheairtrackawayfromthevacuumcleaner.9. Tiealengthofstringtotheglider.Passthestringoverthepulleyandattachtheweightstacktotheotherend
ofthestring.
Makesurethestringishorizontalandisinlinewiththeairtrack.10. Switchonthevacuumcleaner.Theglidershouldacceleratethroughthelightgatesastheweightfallstothe
ground.11. Ifnecessary,movethesecondlightgatesothatthegliderpassesthroughitbeforetheweighthitstheground.
Iftheweighthitsthegroundtooearly,thegliderwillstopacceleratingtooearly.
12. The first experiment will investigate how the acceleration depends upon the force. The force is provided by the weight stack.
• Attach the full weight stack (1 N) to the end of the string.
• Switch on the software.
• Make sure the glider is in position and switch on the vacuum cleaner.
• The glider should accelerate through the light gates towards the bench pulley.
• Record the acceleration. Repeat.
• If the two values are not similar, repeat again.
• Record your readings in a table such as the one below. Calculate the mean.

48|P a g e
Page48
ForceinN
Accelerationincm/s2
Firstreading SecondreadingThirdreading(ifnecessary)
Mean
13. Remove one weight (0.2 N) and attach that to the glider. This will keep the total mass constant. (The
weight stack is being accelerated too.)
14. Repeat the experiment for a force of:
• 0.8 N
• 0.6 N
• 0.4 N
• 0.2 N. Remember to attach each weight to the glider as it is removed from the weight stack.
15. Plot a graph with:
• ‘Acceleration in m/s2’ on the y-axis
• ‘Force in N’ on the x-axis.

49|P a g e
Page49
Questions
Whatistheindependentvariable?
Whatistherangeoftheindependentvariable?
Whatisthedependentvariable?
WhatistheintervalbetweentheForcesused?
Explainhowyoucalculateameanvalue.
Explainwhycalculatingameanvalueisuseful?
GCSEPhysicsrequiredpracticalactivity:Waves
Required practical activity Apparatus and techniques
Make observations to identify the suitability of apparatus to measure the frequency, wavelength and speed of waves in a ripple tank and waves in a solid and take appropriate measurements.
AT 4
Theactivityissplitintotwoparts:
• observingwaterwavesinarippletank
• observingwavesonastretchedstringorelasticcord.
Activity1:Observingwavesinarippletank
Youareprovidedwiththefollowing:
• rippletankplusaccessories
• suitablelowvoltagepowersupply
• metreruler.
1. Setuptherippletank.
Alargesheetofwhitecardorpaperneedstobeonthefloorunderthetank.

50|P a g e
Page50
2. Pourwatertoadepthofabout5mmintothetank.3. Adjusttheheightofthewoodenrodsothatitjusttouchesthesurfaceofthewater.4. Switchonboththeoverheadlampandtheelectricmotor.5. Adjustthespeedofthemotor.Lowfrequencywaterwavesneedtobeproduced.6. Adjusttheheightofthelamp.Thepatternneedstobeclearlyseenonthecardonthefloor.7. Placeametreruleratrightanglestothewavesshowninthepatternonthecard.
Measureacrossasmanywavesaspossible.Thendividethatlengthbythenumberofwaves.Thisgivesthewavelengthofthewaves.
8. Countthenumberofwavespassingapointinthepatternoveragiventime(say10seconds).
Thendividethenumberofwavescountedby10.Thisgivesthefrequencyofthewaves.
9. Calculatethespeedofthewavesusingtheequation:
wavespeed=frequency´wavelength
Activity2:Observingwavesonastretchedstringorelasticcord.
Youareprovidedwiththefollowing:
• vibrationgenerator
• suitablepowersupply(variablefrequency)
• suitablestringorelasticatedcord
• setof100gmassesandhanger
• setof10gmassesandhanger
• woodenbridge
• pulleyonaclamp.
1. Setuptheapparatusasshown.
2. Switchonthevibrationgenerator.Thestring(orelasticatedcord)shouldstarttovibrate.3. Aclearwavepatternneedstobeseen.Todothis,adjustthetensioninthestringormovethewoodenbridge
toadjustthelengthofthestring.
Thewavesshouldlookliketheyarestationary.

51|P a g e
Page51
4. Useametrerulertomeasureacrossasmanyhalfwavelengthsaspossible(ahalfwavelengthisoneloop).
Thendividethetotallengthbythenumberofhalfwaves.Multiplyingthisnumberbytwowillgivethewavelength.
5. Thefrequencyisthefrequencyofthepowersupply.
6. Calculatethespeedofthewaveusingtheequation:wavespeed=frequency´wavelength
Questions
Whataretheunitsofwavespeed?
Whataretheunitsofwavelength?
Whataretheunitsoffrequency?
Drawadiagramofawaveandlabelthewavelength.
If15wavespassapointin10secondswhatisthefrequency?
If2wavespassapointin4secondswhatisthefrequency?
Q1. (a) A swimming pool has a wave making machine. The diagram shows the water wave pattern for 3 seconds.
(i) How many water waves are shown in the diagram?
................................................................................................................... (1)
(ii) What is the frequency of the water waves?
................................................................................................................... (1)
(iii) Which one of the units below is used to measure frequency? Underline your answer.
hertz joule watt (1)

52|P a g e
Page52
(b) The diagram shows the direction of the waves across the pool. The waves reflect off the side of the pool.
Draw a line on the diagram to show the direction of the waves after they hit the side of the pool.
(1)
(c) The swimming pool is used to test a model of an electricity generator. The waves make the floating generator move up and down. This energy is transferred to electricity.
(i) In the following sentence, cross out the two lines that are wrong in the box.
The diagram shoes that the amplitude of the waves as the waves pass the generator.
(1)
(ii) What type of energy does the generator transfer to electricity?
................................................................................................................... (1

53|P a g e
Page53
(iii) Energy from ocean waves could be used to generate electricity. Would this be a renewable or non-renewable energy resource?
................................................................................................................... (1)
(Total 7 marks)
Q2. The diagram shows a water wave drawn to scale.
(a) What is the wavelength of this water wave? ............................... cm (1)
(b) What is the amplitude? ............................... cm (1)
(c) Twelve waves pass an observer in four seconds.
What is the frequency of the waves? Show clearly how you work out your answer and give the unit.
.............................................................................................................................
.............................................................................................................................
Frequency = ..................................................................... (3)
(Total 5 marks)

54|P a g e
Page54
Q3. The diagram shows a wave travelling along a rope.
(a) On the diagram:
(i) show the wavelength and label it W;
(ii) show the amplitude and label it A. (2)
(b) The wavelength of the wave is 0. I m. Its frequency is 2 Hz.
Calculate the speed of the wave. Show clearly how you work out your answer and give the unit.
.............................................................................................................................
.............................................................................................................................
.............................................................................................................................
Speed of wave ................................................................. (3)
(Total 5 marks)

55|P a g e
Page55
GCSEPhysicsrequiredpracticalactivity:Light
Required practical activity Apparatus and techniques
Investigate the reflection of light by different types of surface and the refraction of light by different substances.
AT 4, AT 8
Whathappenstothedirectionoflightafterhittingthesurfaceofdifferentmaterials?
Whenlighthitsasurfaceitcanbereflected,transmittedandabsorbed.
Youwillinvestigatewhathappenstolightwhenitisreflectedandtransmitted.Youwillusetwodifferentmaterials.
Arayboxisusedtodirectarayoflightontothesurfaceofatransparentblock.Youwillthenmarkthepathoftheraythatis:
• reflected from the surface of the block
• that passes through the block.
Therayboxneedstoproduceanarrowrayoflight.Theexperimentneedstobeperformedinadarkenedroom.Thisissothatthepathsoftherayscanbemarkedprecisely.
Youwillthenrepeattheexperimentusingadifferentblockandcomparetheresults.
Youareprovidedwiththefollowing:
• raybox
• suitablepowersupply
• aslitandlensthatfittherayboxandcanbeusedtomakeanarrowray
• tworectangulartransparentblocksofdifferentmaterialsegglass,Perspex
• 30cmruler
• protractor
• sheetsofplainA3paper.
56|P a g e
Page56
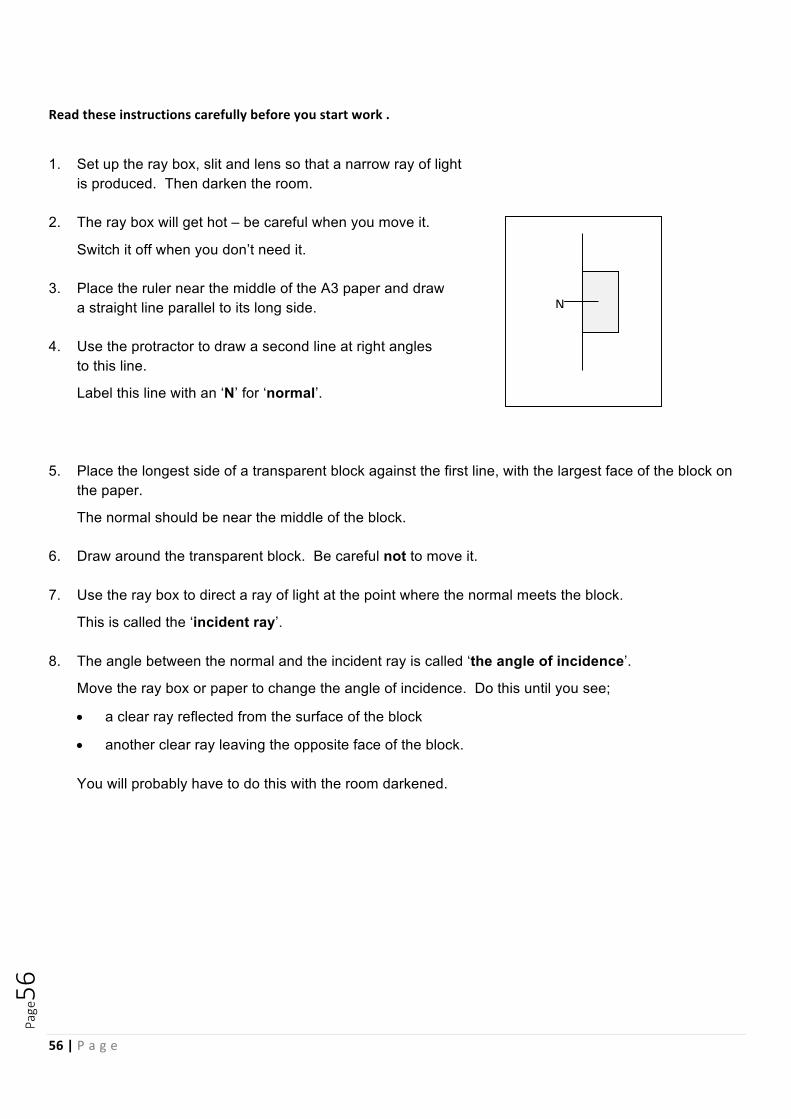
Readtheseinstructionscarefullybeforeyoustartwork.
1. Set up the ray box, slit and lens so that a narrow ray of light
is produced. Then darken the room.
2. The ray box will get hot – be careful when you move it.
Switch it off when you don’t need it.
3. Place the ruler near the middle of the A3 paper and draw a straight line parallel to its long side.
4. Use the protractor to draw a second line at right angles to this line.
Label this line with an ‘N’ for ‘normal’.
5. Place the longest side of a transparent block against the first line, with the largest face of the block on the paper.
The normal should be near the middle of the block.
6. Draw around the transparent block. Be careful not to move it.
7. Use the ray box to direct a ray of light at the point where the normal meets the block.
This is called the ‘incident ray’.
8. The angle between the normal and the incident ray is called ‘the angle of incidence’.
Move the ray box or paper to change the angle of incidence. Do this until you see;
• a clear ray reflected from the surface of the block
• another clear ray leaving the opposite face of the block. You will probably have to do this with the room darkened.
N

57|P a g e
Page57
9. Mark the path of the incident ray with a cross. If the ray is wide, make sure the centre of the cross is in the centre of the ray.
10. Mark the path of the reflected ray with another cross.
11. Mark the path of the ray that leaves the block (the transmitted ray) with two crosses. One cross needs to be near the block and the other cross further away.
12. Switch on the room lights. Switch off the ray box and remove the block.
13. Draw the incident ray by drawing a line through your first cross to the point where the normal meets the block.
14. Draw the reflected ray by drawing a line through your second cross to the point where the normal meets the block.
15. Draw the transmitted ray by drawing a line through the two crosses on the other side of the block to that side of the block. Label this point with a ‘P’.
16. Draw a line that represents the path of the transmitted ray through the block.
Do this by drawing a line from point P to the point where the normal meets the block.
17. Use the protractor to measure:
NX
X X X

58|P a g e
Page58
a. the angle between the incident ray and normal - this is the angle of incidence
b. the angle between the reflected ray and normal - this is the angle of reflection
c. the angle between the ray inside the block and the normal - this is the angle of refraction.
Recordyourmeasurementsinatablesuchastheonebelow.
Angle of incidence in degrees
First block Second block
Angle of reflection in
degrees
Angle of refraction in
degrees
Angle of reflection in
degrees
Angle of refraction in
degrees
18. Now repeat steps 3‒17 for the other transparent block.
Place the other block on the A3 paper. 19. Line up the long side of the block as before. 20. If the block is not the same size as the first one, carefully draw around it without moving it. 21. Use your ray box to send in an incident ray along the same line as before. Again you may have to
work in a darkened room. 22. Look at the directions of the reflected and transmitted rays. 23. If they are not the same as before, mark their paths using crosses. 24. Remove the block, switch off the ray box, and switch on the room lights.

59|P a g e
Page59
25. Draw in the reflected and refracted rays. 26. Measure the angle of reflection and the angle of refraction. Record them in your table. 27. Physics theory suggests that the angles of reflection should be the same, but the angles of refraction
should be different.
Questions
1. Whatisthelawofreflection?2. Whatdothefollowingwordsmean;transmit,absorb3. Whatisrefraction?4. Whatisthenormal?
Q1. The diagram shows a ray of light travelling through a glass block.
(a) Complete the diagram to show what happens to the ray of light when it comes out of the glass.
(2)
(b) Explain why this happens to the ray of light.
............................................................................................................................. (2)
(Total 4 marks)

60|P a g e
Page60
Q2.The data given in the table below was obtained from an investigation into the refraction of light at an air to glass boundary.
Angle of incidence
Angle of refraction
20° 13°
30° 19°
40° 25°
50° 30°
Describe an investigation a student could complete in order to obtain similar data to that given in the table above.
Your answer should consider any cause of inaccuracy in the data.
A labelled diagram may be drawn as part of your answer.
.............................................................................................................................
.............................................................................................................................
.............................................................................................................................
.............................................................................................................................
.............................................................................................................................
.............................................................................................................................
.............................................................................................................................
.............................................................................................................................
.............................................................................................................................
............................................................................................................................. (Total 6 marks)

61|P a g e
Page61
Q3. (a) A student investigated the refraction of light as it passes out of a transparent plastic block. She aimed a ray of light at point X. She marked the position of the ray as it passed through the transparent plastic block and into the air. The angle i is the angle of incidence.
(i) What is the name of angle r?
................................................................................................................... (1)
(ii) What is the name of the dashed line?
................................................................................................................... (1)
GCSEPhysicsrequiredpracticalactivity:Radiationandabsorption
Required practical activity Apparatus and techniques
Investigate how the amount of infrared radiation absorbed or radiated by a surface depends on the nature of that surface.
AT 1, AT 4
Investigatingtheamountofinfra-redradiationemittedbydifferentsurfaces
Youareprovidedwiththefollowing:
• Lesliecube• kettle
• infrareddetector
• heatproofmat.1. Place the Leslie cube on to a heat proof mat. 2. Fill the cube with very hot water and replace the lid of the cube.
Infrareddetector
62|P a g e
Page62
3. Use the detector to measure the amount of infrared radiated from each surface.
Make sure that before a reading is taken the detector is the same distance from each surface.
Draw a bar chart to show the amount of infrared radiated against the type of surface.
Questions
1. Whatistheindependentvariable?2. Whatisthedependentvariable?3. Giveexamplesofcontrolvariables4. Whichsurfacewillemitthemostinfraredradiation?Explainyouranswer.5. Foreachsurface3readingsweretakenusinganinfraredprobe.Seethetablebelow.
Colourofsurface
TemperatureofthesurfaceoC1 2 3 Mean
black 87.9 87.8 88.1 silver 23.3 24.5 53.2
5a.Calculatethemeanvalueforeachsurface.
5b.Whatistheresolutionoftheinfraredprobe?
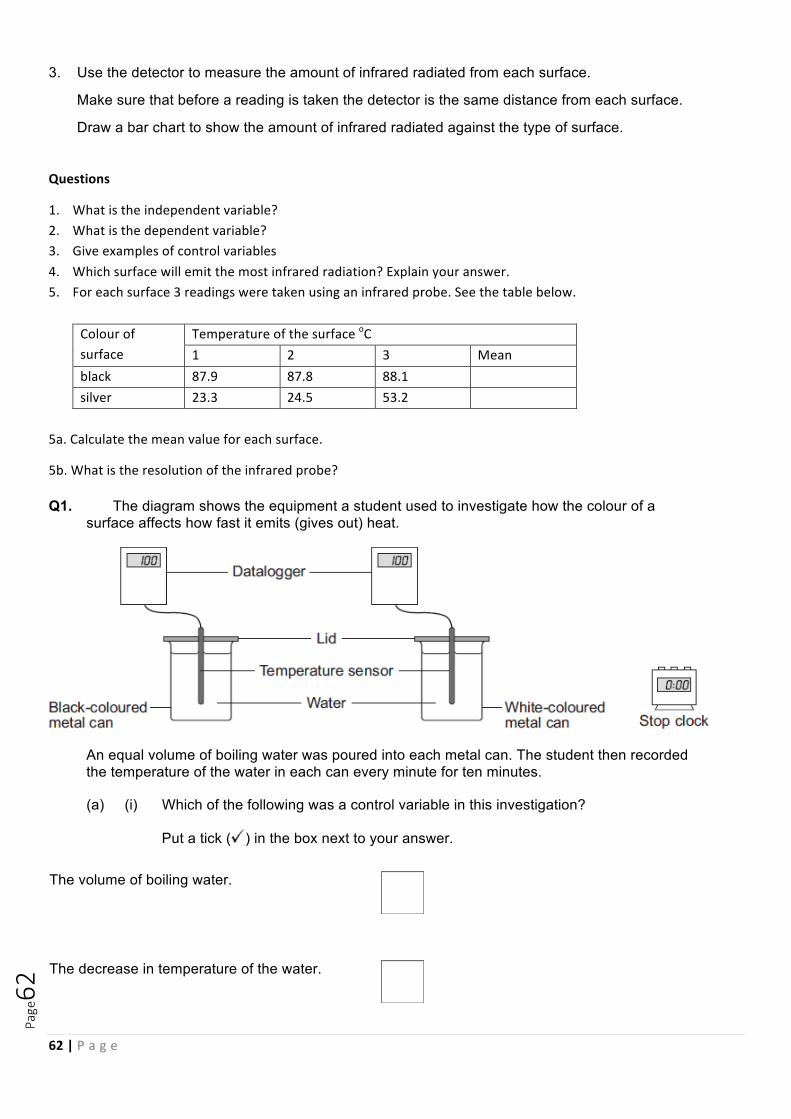
Q1. The diagram shows the equipment a student used to investigate how the colour of a surface affects how fast it emits (gives out) heat.
An equal volume of boiling water was poured into each metal can. The student then recorded the temperature of the water in each can every minute for ten minutes.
(a) (i) Which of the following was a control variable in this investigation?
Put a tick ( ) in the box next to your answer.
The volume of boiling water.
The decrease in temperature of the water.

63|P a g e
Page63
The outside colour of the metal can.
(1)
(ii) Give one advantage of using a temperature sensor and datalogger rather than a thermometer to measure the temperature of the water.
...............................................................................................................
............................................................................................................... (1)
(b) The student’s results for both cans are plotted on the graph.
Which line, A or B, shows how the temperature of the water inside the black-coloured metal can changed?
Draw a ring around your answer. A B
Explain the reason for your answer.
........................................................................................................................
........................................................................................................................
........................................................................................................................
........................................................................................................................ (2)

64|P a g e
Page64
(c) Some gardeners make soil darker by digging black soot into the soil. Other gardeners use straw to protect plants from the cold.
(i) Complete the following sentence by drawing a ring around the correct line in the box.
On a warm day, the temperature of darker coloured soil will increase
slower than
as fast as the temperature of lighter coloured soil.
faster than
(1)
(ii) Give a reason for your answer to part (c)(i).
...............................................................................................................
............................................................................................................... (1)
(iii) The statement in the box is false.
Straw keeps plants warm by trapping air. This is because air is a good conductor.
Change one word in the statement to make the statement true.
Write down your new statement. The answer has been started for you.
This is because air is a ............................................................................ (1)
(Total 7 marks)
Q2.All objects emit and absorb infrared radiation.
(a) Use the correct answer from the box to complete each sentence.
dark matt dark shiny light matt light shiny

65|P a g e
Page65
The best emitters of infrared radiation have
......................................................................... surfaces.
The worst emitters of infrared radiation have
......................................................................... surfaces. (2)
(b) Diagram 1 shows a sphere which is at a much higher temperature than its surroundings.
Diagram 1
Energy is transferred from the sphere to the surroundings.
The table shows readings for the sphere in three different conditions, A, B and C.
Condition Temperature of sphere in °C
Temperature of surroundings in °C
A 70 5
B 80 0
C 90 30
In each of the conditions, A, B and C, the sphere transfers energy to the surroundings at a different rate.
Put conditions A, B and C in the correct order.

66|P a g e
Page66
Give a reason for your answer.
.........................................................................................................................
......................................................................................................................... (2)
(c) Diagram 2 shows a can containing water.
A student investigates how quickly a can of water heats up when it is cooler than room temperature.
Diagram 2
The student has four cans, each made of the same material, with the following outer surfaces.
dark matt dark shiny light matt light shiny
The student times how long it takes the water in each can to reach room temperature.
Each can contains the same mass of water at the same starting temperature.
(i) Which can of water will reach room temperature the quickest?

67|P a g e
Page67
Give a reason for your answer.
................................................................................................................
................................................................................................................
................................................................................................................
................................................................................................................ (2)
(ii) Apart from material of the can, mass of water and starting temperature, suggest three control variables for the student’s investigation.
1 ............................................................................................................
................................................................................................................
2 ............................................................................................................
................................................................................................................
3 ............................................................................................................
................................................................................................................ (3)
(d) The photographs show two different foxes.
Fox A Fox B
By Algkalv (Own work) [CC-BY-3.0], © EcoPic/iStock
via Wikimedia Commons
Which fox is better adapted to survive cold conditions?
Give reasons for your answer.
.........................................................................................................................

68|P a g e
Page68
.........................................................................................................................
.........................................................................................................................
.........................................................................................................................
.........................................................................................................................
.........................................................................................................................
.........................................................................................................................
......................................................................................................................... (3)
(Total 12 marks)
Q3. A student investigated the effect of shape and colour on heat transfer.
The student used metal containers with the same volume but with different shapes and outside colour. The containers were each filled with water at 100 °C. After 20 minutes the temperature of the water inside each container was measured.
A
B
C
D
The results from the investigation are given in the table.
Container Colour Temperature after 20 minutes in °C
Temperature fall in °C
A White 86 14
B Black 86 14
C White 73 27
D Black 60 40

69|P a g e
Page69
(i) The student uses the results in the table to see if shape has affected heat transfer.
Which containers should the student compare to do this?
...............................................................................................................
Give a reason for your answer.
...............................................................................................................
............................................................................................................... (1)
(ii) Explain why the temperature of the water in both containers A and B fell by the same amount.
...............................................................................................................
...............................................................................................................
...............................................................................................................
............................................................................................................... (2)
(iii) A central heating system has several radiators joined together. The hot water goes from the boiler, through each radiator in turn and then back to the boiler for reheating.
Give one reason, other than appearance, why it might not be a good idea to paint radiators black.
...............................................................................................................
............................................................................................................... (1)
(Total 4 marks)
Q4. A student was asked to investigate the heat loss from two metal cans, L and M. The cans were identical except for the outside colour.

70|P a g e
Page70
The student filled the two cans with equal volumes of hot water. He then placed the temperature sensors in the water and started the data logger. The computer used the data to draw the graph below.
(a) Which one of the following is a categoric variable?
Put a tick ( ) in the box next to your answer.
the outside colour of the cans
the starting temperature of the hot water
the time

71|P a g e
Page71
the volume of hot water
(1)
(b) For can L, state the temperature drop of the water:
(i) in the first two-minute interval
................................................................................................................... (1)
(ii) in the second two-minute interval.
................................................................................................................... (1)
(c) In both cans the water cooled faster at the start of the investigation than at the end of the investigation. Why?
.............................................................................................................................
............................................................................................................................. (1)
(d) One can was black on the outside and the other can was white on the outside.
What colour was can L? ..............................................
Explain the reason for your answer.
.............................................................................................................................
.............................................................................................................................
............................................................................................................................. (3)
(Total 7 marks)

72|P a g e
Page72

73|P a g e
Page73

74|P a g e
Page74

75|P a g e
Page75


![Patholgy Practical Revision - Semester 3 [8] - By Shy You](https://img.pdfslide.net/doc/110x75/577ce4071a28abf1038d8b71/patholgy-practical-revision-semester-3-8-by-shy-you.jpg)