Embed Size (px)
Citation preview

History, Teaching, and Public Awareness
Physiological, Behavioral, and Scientific Impact ofDifferent Fluid Control Protocols in the RhesusMacaque (Macaca mulatta)
Helen Gray,1 Henri Bertrand,2 Claire Mindus,1 Paul Flecknell,2 Candy Rowe,1 and AlexanderThiele1
DOI:http://dx.doi.org/10.1523/ENEURO.0195-16.2016
1Institute of Neuroscience, Newcastle University, Newcastle upon Tyne NE2 4HH, United Kingdom, and 2ComparativeBiology Centre, Newcastle University, Newcastle upon Tyne NE1 7RU, United Kingdom
AbstractRhesus macaques are an important model in behavioral neuroscience due to their advanced cognitive abilities.To motivate animals to engage in complex tasks, fluid rewards, in conjunction with fluid control protocols, areoften used. The impact of these protocols on animal welfare is controversial. We compared two fluid controlprotocols against a protocol providing free access to water and evaluated the impacts on physiological states ofhydration, behavioral measures of welfare, and scientific output. Blood physiology did not significantly differbetween any of the protocols, and urine measures were indicative of well functioning, healthy kidneys. Changesin behaviors were limited, the main one being an increase in motivation to drink on the stricter fluid controlprotocol, and improved task performance early in the week. Overall, fluid control protocols had little measurableimpact on the welfare of rhesus macaques while ensuring that scientific data of high quality could be obtained.
Key words: motivation; nonhuman primate; welfare
IntroductionNonhuman primates are a widely used model in neuro-
science, due to their close phylogenetic relationship to
humans, and thus their relevance to understanding cog-nitive functions, brain disease, and aiding therapy (Roelf-sema and Treue, 2014). Primate-specific behavioral and
Received July 8, 2016; accepted August 12, 2016; First published September22, 2016.The authors declare no competing financial interests.Author contributions: H.G., P.F., C.R., and A.T. designed research; H.G. and
H.B. performed research; H.G. and C.M. analyzed data H.G., C.R., and A.T.wrote the paper.
The work was supported by the NC3Rs (Grant NC/K500410/1) and theWellcome Trust. The internet Primate Aging Database (iPAD) is supported bycontract HHSN271201300026C from the National Institute on Aging/NationalInstitutes of Health to Dr. Joseph W. Kemnitz at the Wisconsin NationalPrimate Research Center, University of Wisconsin-Madison.
Acknowledgments: We thank the staff of the Comparative Biology Centre(Newcastle University) for excellent technical support. We also thank Dr. LucyAsher and Rob Wood for help with statistical analysis of the behavioral data,
Professor Hannah Buchanan-Smith and Dr. Kris Descovich for feedback onthe ethogram, Professor Neil Sheerin for advice regarding physiological mea-sures of hydration, and Helen Currie for her help in behavioral analysis. Inaddition, we thank Michael Boyd, Dr. Christian Brandt, Dr. Miguel Da Silva, andDr. Alwin Gieselmann for accommodating this study into their existing re-search.
Correspondence should be addressed to Helen Gray, Institute of Neurosci-ence, Newcastle University, Newcastle upon Tyne NE2 4HH, UK. E-mail:[email protected].
DOI:http://dx.doi.org/10.1523/ENEURO.0195-16.2016Copyright © 2016 Gray et al.This is an open-access article distributed under the terms of the CreativeCommons Attribution 4.0 International, which permits unrestricted use, distri-bution and reproduction in any medium provided that the original work isproperly attributed.
Significance Statement
This study demonstrates that two fluid control protocols caused no detrimental effects to the physiology ofrhesus macaques. Behavioral impacts were limited, and laboratory performance improved during protocolswith stricter controls. Overall, fluid control has much less of an impact than widely proposed.
New Research
July/August 2016, 3(4) e0195-16.2016 1–15
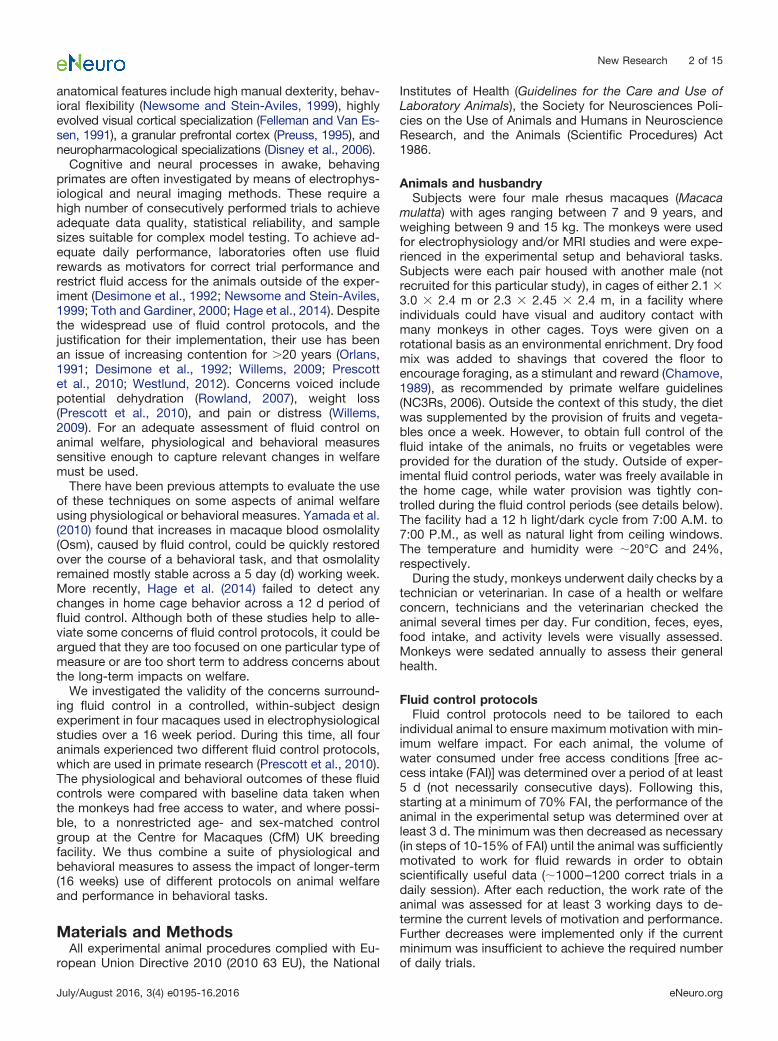
anatomical features include high manual dexterity, behav-ioral flexibility (Newsome and Stein-Aviles, 1999), highlyevolved visual cortical specialization (Felleman and Van Es-sen, 1991), a granular prefrontal cortex (Preuss, 1995), andneuropharmacological specializations (Disney et al., 2006).
Cognitive and neural processes in awake, behavingprimates are often investigated by means of electrophys-iological and neural imaging methods. These require ahigh number of consecutively performed trials to achieveadequate data quality, statistical reliability, and samplesizes suitable for complex model testing. To achieve ad-equate daily performance, laboratories often use fluidrewards as motivators for correct trial performance andrestrict fluid access for the animals outside of the exper-iment (Desimone et al., 1992; Newsome and Stein-Aviles,1999; Toth and Gardiner, 2000; Hage et al., 2014). Despitethe widespread use of fluid control protocols, and thejustification for their implementation, their use has beenan issue of increasing contention for �20 years (Orlans,1991; Desimone et al., 1992; Willems, 2009; Prescottet al., 2010; Westlund, 2012). Concerns voiced includepotential dehydration (Rowland, 2007), weight loss(Prescott et al., 2010), and pain or distress (Willems,2009). For an adequate assessment of fluid control onanimal welfare, physiological and behavioral measuressensitive enough to capture relevant changes in welfaremust be used.
There have been previous attempts to evaluate the useof these techniques on some aspects of animal welfareusing physiological or behavioral measures. Yamada et al.(2010) found that increases in macaque blood osmolality(Osm), caused by fluid control, could be quickly restoredover the course of a behavioral task, and that osmolalityremained mostly stable across a 5 day (d) working week.More recently, Hage et al. (2014) failed to detect anychanges in home cage behavior across a 12 d period offluid control. Although both of these studies help to alle-viate some concerns of fluid control protocols, it could beargued that they are too focused on one particular type ofmeasure or are too short term to address concerns aboutthe long-term impacts on welfare.
We investigated the validity of the concerns surround-ing fluid control in a controlled, within-subject designexperiment in four macaques used in electrophysiologicalstudies over a 16 week period. During this time, all fouranimals experienced two different fluid control protocols,which are used in primate research (Prescott et al., 2010).The physiological and behavioral outcomes of these fluidcontrols were compared with baseline data taken whenthe monkeys had free access to water, and where possi-ble, to a nonrestricted age- and sex-matched controlgroup at the Centre for Macaques (CfM) UK breedingfacility. We thus combine a suite of physiological andbehavioral measures to assess the impact of longer-term(16 weeks) use of different protocols on animal welfareand performance in behavioral tasks.
Materials and MethodsAll experimental animal procedures complied with Eu-
ropean Union Directive 2010 (2010 63 EU), the National
Institutes of Health (Guidelines for the Care and Use ofLaboratory Animals), the Society for Neurosciences Poli-cies on the Use of Animals and Humans in NeuroscienceResearch, and the Animals (Scientific Procedures) Act1986.
Animals and husbandrySubjects were four male rhesus macaques (Macaca
mulatta) with ages ranging between 7 and 9 years, andweighing between 9 and 15 kg. The monkeys were usedfor electrophysiology and/or MRI studies and were expe-rienced in the experimental setup and behavioral tasks.Subjects were each pair housed with another male (notrecruited for this particular study), in cages of either 2.1 �3.0 � 2.4 m or 2.3 � 2.45 � 2.4 m, in a facility whereindividuals could have visual and auditory contact withmany monkeys in other cages. Toys were given on arotational basis as an environmental enrichment. Dry foodmix was added to shavings that covered the floor toencourage foraging, as a stimulant and reward (Chamove,1989), as recommended by primate welfare guidelines(NC3Rs, 2006). Outside the context of this study, the dietwas supplemented by the provision of fruits and vegeta-bles once a week. However, to obtain full control of thefluid intake of the animals, no fruits or vegetables wereprovided for the duration of the study. Outside of exper-imental fluid control periods, water was freely available inthe home cage, while water provision was tightly con-trolled during the fluid control periods (see details below).The facility had a 12 h light/dark cycle from 7:00 A.M. to7:00 P.M., as well as natural light from ceiling windows.The temperature and humidity were �20°C and 24%,respectively.
During the study, monkeys underwent daily checks by atechnician or veterinarian. In case of a health or welfareconcern, technicians and the veterinarian checked theanimal several times per day. Fur condition, feces, eyes,food intake, and activity levels were visually assessed.Monkeys were sedated annually to assess their generalhealth.
Fluid control protocolsFluid control protocols need to be tailored to each
individual animal to ensure maximum motivation with min-imum welfare impact. For each animal, the volume ofwater consumed under free access conditions [free ac-cess intake (FAI)] was determined over a period of at least5 d (not necessarily consecutive days). Following this,starting at a minimum of 70% FAI, the performance of theanimal in the experimental setup was determined over atleast 3 d. The minimum was then decreased as necessary(in steps of 10-15% of FAI) until the animal was sufficientlymotivated to work for fluid rewards in order to obtainscientifically useful data (�1000–1200 correct trials in adaily session). After each reduction, the work rate of theanimal was assessed for at least 3 working days to de-termine the current levels of motivation and performance.Further decreases were implemented only if the currentminimum was insufficient to achieve the required numberof daily trials.
New Research 2 of 15
July/August 2016, 3(4) e0195-16.2016 eNeuro.org

We assessed the following three different conditions: acontrol period of free access to water (hereafter “freeaccess”); and both a 5 d and a 7 d fluid control protocol(hereafter called the “5 d protocol” and the “7 d protocol”).The 5 d protocol consisted of 5 d of fluid control with freeaccess to water on days 6 and 7. This is the standardprotocol implemented in our laboratory. The second pro-tocol consisted of 7 d of fluid control, where animals hadaccess to their individually established minimum everyday, which they could exceed by means of their work rateduring experimental weekdays, but not on days 6 and 7.The 7 d protocol was tested to investigate whether itcould result in improved scientific output, and what thepotential welfare implications would be. On a 5 d protocol,work rates following the 2 d of free access are normallytoo low to allow for electrophysiology recordings, leavingat least 1 d/week where the animal is fluid restricted andworks on the cognitive task in the laboratory withoutusable data being collected. If a 7 d protocol was moreeffective at motivating animals to perform the task on aMonday, data collection could be quicker and periods offluid control could be reduced. Given these potential ben-efits, it was important to be able to compare welfaremeasures between protocols as well as to a control pe-riod of free access.
On the 5 d protocol, the subjects received their mini-mum allowance amount either in the laboratory (Mondayto Thursday) or in the home cage (Sunday). On Fridayevenings and Saturdays, they were given free access towater in the home cage. On the 7 d protocol, the monkeysreceived their minimum fluid intake every day (Monday toFriday in the laboratory and Saturday and Sunday in thehome cage), but were never given free access to water.Each protocol lasted for 4 weeks at a time and wasrepeated twice (a total of 16 weeks of study, 8 weeks foreach protocol). The protocols were given either in a 5-7-5-7 d order (two monkeys) or a 7-5-7-5 d order (twomonkeys). The monkeys were sampled for blood andurine on the last Friday morning of each protocol (detailedbelow). After sampling, they were given free access towater for Friday morning and afternoon before the nextprotocol began on Saturday.
Animals worked 5 d/week (Monday to Friday) through-out the experiment. Within a daily experimental session,the monkey was allowed to work for as much fluid as hewanted, but in situations where the minimum daily allow-ance was not earned during the task, the monkey wassupplemented (to its established minimum) with water inthe laboratory after the session had finished. Therefore,monkeys received at least their minimum fluid allowanceevery working day. Two monkeys were rewarded withblackcurrant juice (Ribena, Lucozade Ribena SuntoryLtd), one monkey was rewarded with water and one withdiluted Coca-Cola (the Coca-Cola Company). For the 16weeks of fluid restriction, monkeys were separated fromtheir cage mates from Friday evening until Sunday after-noon. This was done to obtain accurate recordings of fluidintake for the monkey of interest and to ensure that thecage mate had adequate (unrestricted) access to waterfor that period.
Prior to the fluid control protocols, the monkeys expe-rienced a control period of 12 d, during which they hadfree access to water, and during which behavioral andphysiological measures were obtained. A second controlperiod of 12 d was conducted 6 months after the com-pletion of the fluid control protocols, and physiologicalmeasures were obtained again and used with those fromthe first control period for analysis.
Tasks performed by the primatesFor the duration of this study, each monkey was also
involved in ongoing neuroscience experiments, in whichthey were performing tasks in relation to visually pre-sented stimuli to obtain fluid rewards. Three subjectswere engaged in covert top–down attentional tasks withindividual trial times of 2000–4000 ms. The other monkeywas performing a memory-guided saccade task, withindividual trials taking up to 5000 ms. Experiments wereperformed in a dimly lit room. Monkeys were weigheddaily before the start of the task, and then transferredbetween the housing unit and the laboratory using acustom-made trolley, onto which the primate chair wasfitted. Performance in the laboratory was monitored viacomputer control; task performance (i.e., the number ofcorrect trials performed by the monkey in their task) wasrecorded for each session. The criteria for determiningwhen the monkey had stopped working (e.g., no consis-tent task engagement for �15 min) differed slightly be-tween animals and experimenter, but they remainedconsistent for individual monkeys over the course of thestudy. When animals had stopped working according tothese criteria, they were transferred back to the cage.Experimenters were blind to which fluid control protocoltheir animal was currently subject to.
Physiological measuresPhysiological measures of the hydration state were col-
lected at the end of the free-access periods (i.e., two datapoints per animal, one prior to implementing the fluidcontrol protocols, the other 6 months after) and on the lastday of each 4 week block of the 5 and 7 d protocols (i.e.,two data points per animal per protocol). Animals weresedated with ketamine (10 mg/kg, i.m.), and blood wascollected from the saphenous vein for hematological andbiochemical analysis. During the sedation following thecontrol period, the bladder was located using ultrasound,and urine was extracted via cystocentesis. During the fluidcontrol protocols, this was not possible because of thesmall size of the bladder; instead, urine was collectedfrom the cage on the morning of sedation, when possible.Urine was collected at least once per fluid control protocolfor each monkey.
To compare results to a relevant baseline, blood sam-ples were also obtained from the CfM, the UK rhesusmacaque breeding facility. Fourteen male monkeys, withages ranging from 4 to 15 years and weighing between 9and 16 kg, were sedated as described above and bloodwas collected from the femoral vein. The CfM monkeysreceived free access to water at all times and were grouphoused. Due to sampling procedures, it was not possibleto obtain urine samples from the monkeys at CfM.
New Research 3 of 15
July/August 2016, 3(4) e0195-16.2016 eNeuro.org

Weight dataAnimals were weighed on each weekday before being
taken to the laboratory. This allowed for an evaluation ofweight change over the course of a working week as wellas a further assessment over the duration of a fluid controlblock (4 weeks). The dataset obtained was not complete,and the following number of weights was collected foreach animal of a possible 76 d (38 d/protocol, as animalswere not taken to the laboratory, and thus not weighed,on physiological sampling days): Monkey 1, 65 weights;Monkey 2, 75 weights; Monkey 3, 67 weights; Monkey 4,74 weights.
Behavioral measuresIn order to assess the potential psychological impact of
different fluid control protocols, behavioral measureswere collected while monkeys were in their home cages.Behavior was recorded using cameras (Cube HD 1080,Y-cam) attached to the corridors of the primate housingfacility, outside of each cage of interest. Data were col-lected three times per week, as follows: early week (Mon-day evenings and Tuesday mornings); late week(Thursday morning and evening); and Weekend (Saturdaymorning and evening). Using a range of days permittedthe assessment of changes in behavior throughout theweek. Morning recordings lasted from 7:00 to 9:00 A.M.,and evening recordings lasted from 5:00 to 6:40 P.M. (to
coincide with lighting times). These times reduced thenumber of personnel present in the primate facility, whichcould on its own affect animal behavior.
An ethogram was designed to capture behaviors thatwere potentially associated with changes in the welfarestate (Table 1). Behaviors were sampled in one of twodifferent ways. They were scored either every time theyoccurred in a video observation (hereafter called “contin-uous sampling”) or they were scored at a 30 s samplepoint (“scan sampling”). Continuous sampling was usedfor short or rare behaviors in order for them to be capturedby the observation duration. Continuously sampled be-haviors could be recorded either as “frequency” data oras “duration” data. Frequency data consisted of counts ofbehaviors, whereas duration data also included the lengthof time a behavior was performed. A pilot set of behavioralobservations (�100 h spread across all animals) wasanalyzed to assess whether the full length of the record-ings was needed to accurately capture potential behav-ioral changes induced by different protocols, or whethersubsampling was sufficient. Using paired t tests for eachanimal, no difference was found between analyzing themiddle hour (7:30 to 8:30 A.M., 5:20 to 6:20 P.M.) and thefull recording. The remaining observations and all analy-ses were therefore performed using the middle hour onlyto ensure that representative data were obtained, whilekeeping analysis times manageable. In total, 393 h of
Table 1: Behavioral measures of welfareCategory Behaviors Description Sampling Frequency/durationInactive Alert Sitting/lying/standing stationary on any surface and looking at
objects or individuals inside or outside of the cage
Scan Frequency
Not alert Sitting/lying/standing stationary on any surface, eyes may be open or
closed, not looking at objects or individuals inside or outside of the cage
Scan Frequency
Hunched As for not alert, but sitting with head lower than the shoulders Scan FrequencyForaging Eating Ingestion of items Scan Frequency
Foraging Searching for food or manipulation of food items or sources, without
ingestion of food
Scan Frequency
Chewing Chewing without any insertion of food into the mouth in the preceding 30 s Scan FrequencyAbnormal Locomotor stereotypy One or more completions of a repeated locomotor pattern, including any
embedded behaviors
Scan Frequency
Other abnormal Digit sucking, hair pulling, nail biting, rocking, head flicking, hand
shake, any self-injurious behavior
Continuous Duration
Nonsocial
behaviors
Self-groom Stroking, picking, or otherwise manipulating own body surface Scan Frequency
Self-scratching Scratching the skin vigorously with nails Continuous DurationYawn Open the mouth widely, teeth exposed, lips retracted without vocalisation Continuous FrequencyBody shake Dog-like body shake of whole body Continuous FrequencyEye rub Rubbing the eye with a hand Continuous DurationInteract with physical environment–
hands/feet
Swinging, pushing, manipulating any part of the cage or an enrichment with
hands or feet without using mouth
Scan Frequency
Interact with physical environment–oral Manipulating any part of the cage or an enrichment with mouth involved. Chewing/
licking/biting any aspect of the cage or inanimate object in it
Scan Frequency
Social behaviors Allogroom–donor Stroking, picking, or otherwise manipulating a cage mate’s body surface Scan FrequencyAllogroom–recipient Being groomed by cage mate, following above descriptors Scan FrequencyAggression to cage mate Open mouth stare, threat posture, chase, push, attack Continuous DurationSubmissive to cage mate Fear grimace, present, displacement of position in the cage Continuous DurationDominance to cage mate Displace the cage mate out of position Continuous DurationAffiliative Lipsmack Continuous DurationAggression directed outside cage Open mouth threat, attack or threat postures directed outside of the
cage (e.g., at the glass)
Continuous Duration
Play with cage mate Nonaggressive high intensity interaction (chase, wrestle, tumble)
with cage mate
Scan Frequency
Mounting Mounting cage mate Continuous DurationBeing mounted Being mounted by cage mate Continuous Duration
Locomotion Agitated locomotion Moving between locations, often rapidly, with a stiff unrelaxed gait Scan FrequencyRelaxed locomotion Moving between locations with a relaxed gait Scan Frequency
Other Other Any behavior not listed above and noteworthy; describe form Continuous Duration
New Research 4 of 15
July/August 2016, 3(4) e0195-16.2016 eNeuro.org
video material were observed and analyzed with the fol-lowing distribution across animals: Monkey 1, 105 h;Monkey 2, 101 h; Monkey 3, 88 h; and Monkey 4, 99 h.
Water bottle approach and consumptionIn order to gauge the motivational drive to drink under
the different fluid control protocols, “latency to drink” wasmeasured on Saturday and Sunday mornings. If the mo-tivation to drink was increased on a stricter fluid controlprotocol, we would expect that latency to approach thebottle would be quicker on the 7 d protocol than on the 5d protocol, and that the volumes consumed would behigher. A water bottle containing either the minimum al-lowance, or 1 L of water (depending on the fluid controlprotocol) was attached to the home cage, and the latencyto start drinking was recorded. In circumstances where
the monkey began to drink before the bottle was fullyattached to the cage, the latency was scored as �1 s andgiven a value of 0.5 s for analysis. As the volumes of wateroffered on Saturdays differed between the two protocols,an additional test was performed on Saturday morning,whereby the amount of fluid consumed in the first 5 minwas also measured.
Statistical methodsAll analyses were performed using SPSS version 21
(IBM, 2012) and R (R Foundation for Statistical Comput-ing, 2015). R software was used when a model was notavailable in SPSS, and the R packages used were asfollows: glmmADMB, pscl, stringr, plyr, coda, and lme4.All statistical testing is reported in Table 2.
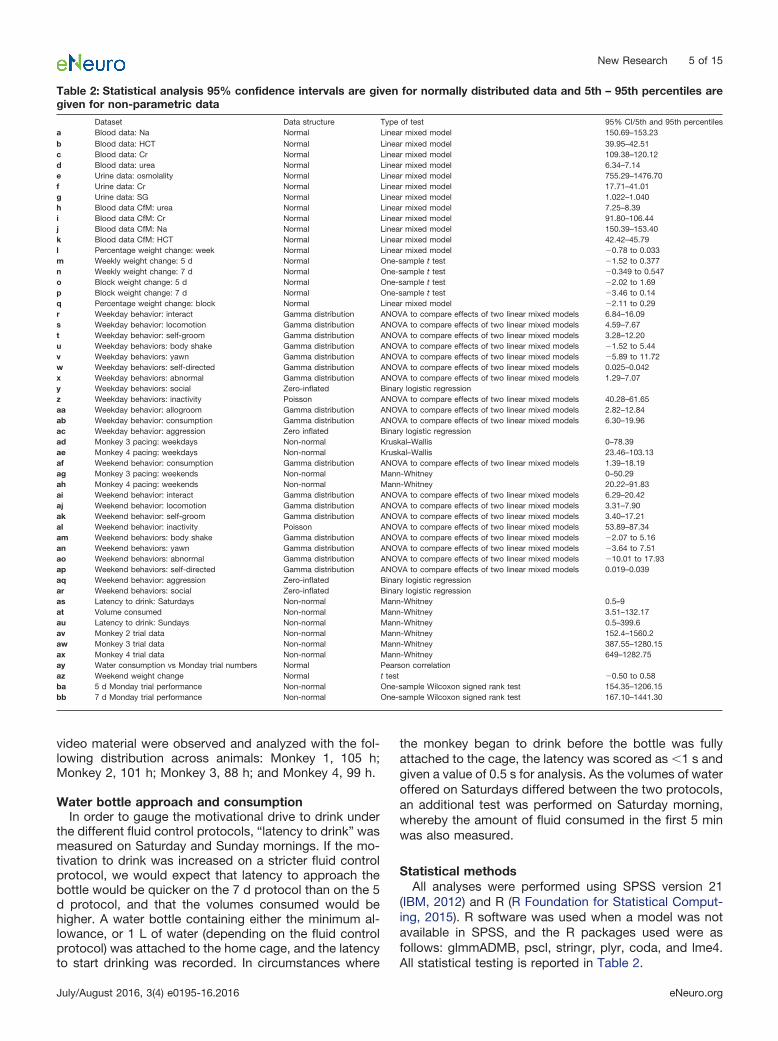
Table 2: Statistical analysis 95% confidence intervals are given for normally distributed data and 5th – 95th percentiles aregiven for non-parametric data
Dataset Data structure Type of test 95% CI/5th and 95th percentilesa Blood data: Na Normal Linear mixed model 150.69–153.23b Blood data: HCT Normal Linear mixed model 39.95–42.51c Blood data: Cr Normal Linear mixed model 109.38–120.12d Blood data: urea Normal Linear mixed model 6.34–7.14e Urine data: osmolality Normal Linear mixed model 755.29–1476.70f Urine data: Cr Normal Linear mixed model 17.71–41.01g Urine data: SG Normal Linear mixed model 1.022–1.040h Blood data CfM: urea Normal Linear mixed model 7.25–8.39i Blood data CfM: Cr Normal Linear mixed model 91.80–106.44j Blood data CfM: Na Normal Linear mixed model 150.39–153.40k Blood data CfM: HCT Normal Linear mixed model 42.42–45.79l Percentage weight change: week Normal Linear mixed model �0.78 to 0.033m Weekly weight change: 5 d Normal One-sample t test �1.52 to 0.377n Weekly weight change: 7 d Normal One-sample t test �0.349 to 0.547o Block weight change: 5 d Normal One-sample t test �2.02 to 1.69p Block weight change: 7 d Normal One-sample t test �3.46 to 0.14q Percentage weight change: block Normal Linear mixed model �2.11 to 0.29r Weekday behavior: interact Gamma distribution ANOVA to compare effects of two linear mixed models 6.84–16.09s Weekday behavior: locomotion Gamma distribution ANOVA to compare effects of two linear mixed models 4.59–7.67t Weekday behavior: self-groom Gamma distribution ANOVA to compare effects of two linear mixed models 3.28–12.20u Weekday behaviors: body shake Gamma distribution ANOVA to compare effects of two linear mixed models �1.52 to 5.44v Weekday behaviors: yawn Gamma distribution ANOVA to compare effects of two linear mixed models �5.89 to 11.72w Weekday behaviors: self-directed Gamma distribution ANOVA to compare effects of two linear mixed models 0.025–0.042x Weekday behaviors: abnormal Gamma distribution ANOVA to compare effects of two linear mixed models 1.29–7.07y Weekday behaviors: social Zero-inflated Binary logistic regressionz Weekday behaviors: inactivity Poisson ANOVA to compare effects of two linear mixed models 40.28–61.65aa Weekday behavior: allogroom Gamma distribution ANOVA to compare effects of two linear mixed models 2.82–12.84ab Weekday behavior: consumption Gamma distribution ANOVA to compare effects of two linear mixed models 6.30–19.96ac Weekday behavior: aggression Zero inflated Binary logistic regressionad Monkey 3 pacing: weekdays Non-normal Kruskal–Wallis 0–78.39ae Monkey 4 pacing: weekdays Non-normal Kruskal–Wallis 23.46–103.13af Weekend behavior: consumption Gamma distribution ANOVA to compare effects of two linear mixed models 1.39–18.19ag Monkey 3 pacing: weekends Non-normal Mann-Whitney 0–50.29ah Monkey 4 pacing: weekends Non-normal Mann-Whitney 20.22–91.83ai Weekend behavior: interact Gamma distribution ANOVA to compare effects of two linear mixed models 6.29–20.42aj Weekend behavior: locomotion Gamma distribution ANOVA to compare effects of two linear mixed models 3.31–7.90ak Weekend behavior: self-groom Gamma distribution ANOVA to compare effects of two linear mixed models 3.40–17.21al Weekend behavior: inactivity Poisson ANOVA to compare effects of two linear mixed models 53.89–87.34am Weekend behaviors: body shake Gamma distribution ANOVA to compare effects of two linear mixed models �2.07 to 5.16an Weekend behaviors: yawn Gamma distribution ANOVA to compare effects of two linear mixed models �3.64 to 7.51ao Weekend behaviors: abnormal Gamma distribution ANOVA to compare effects of two linear mixed models �10.01 to 17.93ap Weekend behaviors: self-directed Gamma distribution ANOVA to compare effects of two linear mixed models 0.019–0.039aq Weekend behavior: aggression Zero-inflated Binary logistic regressionar Weekend behaviors: social Zero-inflated Binary logistic regressionas Latency to drink: Saturdays Non-normal Mann-Whitney 0.5–9at Volume consumed Non-normal Mann-Whitney 3.51–132.17au Latency to drink: Sundays Non-normal Mann-Whitney 0.5–399.6av Monkey 2 trial data Non-normal Mann-Whitney 152.4–1560.2aw Monkey 3 trial data Non-normal Mann-Whitney 387.55–1280.15ax Monkey 4 trial data Non-normal Mann-Whitney 649–1282.75ay Water consumption vs Monday trial numbers Normal Pearson correlationaz Weekend weight change Normal t test �0.50 to 0.58ba 5 d Monday trial performance Non-normal One-sample Wilcoxon signed rank test 154.35–1206.15bb 7 d Monday trial performance Non-normal One-sample Wilcoxon signed rank test 167.10–1441.30
New Research 5 of 15
July/August 2016, 3(4) e0195-16.2016 eNeuro.org
Physiological dataAll data from the physiological measures were normally
distributed and analyzed using a linear mixed model(LMM), with fluid control protocol (free access, 5 d, and 7d) as a fixed factor, and monkey as a random factor. Forblood urea and urine osmolality, the variance of the ran-dom effect was �0.001, and so the tests were performedwith the random effect omitted. To compare blood resultsfrom the study to those obtained at the breeding facility, alinear mixed model was used, with monkey colony as afixed factor and monkey as a random factor.
Weight dataWe assessed weight loss in the following three ways:
over a working week, over each 4 week fluid controlprotocol, and over a weekend. Weight change over theworking week (Monday to Friday) was calculated in thefollowing way: (weight in kilograms Friday/weight in kilo-grams Monday) � 1�100. The weight changes for the 5 dand 7 d protocols were normally distributed and werecompared using a linear mixed model with the percentageof weight change as the fixed factor and monkey as therandom factor. This allowed short-term weight change tobe assessed. Additionally for each fluid control, weeklyweight changes were compared to zero (no change inweight) using a one-sample t test. Overall weight changefor a fluid control block (4 weeks) was evaluated by takingthe start and end weights of the animals and calculatingthe percentage weight change. Finally, to assess thechanges in weights over the weekend, the percentageweight change from Friday to Monday was calculated,and results from the two protocols were compared usinga t test.
Behavioral dataTo increase the power of analyses and to detect poten-
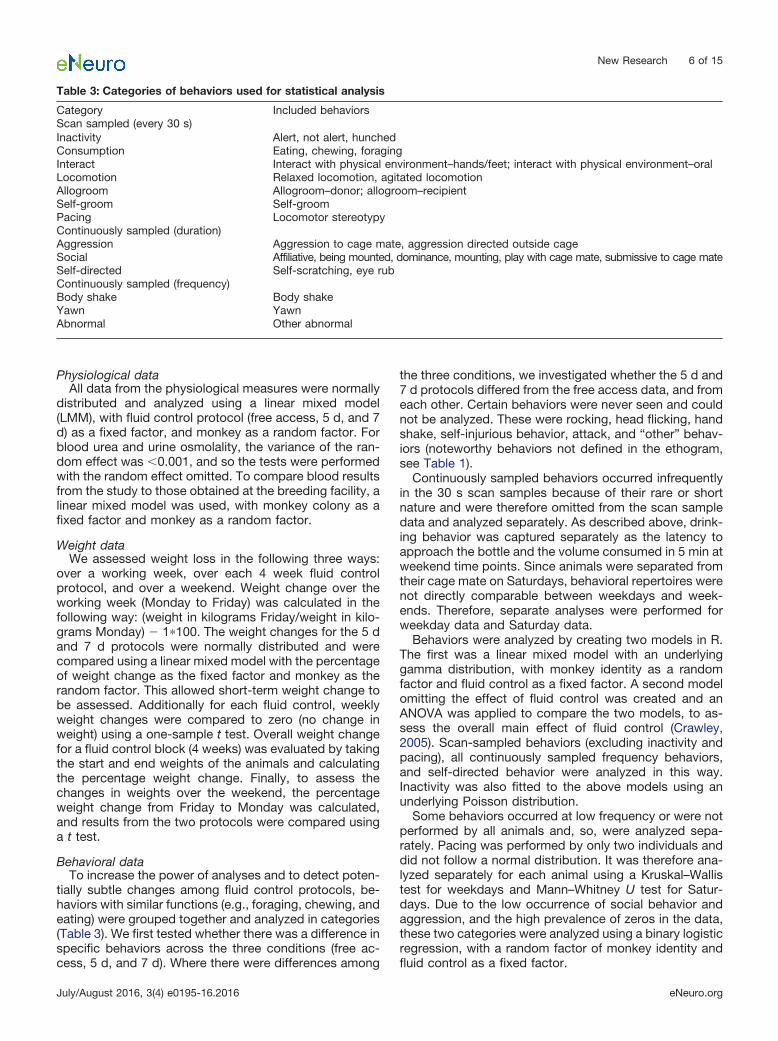
tially subtle changes among fluid control protocols, be-haviors with similar functions (e.g., foraging, chewing, andeating) were grouped together and analyzed in categories(Table 3). We first tested whether there was a difference inspecific behaviors across the three conditions (free ac-cess, 5 d, and 7 d). Where there were differences among
the three conditions, we investigated whether the 5 d and7 d protocols differed from the free access data, and fromeach other. Certain behaviors were never seen and couldnot be analyzed. These were rocking, head flicking, handshake, self-injurious behavior, attack, and “other” behav-iors (noteworthy behaviors not defined in the ethogram,see Table 1).
Continuously sampled behaviors occurred infrequentlyin the 30 s scan samples because of their rare or shortnature and were therefore omitted from the scan sampledata and analyzed separately. As described above, drink-ing behavior was captured separately as the latency toapproach the bottle and the volume consumed in 5 min atweekend time points. Since animals were separated fromtheir cage mate on Saturdays, behavioral repertoires werenot directly comparable between weekdays and week-ends. Therefore, separate analyses were performed forweekday data and Saturday data.
Behaviors were analyzed by creating two models in R.The first was a linear mixed model with an underlyinggamma distribution, with monkey identity as a randomfactor and fluid control as a fixed factor. A second modelomitting the effect of fluid control was created and anANOVA was applied to compare the two models, to as-sess the overall main effect of fluid control (Crawley,2005). Scan-sampled behaviors (excluding inactivity andpacing), all continuously sampled frequency behaviors,and self-directed behavior were analyzed in this way.Inactivity was also fitted to the above models using anunderlying Poisson distribution.
Some behaviors occurred at low frequency or were notperformed by all animals and, so, were analyzed sepa-rately. Pacing was performed by only two individuals anddid not follow a normal distribution. It was therefore ana-lyzed separately for each animal using a Kruskal–Wallistest for weekdays and Mann–Whitney U test for Satur-days. Due to the low occurrence of social behavior andaggression, and the high prevalence of zeros in the data,these two categories were analyzed using a binary logisticregression, with a random factor of monkey identity andfluid control as a fixed factor.
Table 3: Categories of behaviors used for statistical analysis
Category Included behaviorsScan sampled (every 30 s)Inactivity Alert, not alert, hunchedConsumption Eating, chewing, foragingInteract Interact with physical environment–hands/feet; interact with physical environment–oralLocomotion Relaxed locomotion, agitated locomotionAllogroom Allogroom–donor; allogroom–recipientSelf-groom Self-groomPacing Locomotor stereotypyContinuously sampled (duration)Aggression Aggression to cage mate, aggression directed outside cageSocial Affiliative, being mounted, dominance, mounting, play with cage mate, submissive to cage mateSelf-directed Self-scratching, eye rubContinuously sampled (frequency)Body shake Body shakeYawn YawnAbnormal Other abnormal
New Research 6 of 15
July/August 2016, 3(4) e0195-16.2016 eNeuro.org
Water bottle approach and consumptionLatencies to approach the bottles were not normally
distributed and were analyzed by using a Mann–WhitneyU test. In order to make Saturday consumption datacomparable across the monkeys, volumes drunk wereconverted to a percentage of the minimum daily allow-ance for each animal. These data were not normally dis-tributed and were analyzed using a Mann–Whitney U test.
Task performanceMonkey 1 was excluded from the task performance
analysis (i.e., the number of trials performed on work-days as a function of fluid control protocol). This wasdue to the difficulty of his task increasing across thestudy, as was necessary for the electrophysiologicaldata collection, and the varied setting in which heworked (electrophysiology laboratory and MRI scan-ner). Trial data for the remaining three monkeys werenot normally distributed, and differences in the numberof trials performed when on the 5 and 7 d fluid controlprotocols were assessed using a Mann–Whitney U testfor each monkey individually. To assess the effect ofweekend water intake on Monday work performance, aPearson correlation was calculated using the percent-age weight change from Friday to Monday and thenumber of trials performed on a Monday. In addition,trials performed on Monday were compared to 1000 (anapproximately acceptable laboratory performance) us-ing a one-sample Wilcoxon sign rank test.
ResultsFluid intake of individual animals
The four animals differed in their FAI and in the minimaestablished (see Materials and Methods) to ensure ade-quate work rates, as follows: Monkey 1, 645 ml FAI,minimum 200 ml (31% FAI or 15 ml/kg/d); Monkey 2, 880ml FAI, minimum 150 ml (17% FAI or 14 ml/kg/d); Monkey3, 910 ml FAI, 355 ml minimum (39% FAI or 26 ml/kg/d);and Monkey 4, 305 ml FAI, minimum 150 ml (49% FAI or17 ml/kg/d).
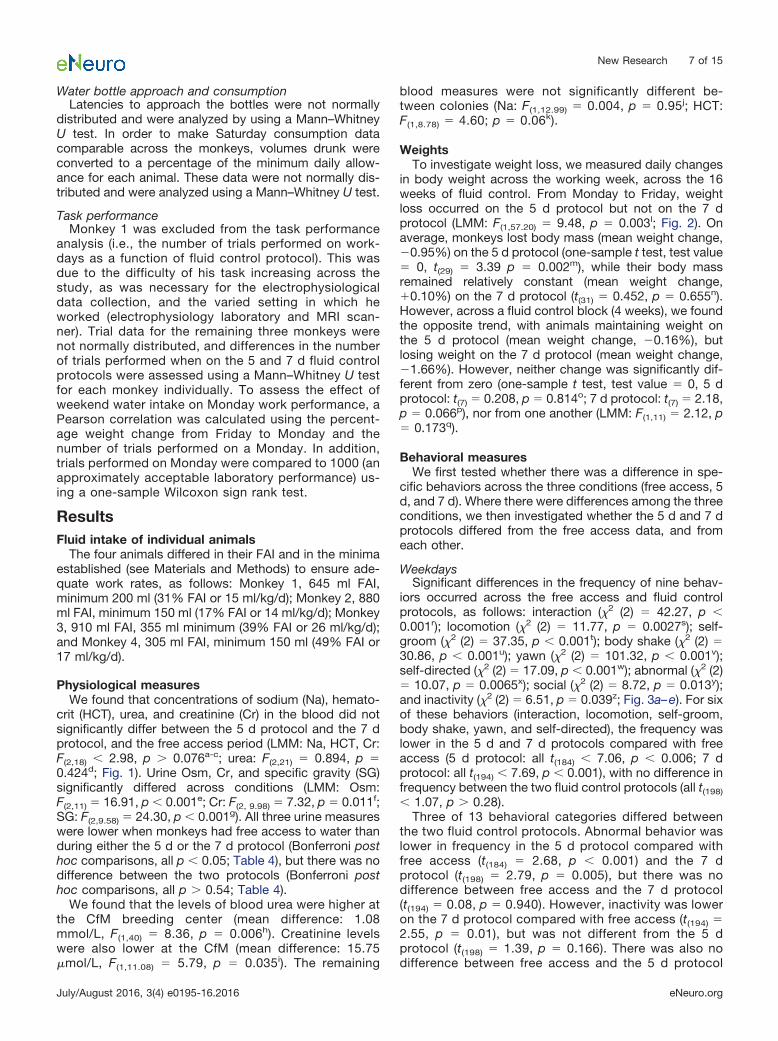
Physiological measuresWe found that concentrations of sodium (Na), hemato-
crit (HCT), urea, and creatinine (Cr) in the blood did notsignificantly differ between the 5 d protocol and the 7 dprotocol, and the free access period (LMM: Na, HCT, Cr:F(2,18) � 2.98, p � 0.076a-c; urea: F(2,21) � 0.894, p �0.424d; Fig. 1). Urine Osm, Cr, and specific gravity (SG)significantly differed across conditions (LMM: Osm:F(2,11) � 16.91, p � 0.001e; Cr: F(2, 9.98) � 7.32, p � 0.011f;SG: F(2,9.58) � 24.30, p � 0.001g). All three urine measureswere lower when monkeys had free access to water thanduring either the 5 d or the 7 d protocol (Bonferroni posthoc comparisons, all p � 0.05; Table 4), but there was nodifference between the two protocols (Bonferroni posthoc comparisons, all p � 0.54; Table 4).
We found that the levels of blood urea were higher atthe CfM breeding center (mean difference: 1.08mmol/L, F(1,40) � 8.36, p � 0.006h). Creatinine levelswere also lower at the CfM (mean difference: 15.75�mol/L, F(1,11.08) � 5.79, p � 0.035i). The remaining
blood measures were not significantly different be-tween colonies (Na: F(1,12.99) � 0.004, p � 0.95j; HCT:F(1,8.78) � 4.60; p � 0.06k).
WeightsTo investigate weight loss, we measured daily changes
in body weight across the working week, across the 16weeks of fluid control. From Monday to Friday, weightloss occurred on the 5 d protocol but not on the 7 dprotocol (LMM: F(1,57.20) � 9.48, p � 0.003l; Fig. 2). Onaverage, monkeys lost body mass (mean weight change,�0.95%) on the 5 d protocol (one-sample t test, test value� 0, t(29) � 3.39 p � 0.002m), while their body massremained relatively constant (mean weight change,�0.10%) on the 7 d protocol (t(31) � 0.452, p � 0.655n).However, across a fluid control block (4 weeks), we foundthe opposite trend, with animals maintaining weight onthe 5 d protocol (mean weight change, �0.16%), butlosing weight on the 7 d protocol (mean weight change,�1.66%). However, neither change was significantly dif-ferent from zero (one-sample t test, test value � 0, 5 dprotocol: t(7) � 0.208, p � 0.814o; 7 d protocol: t(7) � 2.18,p � 0.066p), nor from one another (LMM: F(1,11) � 2.12, p� 0.173q).
Behavioral measuresWe first tested whether there was a difference in spe-
cific behaviors across the three conditions (free access, 5d, and 7 d). Where there were differences among the threeconditions, we then investigated whether the 5 d and 7 dprotocols differed from the free access data, and fromeach other.
WeekdaysSignificant differences in the frequency of nine behav-
iors occurred across the free access and fluid controlprotocols, as follows: interaction (�2 (2) � 42.27, p �0.001r); locomotion (�2 (2) � 11.77, p � 0.0027s); self-groom (�2 (2) � 37.35, p � 0.001t); body shake (�2 (2) �30.86, p � 0.001u); yawn (�2 (2) � 101.32, p � 0.001v);self-directed (�2 (2) � 17.09, p � 0.001w); abnormal (�2 (2)� 10.07, p � 0.0065x); social (�2 (2) � 8.72, p � 0.013y);and inactivity (�2 (2) � 6.51, p � 0.039z; Fig. 3a–e). For sixof these behaviors (interaction, locomotion, self-groom,body shake, yawn, and self-directed), the frequency waslower in the 5 d and 7 d protocols compared with freeaccess (5 d protocol: all t(184) � 7.06, p � 0.006; 7 dprotocol: all t(194) � 7.69, p � 0.001), with no difference infrequency between the two fluid control protocols (all t(198)
� 1.07, p � 0.28).Three of 13 behavioral categories differed between
the two fluid control protocols. Abnormal behavior waslower in frequency in the 5 d protocol compared withfree access (t(184) � 2.68, p � 0.001) and the 7 dprotocol (t(198) � 2.79, p � 0.005), but there was nodifference between free access and the 7 d protocol(t(194) � 0.08, p � 0.940). However, inactivity was loweron the 7 d protocol compared with free access (t(194) �2.55, p � 0.01), but was not different from the 5 dprotocol (t(198) � 1.39, p � 0.166). There was also nodifference between free access and the 5 d protocol
New Research 7 of 15
July/August 2016, 3(4) e0195-16.2016 eNeuro.org
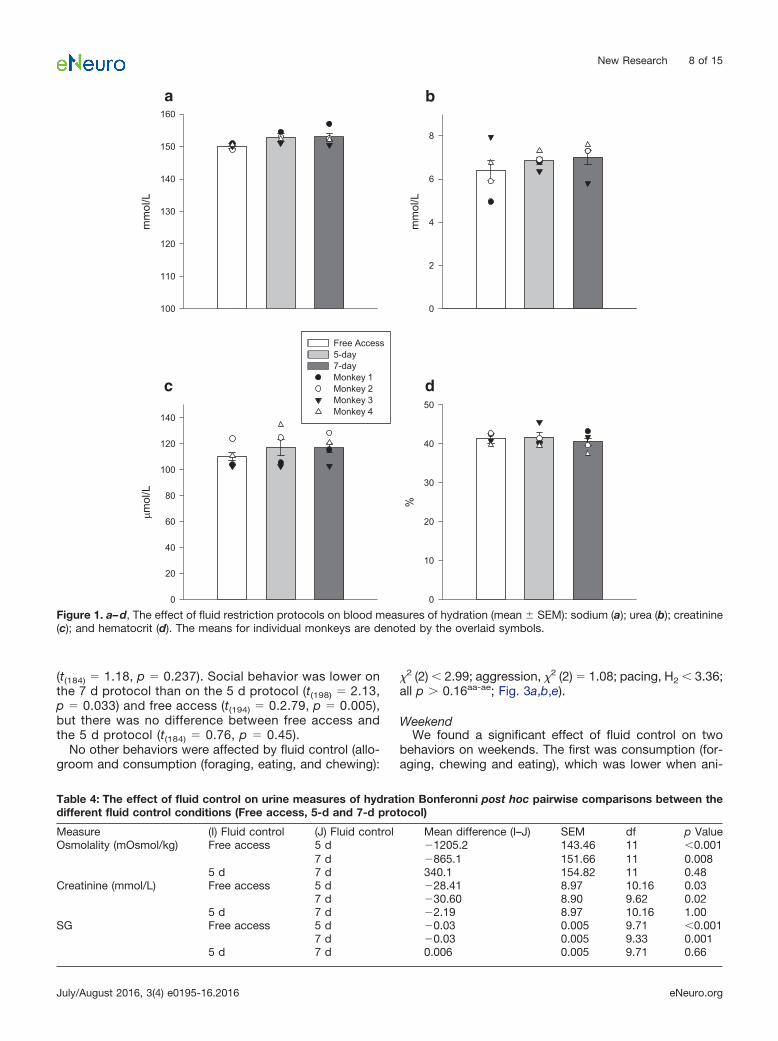
(t(184) � 1.18, p � 0.237). Social behavior was lower onthe 7 d protocol than on the 5 d protocol (t(198) � 2.13,p � 0.033) and free access (t(194) � 0.2.79, p � 0.005),but there was no difference between free access andthe 5 d protocol (t(184) � 0.76, p � 0.45).
No other behaviors were affected by fluid control (allo-groom and consumption (foraging, eating, and chewing):
�2 (2) � 2.99; aggression, �2 (2) � 1.08; pacing, H2 � 3.36;all p � 0.16aa-ae; Fig. 3a,b,e).
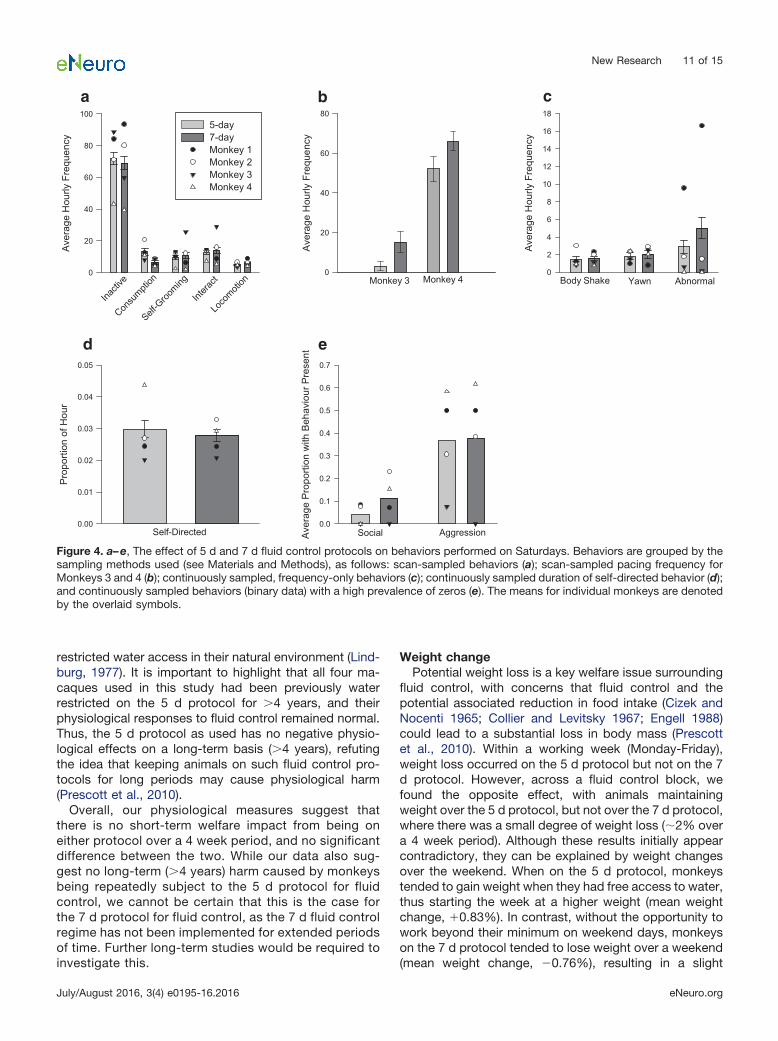
WeekendWe found a significant effect of fluid control on two
behaviors on weekends. The first was consumption (for-aging, chewing and eating), which was lower when ani-
ba
dc
Figure 1. a–d, The effect of fluid restriction protocols on blood measures of hydration (mean SEM): sodium (a); urea (b); creatinine(c); and hematocrit (d). The means for individual monkeys are denoted by the overlaid symbols.
Table 4: The effect of fluid control on urine measures of hydration Bonferonni post hoc pairwise comparisons between thedifferent fluid control conditions (Free access, 5-d and 7-d protocol)
Measure (I) Fluid control (J) Fluid control Mean difference (I–J) SEM df p ValueOsmolality (mOsmol/kg) Free access 5 d �1205.2 143.46 11 �0.001
7 d �865.1 151.66 11 0.0085 d 7 d 340.1 154.82 11 0.48
Creatinine (mmol/L) Free access 5 d �28.41 8.97 10.16 0.037 d �30.60 8.90 9.62 0.02
5 d 7 d �2.19 8.97 10.16 1.00SG Free access 5 d �0.03 0.005 9.71 �0.001
7 d �0.03 0.005 9.33 0.0015 d 7 d 0.006 0.005 9.71 0.66
New Research 8 of 15
July/August 2016, 3(4) e0195-16.2016 eNeuro.org

mals were on the 7 d protocol compared with the 5 dprotocol (�2 (1) � 8.68, p � 0.003af). The second behaviorwas pacing, which was only sufficiently frequent to allowfor quantitative analysis in two of the four animals. Wefound that pacing increased for one monkey on the 7 dprotocol compared with the 5 d protocol (U � 110, z �2.43, p � 0.026ag; Fig. 4b), while the second monkeyshowed no change in pacing behavior (U � 107, z � 1.58,p � 0.123ah; Fig. 4b). All remaining behaviors showed nodifference in frequency between the 5 d and 7 d protocols(interaction, locomotion, self-groom, inactivity, bodyshake, yawn, abnormal, self-directed, aggression, andsocial: �2 (1) � 3.23, p � 0.07ai-ar for all; Fig. 4a,c,d,e).
Water bottle approach and consumptionOn Saturdays, approach was significantly quicker on
the 7 d protocol (median time, 2 s), than on the 5 dprotocol (median time, 4 s; Mann–Whitney test: U � 2.24,p � 0.03as). The monkeys also drank more in 5 min onSaturdays while on the 7 d protocol (median percentageof the minimum amount consumed, 100%), comparedwith while on the 5 d protocol (median percentage of theminimum consumed, 50%; Mann–Whitney test: U � 3.28,p � 0.001at). There was no effect of fluid control protocol
on the latency to approach the water bottle on Sundays(Mann–Whitney test: U � 0.46, p � 0.647au).
Task performanceOnly three monkeys were included in the analysis (one
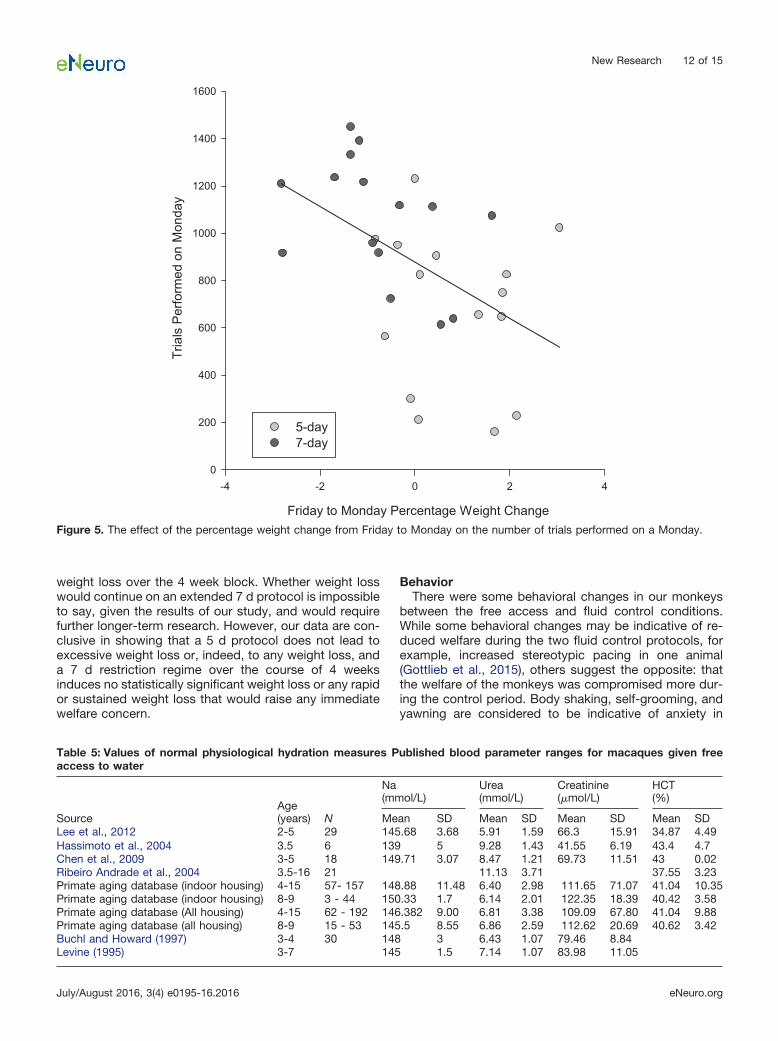
monkey had regularly changing task demands that wererequired by the experimental design, which precluded thisspecific analysis). There was no overall increase in thedaily numbers of trials performed in their respective cog-nitive tasks when they were subjected to the 7 d protocol,rather than the 5 d protocol (Mann–Whitney test: U �1.44, p � 0.15 for allav-ax). The performance on Monday isof particular importance, since animals often do not per-form enough trials for scientific data to be collected. OnMondays, there was a significant correlation between thepercentage weight change over the weekend (from Fridayto Monday) and the number of trials performed: whenweight decreased over the weekend, more trials wereperformed on the Monday (Pearson correlation: R2 ��0.49, p � 0.01ay; Fig. 5). Weight change over the week-end differed between the two fluid controls (t test: t(28) �3.58, p � 0.001az). On average, monkeys gained 0.83%weight over the weekend on the 5 d fluid control and
ba
dc
Figure 2. a–d, The weekly percentage weight change calculated from the beginning of each fluid control block ([weight in kilogramsFriday/weight in kilograms Monday] � 1�100): Monkey 1 (a); Monkey 2 (b); Monkey 3 (c); and Monkey 4 (d). Dashed lines indicate nochange in weight.
New Research 9 of 15
July/August 2016, 3(4) e0195-16.2016 eNeuro.org

performed �1000 trials on Mondays (median number oftrials, 686; test value, 1000; W � 3.64, p � 0.001ba).Conversely, on the 7 d protocol, monkeys lost 0.76% ofbody mass and completed an average of 981 trials onMondays (test value, 1000, W � 0.065, p � 0.948bb).
DiscussionOur study provides the first objective and quantitative
data on the effects of fluid control protocols on the phys-iology, behavior, and performance of laboratory ma-caques used in behavioral neuroscience. Given the rangeof data analyzed, we discuss each of our different mea-sures in turn.
Physiological changesOne primary concern with fluid control protocols is that
they dehydrate the animals, leading to reduced welfareand poor animal condition (Prescott et al., 2010). We tookstandard and well established physiological measures ofhydration state for rhesus macaques using blood andurine (Rolls and Rolls, 1982; Wood et al., 1982). For thesemeasures, “normal” ranges from non-fluid-controlled in-dividuals have been reported from various rhesus ma-caque facilities (Levine, 1995; Buchl and Howard, 1997;Hassimoto et al., 2004; Ribeiro Andrade et al., 2004; Chenet al., 2009; Lee et al., 2012; National Institute on Aging
and National Primate Research Center, 2015; Table 5).Blood measures of hydration were the same across allthree conditions (5 d protocol, 7 d protocol, and freeaccess), and levels were within ranges observed acrossother rhesus macaque facilities where animals have con-stant ad libitum fluid access (Table 5). Urine was moreconcentrated on both fluid control protocols comparedwith free access, although there were no differences be-tween the two fluid control protocols. However, since thevalues in Table 5 refer to populations including animals ofdiffering ages compared with our males, we also com-pared the blood measures with blood that we acquiredfrom the CfM, from a sample of similarly aged male mon-keys. Males at the CfM had never experienced any fluidcontrol protocol. Two blood measures did differ slightlybetween our monkeys and those at the CfM: the CfMmacaques had higher levels of urea and lower levels ofcreatinine. The higher levels of urea were the opposite ofwhat we would expect for animals with ad libitum accessto water. Although the reason for these differences isunknown, values for both colonies still lie within normalranges (Table 5). Overall, the monkeys’ kidneys were wellfunctioning and efficiently retaining fluids when access towater was limited. Their ability to efficiently retain fluidsmay be an adaptation to seasonal rainfall and periods of
ba
d ec
Figure 3. a–e, The effect of free access to water, and 5 d and 7 d fluid control protocols on behaviors performed on weekdays.Behaviors are grouped by the sampling methods used (see Materials and Methods), as follows: scan-sampled behaviors (a);scan-sampled pacing frequency for Monkeys 3 and 4 (b); continuously sampled, frequency-only behaviors (c); continuously sampledduration of self-directed behavior (d); and continuously sampled behaviors (binary data) with a high prevalence of zeros (e). The meansfor individual monkeys are denoted by the overlaid symbols.
New Research 10 of 15
July/August 2016, 3(4) e0195-16.2016 eNeuro.org
restricted water access in their natural environment (Lind-burg, 1977). It is important to highlight that all four ma-caques used in this study had been previously waterrestricted on the 5 d protocol for �4 years, and theirphysiological responses to fluid control remained normal.Thus, the 5 d protocol as used has no negative physio-logical effects on a long-term basis (�4 years), refutingthe idea that keeping animals on such fluid control pro-tocols for long periods may cause physiological harm(Prescott et al., 2010).
Overall, our physiological measures suggest thatthere is no short-term welfare impact from being oneither protocol over a 4 week period, and no significantdifference between the two. While our data also sug-gest no long-term (�4 years) harm caused by monkeysbeing repeatedly subject to the 5 d protocol for fluidcontrol, we cannot be certain that this is the case forthe 7 d protocol for fluid control, as the 7 d fluid controlregime has not been implemented for extended periodsof time. Further long-term studies would be required toinvestigate this.
Weight changePotential weight loss is a key welfare issue surrounding
fluid control, with concerns that fluid control and thepotential associated reduction in food intake (Cizek andNocenti 1965; Collier and Levitsky 1967; Engell 1988)could lead to a substantial loss in body mass (Prescottet al., 2010). Within a working week (Monday-Friday),weight loss occurred on the 5 d protocol but not on the 7d protocol. However, across a fluid control block, wefound the opposite effect, with animals maintainingweight over the 5 d protocol, but not over the 7 d protocol,where there was a small degree of weight loss (�2% overa 4 week period). Although these results initially appearcontradictory, they can be explained by weight changesover the weekend. When on the 5 d protocol, monkeystended to gain weight when they had free access to water,thus starting the week at a higher weight (mean weightchange, �0.83%). In contrast, without the opportunity towork beyond their minimum on weekend days, monkeyson the 7 d protocol tended to lose weight over a weekend(mean weight change, �0.76%), resulting in a slight
b
d e
a c
Figure 4. a–e, The effect of 5 d and 7 d fluid control protocols on behaviors performed on Saturdays. Behaviors are grouped by thesampling methods used (see Materials and Methods), as follows: scan-sampled behaviors (a); scan-sampled pacing frequency forMonkeys 3 and 4 (b); continuously sampled, frequency-only behaviors (c); continuously sampled duration of self-directed behavior (d);and continuously sampled behaviors (binary data) with a high prevalence of zeros (e). The means for individual monkeys are denotedby the overlaid symbols.
New Research 11 of 15
July/August 2016, 3(4) e0195-16.2016 eNeuro.org
weight loss over the 4 week block. Whether weight losswould continue on an extended 7 d protocol is impossibleto say, given the results of our study, and would requirefurther longer-term research. However, our data are con-clusive in showing that a 5 d protocol does not lead toexcessive weight loss or, indeed, to any weight loss, anda 7 d restriction regime over the course of 4 weeksinduces no statistically significant weight loss or any rapidor sustained weight loss that would raise any immediatewelfare concern.
BehaviorThere were some behavioral changes in our monkeys
between the free access and fluid control conditions.While some behavioral changes may be indicative of re-duced welfare during the two fluid control protocols, forexample, increased stereotypic pacing in one animal(Gottlieb et al., 2015), others suggest the opposite: thatthe welfare of the monkeys was compromised more dur-ing the control period. Body shaking, self-grooming, andyawning are considered to be indicative of anxiety in
Figure 5. The effect of the percentage weight change from Friday to Monday on the number of trials performed on a Monday.
Table 5: Values of normal physiological hydration measures Published blood parameter ranges for macaques given freeaccess to water
SourceAge(years) N
Na(mmol/L)
Urea(mmol/L)
Creatinine(�mol/L)
HCT(%)
Mean SD Mean SD Mean SD Mean SDLee et al., 2012 2-5 29 145.68 3.68 5.91 1.59 66.3 15.91 34.87 4.49Hassimoto et al., 2004 3.5 6 139 5 9.28 1.43 41.55 6.19 43.4 4.7Chen et al., 2009 3-5 18 149.71 3.07 8.47 1.21 69.73 11.51 43 0.02Ribeiro Andrade et al., 2004 3.5-16 21 11.13 3.71 37.55 3.23Primate aging database (indoor housing) 4-15 57- 157 148.88 11.48 6.40 2.98 111.65 71.07 41.04 10.35Primate aging database (indoor housing) 8-9 3 - 44 150.33 1.7 6.14 2.01 122.35 18.39 40.42 3.58Primate aging database (All housing) 4-15 62 - 192 146.382 9.00 6.81 3.38 109.09 67.80 41.04 9.88Primate aging database (all housing) 8-9 15 - 53 145.5 8.55 6.86 2.59 112.62 20.69 40.62 3.42Buchl and Howard (1997) 3-4 30 148 3 6.43 1.07 79.46 8.84Levine (1995) 3-7 145 1.5 7.14 1.07 83.98 11.05
New Research 12 of 15
July/August 2016, 3(4) e0195-16.2016 eNeuro.org

macaques (Ninan et al. 1982; Deputte 1994; Schino et al.1996; Major et al., 2009), making it surprising that thesebehaviors were more prevalent during the free accessperiod compared with during either fluid control protocol.One possible reason for this observation was that the dataon free access were collected over the Christmas break,when animals were not working in experiments and hadfree access to water. Collecting data on free accessduring breaks was necessary because fluid control andworking routines are intrinsically linked. Fluid control isonly permitted when the monkeys have the opportunity toearn fluid in the laboratory, and running animals in exper-iments on free access is not possible. However, thismeant that there were also changes to laboratory andhusbandry routines: monkeys did not take part in exper-imental procedures and had reduced social contact withhumans (research and animal care staff); and husbandryroutines were different from those experienced during atypical experimental week. Although animals may experi-ence similar periods throughout the year (e.g., holidayweekends, and festive breaks), these changes in routinecould potentially increase anxiety-related behaviors in thefree access period (for review, see Bassett and Buchanan-Smith, 2007). Therefore, it is difficult to know whetherbehavioral differences between free access and fluid con-trol protocols were due to fluid access, changes in rou-tine, or a combination of the two. When husbandry anddaily routine return to normal, the corresponding decreasein anxiety could theoretically mask an increase in anxietyfrom fluid restriction. Despite this potential confound, wecan safely conclude that fluid control does not increaseanxiety more than a change in husbandry regime.
There were also very few behavioral differences ob-served between the two fluid control protocols, and again,the results were inconsistent. For example, on weekdayswhile monkeys were on the 7 d protocol for fluid control,rare social behaviors (not including allogrooming) werelower and abnormal behaviors were higher, which issometimes indicative of increased stress (Lutz et al.,2003; Honess et al., 2004; Smith et al., 2006). However, incontrast to this, on the 7 d protocol inactivity was lower,which normally demonstrates improved welfare. It is sur-prising that inactivity decreased in monkeys subjected toa stricter fluid control, since studies on humans (Prosset al., 2014) have documented an increase in fatigue whensubjects are fluid deprived, with participants anecdotallyreporting decreased activity levels. Decreasing activitylevels are inconsistent with the observed increase in ab-normal behaviors, making it impossible to identify anyclear impacts on welfare from the 7 d protocol.
Small behavioral differences between protocols werealso observed on Saturdays. Consumption (foraging, eat-ing, and chewing) was lower on the 7 d protocol com-pared with the 5 d protocol. There are two possibleexplanations for this. One possible explanation is thatbecause water is required to absorb and digest food,animals cannot eat as much on the 7 d protocol com-pared with the 5 d protocol. This voluntary reduction inconsumption has been previously documented in rats andhumans (Cizek and Nocenti, 1965; Collier and Levitsky,
1967; Engell, 1988) and is one of the concerns surround-ing fluid control (Prescott et al., 2010). Alternatively, it maynot be that the animals are undereating on the 7 d proto-col, but rather that they are overeating on the 5 d protocol:“binging” can occur when monkeys are given free accessto water on the 5 d regime (Toth and Gardiner, 2000). Bothof these explanations are supported by changes in weightover the weekend (see above), with increases on the 5 dprotocol but decreases on the 7 d protocol, making itdifficult to tease apart the two. Overall, regardless of whatcauses the difference in consumption behavior on week-ends, these changes were not of a magnitude to causeweight loss that was of concern in our monkeys.
The second change was in pacing behavior. Two of theanimals in our group performed pacing behavior during allprotocols. In one of the two, higher levels of pacingoccurred over the weekend on the 7 d protocol comparedwith the 5 d protocol. Stereotypies in captive macaquesare often used as indicators of suboptimal welfare andmay indicate higher levels of stress in this individual (No-vak et al., 2006). However, their prevalence alone shouldnot be relied upon as a single measure of well-being(Mason and Latham, 2004), and data from one animalremain too limited to enable a firm conclusion. In addition,stereotypies can be interpreted as a coping behavior(Mason and Latham, 2004; Novak et al., 2006), and, assuch, the animals performing these behaviors may expe-rience a more positive state of well-being than is oftenassumed.
Water bottle approach and consumptionWhen given access to water on Saturdays, monkeys
appeared more motivated to drink on the 7 d protocolthan on the 5 d protocol. They approached the bottlemore quickly and consumed a larger volume of water.This may be due to many reasons, including a dryness orunpleasant taste in the mouth, as has been shown inhumans (Rolls et al., 1980). However, it is impossible toinfer the subjective experience (e.g., thirst) of the animalsfrom our data.
Task performanceAn important aspect of this study was to assess the
scientific outcomes associated with the use of differentfluid control protocols. Typically, on a 5 d fluid controlregime, animals do not participate in a sufficient numberof trials on Monday to collect a robust dataset (�1000trials are required per day for these particular tasks).Consequently, data collection is not usually attempted ona Monday. The number of trials performed on a Monday inthis study was too low on the 5 d fluid control protocol toattempt electrophysiological recordings, given the scien-tific requirements of the studies involved. The most likelyreason for this is that monkeys were not motivated todrink after increased access to water over the weekend.However, when the monkeys were restricted over theweekend on the 7 d protocol, performance on Mondaysincreased to levels that would generally allow electro-physiology to be performed. This suggests that a 7 d fluidcontrol protocol might enable scientific studies to beconducted 5 d/week (or 7 d/week, if recording continued
New Research 13 of 15
July/August 2016, 3(4) e0195-16.2016 eNeuro.org
over the weekend), which could significantly reduce theduration of a study by at least 20%. This would mean thatthe time individual monkeys spend on a fluid controlprotocol would be similarly reduced.
ConclusionsAs with any procedure, the consequences of fluid con-
trol on the state of the subject are important to know sothat judgments about the appropriateness for their usecan be made on knowing the likely impact on the results.This study addressed the need for scientific data on theimpact of different fluid control protocols on the welfareand performance of laboratory primates used in neurosci-ence research (Prescott et al. 2010). The debate over theuse of fluid control protocols has been contentious (Or-lans, 1991; Willems, 2009; Westlund, 2012), and it iscrucial that we better understand how such protocolsaffect experimental animals in order to make more in-formed decisions about their use. Our main conclusionsare as follows:
1. Male macaques physiologically cope with periods offluid control, maintaining blood parameters withinnormal ranges by concentrating their urine in re-sponse to both protocols. There were no detectableshort-term effects of either the 5 d or 7 d protocol, orany long-term (�4 years) effect of a 5 d protocol, onkidney function.
2. There were relatively small changes in behavior de-tected by our in-depth analysis, with some behaviorsindicative of poor welfare being associated with fluidcontrol protocols, and others with free access towater.
3. 5 d and 7 d fluid control protocols do not lead to rapidand sustained weight loss that would be of immedi-ate welfare concern. More data are required to as-sess the continuing impact of 7 d fluid control onweight changes.
4. Animals are more motivated to drink in their homecage when on a 7 d protocol compared with a 5 dprotocol, but the subjective experiences of the ani-mals are unknown.
5. Improved task performance on a 7 d protocol com-pared with a 5 d protocol could allow more rapidcollection of sufficient scientific data and a reducedamount of time spent on fluid control protocols forexperimental animals.
Our data mostly fail to show the significant detrimentaleffects on the welfare of laboratory macaques, whichoften have been predicted to arise from the use of fluidcontrol protocols. Our study counters some and alleviatesmany of the widely held welfare concerns surroundingthese methods.
ReferencesBassett L, Buchanan-Smith HM (2007) Effects of predictability on the
welfare of captive animals. Appl Anim Behav Sci 102:223–245.CrossRef
Buchl SJ, Howard B (1997) Hematologic and serum biochemical andelectrolyte values in clinically normal domestically bred rhesus
monkeys (Macaca mulatta) according to age, sex, and gravidity.Lab Anim Sci 47:528–533. Medline
Chamove AS (1989) Environmental enrichment: a review. Anim Tech-nol 40:155–178.
Chen Y, Qin S, Ding Y, Wei L, Zhang J, Li H, Bu H, Lu Y, Cheng J(2009) Reference values of clinical chemistry and hematologyparameters in rhesus monkeys (Macaca mulatta). Xenotransplan-tation 16:496–501. CrossRef
Cizek L, Nocenti M (1965) Relationship between water and foodingestion in the rat. Am J Physiol 208:615–620. Medline
Collier G, Levitsky D (1967) Defense of water balance in rats: behav-ioral and physiological responses to depletion. J Comp PhysiolPsychol 64:59–67. Medline
Crawley MJ (2005) Statistics: an introduction using R. New York:Wiley.
Deputte BL (1994) Ethological study of yawning in primates. I. Quan-titative analysis and study of causation in two species of old world.Ethology 98:221–245.
Desimone R, Olson C, Erickson R (1992) The controlled water accessparadigm. ILAR J 34:27–29. CrossRef
Disney AA, Domakonda KV, Aoki C (2006) Differential expression ofmuscarinic acetylcholine receptors across excitatory and inhibi-tory cells in visual cortical areas V1 and V2 of the macaquemonkey. J Comp Neurol 499:49–63. CrossRef
Engell D (1988) Interdependency of food and water intake in humans.Appetite 10:133–141. Medline
Felleman DJ, Van Essen DC (1991) Distributed hierarchical process-ing in the primate cerebral cortex. Cereb Cortex 1:1–47. Medline
Gottlieb DH, Maier A, Coleman K (2015) Evaluation of environmentaland intrinsic factors that contribute to stereotypic behavior incaptive rhesus macaques (Macaca mulatta). Appl Anim Behav Sci171:184–191. CrossRef
Hage SR, Ott T, Eiselt A, Jacob SN, Nieder A (2014) Ethogramsindicate stable well-being during prolonged training phases inrhesus monkeys used in neurophysiological research. Lab Anim48:82–87. CrossRef Medline
Hassimoto M, Harada T, Harada T (2004) Changes in hematology,biochemical values, and restraint ECG of rhesus monkeys(Macaca mulatta) following 6-month laboratory acclimation. J MedPrimatol 33:175–186. CrossRef
Honess S, Johnson P, Wolfensohn S (2004) A study of behaviouralresponses of non-human primates to air transport and re-housing.Lab Anim 38:119–132. CrossRef
IBM (2012) IBM SPSS Statistics for Windows, Version 21.0. Armonk,NY: IBM.
Lee JIL, Shin JS, Lee JE, Jung WY, Lee G, Kim MS, Park CG, Kim SJ(2012) Reference values of hematology, chemistry, electrolytes,blood gas, coagulation time, and urinalysis in the Chinese rhesusmacaques (Macaca mulatta). Xenotransplantation 19:244–248.CrossRef
Levine BS (1995) Animal clinical pathology. In: Handbook of toxicol-ogy (Derelanko MJ, Hollinger MA, eds), pp 518–535. Boca Raton,FL: CRC.
Lindburg DG (1977) Feeding behaviour and diet of rhesus monkeys(Macaca mulatta) in a Siwalik Forest in North India. In: Primateecology: studies of feeding and ranging behavior in lemurs, mon-key and apes (Clutton-Brock TH, ed), pp 223–249. London:Elsevier.
Lutz C, Well A, Novak MA (2003) Stereotypic and self-injuriousbehavior in rhesus macaques: a survey and retrospective analysisof environment and early experience. Am J Primatol 60:1–15.CrossRef
Major C, Kelly BJ, Novak M, Davenport MD, Stonemetz KM, MeyerJS (2009) The anxiogenic drug FG7142 increases self-injuriousbehavior in male rhesus monkeys (Macaca mulatta). Life Sci 53–758.
Mason GJ, Latham NR (2004) Can’t stop, won’t stop: is stereotypy areliable animal welfare indicator? Anim Welf 13:57–69.
National Institute on Aging, National Primate Research Center (2015)iPAD system: internet Primate Aging Database. Bethesda, MD:
New Research 14 of 15
July/August 2016, 3(4) e0195-16.2016 eNeuro.org
National Institute on Aging/Madison, WI: National Primate Re-search Center, University of Wisconsin.
NC3Rs (2006) NC3Rs guidelines: primate accommodation, care anduse. London: NC3Rs.
Newsome WT, Stein-Aviles JA (1999) Nonhuman primate models ofvisually based cognition. ILAR J 39:78–91. Medline
Ninan PT, Insel TM, Cohen RM, Cook JM, Skolnick P, Paul SM (1982)Benzodiazepine receptor-mediated experimental “anxiety” in pri-mates. Science 218:1332–1334. Medline
Novak MA, Meyer JS, Lutz C, Tiefenbacher S (2006) Deprived envi-ronments: developmental insights from primatology. In: Stereo-typic animal behaviour: fundamentals and applications to welfare(Mason G, Rushen J, eds), pp 153–189. Wallingford, UK: CABI.
Orlans FB (1991) Prolonged water deprivation: a case study indecision making by an IACUC. ILAR J 33:48–52. Medline
Prescott MJ, Brown VJ, Flecknell P, Gaffan D, Garrod K, Lemon RN,Parker AJ, et al. (2010) Refinement of the use of food and fluidcontrol as motivational tools for macaques used in behaviouralneuroscience research: report of a working group of the NC3Rs. JNeurosci Methods 19:167–188. CrossRef
Preuss TM (1995) Do rats have prefrontal cortex? The rose-woolsey-akert program reconsidered. J Cogn Neurosci 7:1–24. CrossRef
Pross N, Demazières A, Girard N, Barnouin R, Metzger D, Klein A,Perrier E, Guelinckx I (2014) Effects of changes in water intake onmood of high and low drinkers. PLoS One 9:e94754. CrossRef
R Foundation for Statistical Computing (2015) R: a language andenvironment for statistical computing. Vienna, Austria: R Founda-tion for Statistical Computing.
Ribeiro Andrade MC, Ribeiro CT, Da Silva VF, Molinaro EM, BrückGonçalves MÂ, Pereira Marques MA, Cabello PH, Gagliardi LeiteJP (2004) Biologic data of Macaca mulatta, Macaca fascicularis,and Saimiri sciureus used for research at the fiocruz primatecenter. Mem Inst Oswaldo Cruz 99:581–589. CrossRef
Roelfsema PR, Treue S (2014) Basic neuroscience research withnonhuman primates: a small but indispensable component ofbiomedical research. Neuron 82:1200–1204. CrossRef
Rolls BJ, Rolls ET (1982) Thirst. Cambridge, UK: Cambridge UP.Rolls BJ, Wood RJ, Rolls ET, Lind H, Lind W, Ledingham JG (1980)
Thirst following water deprivation in humans. Am J Physiol 239:476–482.
Rowland NE (2007) Food or fluid restriction in common laboratoryanimals: balancing welfare considerations with scientific inquiry.Comp Med 57:149–160. Medline
Schino G, Perretta G, Taglioni M, Monaco V, Troisi A (1996) Primatedisplacement activities as an ethopharmacological model of anx-iety. Anxiety 2:186–191. CrossRef Medline
Smith JJ, Hadzic V, Li X, Liu P, Day T, Utter A, Kim B, Washington IM,Basso MA (2006) Objective measures of health and well-being inlaboratory rhesus monkeys (Macaca mulatta). J Med Primatol35:388–396. CrossRef Medline
Toth LA, Gardiner TW (2000) Food and water restriction protocols:physiological and behavioral considerations. Contemp Top LabAnim Sci 39:9–17.
Westlund K (2012) Can conditioned reinforcers and variable-ratioschedules make food- and fluid control redundant? A comment onthe NC3Rs Working Group’s report. J Neurosci Methods 204:202–205. CrossRef Medline
Willems RA (2009) Regulatory issues regarding the use of food andwater restriction in laboratory animals. Lab Animal 38:325–328.CrossRef Medline
Wood RJ, Rolls ET, Rolls BJ, Roger J (1982) Physiological mecha-nisms for thirst in the nonhuman primate. Am J Physiol 242:423–428.
Yamada H, Louie K, Glimcher PW (2010) Controlled water intake: amethod for objectively evaluating thirst and hydration state inmonkeys by the measurement of blood osmolality. J NeurosciMethods 191:83–89. CrossRef
New Research 15 of 15
July/August 2016, 3(4) e0195-16.2016 eNeuro.org