Embed Size (px)
Citation preview
Physiological Genomics
from Rats to Human
Monika Stoll, Ph.D
Director, Genetic Epidemiology of vascular disordersLeibniz-Institute for Arteriosclerosis Research, Münster
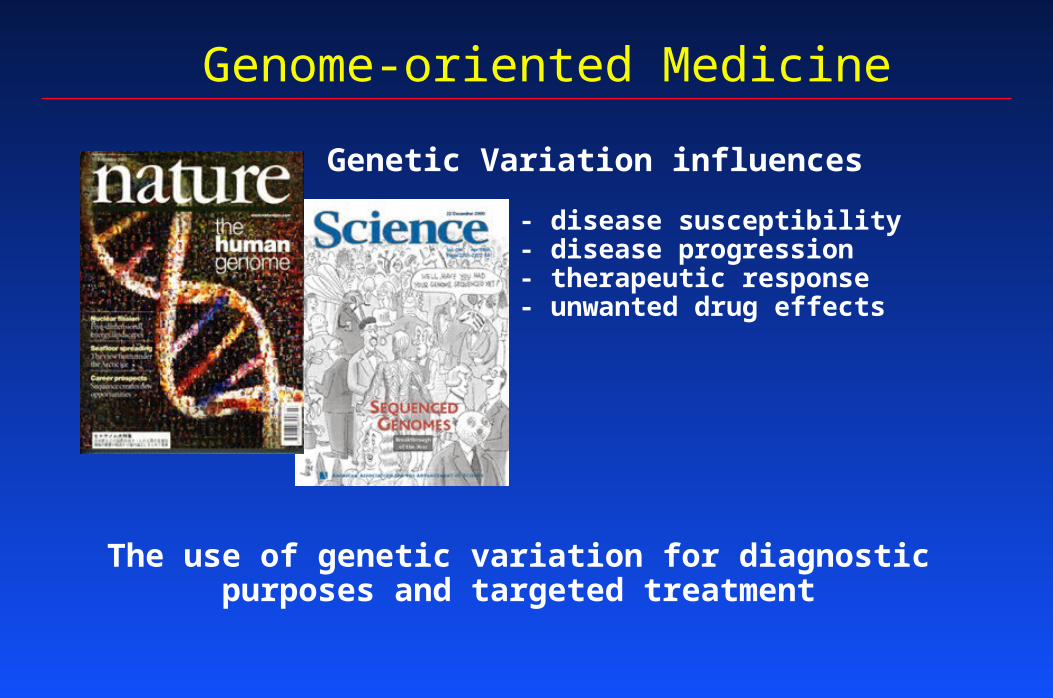
Genetic Variation influences
- disease susceptibility- disease progression- therapeutic response- unwanted drug effects
The use of genetic variation for diagnosticpurposes and targeted treatment
Genome-oriented Medicine
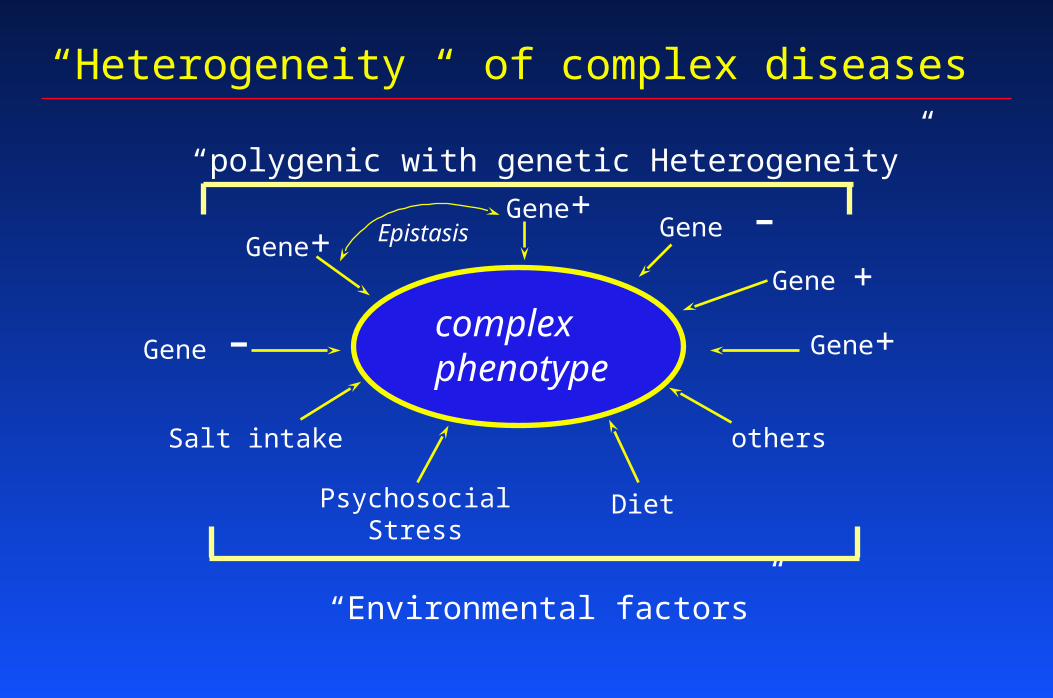
“Heterogeneity “ of complex diseases
complexphenotype
“polygenic with genetic Heterogeneity”
“Environmental factors”
Salt intake
PsychosocialStress
Diet
others
Gene+
Gene +Gene -Gene+
Gene+
Gene -
Epistasis
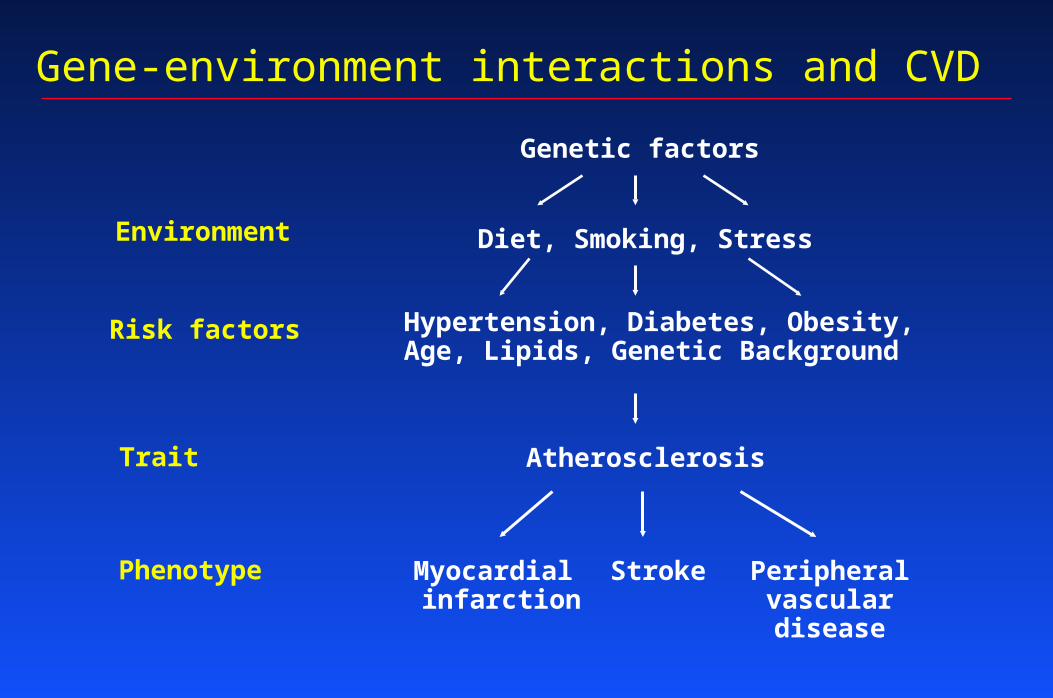
Gene-environment interactions and CVD
Genetic factors
Diet, Smoking, Stress
Hypertension, Diabetes, Obesity,Age, Lipids, Genetic Background
Atherosclerosis
Myocardial infarction
Stroke Peripheralvasculardisease
Environment
Risk factors
Trait
Phenotype
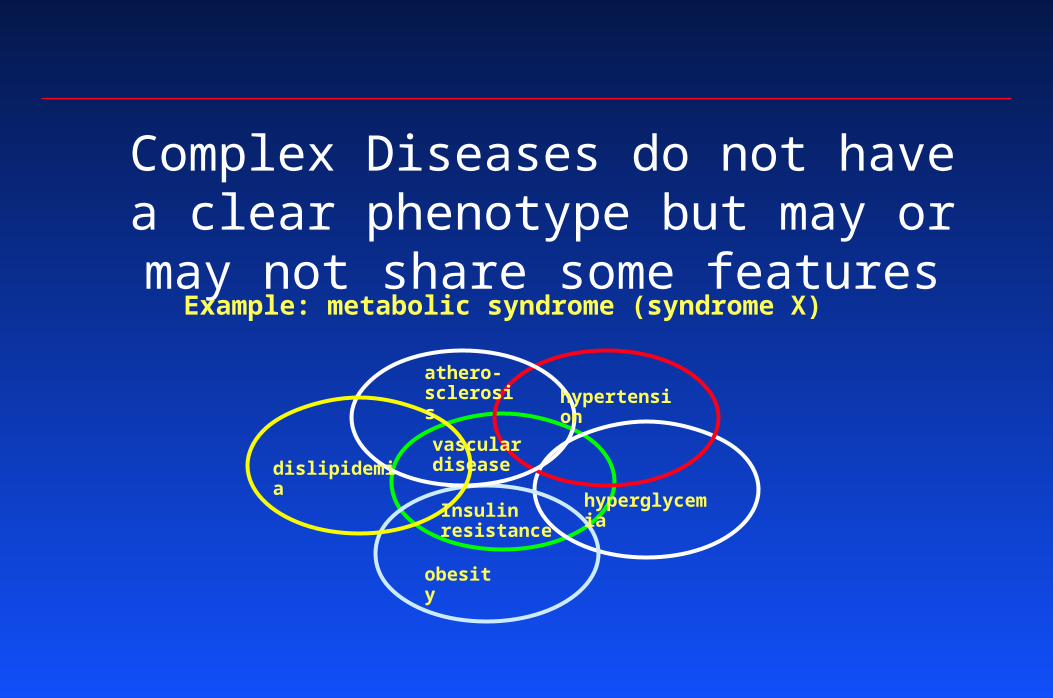
Complex Diseases do not have a clear phenotype but may or may
not share some featuresExample: metabolic syndrome (syndrome X)
hypertension
hyperglycemia
dislipidemia
obesity
athero-sclerosis
Insulin resistance
vascular disease
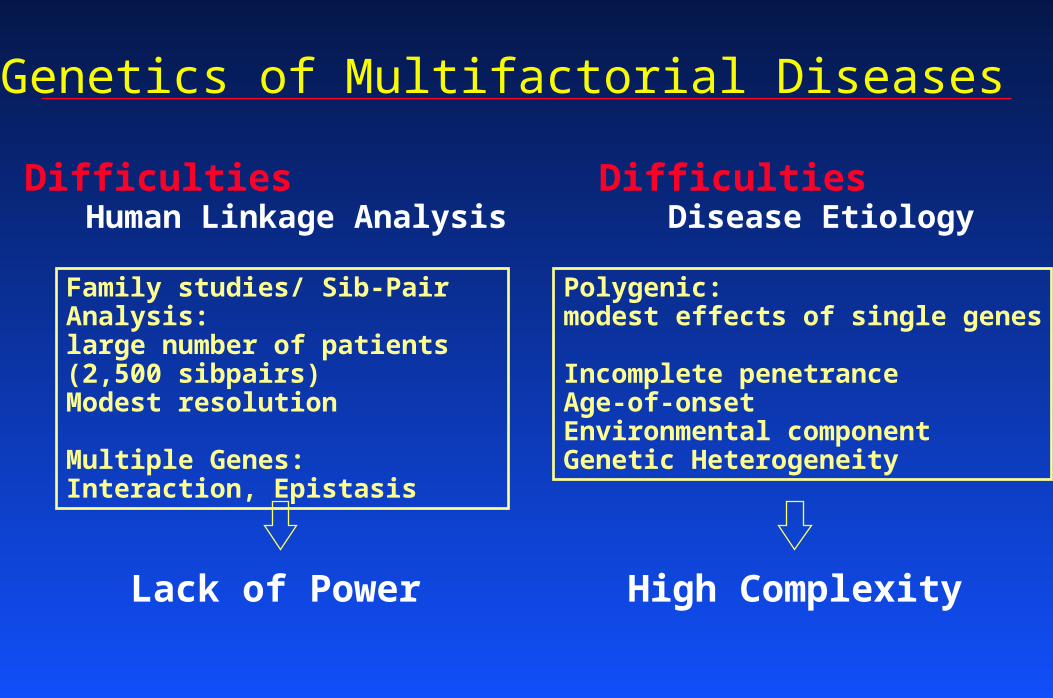
Polygenic:modest effects of single genes
Incomplete penetranceAge-of-onsetEnvironmental componentGenetic Heterogeneity
High Complexity
DifficultiesDisease Etiology
Family studies/ Sib-Pair Analysis:large number of patients(2,500 sibpairs)Modest resolution
Multiple Genes:Interaction, Epistasis
Lack of Power
DifficultiesHuman Linkage Analysis
Genetics of Multifactorial Diseases
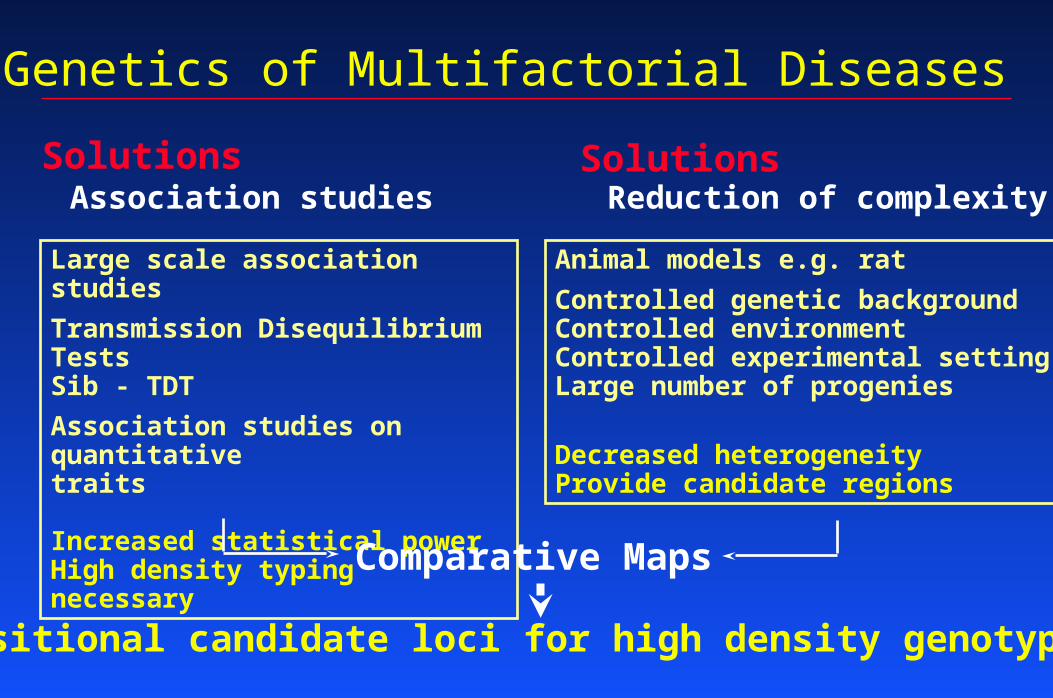
Large scale association studies
Transmission Disequilibrium TestsSib - TDT
Association studies on quantitativetraits
Increased statistical powerHigh density typing necessary
Animal models e.g. rat
Controlled genetic backgroundControlled environmentControlled experimental settingLarge number of progenies
Decreased heterogeneityProvide candidate regions
SolutionsReduction of complexity
SolutionsAssociation studies
Comparative Maps
Positional candidate loci for high density genotyping
Genetics of Multifactorial Diseases
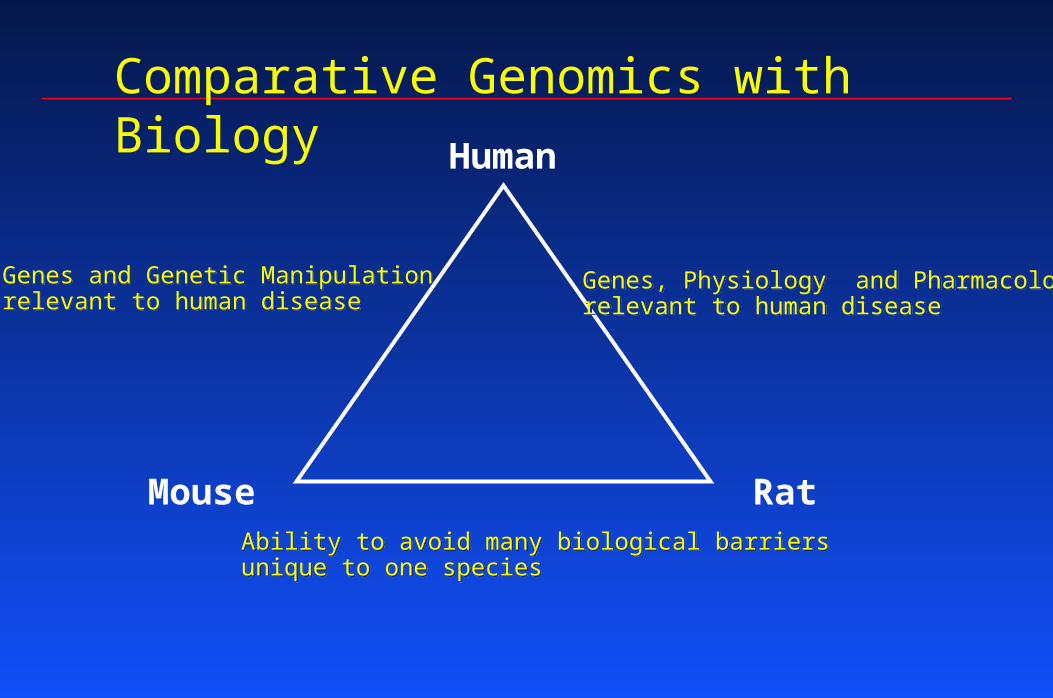
Comparative Genomics with Biology Human
Mouse Rat
Genes, Physiology and Pharmacologyrelevant to human diseaseGenes, Physiology and Pharmacologyrelevant to human disease
Genes and Genetic Manipulation relevant to human diseaseGenes and Genetic Manipulation relevant to human disease
Ability to avoid many biological barriersunique to one speciesAbility to avoid many biological barriersunique to one species
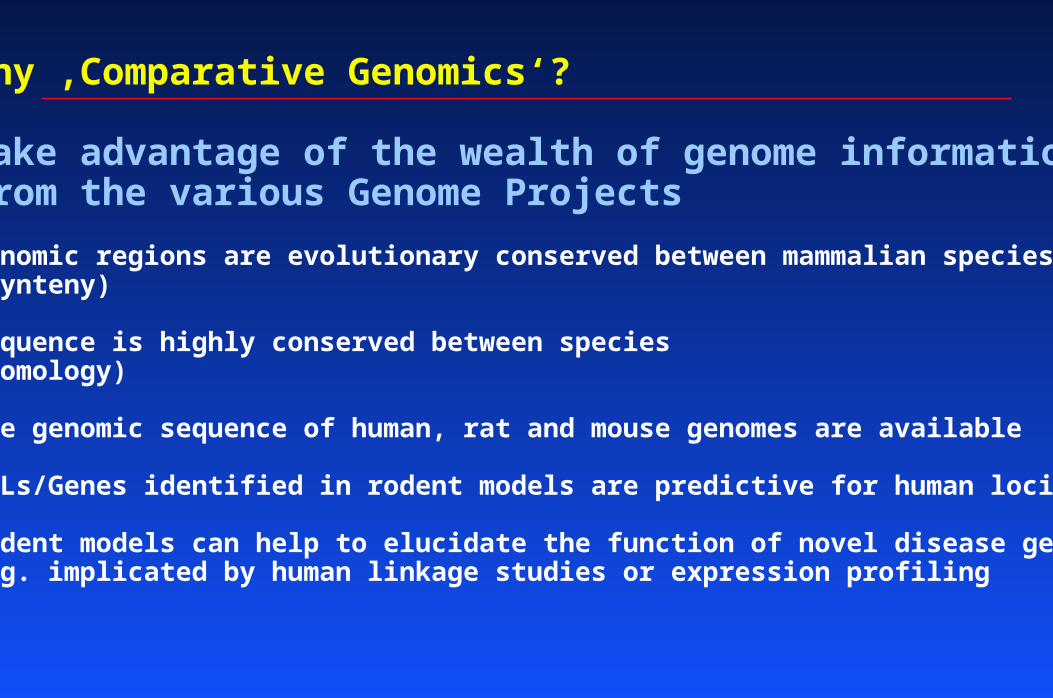
Why ‚Comparative Genomics‘?
Take advantage of the wealth of genome informationfrom the various Genome Projects
Genomic regions are evolutionary conserved between mammalian species(Synteny)
Sequence is highly conserved between species(Homology)
The genomic sequence of human, rat and mouse genomes are available
QTLs/Genes identified in rodent models are predictive for human loci
Rodent models can help to elucidate the function of novel disease genese.g. implicated by human linkage studies or expression profiling
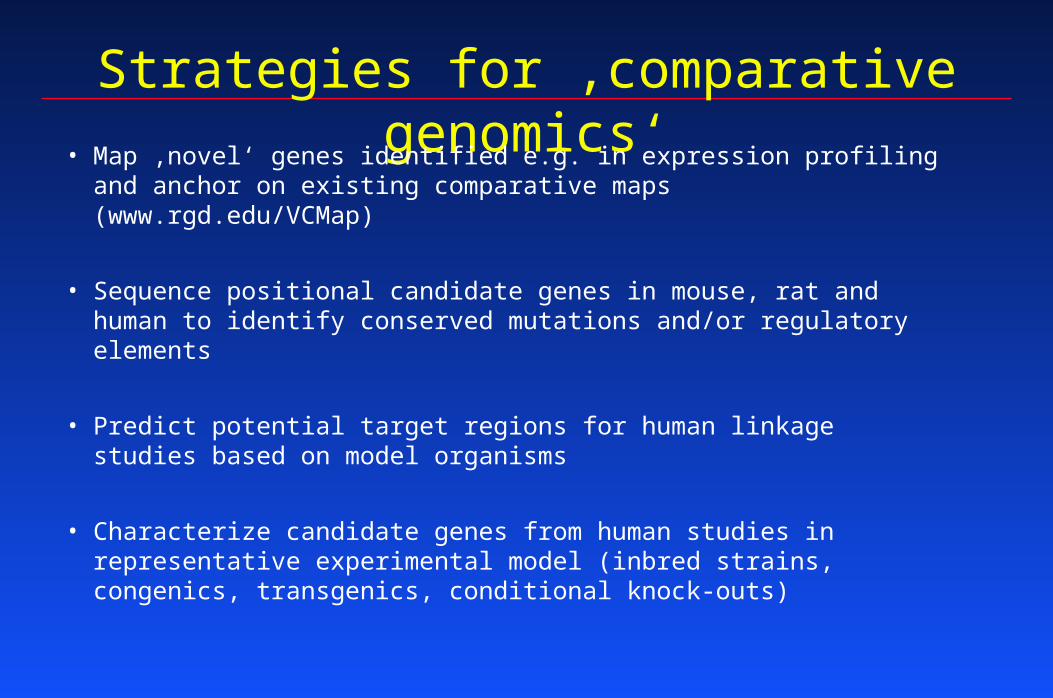
Strategies for ‚comparative genomics‘• Map ‚novel‘ genes identified e.g. in expression profiling and
anchor on existing comparative maps (www.rgd.edu/VCMap)
• Sequence positional candidate genes in mouse, rat and human to identify conserved mutations and/or regulatory elements
• Predict potential target regions for human linkage studies based on model organisms
• Characterize candidate genes from human studies in representative experimental model (inbred strains, congenics, transgenics, conditional knock-outs)
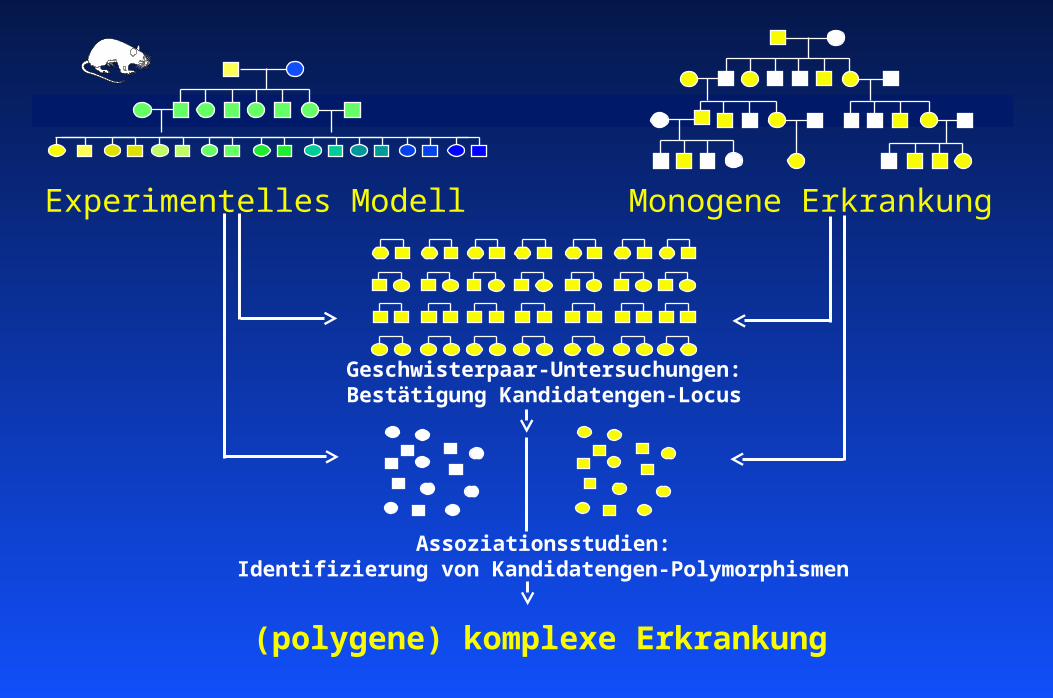
Experimentelles Modell Monogene Erkrankung
Geschwisterpaar-Untersuchungen:Bestätigung Kandidatengen-Locus
Assoziationsstudien:Identifizierung von Kandidatengen-Polymorphismen
(polygene) komplexe Erkrankung
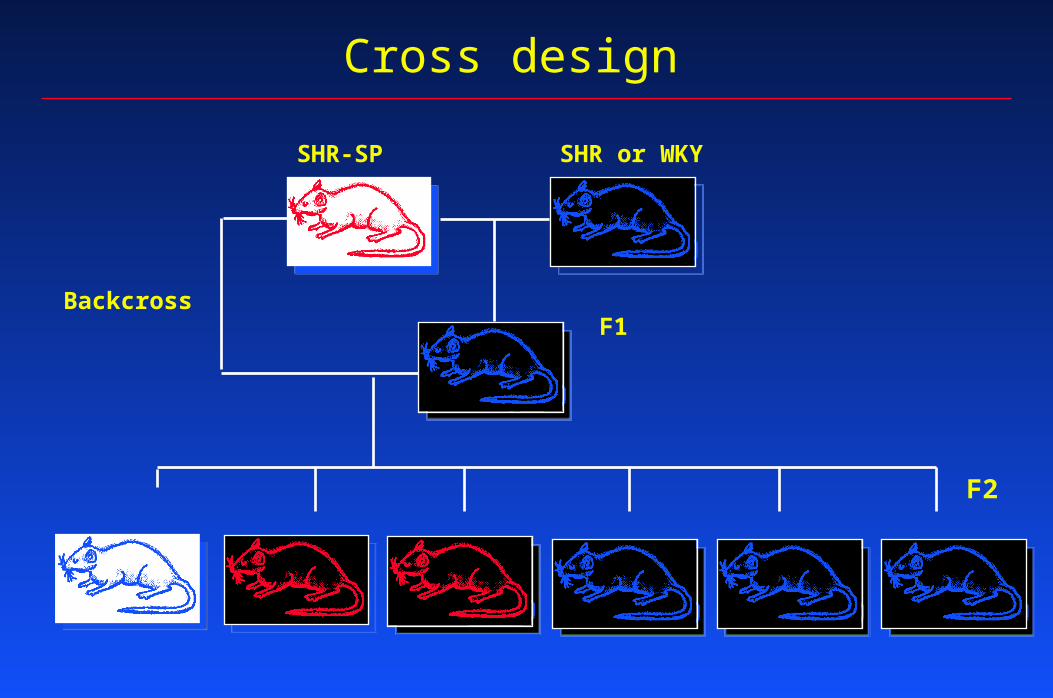
Cross design
SHR-SP SHR or WKY
F1Backcross
F2
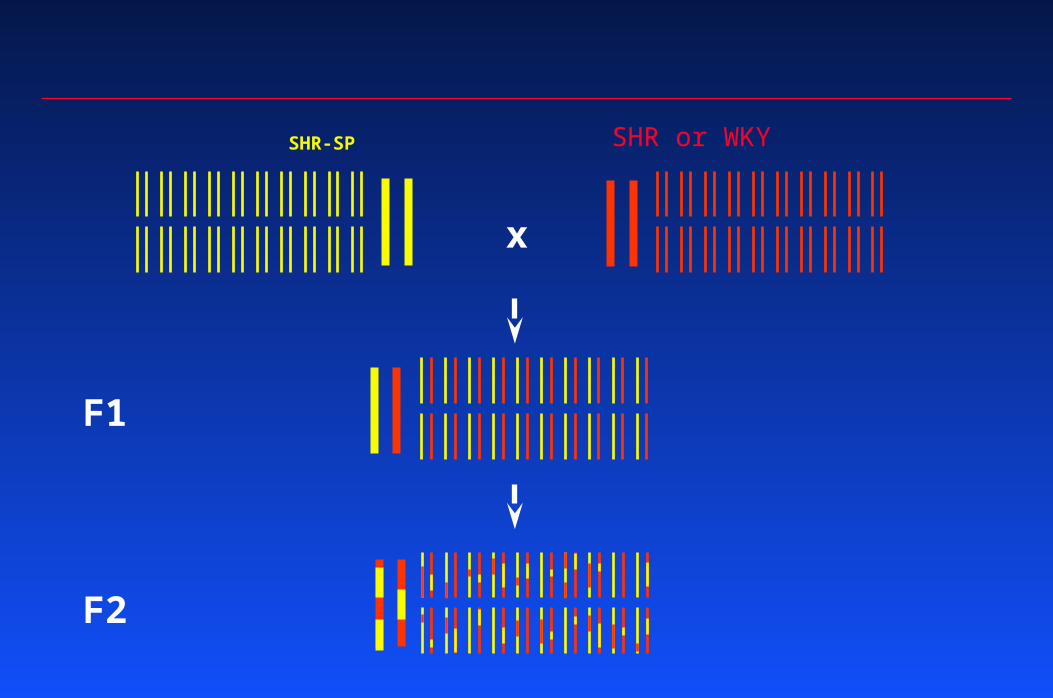
F2
x
SHR-SP SHR or WKY
F1
Human Chromosome Regions Implicated inHypertension via a Cross-Species Comparison
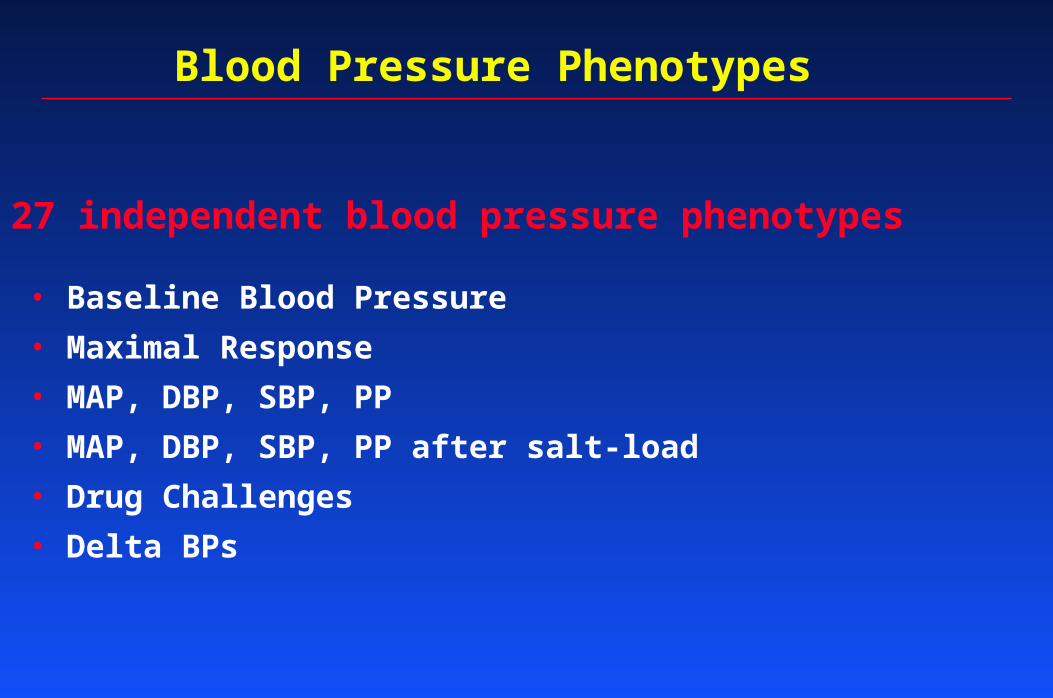
Blood Pressure Phenotypes
27 independent blood pressure phenotypes
• Baseline Blood Pressure
• Maximal Response
• MAP, DBP, SBP, PP
• MAP, DBP, SBP, PP after salt-load
• Drug Challenges
• Delta BPs
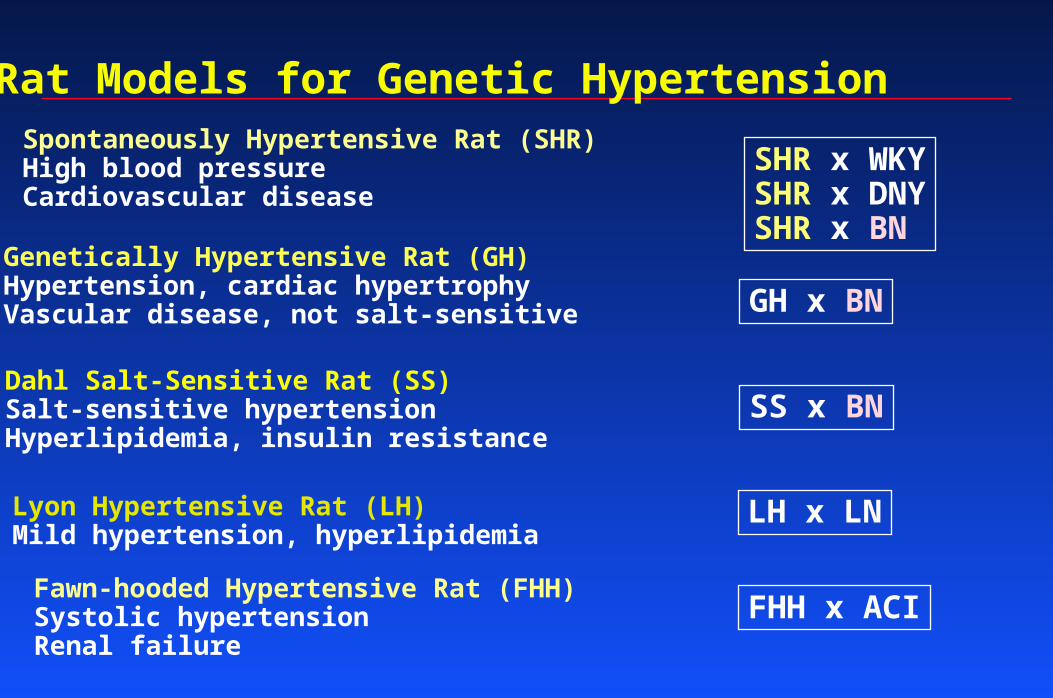
Rat Models for Genetic Hypertension
SHR x WKYSHR x DNYSHR x BN
GH x BN
SS x BN
LH x LN
Spontaneously Hypertensive Rat (SHR)High blood pressure Cardiovascular disease
Genetically Hypertensive Rat (GH)Hypertension, cardiac hypertrophyVascular disease, not salt-sensitive
Dahl Salt-Sensitive Rat (SS)Salt-sensitive hypertensionHyperlipidemia, insulin resistance
Lyon Hypertensive Rat (LH)Mild hypertension, hyperlipidemia
Fawn-hooded Hypertensive Rat (FHH)Systolic hypertensionRenal failure
FHH x ACI
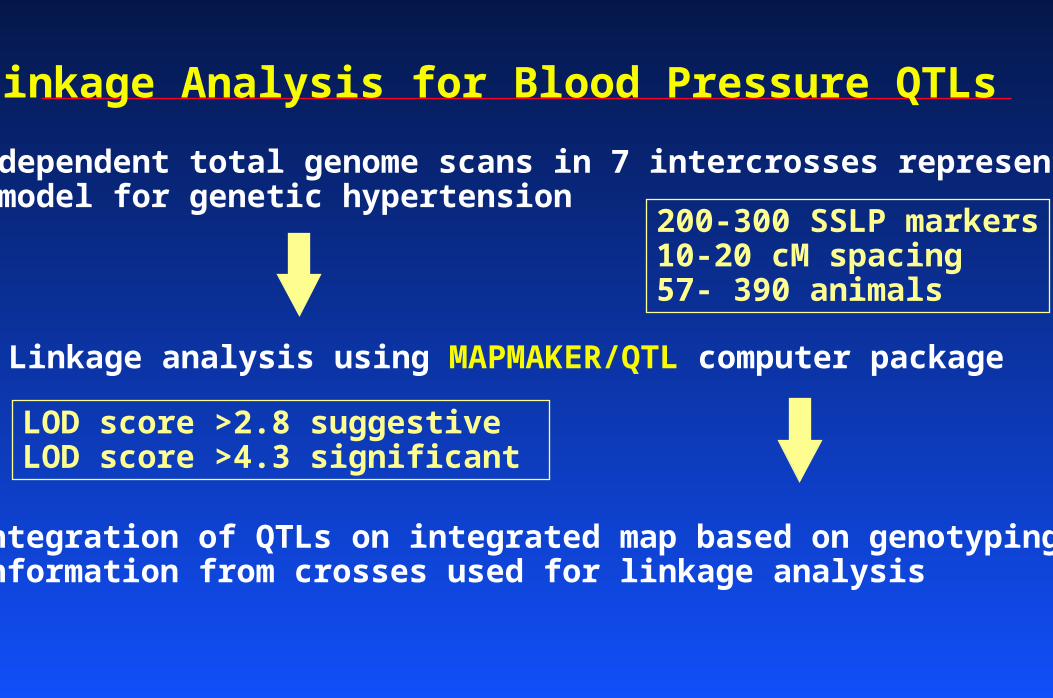
Linkage Analysis for Blood Pressure QTLs
Independent total genome scans in 7 intercrosses representing a model for genetic hypertension
200-300 SSLP markers10-20 cM spacing57- 390 animals
Linkage analysis using MAPMAKER/QTL computer package
LOD score >2.8 suggestiveLOD score >4.3 significant
Integration of QTLs on integrated map based on genotyping information from crosses used for linkage analysis
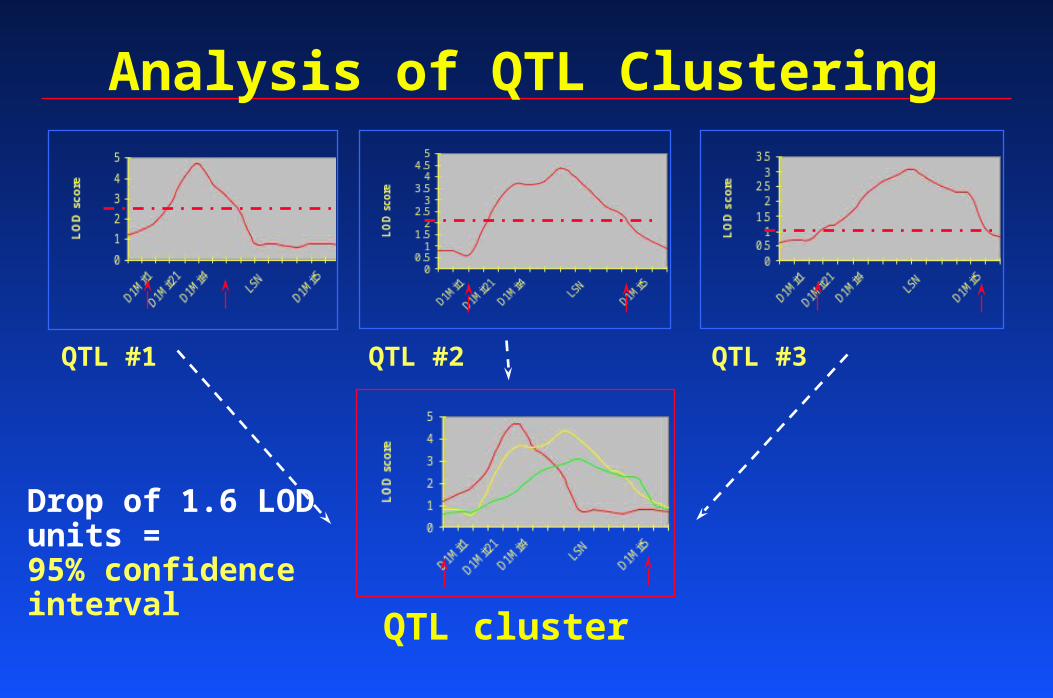
QTL #1 QTL #2 QTL #3
QTL cluster
Drop of 1.6 LODunits =95% confidenceinterval
Analysis of QTL Clustering
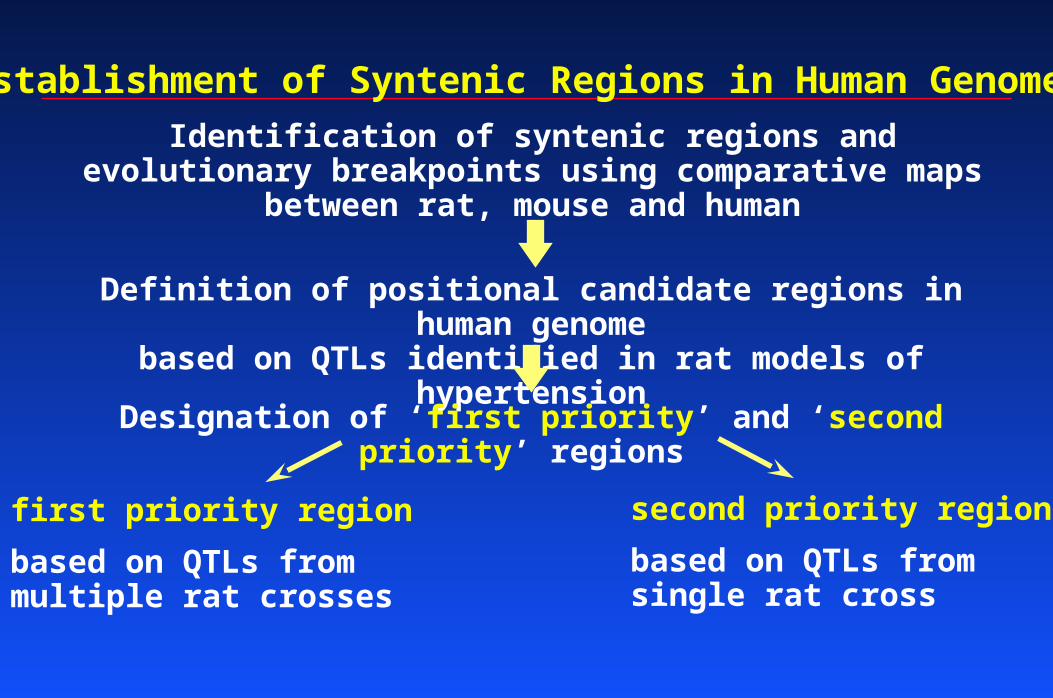
Establishment of Syntenic Regions in Human Genome Identification of syntenic regions and evolutionary breakpoints using comparative maps between rat,
mouse and human
Definition of positional candidate regions in human genome
based on QTLs identified in rat models of hypertension
Designation of ‘first priority’ and ‘second priority’ regions
first priority region
based on QTLs frommultiple rat crosses
second priority region
based on QTLs from single rat cross
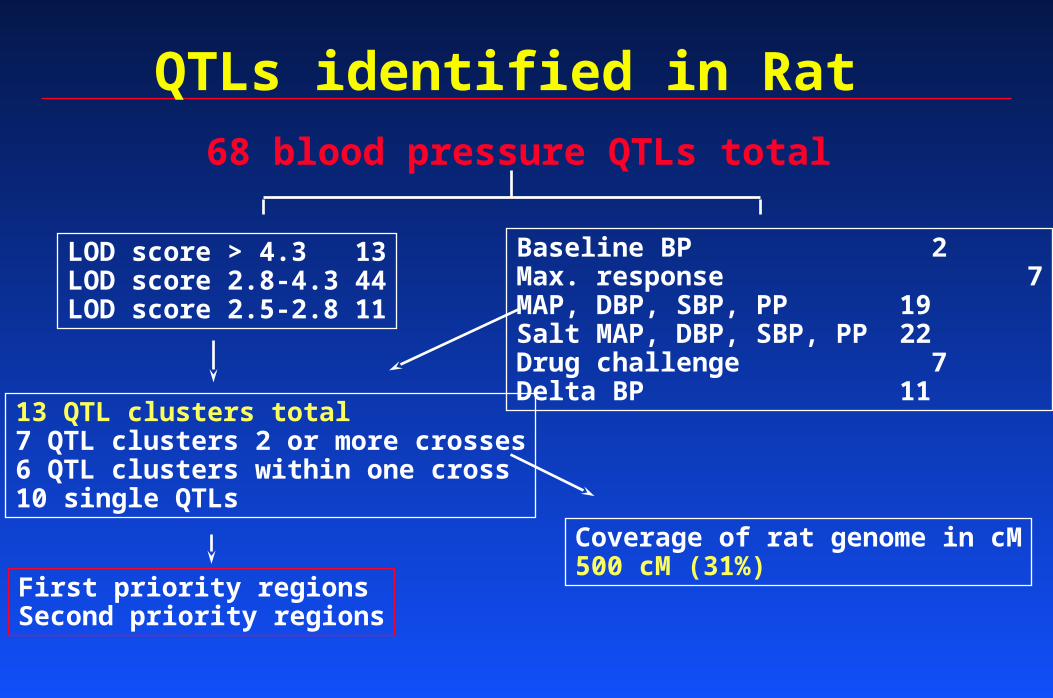
QTLs identified in Rat
LOD score > 4.3 13LOD score 2.8-4.3 44LOD score 2.5-2.8 11
68 blood pressure QTLs total
13 QTL clusters total7 QTL clusters 2 or more crosses6 QTL clusters within one cross10 single QTLs
Baseline BP 2Max. response 7MAP, DBP, SBP, PP 19Salt MAP, DBP, SBP, PP 22Drug challenge 7Delta BP 11
Coverage of rat genome in cM500 cM (31%)
First priority regionsSecond priority regions
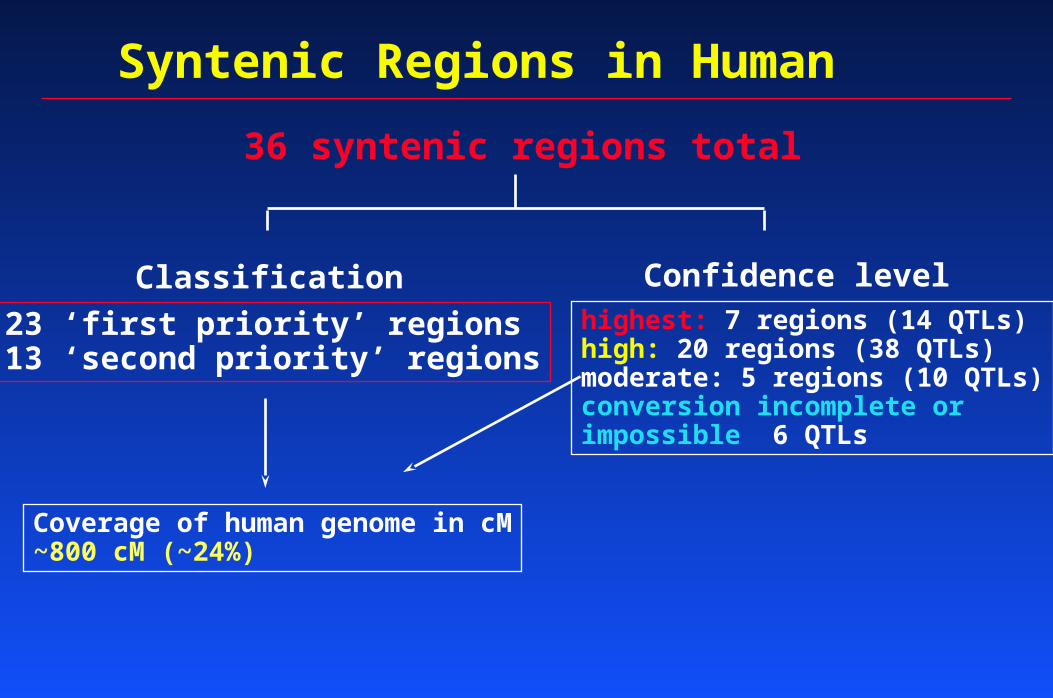
Syntenic Regions in Human
36 syntenic regions total
highest: 7 regions (14 QTLs)high: 20 regions (38 QTLs) moderate: 5 regions (10 QTLs)conversion incomplete or impossible 6 QTLs
23 ‘first priority’ regions13 ‘second priority’ regions
Coverage of human genome in cM~800 cM (~24%)
Classification Confidence level
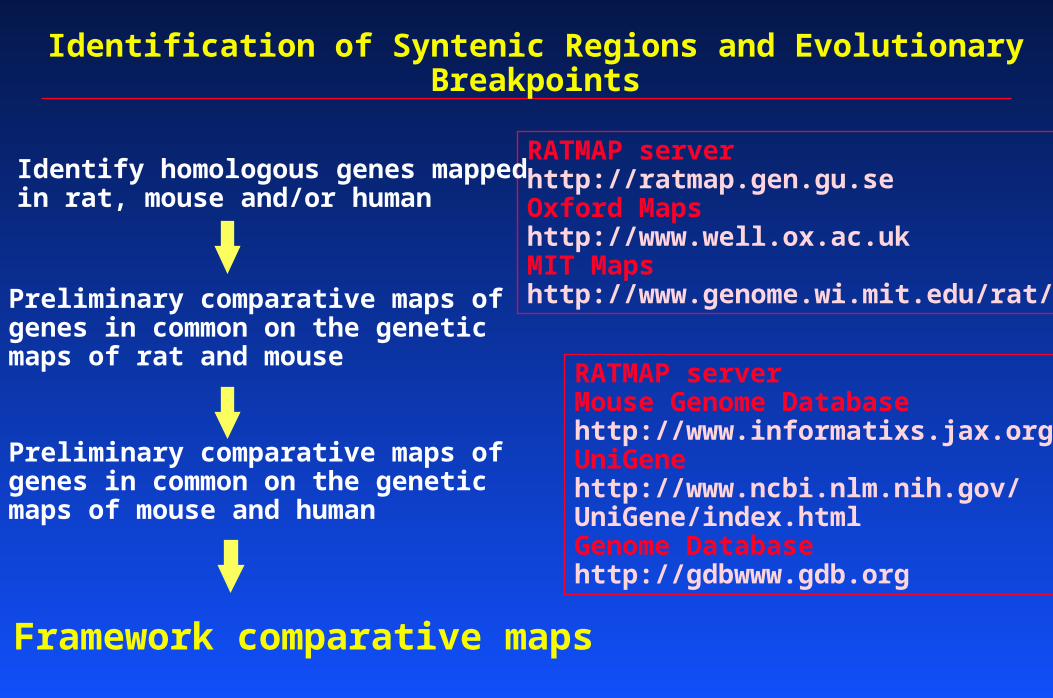
Identification of Syntenic Regions and Evolutionary Breakpoints
Framework comparative maps
RATMAP serverhttp://ratmap.gen.gu.seOxford Mapshttp://www.well.ox.ac.ukMIT Mapshttp://www.genome.wi.mit.edu/rat/
RATMAP serverMouse Genome Databasehttp://www.informatixs.jax.orgUniGene http://www.ncbi.nlm.nih.gov/UniGene/index.htmlGenome Databasehttp://gdbwww.gdb.org
Identify homologous genes mappedin rat, mouse and/or human
Preliminary comparative maps of genes in common on the genetic maps of rat and mouse
Preliminary comparative maps of genes in common on the genetic maps of mouse and human
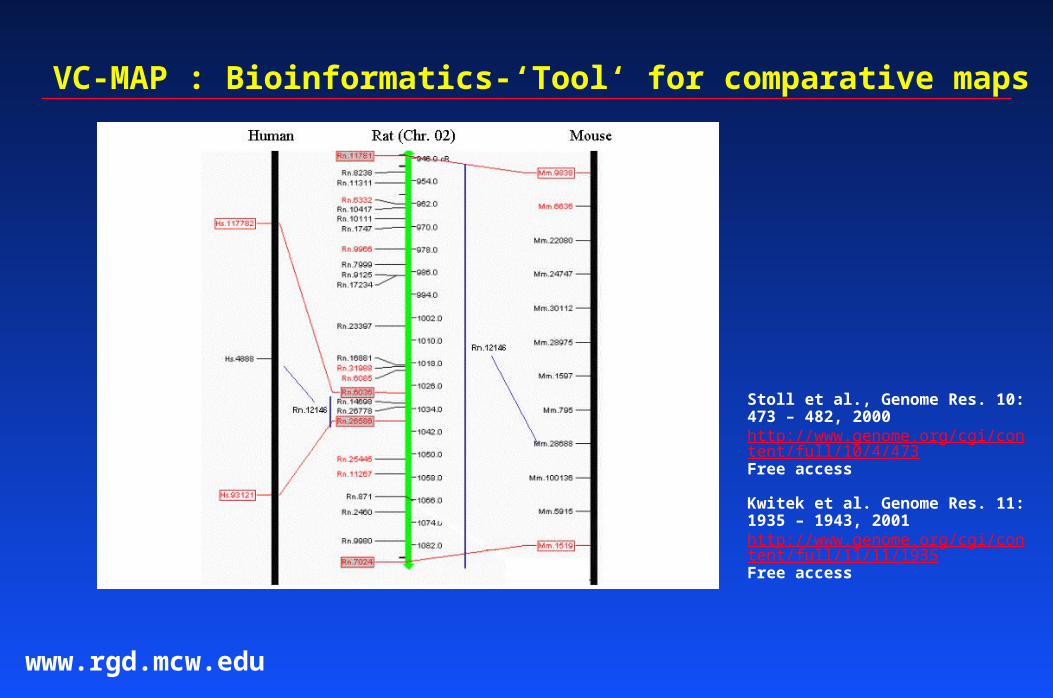
VC-MAP : Bioinformatics-‘Tool‘ for comparative maps
Stoll et al., Genome Res. 10: 473 – 482, 2000http://www.genome.org/cgi/content/full/10/4/473Free access
Kwitek et al. Genome Res. 11: 1935 – 1943, 2001http://www.genome.org/cgi/content/full/11/11/1935Free access
www.rgd.mcw.edu
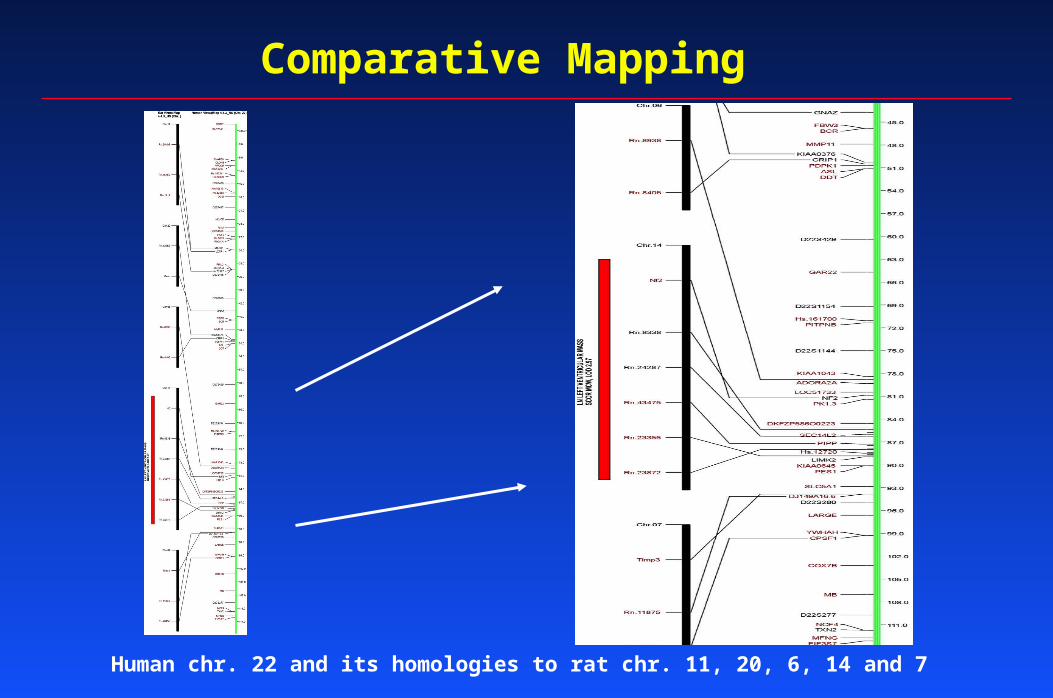
Comparative Mapping
Human chr. 22 and its homologies to rat chr. 11, 20, 6, 14 and 7
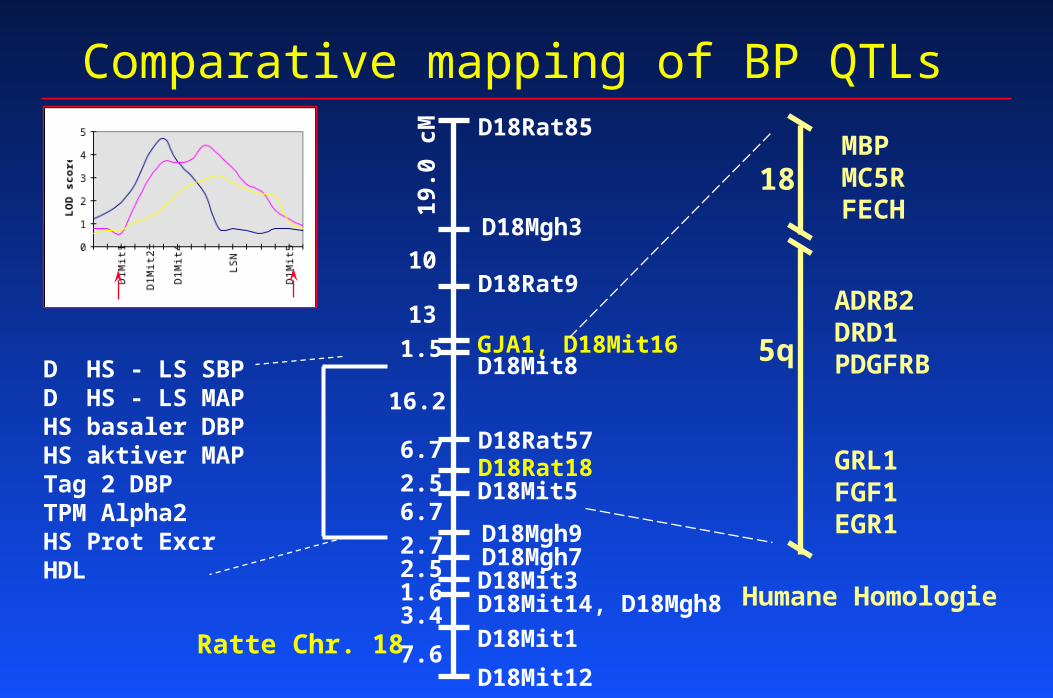
D HS - LS SBPD HS - LS MAP HS basaler DBP HS aktiver MAP Tag 2 DBP TPM Alpha2HS Prot ExcrHDL
D18Rat85
D18Mgh3
D18Rat9
GJA1, D18Mit16D18Mit8
D18Rat57D18Rat18D18Mit5
D18Mgh9D18Mgh7
1.5
19.0
cM
6.7
D18Mit3D18Mit14, D18Mgh8
D18Mit12
D18Mit1
10
13
16.2
2.56.72.72.51.63.4
7.6
18
5q
ADRB2DRD1PDGFRB
GRL1FGF1EGR1
Ratte Chr. 18
Humane Homologie
MBPMC5RFECH
Comparative mapping of BP QTLs
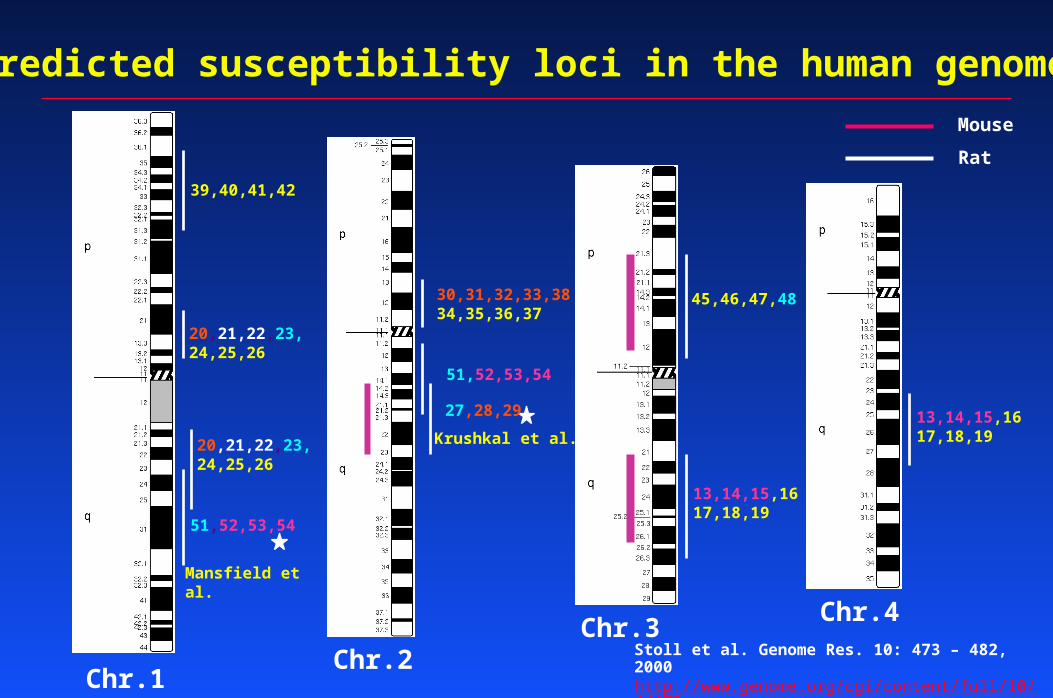
Chr.1
Chr.2
51,52,53,54
30,31,32,33,3834,35,36,37
45,46,47,48
13,14,15,1617,18,19
20,21,22,23,24,25,26
Mansfield et al.
Krushkal et al.
39,40,41,42
20,21,22,23,24,25,26
51,52,53,54
27,28,29 13,14,15,1617,18,19
Chr.3Chr.4
Predicted susceptibility loci in the human genome
Stoll et al. Genome Res. 10: 473 – 482, 2000http://www.genome.org/cgi/content/full/10/4/473Free access
Mouse
Rat
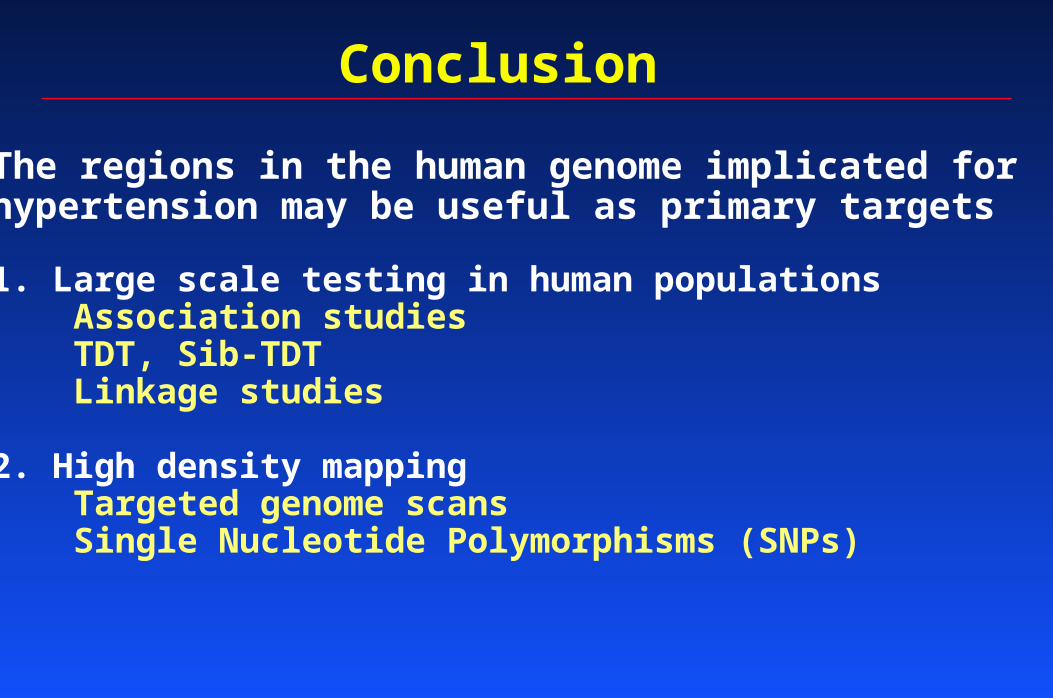
Conclusion
The regions in the human genome implicated forhypertension may be useful as primary targets
1. Large scale testing in human populations Association studies TDT, Sib-TDT Linkage studies 2. High density mapping Targeted genome scans Single Nucleotide Polymorphisms (SNPs)
Genetic studies in human populations
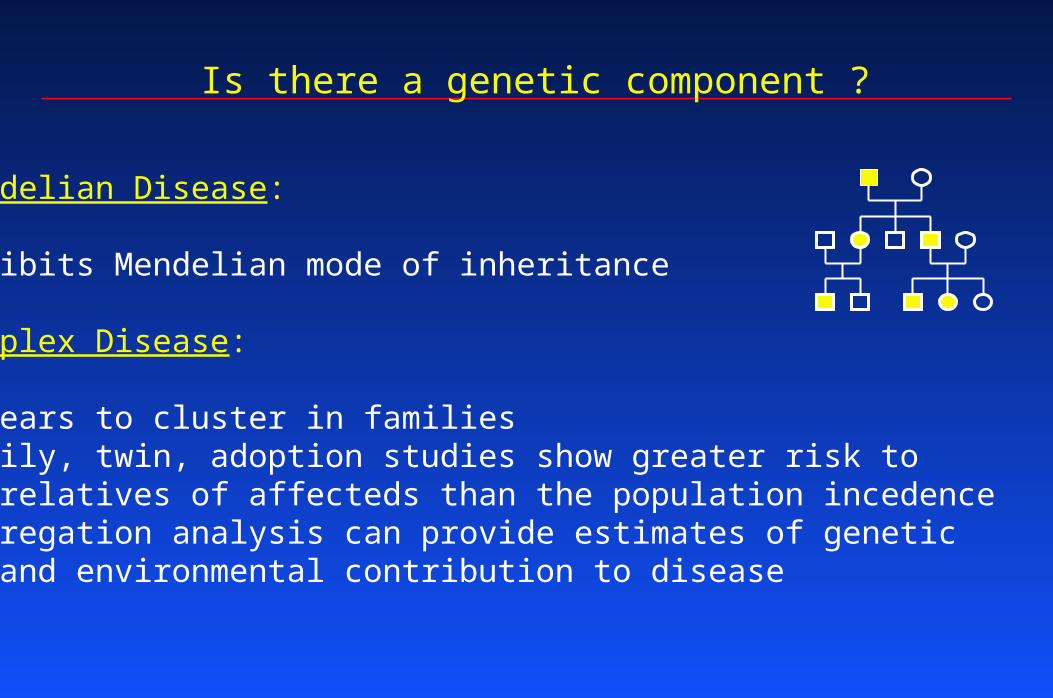
Is there a genetic component ?
Mendelian Disease:
Exhibits Mendelian mode of inheritance Complex Disease:
Appears to cluster in familiesFamily, twin, adoption studies show greater risk to relatives of affecteds than the population incedenceSegregation analysis can provide estimates of genetic and environmental contribution to disease
Where is the gene ?
Linkage analysis:
Cosegregation of mapped marker with the diseaseFine mapping to narrow the region
In Complex Disease:
Requires a defined genetic modelRequires classifying people as affects and unaffectedsAllele sharing methods (sib pairs etc.)
Population association studies
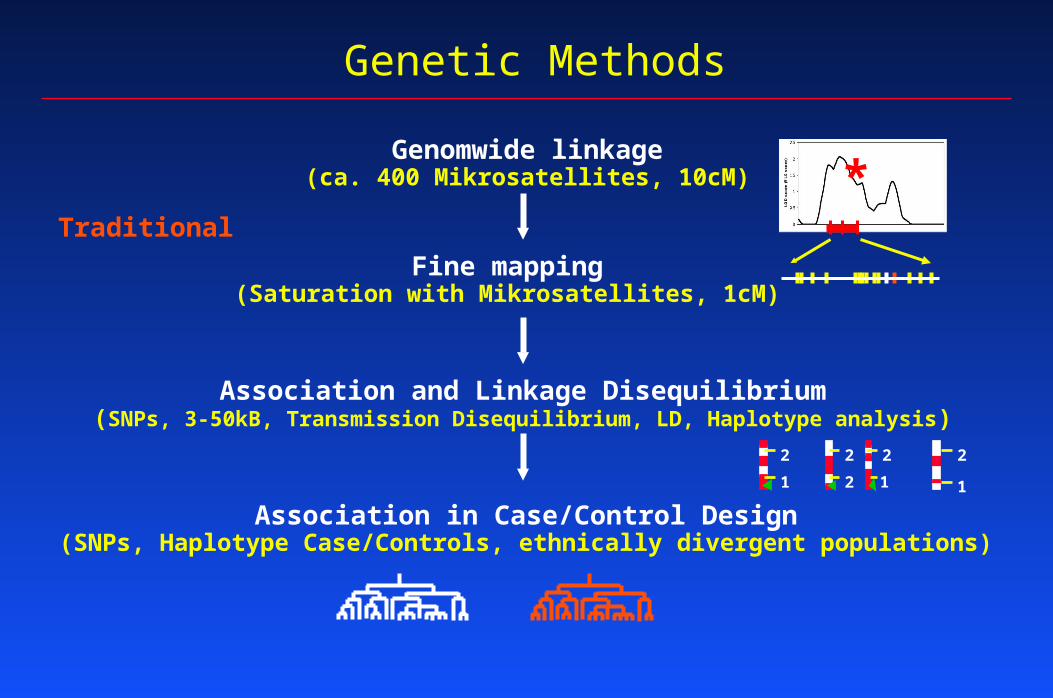
Genetic Methods
Genomwide linkage(ca. 400 Mikrosatellites, 10cM)
Fine mapping(Saturation with Mikrosatellites, 1cM)
Association and Linkage Disequilibrium(SNPs, 3-50kB, Transmission Disequilibrium, LD, Haplotype analysis)
Association in Case/Control Design(SNPs, Haplotype Case/Controls, ethnically divergent populations)
Traditional
1 12
2 2 2 2
1
*
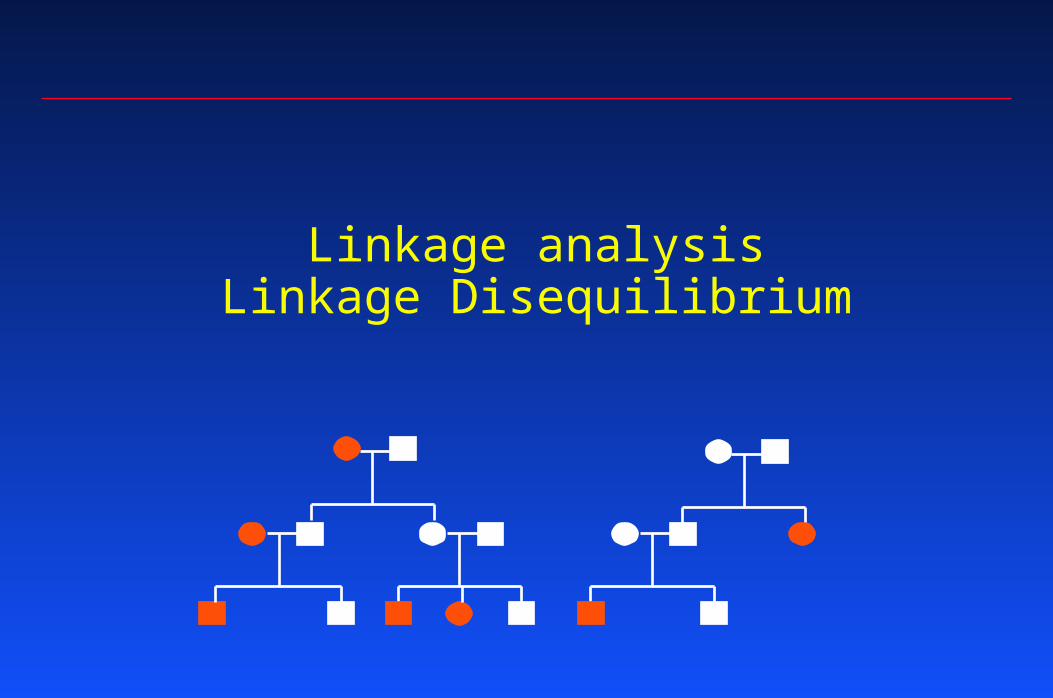
Linkage analysisLinkage Disequilibrium
Linkage analysis
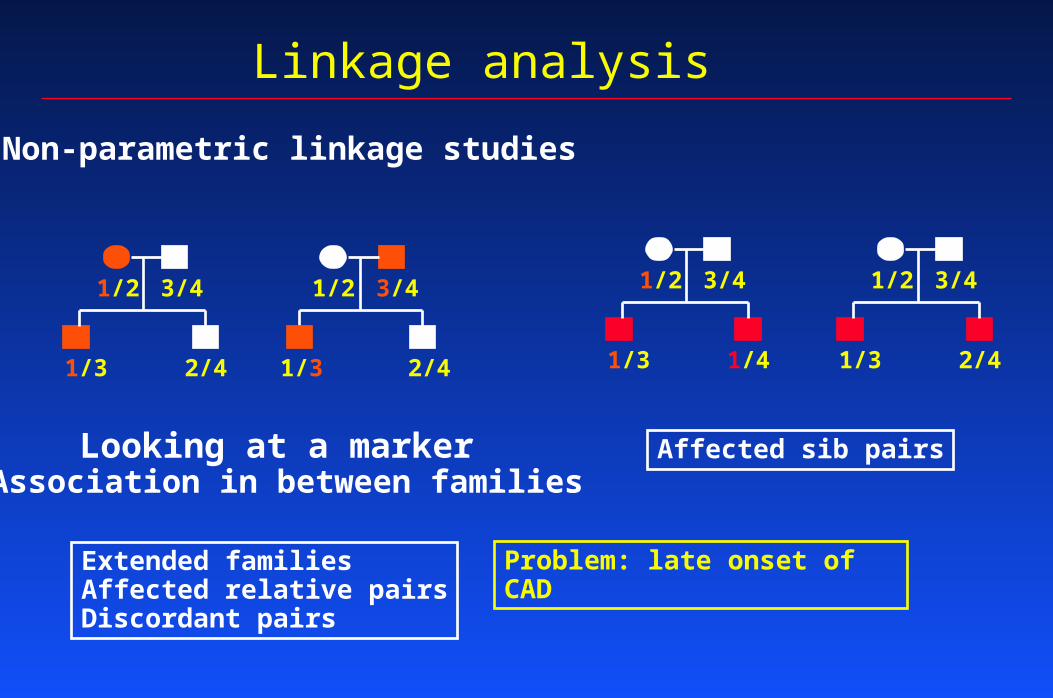
Non-parametric linkage studies
Looking at a marker Association in between families
1/2 3/4
1/3 2/4
1/2 3/4
1/3 2/4
Extended familiesAffected relative pairsDiscordant pairs
1/2 3/4
1/3 1/4
1/2 3/4
1/3 2/4
Affected sib pairs
Problem: late onset of CAD
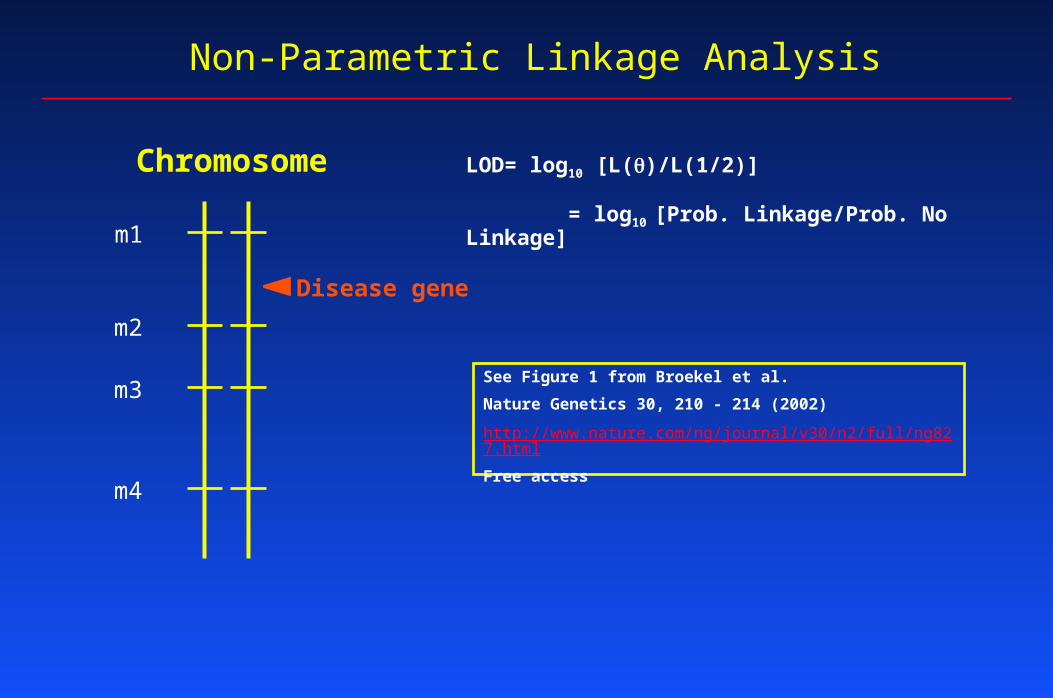
Non-Parametric Linkage Analysis
m1
m2
m3
m4
Disease gene
Chromosome LOD= log10 [L()/L(1/2)]
= log10 [Prob. Linkage/Prob. No Linkage]
See Figure 1 from Broekel et al.
Nature Genetics 30, 210 - 214 (2002)
http://www.nature.com/ng/journal/v30/n2/full/ng827.html
Free access
Several examples for hypertension linkage in human study populations
How to get from linkage to the causative gene variant ?
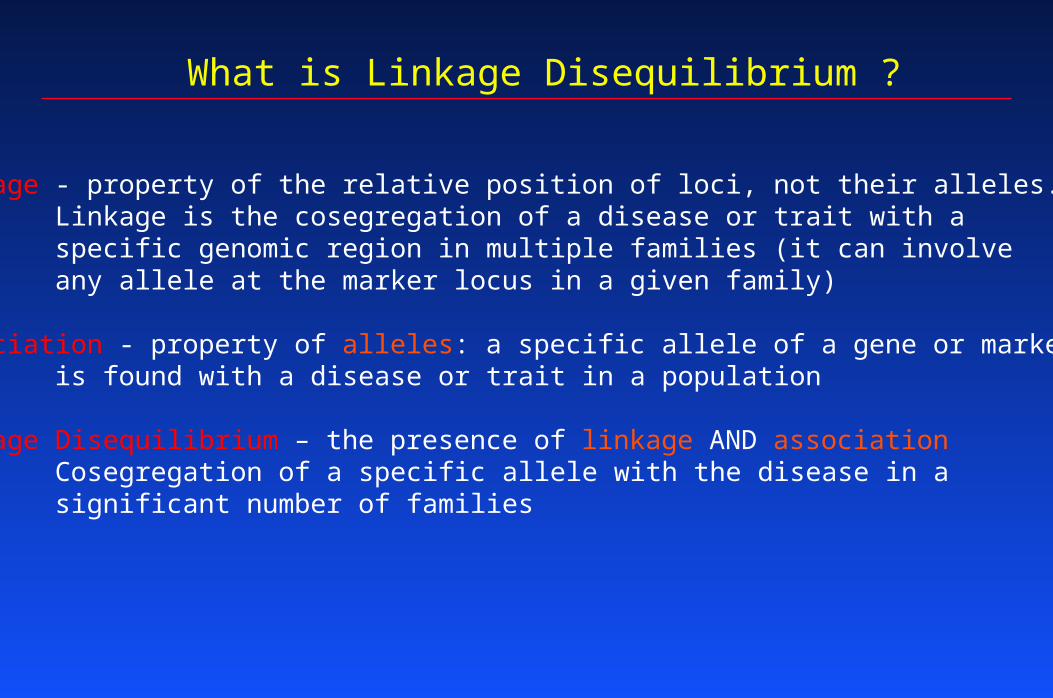
What is Linkage Disequilibrium ?
Linkage - property of the relative position of loci, not their alleles. Linkage is the cosegregation of a disease or trait with a specific genomic region in multiple families (it can involve any allele at the marker locus in a given family)
Association - property of alleles: a specific allele of a gene or marker is found with a disease or trait in a population
Linkage Disequilibrium – the presence of linkage AND association Cosegregation of a specific allele with the disease in a significant number of families
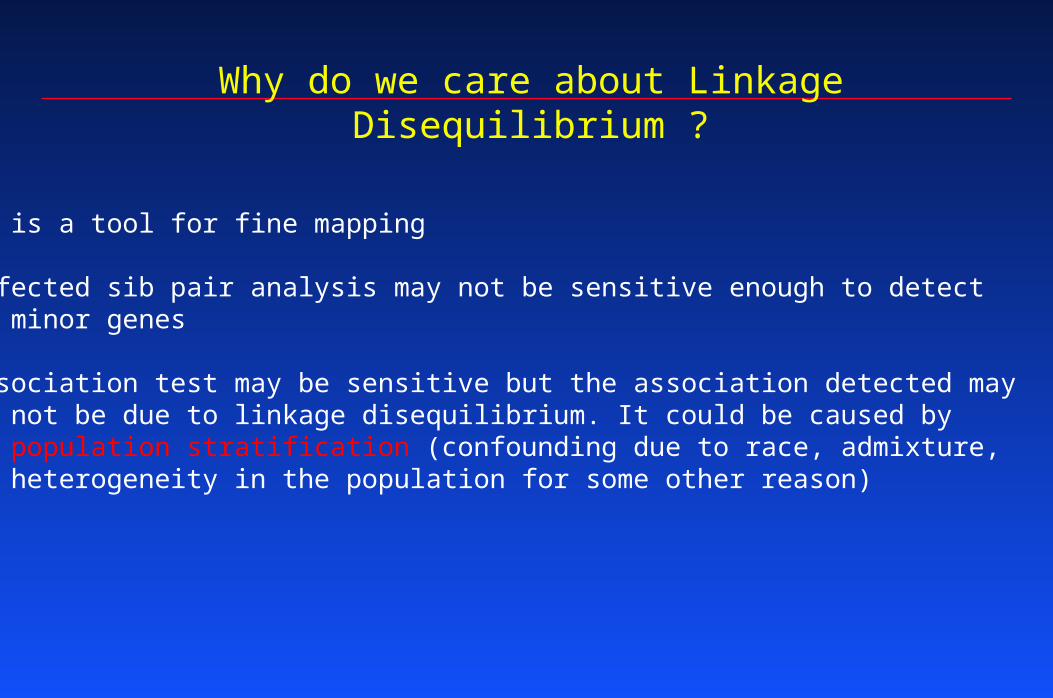
Why do we care about Linkage Disequilibrium ?
It is a tool for fine mapping
Affected sib pair analysis may not be sensitive enough to detect minor genes
Association test may be sensitive but the association detected may not be due to linkage disequilibrium. It could be caused by population stratification (confounding due to race, admixture, heterogeneity in the population for some other reason)
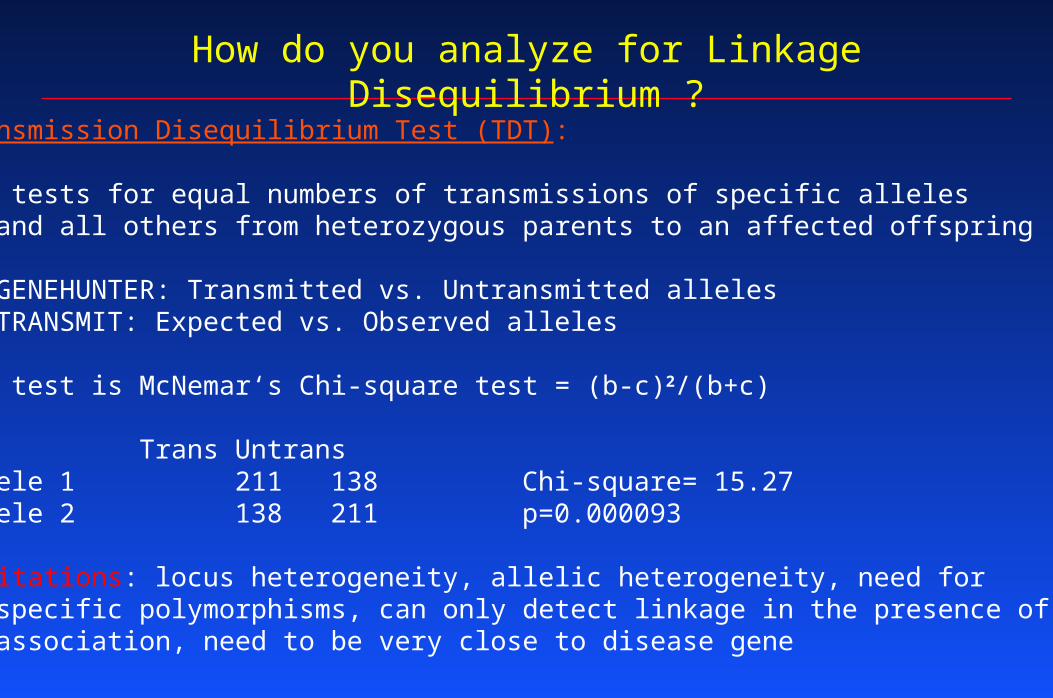
How do you analyze for Linkage Disequilibrium ?
Transmission Disequilibrium Test (TDT):
TDT tests for equal numbers of transmissions of specific alleles and all others from heterozygous parents to an affected offspring GENEHUNTER: Transmitted vs. Untransmitted alleles TRANSMIT: Expected vs. Observed alleles
TDT test is McNemar‘s Chi-square test = (b-c)2/(b+c)
Trans UntransAllele 1 211 138 Chi-square= 15.27Allele 2 138 211 p=0.000093
Limitations: locus heterogeneity, allelic heterogeneity, need for specific polymorphisms, can only detect linkage in the presence of association, need to be very close to disease gene
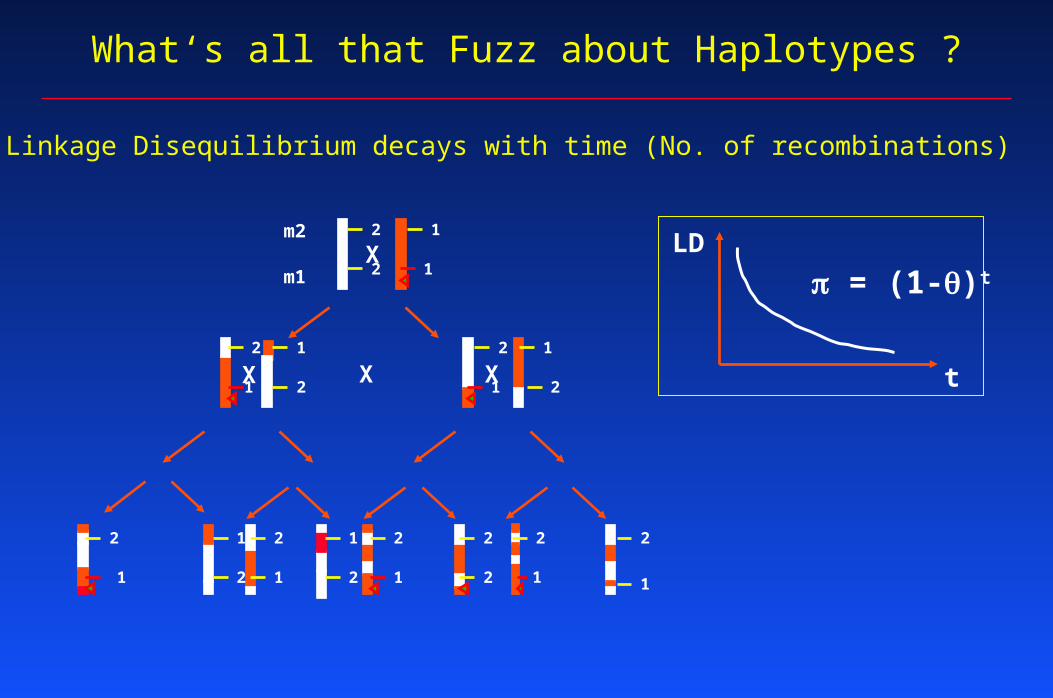
What‘s all that Fuzz about Haplotypes ?
Linkage Disequilibrium decays with time (No. of recombinations)
X
X X
1
2
2
11 1 1
1
2
2
2 2 2
1
1
X2
1 2
1
1 12 2 2 2 2 2
m1
m2
1
LD
t
= (1-)t
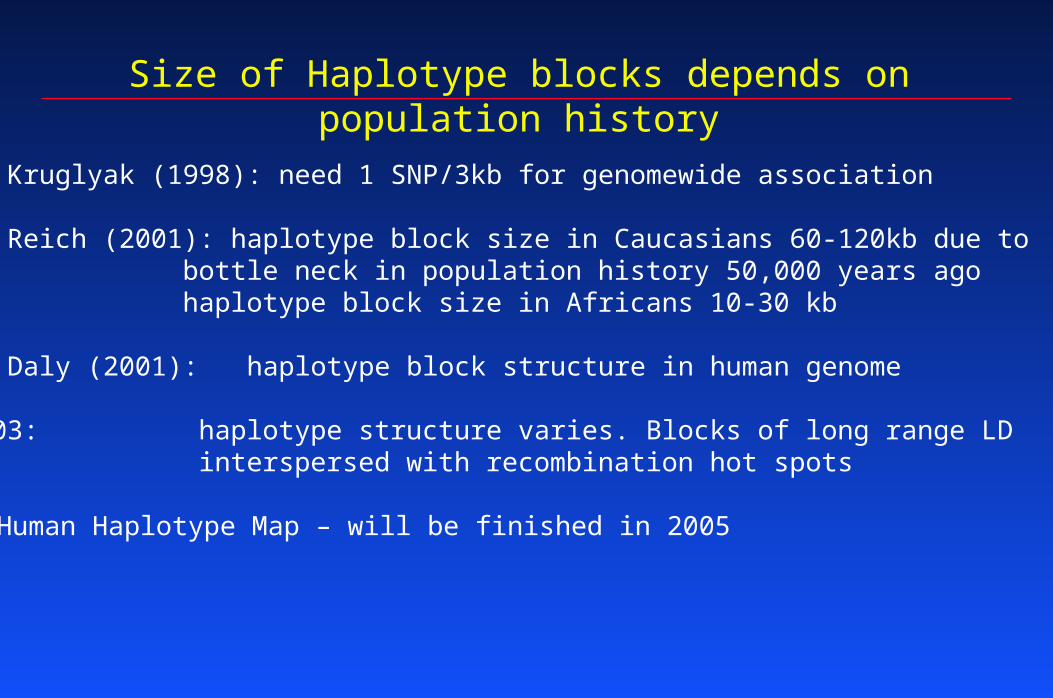
Size of Haplotype blocks depends on population history
L. Kruglyak (1998): need 1 SNP/3kb for genomewide association
D. Reich (2001): haplotype block size in Caucasians 60-120kb due to bottle neck in population history 50,000 years ago haplotype block size in Africans 10-30 kb
M. Daly (2001): haplotype block structure in human genome
2003: haplotype structure varies. Blocks of long range LD interspersed with recombination hot spots
Human Haplotype Map – will be finished in 2005
Hierachical Linkage Disequilibrium Mapping
See figures from Stoll et al.
Nature Genetics 36 (5): 476-480, 2004
http://www.nature.com/ng/journal/v36/n5/index.html
Subscription access only
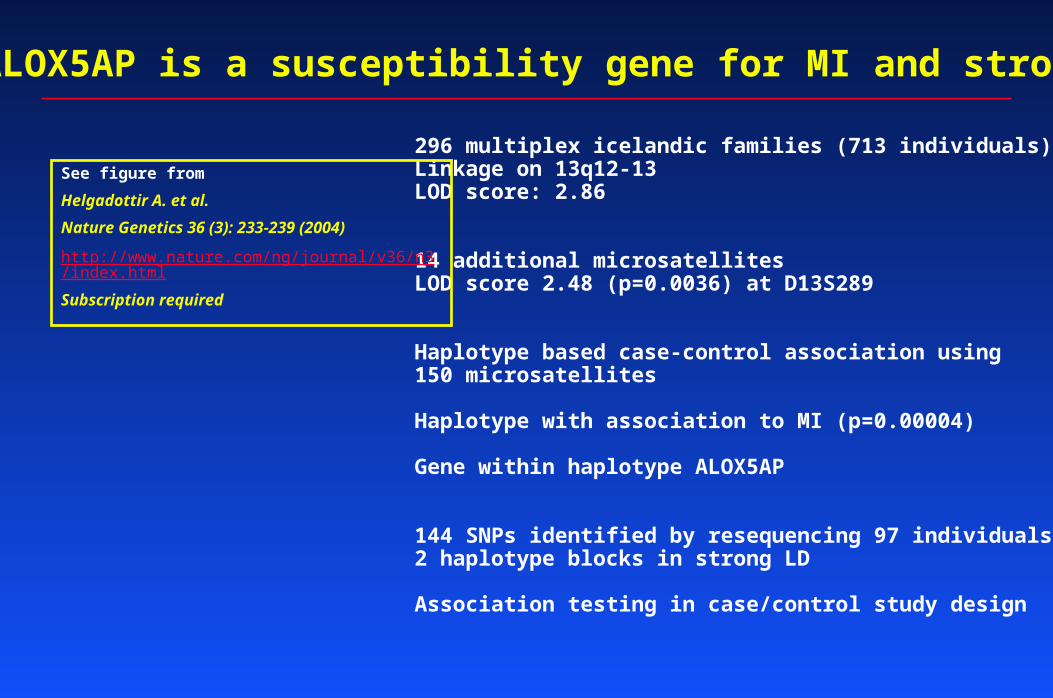
296 multiplex icelandic families (713 individuals)Linkage on 13q12-13LOD score: 2.86
14 additional microsatellitesLOD score 2.48 (p=0.0036) at D13S289
Haplotype based case-control association using150 microsatellites
Haplotype with association to MI (p=0.00004)
Gene within haplotype ALOX5AP
144 SNPs identified by resequencing 97 individuals2 haplotype blocks in strong LD
Association testing in case/control study design
ALOX5AP is a susceptibility gene for MI and stroke
See figure from
Helgadottir A. et al.
Nature Genetics 36 (3): 233-239 (2004)
http://www.nature.com/ng/journal/v36/n3/index.html
Subscription required
ALOX5AP is a susceptibility gene for MI and stroke
See Table 1 from Helgadottir A. et al. Nature Genetics 36 (3): 233-239 (2004)http://www.nature.com/ng/journal/v36/n3/index.htmlSubscription required
See Table 2 from Helgadottir A. et al. Nature Genetics 36 (3): 233-239 (2004)http://www.nature.com/ng/journal/v36/n3/index.htmlSubscription required
Conclusion
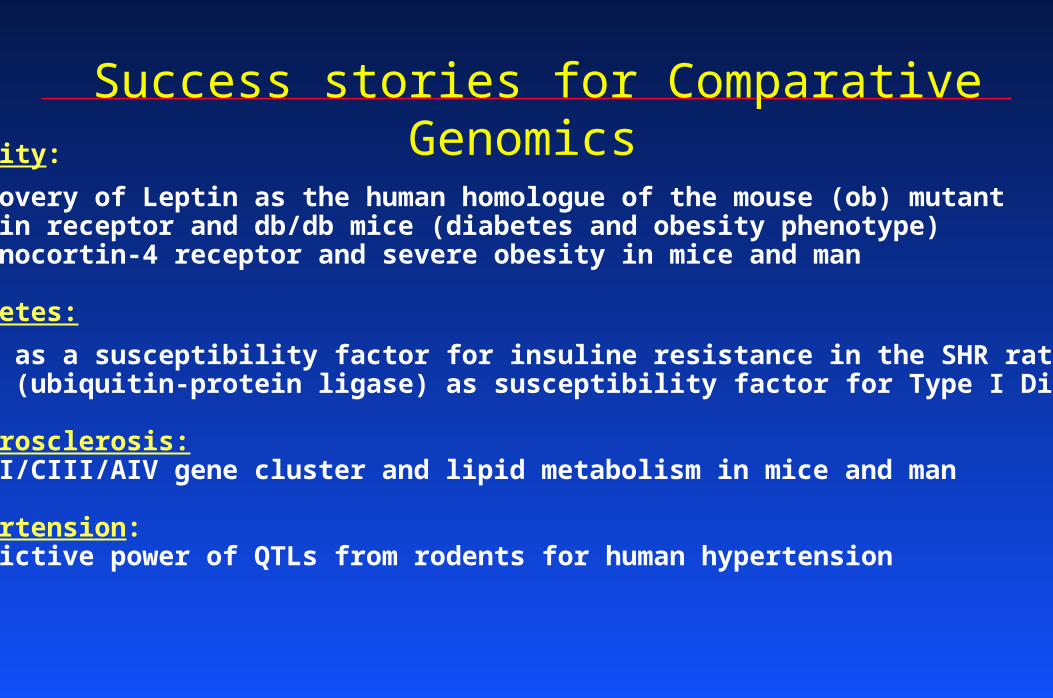
Success stories for Comparative Genomics Obesity:
Discovery of Leptin as the human homologue of the mouse (ob) mutantLeptin receptor and db/db mice (diabetes and obesity phenotype)Melanocortin-4 receptor and severe obesity in mice and man
Diabetes:
Cd36 as a susceptibility factor for insuline resistance in the SHR ratCblb (ubiquitin-protein ligase) as susceptibility factor for Type I Diabetes
Atherosclerosis:APOAI/CIII/AIV gene cluster and lipid metabolism in mice and man
Hypertension:Predictive power of QTLs from rodents for human hypertension
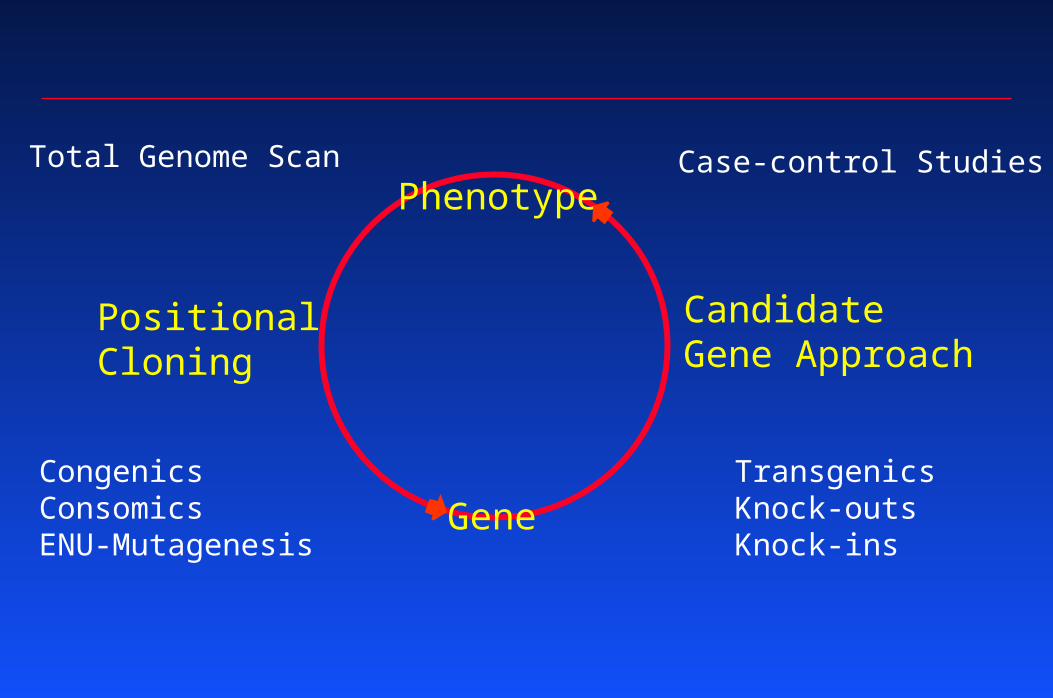
Phenotype
Gene
PositionalCloning
Candidate Gene Approach
TransgenicsKnock-outsKnock-ins
CongenicsConsomicsENU-Mutagenesis
Case-control StudiesTotal Genome Scan