Embed Size (px)
Citation preview
Phytochemical
analysis of plant
parts of
Pithecellobium dulce

55
3. PHYTOCHEMICAL ANALYSIS OF PLANT PARTS OF
PITHECELLOBIUM DULCE
3.1 Introduction
Various medicinal properties have been attributed to natural herbs. Medicinal
plants constitute the main source of new pharmaceuticals and health care products
(Ivanova et al., 2005). The history of plants being used for medicinal purpose is
probably as old as the history of mankind. Extraction and characterization of several
active phytocompounds from these green factories have given birth to some high
activity profile drugs (Mandal et al., 2007; Sukhdev et al ., 2008). A growing body of
evidence indicates that secondary plant metabolites play critical roles in human health
and may be nutritionally important (Hertog et al., 1993; Venkata et al, 2011).
Phytochemical screening of plants has revealed the presence of numerous chemicals
including alkaloids, tannins, flavonoids, steroids, glycosides, saponins. Many plant
extracts and phytochemicals show antioxidant free radical scavenging properties
(Larson, 1988 ; Nair et al., 2007; Vaghasiya et al., 2008). Secondary metabolites of
plants serve as defense mechanisms against predation by many microorganisms,
insects and herbivores (Lutterodt et al., 1999; Marjorie, 1999).
The phenolic compounds are one of the largest and most ubiquitous groups of
plant metabolites that possess an aromatic ring bearing one or more hydroxyl
constituents (Singh et al., 2010). Phenolic compounds are widely found in the
secondary products of medicinal plants, as well as in many edible plants (Hagerman et
al., 1998). A number of studies have focused on the biological activities of phenolic
compounds, which are potential antioxidants and free radical-scavengers (Rice-Evans
et al., 1995). Several studies have described the antioxidant properties of medicinal
56
plants, foods, and beverages which are rich in phenolic compounds. Flavonoids are a
broad class of plant phenolics that are known to possess a well established protective
ability against membrane lipo peroxidative damages (Sen et al., 2013). Plant products
have been part of phytomedicines since time immemorial. These can be derived from
any part of the plant like bark, leaves, flowers, roots, fruits, seeds. Any part of the
plant may contain active components. Knowledge of the chemical constituents of
plants is desirable because such information will be of value for the synthesis of
complex chemical substances. Such phytochemical screening of various plants is
reported by many workers. In the present work, qualitative and quantitative
phytochemical analysis was carried out in the leaf, fruit and fruit peel of
Pithecellobium dulce.
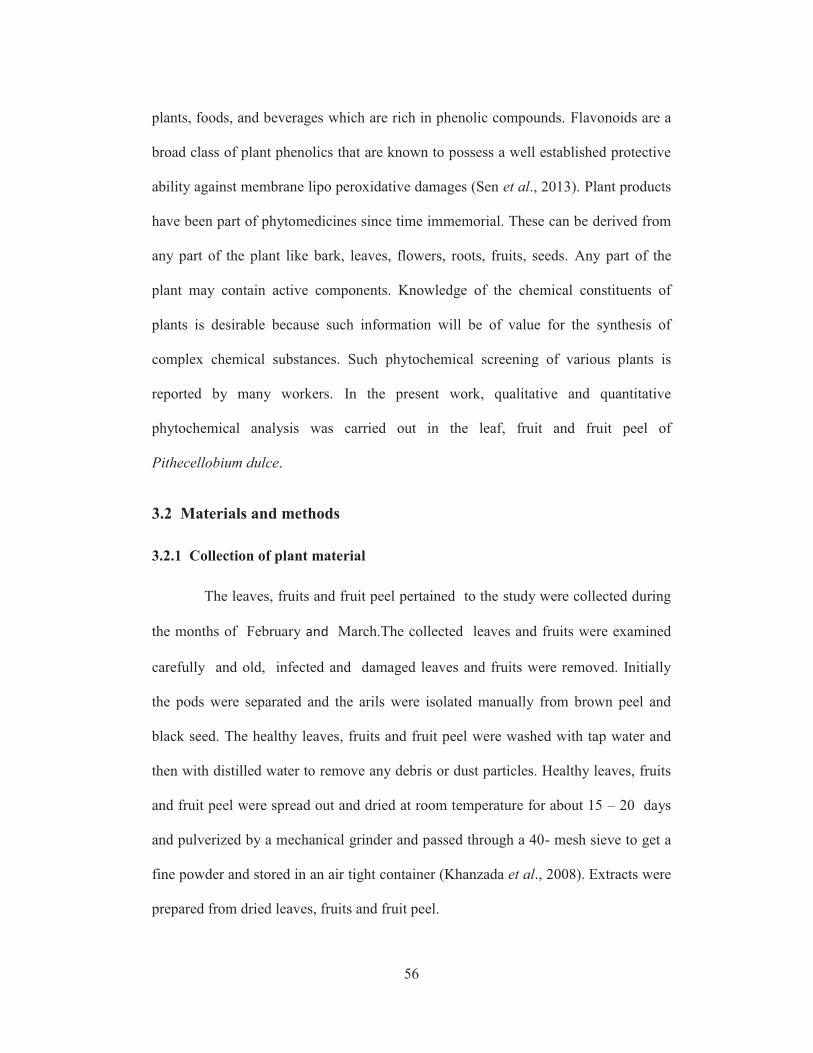
3.2 Materials and methods
3.2.1 Collection of plant material
The leaves, fruits and fruit peel pertained to the study were collected during
the months of February and March.The collected leaves and fruits were examined
carefully and old, infected and damaged leaves and fruits were removed. Initially
the pods were separated and the arils were isolated manually from brown peel and
black seed. The healthy leaves, fruits and fruit peel were washed with tap water and
then with distilled water to remove any debris or dust particles. Healthy leaves, fruits
and fruit peel were spread out and dried at room temperature for about 15 – 20 days
and pulverized by a mechanical grinder and passed through a 40- mesh sieve to get a
fine powder and stored in an air tight container (Khanzada et al., 2008). Extracts were
prepared from dried leaves, fruits and fruit peel.
57
3.2.2 Extract by Soxhlet method
Extraction involves the separation of medicinally active portions of plant from
the inactive or inert components by using selective solvents in standard extraction
procedures. The products obtained from plants are impure liquids, semisolids and
powders intended only for oral or external use. The purpose of standardized
extraction procedures from for crude drugs are to attain desired portion and to
eliminate the inert material by treatment with a selective solvent known as
menstruum. The extract thus obtained are ready for use as a medicinal agent in the
form of tinctures and fluid extracts and further processed to be incorporated in any
dosage form such as tablets or capsules. It is also fractionated to isolate individual
chemical entities. Standardization of extraction procedures contributes significantly to
the final quality of the herbal drug (Handa et al., 2008; Anees., 2009).
Pressurized liquid extraction was compared with Soxhlet extraction and it was
found pressurized liquid extraction was in good agreement with conventional Soxhlet
extraction method (Noorashikin and Marsin, 2009).Various solvents chloroform,
ethyl acetate, methanol, acetone were used in Soxhlet extraction and in most of the
extraction methanol extract showed maximum yield (Kulkarni et al., 2012). Polar
solvents are used frequently for the recovery of phenols from a plant matrix. The most
suitable of these solvents are hot or cold aqueous mixtures containing ethanol,
methanol, acetone, and ethyl acetate. The maximum phenolic compounds were
obtained from the mixtures of ethanol and acetone. In this method, the finely
ground crude drug was placed in a “thimble” of the Soxhlet apparatus. The powdered
extract was dissolved in appropriate solvent, depending on its compatibility the assay
procedure were used.
58
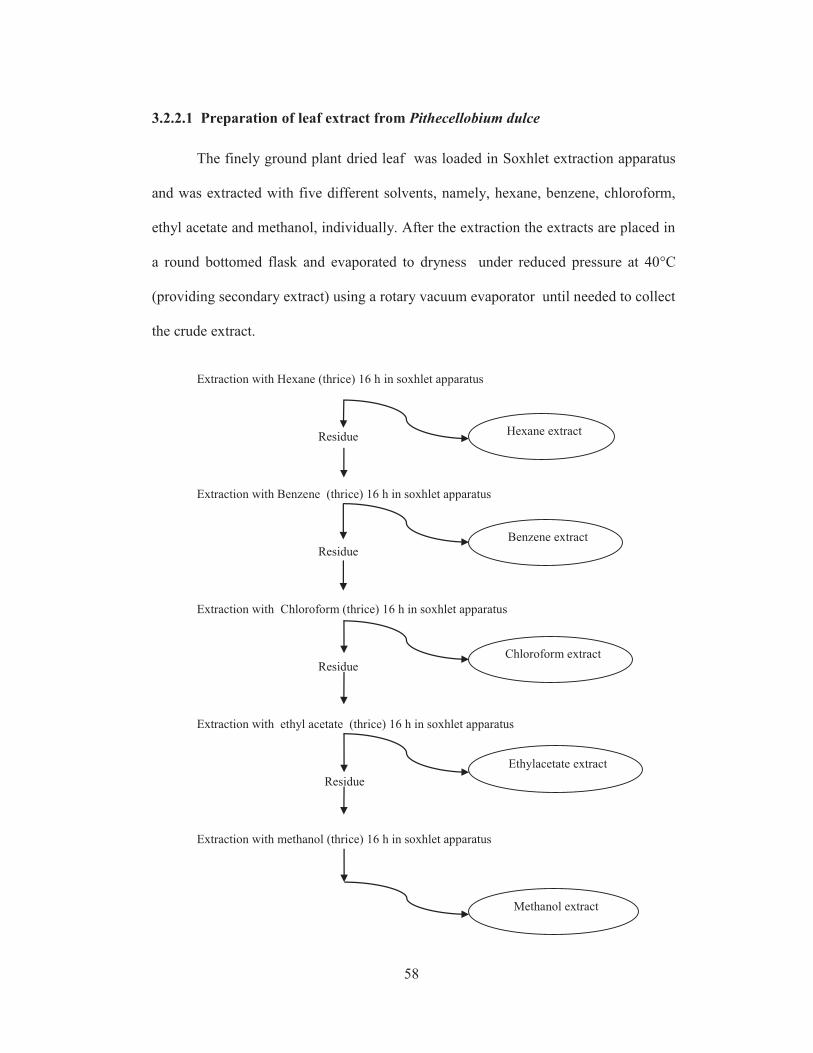
3.2.2.1 Preparation of leaf extract from Pithecellobium dulce
The finely ground plant dried leaf was loaded in Soxhlet extraction apparatus
and was extracted with five different solvents, namely, hexane, benzene, chloroform,
ethyl acetate and methanol, individually. After the extraction the extracts are placed in
a round bottomed flask and evaporated to dryness under reduced pressure at 40°C
(providing secondary extract) using a rotary vacuum evaporator until needed to collect
the crude extract.
Extraction with Hexane (thrice) 16 h in soxhlet apparatus
Residue
Extraction with Benzene (thrice) 16 h in soxhlet apparatus
Residue
Extraction with Chloroform (thrice) 16 h in soxhlet apparatus
Residue
Extraction with ethyl acetate (thrice) 16 h in soxhlet apparatus
Residue
Extraction with methanol (thrice) 16 h in soxhlet apparatus
Benzene extract
Chloroform extract
Ethylacetate extract
Methanol extract
Hexane extract
59
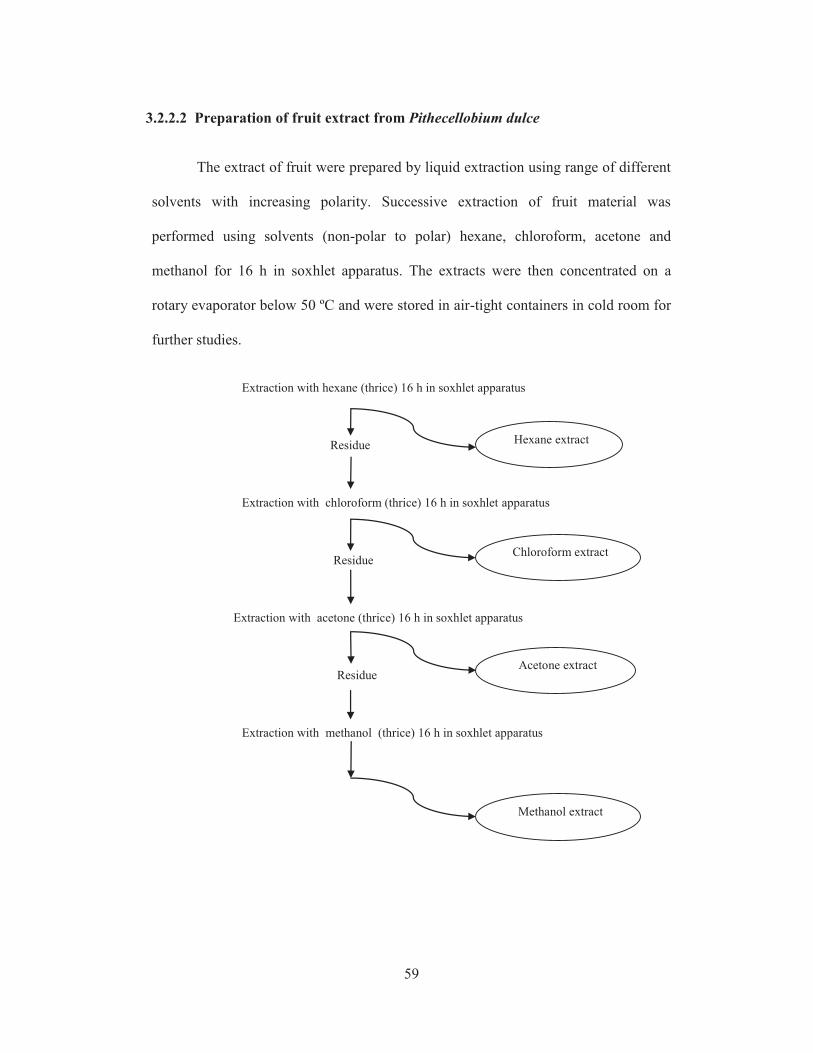
3.2.2.2 Preparation of fruit extract from Pithecellobium dulce
The extract of fruit were prepared by liquid extraction using range of different
solvents with increasing polarity. Successive extraction of fruit material was
performed using solvents (non-polar to polar) hexane, chloroform, acetone and
methanol for 16 h in soxhlet apparatus. The extracts were then concentrated on a
rotary evaporator below 50 ºC and were stored in air-tight containers in cold room for
further studies.
Extraction with hexane (thrice) 16 h in soxhlet apparatus
Residue
Extraction with chloroform (thrice) 16 h in soxhlet apparatus
Residue
Extraction with acetone (thrice) 16 h in soxhlet apparatus
Residue
Extraction with methanol (thrice) 16 h in soxhlet apparatus
Chloroform extract
Acetone extract
Methanol extract
Hexane extract
60
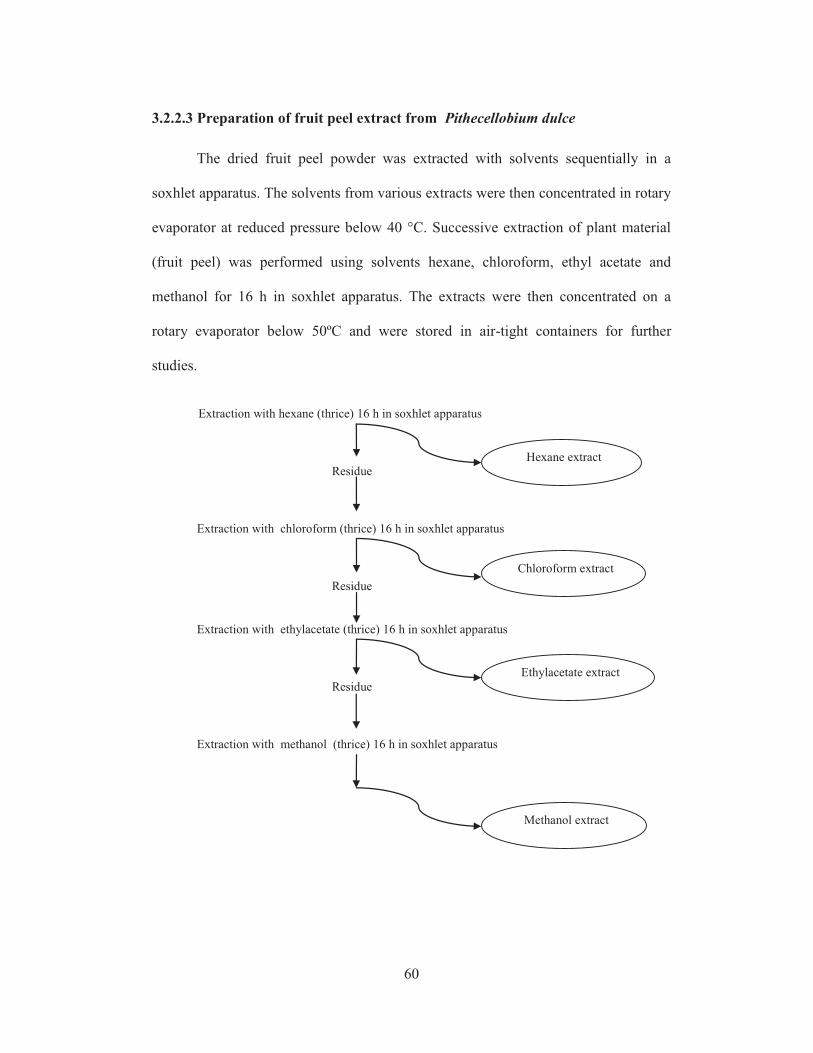
3.2.2.3 Preparation of fruit peel extract from Pithecellobium dulce
The dried fruit peel powder was extracted with solvents sequentially in a
soxhlet apparatus. The solvents from various extracts were then concentrated in rotary
evaporator at reduced pressure below 40 °C. Successive extraction of plant material
(fruit peel) was performed using solvents hexane, chloroform, ethyl acetate and
methanol for 16 h in soxhlet apparatus. The extracts were then concentrated on a
rotary evaporator below 50ºC and were stored in air-tight containers for further
studies.
Extraction with hexane (thrice) 16 h in soxhlet apparatus
Residue
Extraction with chloroform (thrice) 16 h in soxhlet apparatus
Residue
Extraction with ethylacetate (thrice) 16 h in soxhlet apparatus
Residue
Extraction with methanol (thrice) 16 h in soxhlet apparatus
Chloroform extract
Ethylacetate extract
Hexane extract
Methanol extract
61
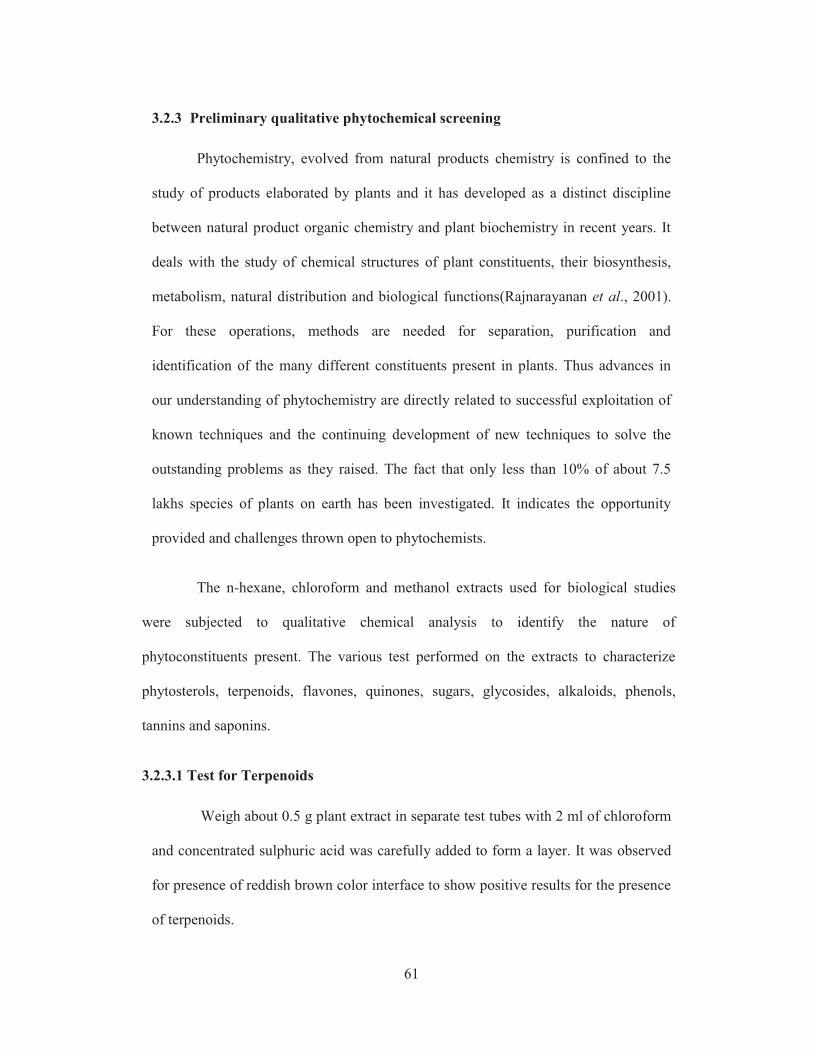
3.2.3 Preliminary qualitative phytochemical screening
Phytochemistry, evolved from natural products chemistry is confined to the
study of products elaborated by plants and it has developed as a distinct discipline
between natural product organic chemistry and plant biochemistry in recent years. It
deals with the study of chemical structures of plant constituents, their biosynthesis,
metabolism, natural distribution and biological functions(Rajnarayanan et al., 2001).
For these operations, methods are needed for separation, purification and
identification of the many different constituents present in plants. Thus advances in
our understanding of phytochemistry are directly related to successful exploitation of
known techniques and the continuing development of new techniques to solve the
outstanding problems as they raised. The fact that only less than 10% of about 7.5
lakhs species of plants on earth has been investigated. It indicates the opportunity
provided and challenges thrown open to phytochemists.
The n-hexane, chloroform and methanol extracts used for biological studies
were subjected to qualitative chemical analysis to identify the nature of
phytoconstituents present. The various test performed on the extracts to characterize
phytosterols, terpenoids, flavones, quinones, sugars, glycosides, alkaloids, phenols,
tannins and saponins.
3.2.3.1 Test for Terpenoids
Weigh about 0.5 g plant extract in separate test tubes with 2 ml of chloroform
and concentrated sulphuric acid was carefully added to form a layer. It was observed
for presence of reddish brown color interface to show positive results for the presence
of terpenoids.
62
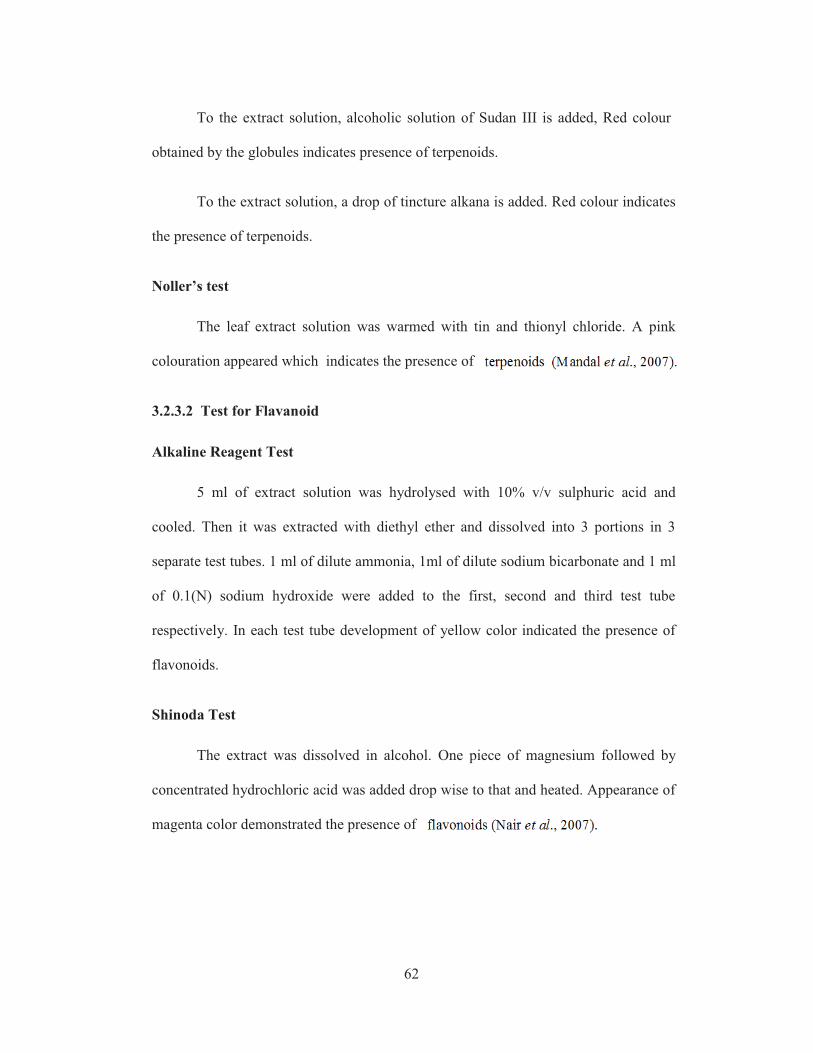
To the extract solution, alcoholic solution of Sudan III is added, Red colour
obtained by the globules indicates presence of terpenoids.
To the extract solution, a drop of tincture alkana is added. Red colour indicates
the presence of terpenoids.
Noller’s test
The leaf extract solution was warmed with tin and thionyl chloride. A pink
colouration appeared which indicates the presence of terpenoids.
3.2.3.2 Test for Flavanoid
Alkaline Reagent Test
5 ml of extract solution was hydrolysed with 10% v/v sulphuric acid and
cooled. Then it was extracted with diethyl ether and dissolved into 3 portions in 3
separate test tubes. 1 ml of dilute ammonia, 1ml of dilute sodium bicarbonate and 1 ml
of 0.1(N) sodium hydroxide were added to the first, second and third test tube
respectively. In each test tube development of yellow color indicated the presence of
flavonoids.
Shinoda Test
The extract was dissolved in alcohol. One piece of magnesium followed by
concentrated hydrochloric acid was added drop wise to that and heated. Appearance of
magenta color demonstrated the presence of flavonoids.
63
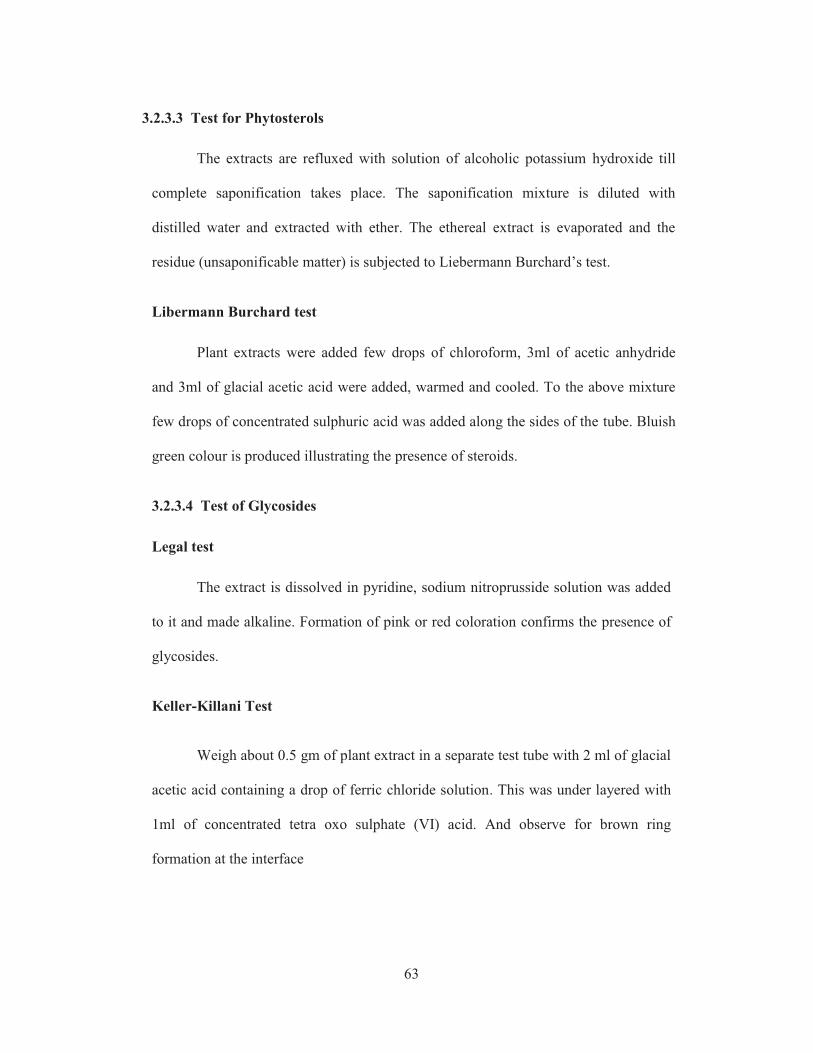
3.2.3.3 Test for Phytosterols
The extracts are refluxed with solution of alcoholic potassium hydroxide till
complete saponification takes place. The saponification mixture is diluted with
distilled water and extracted with ether. The ethereal extract is evaporated and the
residue (unsaponificable matter) is subjected to Liebermann Burchard’s test.
Libermann Burchard test
Plant extracts were added few drops of chloroform, 3ml of acetic anhydride
and 3ml of glacial acetic acid were added, warmed and cooled. To the above mixture
few drops of concentrated sulphuric acid was added along the sides of the tube. Bluish
green colour is produced illustrating the presence of steroids.
3.2.3.4 Test of Glycosides
Legal test
The extract is dissolved in pyridine, sodium nitroprusside solution was added
to it and made alkaline. Formation of pink or red coloration confirms the presence of
glycosides.
Keller-Killani Test
Weigh about 0.5 gm of plant extract in a separate test tube with 2 ml of glacial
acetic acid containing a drop of ferric chloride solution. This was under layered with
1ml of concentrated tetra oxo sulphate (VI) acid. And observe for brown ring
formation at the interface
64
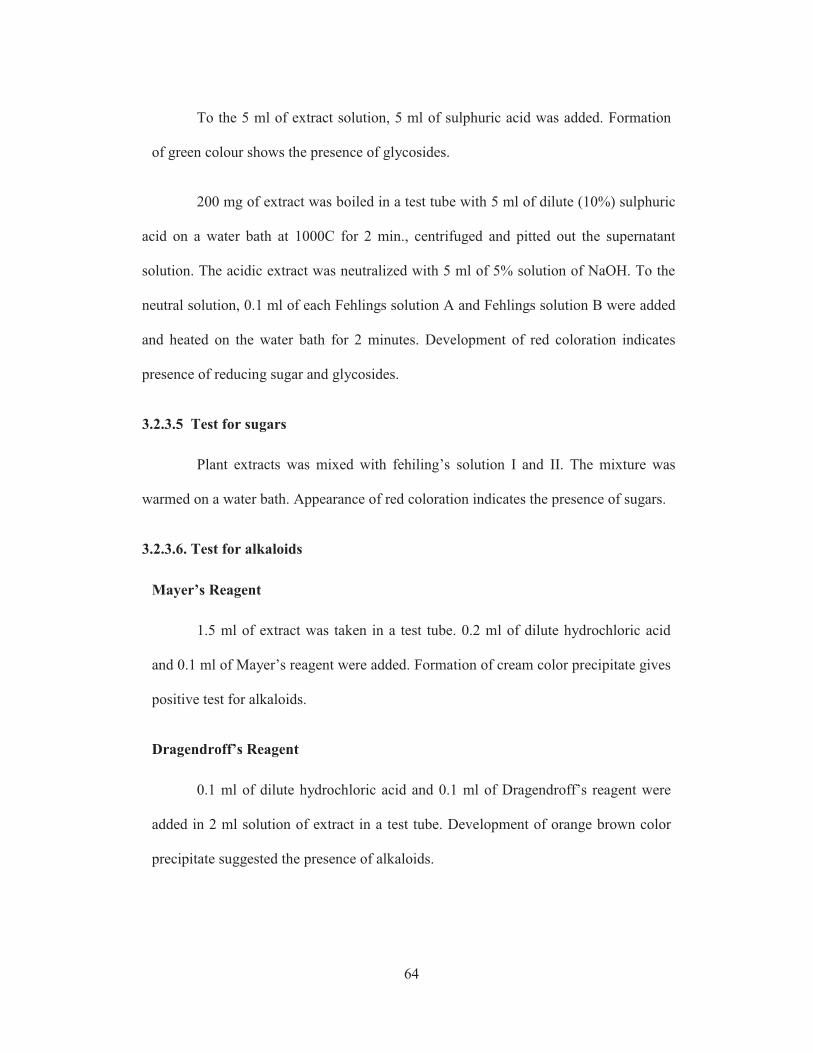
To the 5 ml of extract solution, 5 ml of sulphuric acid was added. Formation
of green colour shows the presence of glycosides.
200 mg of extract was boiled in a test tube with 5 ml of dilute (10%) sulphuric
acid on a water bath at 1000C for 2 min., centrifuged and pitted out the supernatant
solution. The acidic extract was neutralized with 5 ml of 5% solution of NaOH. To the
neutral solution, 0.1 ml of each Fehlings solution A and Fehlings solution B were added
and heated on the water bath for 2 minutes. Development of red coloration indicates
presence of reducing sugar and glycosides.
3.2.3.5 Test for sugars
Plant extracts was mixed with fehiling’s solution I and II. The mixture was
warmed on a water bath. Appearance of red coloration indicates the presence of sugars.
3.2.3.6. Test for alkaloids
Mayer’s Reagent
1.5 ml of extract was taken in a test tube. 0.2 ml of dilute hydrochloric acid
and 0.1 ml of Mayer’s reagent were added. Formation of cream color precipitate gives
positive test for alkaloids.
Dragendroff’s Reagent
0.1 ml of dilute hydrochloric acid and 0.1 ml of Dragendroff’s reagent were
added in 2 ml solution of extract in a test tube. Development of orange brown color
precipitate suggested the presence of alkaloids.
65
Wagner’s Reagent
2 ml of extract solution was treated with dilute hydrochloric acid and 0.1 ml of
Wagner’s reagent. Formation of reddish brown precipitate indicated the positive
response for alkaloids.
Hager’s Reagent
2 ml of extract was allowed to react with 0.2 ml of dilute hydrochloric acid and
0.1 ml Hager’s reagent. Yellowish precipitate suggested the presence of alkaloids
3.2.3.7 Test for quinones
The plant extracts of Pithecellobium dulce, sodium hydroxide solution was
added. Bluish green or red coloration is produced. Presence of quinones was
confirmed.
3.2.3.8 Test for phenols
To the plant extracts few drops of alcohol and ferric chloride were added.
Bluish green or red coloration is obtained. It indicates the presence of phenolic
compounds.
3.2.3.9 Test for tannins
Ferric chloride Test
5 ml of extract solution was allowed to heat with 1 ml of 5% Ferric chloride
solution. Greenish black coloration indicated the presence of tannins.
66
Gelatin Test
To the extract solution, 1% gelatin solution containing 10% sodium chloride
was added. Formation of a white colored precipitate confirmed the presence of tannins.
Lead acetate Test
5 ml of extract solution was treated with 1 ml of 10% lead acetate solution in
water. Yellow colored precipitation gave the test for tannins.
3.2.3.10 Test for saponins
Forth Formation Test
1 ml of extract solution was diluted with distilled water to 20 ml and shaken in
a graduated cylinder for 15 minutes. Development of stable foam suggested the
presence of saponins.
Lead acetate Test
1 ml of extract solution was treated with 1% lead acetate solution. Formation of
white precipitate indicated the presence of saponins.
3.2.3.11 Test for Carbohydrates
Fehling’s solution test
To 5 ml of extract solution, mixed with 5 ml of Fehling’s solution was boiled
for 5 minutes. Formation of brick red colored precipitate demonstrated the positive
test for reducing sugar.
67
Benedict’s test
To 5 ml of the extract solution, 5 ml of Benedict’s solution was added in a test
tube and boiled for few minutes. Brick red precipitate was developed confirm the
presence of carbohydrates.
Molisch’s test
To 5 ml of the extract solution, 5 ml of of α-napthol was added in a test tube
and concentrated sulphuric acid solution was gently poured into the test tube.
Appearance of purple coloured ring below the aqueous solution confirms the presence
of carbohydrates.
Test for Pentose
To a few ml of extract solution, concentrated hydrochloric acid and
phloroglucinol (1:1) were added and heated. Red coloration confirms the presence of
pentose.
Test for Proteins
Millon’s reagent test
Small quantities of the extracts are dissolved in a few ml of water in a test tube
and 2 ml of Millon’s reagent was added to the test tube and then warmed. Formation of
red colouration shows the presence of proteins or polypeptides.
3.2.4 Quantitative phytochemical screening
The term "quantitative analysis" is often used in comparison with "qualitative
analysis", which seeks information about the identity or form of substance present.
68
Once the presence of certain substances in a sample is known, the study of their
absolute or relative abundance can help in determining specific properties.
Quantitative analysis refers to the determination of how much of a given component is
present in a sample. In the present investigation different components,
protein,carbohydrate, total flavanoids,total phenols were determined.
3.2.4.1 Estimation of protein content by Kjeldahl method
Principle
Protein is precipitated from the plant extract of Pithecellobium dulce by
treating 12% trichloroacetic acid solution. Precipitation was carried out in Kjeldahl
flask or tube. The 12% trichloroacetic acid solution contains non protein nitrogen
components of the crude leaf extract, was separated from protein precipitate by
filteration. Nitrogen content of protein precipitate was determined by treating the
mixture of dipotassium sulphate, copper sulphate and selenium and acidified with
sulphuric acid. The excess acid was titrated with sodium hydroxide (0.01M) using
methylred as indicator. The result was compared with that of standard.
Procedure
About 10mg of the crude leaf powder of Pithecellobium dulce was extracted
in 50ml of water. The filterate was added with 40 ml of 12% trichloroacetic acid
solution. The mixture was poured in to Kjeldahl flask. The protein is precipitated after
5minutes. The mixture was filtered through Whatmann filter paper No. 1 and filtrate
is collected. The precipitate is again washed with 12% trichloroacetic acid in the
Kjeldhal flask with the aid of pump dispenser and filter it. Collect the remaining
filtrate. Drop the precipitate in Kjeldhal flask and boiling chips of dipotassium
69
sulphate, copper sulphate and selenium was added. The whole mixture acidified with
5ml of sulphuric acid, allowing it to run down the sides of the flask and contents are
mixed by rotation. Heat the flask gradually, until the mixture is vigorously boiled. The
flask was cooled and distilled. The resultant distillate was titrated with 0.01M of
sodium hydroxide using methyl red as indicator. (N1ml of 0.01M sodium hydroxide).
The obtained titre value was compared with the titre value of standard glucose
solution.
Content of nitrogen was determined using the formula
Percentage content of nitrogen: (0.01401 (N2-N1) / M) x 100
Where
N2 – Volume of 0.01M sodium hydroxide consumed in glucose sample.
N1 – Volume of 0.01M sodium hydroxide consumed in crude drug sample.
M - Amount of crude drug taken
Percentage of protein content: % of nitrogen content X6.25 = Protein
3.2.4.2 Estimation of carbohydrate content by gravimetric method
25ml of the fehiling’s solution (alkaline cupric tartarate) was added in to a
400ml beaker. 50ml of the plant extract of Pithecellobium dulce was added and
diluted with water to bring a total volume of 100ml.The beaker was covered with a
watch glass and placed over a burner to boil exactly 4 minutes. The mixture was
filtered immediately through a gooch crucible prepared with acid and alkaline
digested asbestos. The precipitated cuprous oxide in the crucible was thoroughly
washed. The precipitate was dried at 105oC. Blank determination was performed to
70
make any necessary correction. The corrected weight of the precipitate is compared
with dextrose of known concentration.
Percentage of carbohydrate content: (Sample weight/ Standard weight) X 100
3.2.4.3 Estimation of total lipids by Folch’s method
About 30g of crude powder of Pithecellobium dulce were macerated with
100parts (w/w) of isopropanol. The mixture was flitered. The solid was again
extracted with 200 parts of chloroform/ isopropanol mixture (1:1v/v). The combined
filtrates was evaporated and dissolved in a small volume of chloroform/methanol
(2:1). The extracted mixture was added with 4g of anhydrous sodium sulphate, 0.1ml
Butylated Hydroxy toluene and celite 545. The mixture is homogenized and poured
in to a chromatographic column packed with celite. Total lipids were eluted with
dichoromethane/methanol (9:1). The total eluate was distilled off and residue was
dried in vacuo to constant weight (W Gms)
Percentage of total lipids content: 100/30 X W
3.2.4.4 Estimation of total content of alkaloids
The total alkaloid content was determined according to UVSpectrophotometer
method. This method is based on the reaction between alkaloid and bromocresol
green. The part of theplant extract was dissolved in 2 N HCl and then filtered. 1 ml of
this solution was transferred to separatory funnel and washed with10 ml chloroform
The pH of phosphate buffer solution was adjusted to neutral with 0.1 N NaOH. One
ml of this solution was transferred to a separating funnel and then 5 ml of
bromocresol solution along with 5 ml of phosphate buffer were added. The mixture
71
was shaken and the complex formed was fractioned with chloroform by vigorous
shaking. The fractions were collected in a 10 ml volumetric flask and diluted to
volume with chloroform. The absorbance of the complex in chloroform was measured
at 470 nm.
3.2.4.5 Estimation of total flavonoid content
Aluminium chloride colorimetric method with some modifications was used to
determine flavonoid content. Plant extract (1ml) in methanol was mixed with 1ml of
methanol, 0.5 ml aluminium chloride (1.2 %) and 0.5 ml potassium acetate (120 mm).
The mixture was allowed to stand for 30 min at room temperature; then the
absorbance was measured at 415 nm. quercetin was used as standard. Flavonoid
content is expressed in terms of quercetin equivalent.
3.2.4.6 Estimation of total phenol content
Total phenolic content of the extracts was determined by Folin Ciocalteu
reagent method with some modifications. Plant extract (1 ml) was mixed with
Ciocalteu reagent (0.1 ml, 1 N), and allowed to stand for 15 min. Then 5 ml of
saturated Na2CO3 was added. The mixtures were allowed to stand for 30 min at room
temperature and the total phenols were determined spectrophotometrically at 760 nm.
Gallic acid was used as a standard. Total phenol values are expressed in terms of
gallic acid equivalent
3.2.4.7 Estimation of saponin content
Crude powder (20 g) was put into a conical flask and 100 ml of 20% aqueous
ethanol was added. The samples were heated over a hot water bath for 4 h with
72
continuous stirring at about 55°C. The mixture was filtered and the residue was
extracted with another 200 ml of 20% ethanol. The extract was reduced to 40 ml over
water bath at about 90 °C. The concentrate was transferred into 250 ml separating
funnel, 20 ml of diethyl ether was added and the mixture was shaken vigorously. The
aqueous layer was recovered while the ether layer was discarded. The purification
process was repeated. 60 ml of n-butanol was then added. The combined n-butanol
extracts were washed twice with 10 ml of 5% aqueous sodium chloride. The
remaining solution was heated in a water bath. After evaporation, the samples were
dried in the oven to constant weight and the saponin content was calculated.
3.2.5 Statistical analysis
All the values are expressed as means ± SD (n = 3). Significant differences
between the groups were determined with SPSS 17.0 software (using one-way
analysis of variance (ANOVA) and the group means were compared. A difference
was considered significant at the p < 0.05 level.
3.3 Results and Discussion
3.3.1 Preliminary qualitative phytochemical screening
In recent years, secondary plant metabolites (phytochemicals) with bioactive
constituent have been actively investigated as alternatives to and or in combination
with antibiotics in the therapy of biological infections. The preliminary qualitative
phytochemical screening of the crude powder of plant leaf, fruit and fruit peel was
done to assess the presence of bioactive components. The presence of alkaloids
terpenoids, flavonoids, polysterols, glycosides, sugars, alkaloid, quinone, phenol,
73
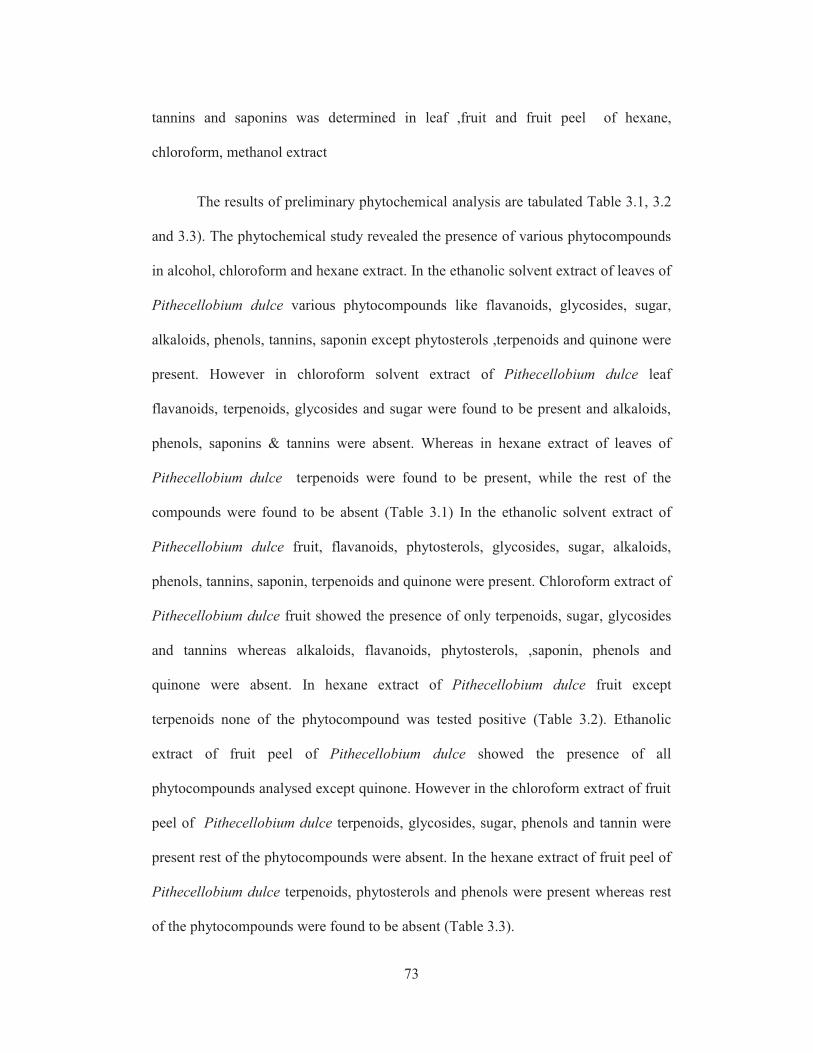
tannins and saponins was determined in leaf ,fruit and fruit peel of hexane,
chloroform, methanol extract
The results of preliminary phytochemical analysis are tabulated Table 3.1, 3.2
and 3.3). The phytochemical study revealed the presence of various phytocompounds
in alcohol, chloroform and hexane extract. In the ethanolic solvent extract of leaves of
Pithecellobium dulce various phytocompounds like flavanoids, glycosides, sugar,
alkaloids, phenols, tannins, saponin except phytosterols ,terpenoids and quinone were
present. However in chloroform solvent extract of Pithecellobium dulce leaf
flavanoids, terpenoids, glycosides and sugar were found to be present and alkaloids,
phenols, saponins & tannins were absent. Whereas in hexane extract of leaves of
Pithecellobium dulce terpenoids were found to be present, while the rest of the
compounds were found to be absent (Table 3.1) In the ethanolic solvent extract of
Pithecellobium dulce fruit, flavanoids, phytosterols, glycosides, sugar, alkaloids,
phenols, tannins, saponin, terpenoids and quinone were present. Chloroform extract of
Pithecellobium dulce fruit showed the presence of only terpenoids, sugar, glycosides
and tannins whereas alkaloids, flavanoids, phytosterols, ,saponin, phenols and
quinone were absent. In hexane extract of Pithecellobium dulce fruit except
terpenoids none of the phytocompound was tested positive (Table 3.2). Ethanolic
extract of fruit peel of Pithecellobium dulce showed the presence of all
phytocompounds analysed except quinone. However in the chloroform extract of fruit
peel of Pithecellobium dulce terpenoids, glycosides, sugar, phenols and tannin were
present rest of the phytocompounds were absent. In the hexane extract of fruit peel of
Pithecellobium dulce terpenoids, phytosterols and phenols were present whereas rest
of the phytocompounds were found to be absent (Table 3.3).
74
The results obtained in the qualitative chemical analysis performed in the
various parts like leaf, fruit and fruit peel of Pithecellobium dulce shows the presence
of phytoconstituent based on the polarity. Glycosides and flavanoids are significantly
present both in chloroform and alcoholic extracts; alkaloids, tannins were identified in
alcoholic extract. This indication validate the presence of variety of secondary
metabolites in the plant which may responsible for the wide spectrum of biological
activity (Jacques and Cassidy, 2013).
3.3.2 Quantitative phytochemical screening
Biological properties of various extracts from many plants have recently been
of great interest in both research and the food industry, because their possible use as
natural additives emerged from a growing tendency to replace synthetic drugs with
natural ones. The results of total protein, carbohydrates, lipids, total alkaloid, saponin,
phenol flavanoid content were represented in Table (3.4 and 3.5).
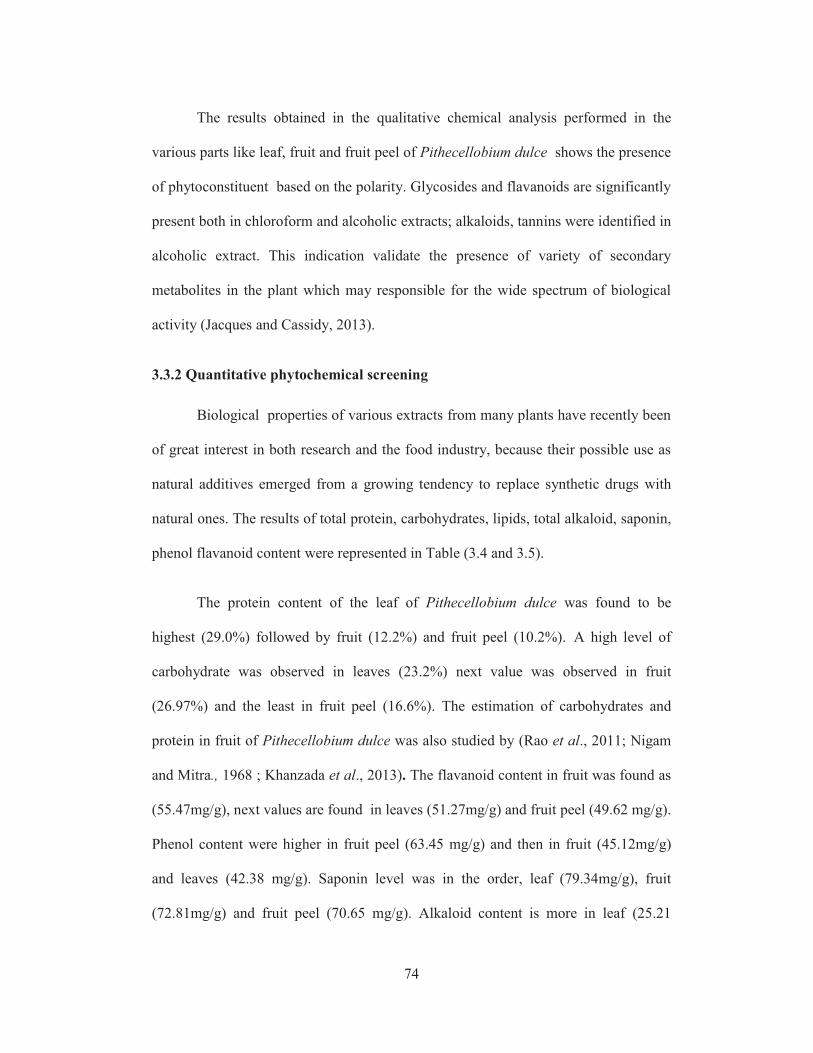
The protein content of the leaf of Pithecellobium dulce was found to be
highest (29.0%) followed by fruit (12.2%) and fruit peel (10.2%). A high level of
carbohydrate was observed in leaves (23.2%) next value was observed in fruit
(26.97%) and the least in fruit peel (16.6%). The estimation of carbohydrates and
protein in fruit of Pithecellobium dulce was also studied by (Rao et al., 2011; Nigam
and Mitra., 1968 ; Khanzada et al., 2013). The flavanoid content in fruit was found as
(55.47mg/g), next values are found in leaves (51.27mg/g) and fruit peel (49.62 mg/g).
Phenol content were higher in fruit peel (63.45 mg/g) and then in fruit (45.12mg/g)
and leaves (42.38 mg/g). Saponin level was in the order, leaf (79.34mg/g), fruit
(72.81mg/g) and fruit peel (70.65 mg/g). Alkaloid content is more in leaf (25.21
75
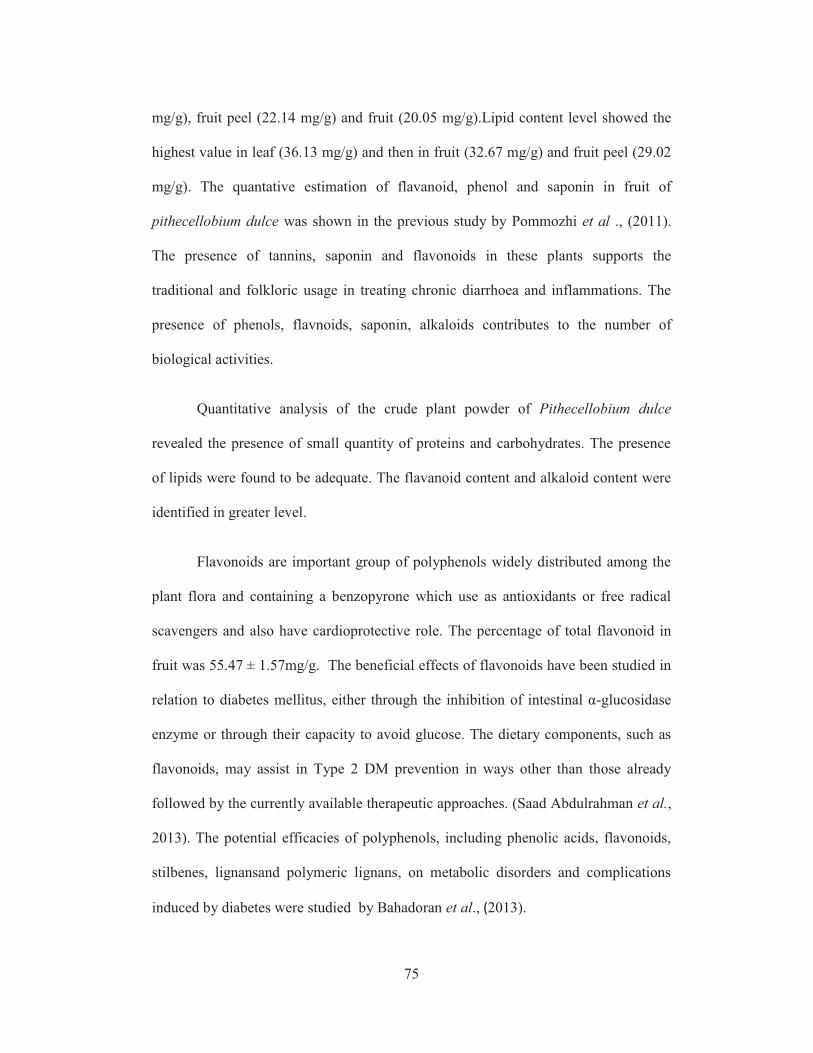
mg/g), fruit peel (22.14 mg/g) and fruit (20.05 mg/g).Lipid content level showed the
highest value in leaf (36.13 mg/g) and then in fruit (32.67 mg/g) and fruit peel (29.02
mg/g). The quantative estimation of flavanoid, phenol and saponin in fruit of
pithecellobium dulce was shown in the previous study by Pommozhi et al ., (2011).
The presence of tannins, saponin and flavonoids in these plants supports the
traditional and folkloric usage in treating chronic diarrhoea and inflammations. The
presence of phenols, flavnoids, saponin, alkaloids contributes to the number of
biological activities.
Quantitative analysis of the crude plant powder of Pithecellobium dulce
revealed the presence of small quantity of proteins and carbohydrates. The presence
of lipids were found to be adequate. The flavanoid content and alkaloid content were
identified in greater level.
Flavonoids are important group of polyphenols widely distributed among the
plant flora and containing a benzopyrone which use as antioxidants or free radical
scavengers and also have cardioprotective role. The percentage of total flavonoid in
fruit was 55.47 ± 1.57mg/g. The beneficial effects of flavonoids have been studied in
relation to diabetes mellitus, either through the inhibition of intestinal α-glucosidase
enzyme or through their capacity to avoid glucose. The dietary components, such as
flavonoids, may assist in Type 2 DM prevention in ways other than those already
followed by the currently available therapeutic approaches. (Saad Abdulrahman et al.,
2013). The potential efficacies of polyphenols, including phenolic acids, flavonoids,
stilbenes, lignansand polymeric lignans, on metabolic disorders and complications
induced by diabetes were studied by Bahadoran et al., (2013).
76
Phenolic compound has enormous ability to combat cancer and are also
thought to prevent heart ailments to an appreciable degree and sometimes are
antiinflammatory agents (Bravo, 1998; Brower,1998).They are potent vasodilator and
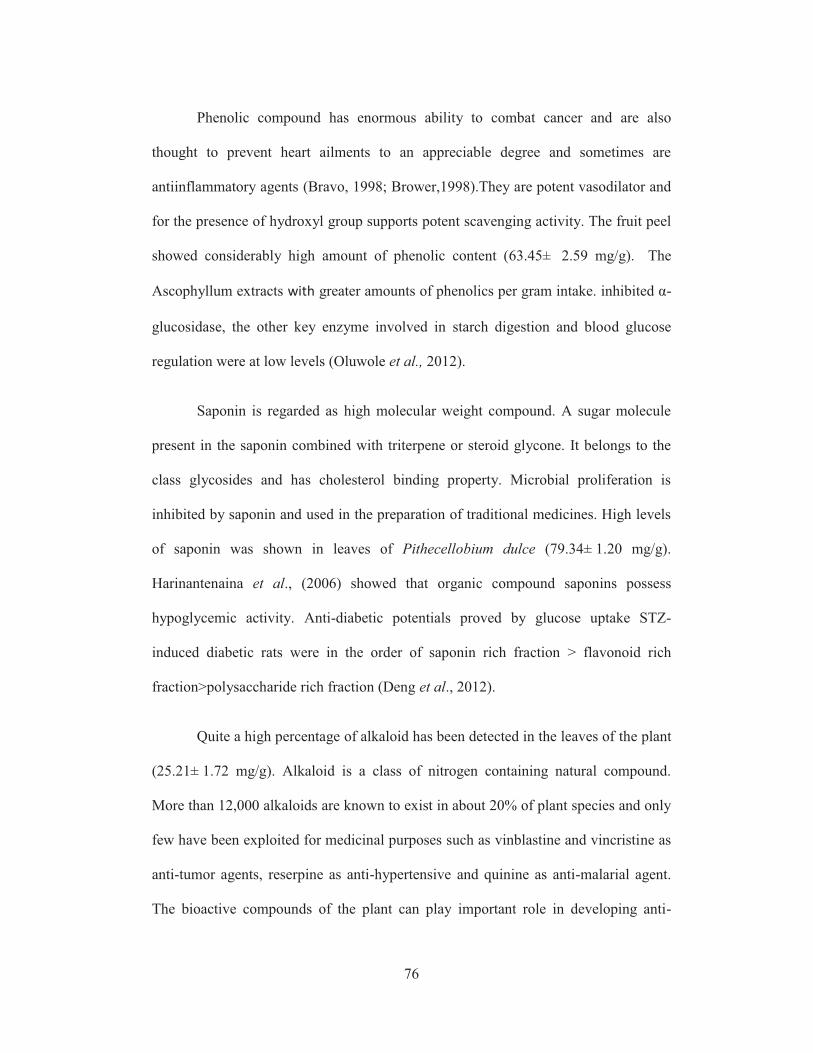
for the presence of hydroxyl group supports potent scavenging activity. The fruit peel
showed considerably high amount of phenolic content (63.45± 2.59 mg/g). The
Ascophyllum extracts with greater amounts of phenolics per gram intake. inhibited α-
glucosidase, the other key enzyme involved in starch digestion and blood glucose
regulation were at low levels (Oluwole et al., 2012).
Saponin is regarded as high molecular weight compound. A sugar molecule
present in the saponin combined with triterpene or steroid glycone. It belongs to the
class glycosides and has cholesterol binding property. Microbial proliferation is
inhibited by saponin and used in the preparation of traditional medicines. High levels
of saponin was shown in leaves of Pithecellobium dulce (79.34± 1.20 mg/g).
Harinantenaina et al., (2006) showed that organic compound saponins possess
hypoglycemic activity. Anti-diabetic potentials proved by glucose uptake STZ-
induced diabetic rats were in the order of saponin rich fraction > flavonoid rich
fraction>polysaccharide rich fraction (Deng et al., 2012).
Quite a high percentage of alkaloid has been detected in the leaves of the plant
(25.21± 1.72 mg/g). Alkaloid is a class of nitrogen containing natural compound.
More than 12,000 alkaloids are known to exist in about 20% of plant species and only
few have been exploited for medicinal purposes such as vinblastine and vincristine as
anti-tumor agents, reserpine as anti-hypertensive and quinine as anti-malarial agent.
The bioactive compounds of the plant can play important role in developing anti-
77
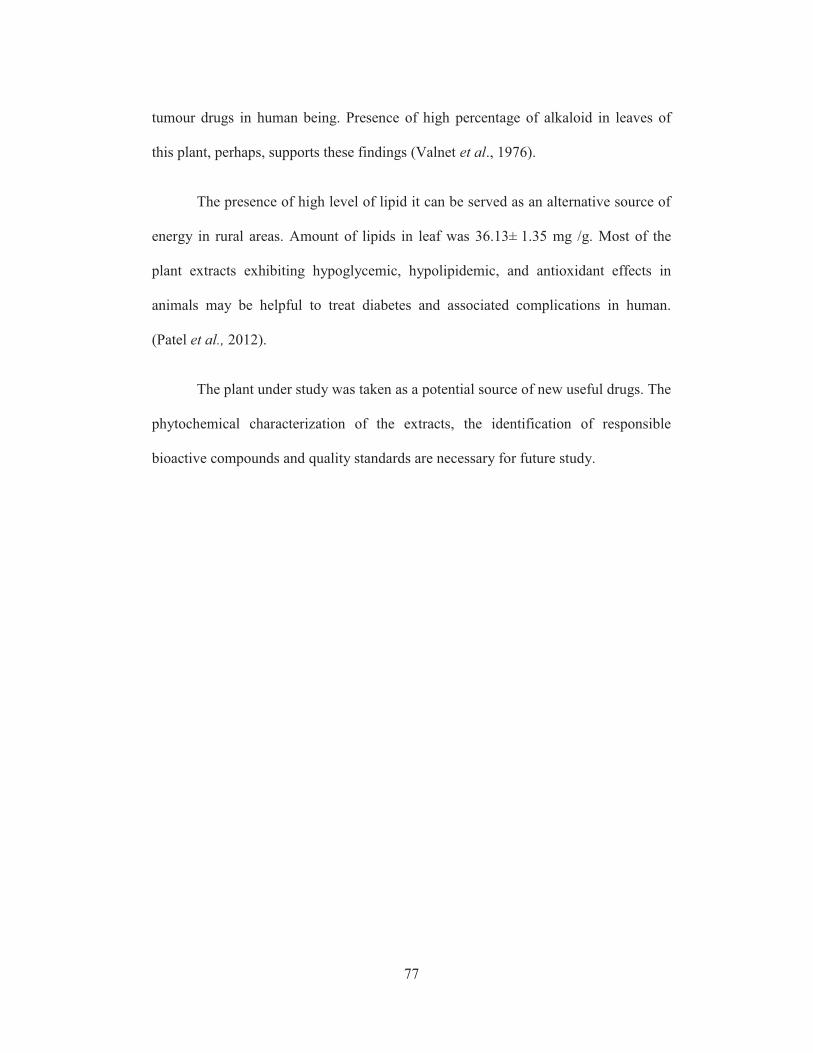
tumour drugs in human being. Presence of high percentage of alkaloid in leaves of
this plant, perhaps, supports these findings (Valnet et al., 1976).
The presence of high level of lipid it can be served as an alternative source of
energy in rural areas. Amount of lipids in leaf was 36.13± 1.35 mg /g. Most of the
plant extracts exhibiting hypoglycemic, hypolipidemic, and antioxidant effects in
animals may be helpful to treat diabetes and associated complications in human.
(Patel et al., 2012).
The plant under study was taken as a potential source of new useful drugs. The
phytochemical characterization of the extracts, the identification of responsible
bioactive compounds and quality standards are necessary for future study.
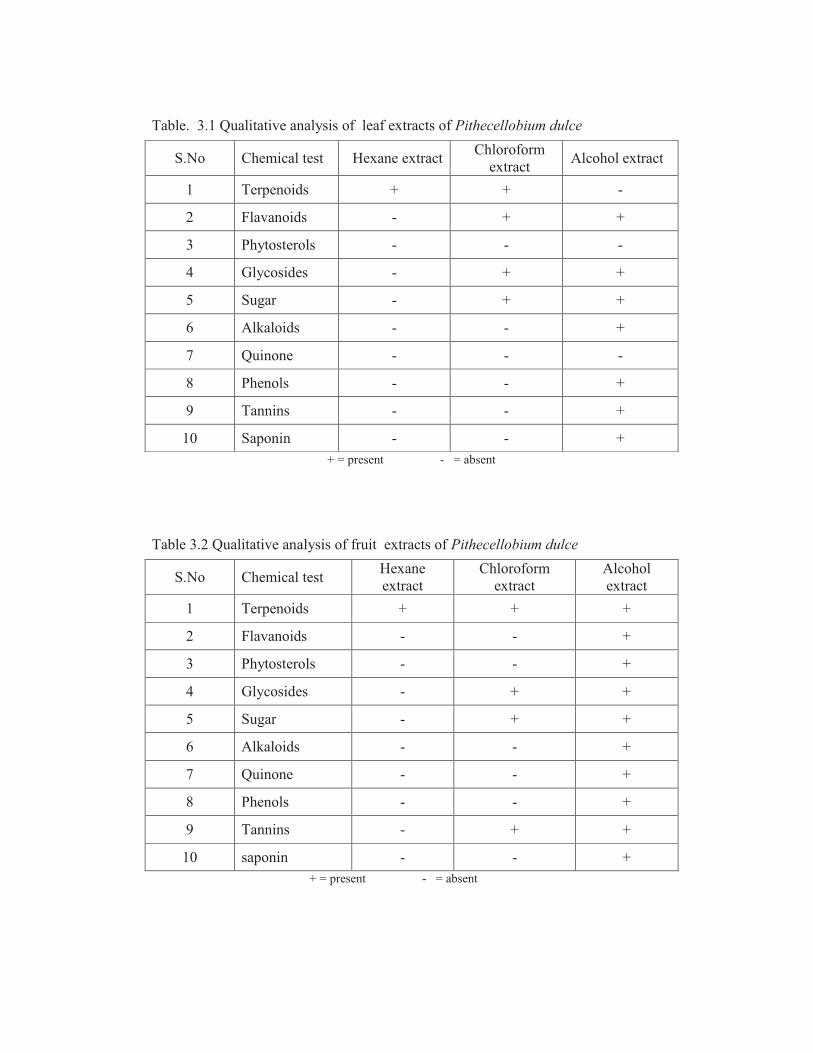
Table. 3.1 Qualitative analysis of leaf extracts of Pithecellobium dulce
+ = present - = absent
Table 3.2 Qualitative analysis of fruit extracts of Pithecellobium dulce
+ = present - = absent
S.No Chemical test Hexane extract Chloroform
extract Alcohol extract
1 Terpenoids + + -
2 Flavanoids - + +
3 Phytosterols - - -
4 Glycosides - + +
5 Sugar - + +
6 Alkaloids - - +
7 Quinone - - -
8 Phenols - - +
9 Tannins - - +
10 Saponin - - +
S.No Chemical test Hexane
extract
Chloroform
extract
Alcohol
extract
1 Terpenoids + + +
2 Flavanoids - - +
3 Phytosterols - - +
4 Glycosides - + +
5 Sugar - + +
6 Alkaloids - - +
7 Quinone - - +
8 Phenols - - +
9 Tannins - + +
10 saponin - - +
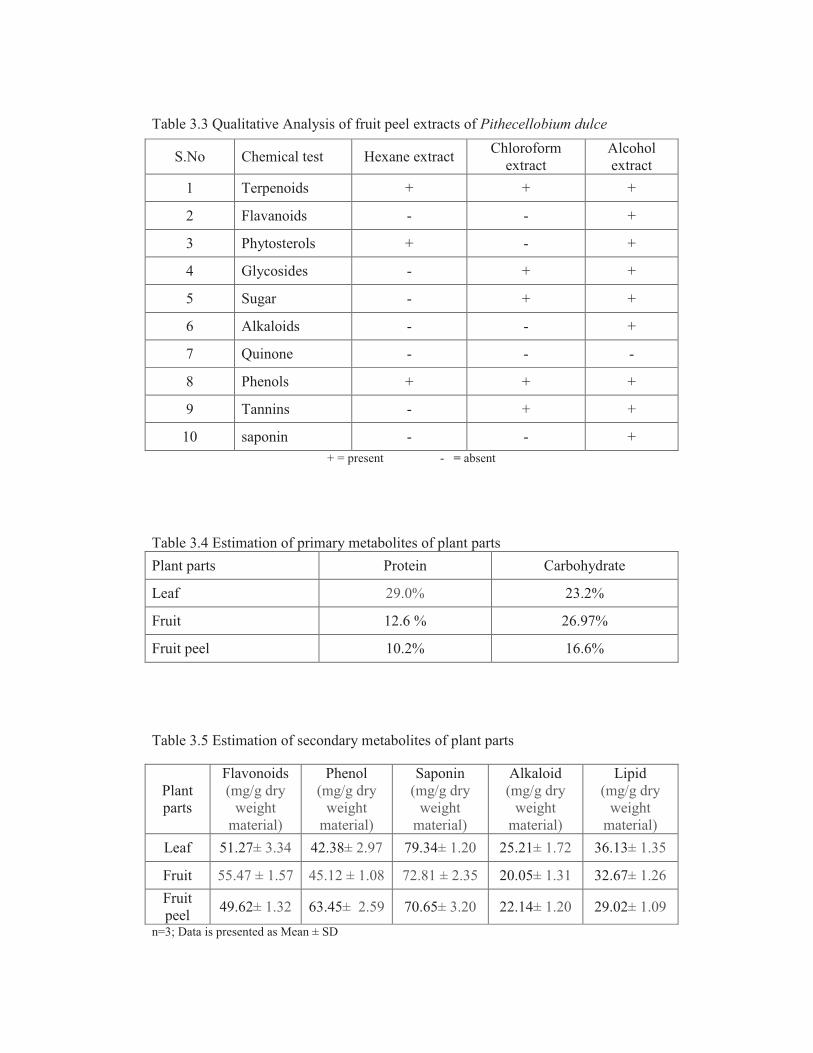
Table 3.3 Qualitative Analysis of fruit peel extracts of Pithecellobium dulce
+ = present - = absent
Table 3.4 Estimation of primary metabolites of plant parts
Plant parts Protein Carbohydrate
Leaf 29.0% 23.2%
Fruit 12.6 % 26.97%
Fruit peel 10.2% 16.6%
Table 3.5 Estimation of secondary metabolites of plant parts
Plant
parts
Flavonoids
(mg/g dry
weight
material)
Phenol
(mg/g dry
weight
material)
Saponin
(mg/g dry
weight
material)
Alkaloid
(mg/g dry
weight
material)
Lipid
(mg/g dry
weight
material)
Leaf 51.27± 3.34 42.38± 2.97 79.34± 1.20 25.21± 1.72 36.13± 1.35
Fruit 55.47 ± 1.57 45.12 ± 1.08 72.81 ± 2.35 20.05± 1.31 32.67± 1.26
Fruit
peel 49.62± 1.32 63.45± 2.59 70.65± 3.20 22.14± 1.20 29.02± 1.09
n=3; Data is presented as Mean ± SD
S.No Chemical test Hexane extract Chloroform
extract
Alcohol
extract
1 Terpenoids + + +
2 Flavanoids - - +
3 Phytosterols + - +
4 Glycosides - + +
5 Sugar - + +
6 Alkaloids - - +
7 Quinone - - -
8 Phenols + + +
9 Tannins - + +
10 saponin - - +