Embed Size (px)
Citation preview

Biogeosciences, 10, 4227–4240, 2013www.biogeosciences.net/10/4227/2013/doi:10.5194/bg-10-4227-2013© Author(s) 2013. CC Attribution 3.0 License.
EGU Journal Logos (RGB)
Advances in Geosciences
Open A
ccess
Natural Hazards and Earth System
Sciences
Open A
ccess
Annales Geophysicae
Open A
ccess
Nonlinear Processes in Geophysics
Open A
ccess
Atmospheric Chemistry
and Physics
Open A
ccess
Atmospheric Chemistry
and Physics
Open A
ccess
Discussions
Atmospheric Measurement
Techniques
Open A
ccess
Atmospheric Measurement
Techniques
Open A
ccess
Discussions
Biogeosciences
Open A
ccess
Open A
ccess
BiogeosciencesDiscussions
Climate of the Past
Open A
ccess
Open A
ccess
Climate of the Past
Discussions
Earth System Dynamics
Open A
ccess
Open A
ccess
Earth System Dynamics
Discussions
GeoscientificInstrumentation
Methods andData Systems
Open A
ccess
GeoscientificInstrumentation
Methods andData Systems
Open A
ccess
Discussions
GeoscientificModel Development
Open A
ccess
Open A
ccess
GeoscientificModel Development
Discussions
Hydrology and Earth System
Sciences
Open A
ccess
Hydrology and Earth System
Sciences
Open A
ccess
Discussions
Ocean Science
Open A
ccess
Open A
ccess
Ocean ScienceDiscussions
Solid Earth
Open A
ccess
Open A
ccess
Solid EarthDiscussions
The Cryosphere
Open A
ccess
Open A
ccess
The CryosphereDiscussions
Natural Hazards and Earth System
SciencesO
pen Access
Discussions
Phytoplankton chlorophyll a biomass, composition, and productivityalong a temperature and stratification gradient in the northeastAtlantic Ocean
W. H. van de Poll1, G. Kulk 2, K. R. Timmermans1, C. P. D. Brussaard1, H. J. van der Woerd3, M. J. Kehoe4,K. D. A. Mojica 1, R. J. W. Visser2, P. D. Rozema2, and A. G. J. Buma2
1Department of Biological Oceanography, Royal Netherlands Institute for Sea Research (NIOZ), P.O. Box 59, 1790 AB,Den Burg, the Netherlands2Department of Ocean Ecosystems, Energy and Sustainability Research Institute Groningen, University of Groningen,Nijenborgh 7, 9747 AG Groningen, the Netherlands3Institute for Environmental Studies (IVM), VU University Amsterdam, De Boelelaan 1087, 1081 HV, Amsterdam,the Netherlands4Institute for Biodiversity and Ecosystem Dynamics (IBED), University of Amsterdam, P.O. Box 94248, 1090 GE,Amsterdam, the Netherlands
Correspondence to:W. H. van de Poll ([email protected])
Received: 14 January 2013 – Published in Biogeosciences Discuss.: 31 January 2013Revised: 2 May 2013 – Accepted: 19 May 2013 – Published: 25 June 2013
Abstract. Relationships between sea surface temperature(SST, > 10 m) and vertical density stratification, nutrientconcentrations, and phytoplankton biomass, composition,and chlorophylla (Chl a) specific absorption were assessedin spring and summer from latitudes 29 to 63◦ N in the north-east Atlantic Ocean. The goal of this study was to identify re-lationships between phytoplankton and abiotic factors in anexisting SST and stratification gradient. Furthermore, a bio-optical model was used to estimate productivity for five phy-toplankton groups. Nutrient concentration (integrated from 0to 125 m) was inversely correlated with SST in spring andsummer. SST was also inversely correlated with near-surface(0–50 m) Chla and productivity for stratified stations. Near-surface Chla and productivity showed exponential relation-ships with SST. Chla specific absorption and excess lightexperiments indicated photoacclimation to lower irradiancein spring as compared to summer. In addition, Chla specificabsorption suggested that phytoplankton size decreased insummer. The contribution of cyanobacteria to water columnproductivity of stratified stations correlated positively withSST and inversely with nutrient concentration. This suggeststhat a rise in SST (over a 13–23◦C range) stimulates produc-tivity by cyanobacteria at the expense of haptophytes, which
showed an inverse relationship to SST. At higher latitudes,where rising SST may prolong the stratified season, hapto-phyte productivity may expand at the expense of diatom pro-ductivity. Depth-integrated Chla (0–410 m) was greatest inthe spring at higher latitudes, where stratification in the upper200 m was weakest. This suggests that stronger stratificationdoes not necessarily result in higher phytoplankton biomassstanding stock in this region.
1 Introduction
Phytoplankton growth in the oceans ultimately depends onseasonal and interannual climatological cycles that determinethe availability of nutrients and light. In addition, loss factorssuch a grazing, viral lyses, and sinking influence phytoplank-ton standing stock. In the open ocean, vertical density stratifi-cation is an important process in shaping the resource avail-ability for phytoplankton growth. Stabilization of the watercolumn allows phytoplankton to exploit higher irradiance in-tensities near the surface. However, stratification also inhibitsexchange with nutrient-rich deep water, potentially leadingto nutrient limitation of phytoplankton near the surface. In
Published by Copernicus Publications on behalf of the European Geosciences Union.

4228 W. H. van de Poll et al.: Phytoplankton, temperature, and stratification
the absence of stratification (winter, early spring) the depthrange of vertical mixing due to wind and convection can ex-pand by more than one order of magnitude, reducing phy-toplankton light availability, and increasing nutrient concen-trations. Furthermore, stratification may affect predator–preyand viral–algal host interactions by influencing encounterrates (Behrenfeld, 2010; Baudoux et al., 2008). Moreover,stratification is also an important factor in the seasonal de-velopment of phytoplankton composition in the open ocean.Changes in phytoplankton composition often coincide withchanges in cell size, because an increased surface-to-volumeratio is advantageous under low nutrient concentrations typi-cal of a stratified water column (Chisholm and Morel, 1991).High nutrient concentrations and turbulence due to wintermixing supports the growth of larger phytoplankton speciessuch as diatoms, whereas the onset of stratification in springleads to a succession towards smaller phytoplankton species(Litchman et al., 2007; Claustre et al., 2005). Low nutri-ent availability in the (sub)tropical oligotrophic ocean resultsin the dominance of cyanobacteria likeSynechococcusandProchlorococcusover picoeukaryotic phytoplankton species(Li, 1994; Johnson et al., 2006). The changes in phytoplank-ton composition can affect productivity and carbon storageto the deep ocean (Claustre et al., 2005; Martin et al., 2011).
Apart from pronounced seasonal changes, the North At-lantic experiences fluctuations in sea surface temperature(SST, >10 m) on interannual to multidecadal scales dueto the influence of the North Atlantic Oscillation and theAtlantic Multidecadal Oscillation (changes in the range of0.5◦C, Drinkwater et al., 2003; Enfield et al., 2001; Ting etal., 2009). In addition, the North Atlantic has experiencedsignificant warming as a result of global climate change(Gleckler et al., 2012), and this process is expected to con-tinue over the next decades. The response of ocean pro-ductivity to rising temperature is under debate. Models pre-dict that increased SST will enhance stratification of the up-per oceans (Steinacher et al., 2010; Hofmann et al., 2011),thereby reducing the depth of the mixed layer and decreas-ing nutrient exchange with the deep ocean. Remote-sensing-derived, globally averaged Chla and productivity showed asignificant negative relationship with density differences inthe upper oligotrophic open ocean (Behrenfeld et al., 2006;Polovina et al., 2008). However, long-term monitoring sitesand historical records for estimated Chla showed conflict-ing trends for the North Atlantic and other oceanic regions(Chavez et al., 2010; Boyce et al., 2010). Furthermore, no ev-idence for the interannual control of phytoplankton biomassand productivity by stratification was observed in the sub-tropical North Pacific or North Atlantic, although stratifica-tion correlated on a seasonal timescale with phytoplanktonproductivity (Dave and Lozier, 2010; Lozier et al., 2011). Atmid- and higher latitudes in the North Atlantic, stratificationhas been associated with bloom formation (Dutkiewicz et al.,2001). Here, termination of convection and the onset of strat-ification initiate the phytoplankton spring bloom (Siegel et
al., 2002; Taylor and Ferrari, 2011; Mahadevan et al., 2012).Earlier onset of stratification in the subpolar North Atlanticmay prolong the phytoplankton bloom season (Racault et al.,2012). As such, different responses to stratification can be ex-pected between the subpolar and subtropical North Atlantic(Richardson and Schoeman, 2004).
We hypothesized that SST influences phytoplanktonbiomass and composition by affecting nutrient concentra-tions in the upper open ocean. Therefore, relationships be-tween SST and nutrient concentrations can be expected alongexisting temperature gradients. Furthermore, relationshipsbetween SST, phytoplankton biomass, composition and pro-ductivity can be expected along existing temperature gradi-ents in the open ocean. Recent studies on temperature andstratification relationships with phytoplankton biomass andproductivity have focused on the oligotrophic open ocean,where nutrient limitation of phytoplankton is a dominant fea-ture (Behrenfeld et al., 2006; Polovina et al., 2008; Daveand Lozier, 2010; Lozier et al., 2011). In this context, tem-perate and higher latitude regions have received less atten-tion and studies that include both oligotrophic and higherlatitude waters on this topic are currently lacking. A pro-nounced gradient in SST and stratification can be observedfrom low (29◦ N) to higher (63◦ N) latitudes in the NorthAtlantic (Jurado et al., 2012a,b). We investigated seasonalchanges in biomass, productivity, and composition of NorthAtlantic phytoplankton along this gradient in relation to strat-ification, sea surface temperature, nutrient concentration, andlight availability. Furthermore, a model was used to estimatedaily water column productivity in the euphotic zone, us-ing in situ phytoplankton biomass (Chla), phytoplanktoncomposition (pigments), light, and temperature as variables,providing insight into the contribution of five phytoplanktontaxonomic groups to community primary productivity. Be-cause stratification shows strong seasonality at temperate andhigher latitudes, the gradient in the North Atlantic was sam-pled during spring when stratification was weak, and duringsummer when the strongest stratification occurs.
2 Methods
Two cruises were performed in the North Atlantic Oceanonboard the RVPelagiacovering the area between the Ca-nary Islands and Iceland (summer: July/August 2009; spring:April/May 2011). The cruise track covered subtropical, tem-perate, and subpolar sections in the North Atlantic Ocean(Fig. 1). Samples were collected with a trace metal cleanCTD (conductivity, temperature, depth) frame equipped with12 (summer) and 27 L (spring) sample bottles. Samples formacronutrients, pigments, chlorophyll specific absorption,and excess light experiments (see below) were obtained ina dedicated clean container.
Biogeosciences, 10, 4227–4240, 2013 www.biogeosciences.net/10/4227/2013/

W. H. van de Poll et al.: Phytoplankton, temperature, and stratification 4229
Fig. 1. Sample locations of the spring (2011, triangles) summer and (2009, circles) Stratiphyt
cruises. The numbers represent the station numbers.
Fig. 1.Sample locations of the spring (2011, triangles) summer and(2009, circles) Stratiphyt cruises. The numbers represent the stationnumbers.
2.1 Stratification index
The stratification index (Behrenfeld et al., 2006; Dave andLozier, 2010; Lozier et al., 2011) was used as a measureof stratification. The stratification index was calculated asthe difference in potential density (sigma–theta) between theupper 10 m (0–10 m average) and 200 m using the salinityand temperature profiles obtained by the CTD (Seabird 9+).When the difference in potential density was smaller than0.125, the upper 200 m was considered as non-stratified (DeBoyer Montegut et al., 2004).
2.2 Nutrients
Nutrient samples (6 mL) were obtained from multiple bot-tles, sampling between 4 and 7 depths. The samples werefiltered through 0.2 µm Acrodisc filters and measured on-board for inorganic PO4, NH4, NO2, and NO2 + NO3 using aBran & Luebbe Quaatro autoanalyzer. Depth profiles of PO4and NO3 (calculated by subtracting NO2 from NO2 + NO3)were fitted with a three or a five parameter sigmoidal func-tion by nonlinear regression (Sigma plot 11.0). Using the ob-tained function, nutrient concentrations were calculated overone meter depth intervals for the potential (0–125 m), up-per (0–50 m), and lower (50–125 m) euphotic zone. Further-
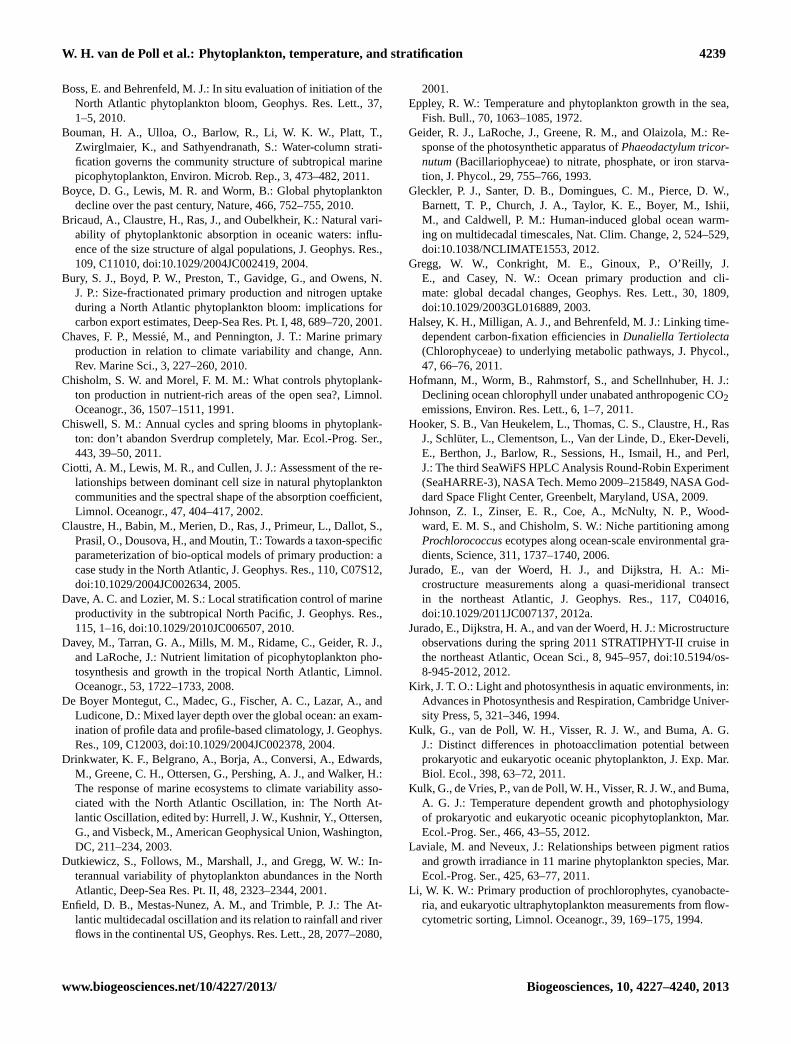
Fig. 2. Latitudinal changes in abiotic data from the spring (A, C, E) and summer (B, D, F) cruises. (A, B) density differences in the upper 200 m and sea surface temperature (SST, secondary y-axis). (C, D) Depth integrated nitrate (NO3) concentration in the upper (0–50 m) and lower (50–125 m) euphotic zone. (E, F) Depth integrated inorganic phosphate (PO4) concentration in the upper (0–50 m) and lower (50–125 m) euphotic zone. Black symbols represent data from non-stratified stations. The grey area indicates regions with oligotrophic conditions.
NO
3 (
mm
ol m
-2)
0
200
400
600
800
1000
de
nsity 0
-20
0 m
sig
ma
th
eta
0.0
0.5
1.0
1.5
latitude (oN)
30 40 50 60
PO
4 (
mm
ol m
-2)
0
20
40
60
30 40 50 60
0-50 m
50-125 m
SS
T (
oC
)
5
10
15
20
25
density
SST
spring summer
A B
C D
E F
Fig. 2. Latitudinal changes in abiotic data from the spring(A, C,E) and summer(B, D, F) cruises.(A, B) Density differences inthe upper 200 m and sea surface temperature (SST, secondary y-axis). (C, D) Depth-integrated nitrate (NO3) concentration in theupper (0–50 m) and lower (50–125 m) euphotic zone.(E, F) Depth-integrated inorganic phosphate (PO4) concentration in the upper(0–50 m) and lower (50–125 m) euphotic zone. Black symbols rep-resent data from non-stratified stations. The gray area indicates re-gions with oligotrophic conditions.
more, N : P ratios were calculated for the upper and lowereuphotic zone as (NO3 + NH4)/PO4 for the respective depthintervals. In the present study, oligotrophic and mesotrophicstations were distinguished based on the concentration ofNO3 in the upper euphotic zone (0–50 m). We defined olig-otrophic stations as those stations where NO3 in the uppereuphotic zone was below the detection limit (0.13 µmol L−1),whereas nutrients were detectable in the upper euphotic zoneof mesotrophic stations (Fig. 2). The detection limit for PO4was 0.03 µmol L−1.
2.3 Chlorophyll specific absorption
Samples (5–10 L) for Chla specific absorption were ob-tained from the chlorophyll maximum (oligotrophic stations:∼ 70 m; mesotrophic stations:∼ 40 m) and from the sub-surface (oligotrophic stations:∼ 15 to 30 m; mesotrophicstations:∼ 10 to 15 m). The samples were filtered through47 mm GF/F (Whatman), frozen in liquid nitrogen, andstored at−80◦C. Transmission and reflection from the filterwas measured between 350 and 800 nm on a Varian CARY3E UV/VIS double beam spectrophotometer with integrat-ing sphere over 1 nm intervals, before and after bleachingwith 1 % sodium hypochloride (Tassan and Ferrari, 1995).Chlorophyll specific absorption (aph) was calculated between
www.biogeosciences.net/10/4227/2013/ Biogeosciences, 10, 4227–4240, 2013

4230 W. H. van de Poll et al.: Phytoplankton, temperature, and stratification
400 and 700 nm using the filter clearance area, sample vol-ume, Chla concentration (separate high-performance liquidchromatography sample, see below), and the amplificationfactor β (set at 2 for all samples). The spectrally weightedmean specific absorption coefficient (= a∗) was calculated asthe sum ofa∗ph between 400 and 700 nm and corrected by anormalized solar spectrum (maximum set to one). Changes inlight spectrum with depth were not accounted for. The spec-trally weighted mean specific absorption coefficient (a∗) wasused to indicate the presence of differences in species compo-sition and photoacclimation between samples from differentdepths for the CHEMTAX calculations (see below).
2.4 Excess light experiments
An experimental approach was used to obtain informationon the photoacclimation state of phytoplankton, which wasused for the productivity calculations. Samples from dis-crete depths (chlorophyll maximum and subsurface) wereexposed to excess irradiance, and fluorescence character-istics were determined during recovery in low light. Pre-vious studies demonstrated that this response is stronglydependent on the photoacclimation state of algae (Van dePoll et al., 2006, 2011). Phytoplankton samples were ex-posed in 350 mL quartz cuvettes to 5 min of excess light(provided by a 250 W MHN-TD lamp (Philips) and two20 W TL/12 lamps (Philips)) at in situ temperature. PARand PAR+UVR conditions were created with GG395 andWG305 filters (Schott AG, Mainz), respectively (Supple-ment, Table 6). 30 mL subsamples from the cuvettes wereobtained after exposure and during recovery in low light at5 min intervals for 60 min. Control samples (150 mL) re-mained in darkness (dark-adapted controls). Fluorescenceparameters were determined using a Water PAM with aWATER-FT flow-through emitter-detector (Waltz, GmbH).Recovery of PSII quantum yield was determined by com-paring the maximum PSII quantum yield (dark acclimated)with the average PSII quantum yield that was reached be-tween 40 and 60 min of recovery after exposure. Becausefast reversible non-photochemical quenching relaxes within40 min, this provides an indication for slowly reversible pho-toinhibition (i.e., damage that requires a relatively long timeto repair). The maximum quantum yield of PSII (Fv/Fm) wascalculated as (Fm − F0)/Fm.
2.5 Pigment composition
Four to seventeen samples (5–10 L) were obtained frommultiple depths at each station and filtered through 47 mmGF/F filters (Whatman) under mild vacuum (0.3 mbar),frozen in liquid nitrogen, and stored at−80◦C. Priorto analysis, filters were freeze dried (48 h) and pig-ments were extracted in 90 % acetone (v/v) (48 h, 4◦C,darkness). Pigments were separated on a Waters 2695HPLC (high-performance liquid chromatography) system
using a Zorbax Eclipse XDB-C8 column (3.5 µm parti-cle size) as described by Hooker et al. (2009). Diode ar-ray spectroscopy (Waters 996) and retention time wereused for pigment identification, and the system was cal-ibrated against standards (DHI, Denmark) for chlorophylla1, divinyl (dv) chlorophylla2, chlorophyllb, chlorophyllc2, chlorophyll c3, peridinin, 19-butanoyloxyfucoxanthin,19-hexanoyloxyfucoxanthin, fucoxanthin, neoxanthin, prasi-noxanthin, alloxanthin, and zeaxanthin. Total Chla (sum ofChl a1 and dv Chla) obtained from HPLC analysis served asa phytoplankton biomass indicator and was used to calibratethe fluorescence sensor from the CTD (Chelsea AquatrackaMk III). A single relationship between HPLC Chla andChl a fluorescence values was used for the summer cruise.However, during the spring cruise, the relationship betweenChl a fluorescence and HPLC Chla was more variable, andthree different relationships were used to calibrate the flu-orescence profiles for data from latitude 29 to 40◦ N, 40 to47◦ N, and 48 to 63◦ N. The calibrated fluorescence profileswere then used to calculate Chla over 1 m depth intervals.Depth-integrated Chla was calculated for the euphotic zoneand for defined depth intervals – Chla integrated over 0–50 m (Chla0–50 m) and total depth-integrated Chla (surfaceto 200–410 m, Chlat ). For the latter, Chla below thesedepths was negligible. The euphotic zone was defined as thedepth with 0.1 % of surface irradiance. We choose the 0.1 %depth as the limit of the euphotic zone because this is a betterrepresentation of the depth below which net photosynthesis isnegligible than the commonly used 1 % depth of surface irra-diance. The 0.1 % light depth was calculated from the verticalattenuation coefficient (Kd), which was determined from thelinear regression of natural log transformed PAR vs. depth(PAR: photosynthetically active radiation, 400–700 nm, mea-sured by a 2π Satlantic PAR sensor on the CTD).
2.6 Phytoplankton composition
Phytoplankton taxonomic composition was determined us-ing CHEMTAX (Mackey et al., 1996) and will be presentedin Mojica et al. (2013). In short, 13 pigments (Chla, dvChl a, Chl b, Chl c2, Chl c3, peridinin, fucoxanthin, 19-butanoyloxyfucoxanthin, 19-hexanoyloxyfucoxanthin, neox-anthin, prasinoxanthin, alloxanthin, and zeaxanthin) wereused to distinguish 8 taxonomic groups (cyanobacteria:SynechococcusandProchlorococcus, haptophytes, diatoms,dinoflagellates, cryptophytes, prasinophytes, and pelago-phytes). Samples were grouped according to latitude and an-alyzed for spring and summer separately to minimize theresidual error. In oligotrophic waters, Chla specific absorp-tion showed differences between subsurface samples andthose from the chlorophyll maximum. In accordance, sepa-rate CHEMTAX analyses were performed for oligotrophicsamples with depth< 50 m and> 50 m, using high-light-and low-light-acclimated initial pigment ratios, respectively(Supplement, Tables 3 and 4). Mesotrophic stations showed
Biogeosciences, 10, 4227–4240, 2013 www.biogeosciences.net/10/4227/2013/

W. H. van de Poll et al.: Phytoplankton, temperature, and stratification 4231
no differences between subsurface and chlorophyll maxi-mum Chla specific absorption, and for these stations, low-light-acclimated pigment ratios were used for all depths.Contributions of the taxonomic groups were expressed rel-ative to Chla. Initial pigment ratios for CHEMTAX (Sup-plement, Tables 3, 4) were obtained from published pigmentratios (Zapata et al., 2004; Laviale and Neveux, 2011; Kulket al., 2011, 2012) and from exponentially growing batch cul-tures (haptophytes:Emiliania huxleyi, Phaeocystis globosa;and diatoms:Ditylum brightwellii, Thalassiosira pseudo-nana; unpublished results). CHEMTAX results were com-pared with light microscopy on fixed samples (Supplement),and with detailed flow cytometry data (Mojica et al., 2013).The current study focused on five phytoplankton groups usedin the primary production model.
2.7 Primary production
Depth-integrated daily primary production in the euphoticzone (PPZeu) and in the upper 50 m (PP0–50 m) was calcu-lated for each station using a diagnostic bio-optical modelcomparable to Claustre et al. (2005) and Uitz et al. (2008).The model uses in situ temperature, light, light attenuation,and Chla profiles to estimate primary productivity of differ-ent oceanic phytoplankton groups. In contrast to the modelpresented by Claustre et al. (2005) and Uitz et al. (2008), thecurrent model uses CHEMTAX based taxonomic groups andlaboratory determined primary production rates. We used therecovery of PSII maximum quantum yield from excess lightas a measure for phytoplankton photoacclimation state.
2.7.1 In situ data and light
In situ measurements obtained during the two cruises in theNorth Atlantic Ocean were used to set the irradiance cli-mate, temperature, and biomass in the model. The daily lightdose at each station was obtained from the Moderate Res-olution Imaging Spectroradiometer (MODIS-Aqua) satellite(level 3 data, 9 d average) using photosynthetically availableradiation (MAMO PAR 9 km.CR), with 9 km−2 resolutionfrom Giovanni ocean color radiometry portals. The time re-solved surface PAR was then calculated using the formula-tions for the diurnal variation of solar irradiance from Kirk etal. (1994). PAR attenuation for 1 m depth intervals was cal-culated using theKd determined from PAR profiles of theCTD (Supplement).
The in situ SST (CTD temperature at 10 m depth) duringthe spring and summer cruise in the North Atlantic Oceanranged from 7.7 to 23.3◦C. Because carbon fixation char-acteristics for the model were based on laboratory measure-ments at 20◦C, a temperature correction was applied. A lin-ear relationship between carbon fixation and temperature wasassumed (−0.045 mg C m−2 d−1 ◦C−1).
Phytoplankton biomass (Chla) was obtained from in situfluorescence profiles (1 m depth intervals), which were cali-brated to HPLC Chla concentrations as described above.
2.7.2 Primary production calculations
Five groups were distinguished to model primary production:group 1:Prochlorococcus; group 2:Synechococcus; group 3:Prasinophyceae, Pelagophyceae, and Cryptophyceae; group4: Haptophyceae and Dinophyceae; and group 5: diatoms.Photosynthetic characteristics for these functional groupswere obtained from14C-based photosynthesis versus irra-diance measurements ofProchlorococcus marinus(group1), Synechococcussp. (group 2),Ostreococcussp. (group3), Emiliania huxleyi(group 4), andThalassiosira ocean-ica (group 5) (Kulk et al., 2011). Photosynthetic charac-teristic of low light (50 µmol photons m−2 s−1) and highlight (125 µmol photons m−2 s−1) acclimated phytoplank-ton were used to calculate carbon fixation rates (Supple-ment, Table 1). A vertical structure in photosynthetic charac-teristics was assumed during summer. The depth where thePAR dose exceeded the dose experienced by the high-light-acclimated cultures (125 µmol photons m−2 s−1) was calcu-lated from theKd. Above this depth, phytoplankton wereassumed to be high-light acclimated, whereas low-light-acclimated phytoplankton (50 µmol photons m−2 s−1) wereassumed below this depth. In contrast, all phytoplankton wasassumed to be low-light acclimated in spring. This was basedon the Chla specific absorption and photoacclimation ex-periments that indicated low-light-acclimated phytoplanktonand less vertical structure in the water column in spring.Depth-integrated primary production was calculated accord-ing to Platt et al. (1980; see Supplement) for a 24 h periodover 1 h time intervals in the euphotic zone (0.1 % PAR) forthe five functional phytoplankton groups.
2.8 Statistics
Relationships between nutrient concentration (NO3 andPO4 integrated over 0–125 m: N0–125 m and P0–125 m), SST,density differences (0–200 m), phytoplankton biomass, andphytoplankton productivity were assessed by calculatingthe Spearman rank-order correlation coefficient (SigmaPlot11.0, Systat Software). We used the following indicatorsfor phytoplankton biomass: Chla concentration in samplesfrom 10 to 20 m (surface Chla), Chl a integrated over 0–50 m (Chla0–50 m), and total depth-integrated Chla (surfacedown to 200–410 m, Chlat ). The daily integrated produc-tivity in the euphotic zone (PPZeu) and the daily productiv-ity integrated over 0–50 m (PP0–50 m) were used as measuresfor productivity. In addition, relationships between contribu-tions of five taxonomic groups to productivity were assessed.Summer and spring cruises were tested separately (n =
32). Furthermore, relationships were assessed for stratified(spring and summer cruise pooled,n = 52) and non-stratified
www.biogeosciences.net/10/4227/2013/ Biogeosciences, 10, 4227–4240, 2013

4232 W. H. van de Poll et al.: Phytoplankton, temperature, and stratification
Table 1.Spearman rank-order correlation coefficients of sea surface temperature (SST) and density differences in the upper 200 m (density)for nitrate (N) and inorganic phosphate (P) concentration in the potential euphotic zone (0–125 m). Data are shown for spring and summercruises (n = 32) and for stratified (n = 52) and non-stratified (n = 12) stations from both cruises combined. Significant correlations are bold.
Summer Spring Stratified Non-stratifiedSST Density SST Density SST Density SST Density
N(0–125 m) −0.99 −0.87 −0.99 −0.75 −0.84 −0.10 −0.91 −0.24P(0–125 m) −0.99 −0.86 −0.98 −0.74 −0.84 −0.10 −0.97 −0.35
(spring,n = 12) stations. Chla specific absorption data fromoligotrophic and mesotrophic stations were pooled (subsur-face and Chla maximum, separately) and tested with aone-way ANOVA using Statistica 8.0 (StatSoft). Differenceswere considered significant atp < 0.05.
3 Results
3.1 Vertical density stratification
In summer, all stations were stratified, whereas weaker strat-ification was found in spring (Fig. 2). In spring, the upper200 m of the 12 stations above 47◦ N were considered tobe non-stratified (density difference< 0.125). In both sea-sons, the stratification index was highest at low latitudes anddeclined at higher latitudes, but the latitudinal gradient wasless pronounced in spring compared to summer. The correla-tion between the stratification index (difference in potentialdensity between the surface and 200 m) and SST (< 10 m)was stronger in summer than in spring (correlation coeffi-cient 0.87 vs. 0.78, data not shown).
3.2 Nutrient standing stock
Oligotrophic conditions were encountered up to latitude45◦ N in summer and 39◦ N in spring. N and P concentra-tions in the lower euphotic zone (50–125 m) increased lin-early with latitude and did not show significant differencesbetween spring and summer (Fig. 2). N and P in the up-per euphotic zone (0–50 m) of mesotrophic stations increasedwith latitude, and concentrations were higher in spring thanin summer. N0–125 mand P0–125 mshowed strong inverse cor-relations with SST in spring and summer and for stratified(summer and spring combined) and non-stratified stations(Table 1). The correlations between stratification index andN0–125 mand P0–125 mwere stronger in summer than in springand were not significant for stratified (summer and springcombined) and non-stratified stations. Integrated N and Pconcentrations in the euphotic zone were on average fivetimes higher in non-stratified stations compared to stratifiedstations (data not shown).
Average N : P ratios for the upper euphotic zone of olig-otrophic stations were 9.6 (± 3.6) and 12.0 (± 6.2) for springand summer, respectively (data not shown). Four olig-
Fig. 3. The spectrally weighted mean specific absorption coefficient (ā*) for the chlorophyll maximum (Chl a max) and sub-surface samples for oligotrophic and mesotrophic stations, obtained during the spring (A) and summer (B) cruises (average ± standard deviation). The number of replicates is indicated in the bars. Significant differences between chlorophyll maximum and sub-surface samples are indicated with *.
Chl-a max sub-surface
a*
(m-2
mg C
hl-a -1
)
0.00
0.02
0.04
0.06
0.08
0.10
oligotrophic
mesotrophic
Chl-a max sub-surface
spring summer
17 16 17 15 14 12 17 12
*
* *
*A B
Fig. 3.The spectrally weighted mean specific absorption coefficient(a∗) for the chlorophyll maximum (Chla max) and subsurface sam-ples for oligotrophic and mesotrophic stations, obtained during thespring(A) and summer(B) cruises (average± standard deviation).The number of replicates is indicated in the bars. Significant differ-ences between chlorophyll maximum and subsurface samples areindicated with∗.
otrophic stations showed high N : P ratios due to extremelylow P concentrations and were excluded from the N : P cal-culations. At mesotrophic stations, the average N : P ratio ofthe upper euphotic zone was 15.3 (± 0.9) and 13.2 (± 1.4)for spring and summer. Average N : P ratios for the lowereuphotic zone were 14.0 (± 3.7) and 16.5 (± 0.9) for springand summer in oligotrophic stations, and 15.9 (± 0.6) and16.1 (± 0.3) for spring and summer in mesotrophic stations,respectively.
3.3 Phytoplankton Chl a specific absorption
At oligotrophic stations, the spectrally weighted mean spe-cific absorption coefficient (a∗) was significantly (p < 0.01)higher in samples from the subsurface compared to thechlorophyll maximum in spring and summer (Fig. 3). Inmesotrophic stations,a∗ was not different between samplesfrom the subsurface and chlorophyll maximum in springand summer. Chla specific absorption was on average 37 %lower in spring compared to summer (p < 0.001).
3.4 Excess light experiments
Maximum quantum yield of dark-acclimated samplesshowed no significant difference between summer and spring(average of 0.628 and 0.636 in summer and spring, respec-tively). PSII quantum yield showed a strong response to ex-cess light, but this initial response was not different for PAR
Biogeosciences, 10, 4227–4240, 2013 www.biogeosciences.net/10/4227/2013/

W. H. van de Poll et al.: Phytoplankton, temperature, and stratification 4233
Fig. 4. Recovery of Fv/Fm (maximum quantum yield of PSII, % of control) after excess PAR (A, B) and PAR+UVR (C, D) exposure. Samples were obtained from the sub-surface and chlorophyll maximum, exposed to excess light and Fv/Fm was monitored during recovery in low light. The recovery values between 40 and 60 min were averaged. The graphs show the average and standard deviation, the number of replicates is indicated in the bars. Significant differences between chlorophyll maximum and sub-surface samples are indicated with *.
0
25
50
75
100oligotrophic
mesotrophic
Chl max sub-surface
Fv/F
m (
% o
f contr
ol)
0
25
50
75
100
Chl max sub-surface
spring summer
PAR
PAR+UVR
9 9
9 9
9 7
10 9
9 12 9 7
9 12 9 9
*
*
*
*
*
*
*
*
A B
C D
Fig. 4. Recovery of Fv/Fm (maximum quantum yield of PSII, % ofcontrol) after excess PAR(A, B) and PAR+ UVR (C, D) exposure.Samples were obtained from the subsurface and chlorophyll max-imum, exposed to excess light, and Fv/Fm was monitored duringrecovery in low light. The recovery values between 40 and 60 minwere averaged. The graphs show the average and standard devia-tion, the number of replicates is indicated in the bars. Significantdifferences between chlorophyll maximum and subsurface samplesare indicated with∗.
and PAR+UVR and was not significantly different amongstations (results not shown). In contrast, recovery from ex-cess light showed significant differences between summerand spring samples. Subsurface samples recovered to 90 %of the original value within 1 h in summer, whereas thiswas 65 % in spring, suggesting low irradiance acclimationin spring (Fig. 4). Chlorophyll maximum samples from olig-otrophic stations showed significantly less recovery in springand summer (40–50 % of original value, Fig. 4). PAR+UVRcaused lower recovery in oligotrophic stations of chlorophyllmaximum samples compared to PAR, but UVR effects werenot significant in mesotrophic stations in both seasons.
3.5 Phytoplankton biomass
Oligotrophic stations showed a deep chlorophyll maximum,whereas surface Chla was lower than that of mesotrophicstations. Mean surface Chla was higher in spring(0.23± 0.07 mg Chla m−3) than in summer (0.08± 0.03 mgChla m−3) for oligotrophic stations (Fig. 5). More variabil-ity in surface Chla was observed in mesotrophic stations,with maximum surface concentrations (2.0 mg Chla m−3)
at midlatitudes during spring and at higher latitudes duringthe summer. Mean depth-integrated Chla (Chl at ) for olig-otrophic stations was 49± 11 and 23± 6 mg Chla m−2 forspring and summer, respectively. Stronger seasonal differ-ences were found in Chlat of mesotrophic stations, with onaverage 112± 36 and 33± 11 mg Chla m−2 in spring andsummer, respectively. Non-stratified stations showed high-
Fig. 5. Latitudinal changes in biomass (chlorophyll a) for the spring (A, C, E) and summer (B, D, F) cruise. (A, B) Surface Chl a (samples from 10–20 m) determined by HPLC. (C, D) Depth integrated Chl a (Chl at) as determined from HPLC calibrated CTD fluorescence profiles from the surface to 200–410 m. (E, F) Percentage of Chl a in the euphotic zone (0.1% light depth). Black symbols represent data from non-stratified stations.
latitude (oN)
30 40 50 60
Ch
l-a
Ze
u (
% o
f to
tal)
0
20
40
60
80
100
Ch
l-a
t (m
g m
-2)
50
100
150
200
30 40 50 60
su
rfa
ce
Ch
l-a
(m
g m
-3)
0.0
0.5
1.0
1.5
2.0
2.5
spring summer
A B
C D
E F
Fig. 5.Latitudinal changes in biomass (chlorophylla) for the spring(A, C, E) and summer(B, D, F) cruise. (A, B) Surface Chla(samples from 10 to 20 m) determined by HPLC.(C, D) Depth-integrated Chla (Chlat ) as determined from HPLC-calibrated CTDfluorescence profiles from the surface to 200–410 m.(E, F) Percent-age of Chla in the euphotic zone (0.1 % light depth). Black symbolsrepresent data from non-stratified stations.
est Chlat (up to 190 mg Chla m−2, integrated over 410 m).Depth-integrated Chla in the euphotic zone declined withincreasing latitude from 80 to 30 % in spring, whereas 90 %of Chl a was found in the euphotic zone in summer (Fig. 5).In spring, Chla in the euphotic zone correlated positivelywith SST (correlation coefficient 0.92), but not in summer.Surface Chla and Chla0–50 m correlated with N0–125 mandP0–125 m, whereas inverse correlations were observed withSST (Table 2, Fig. 6). Correlations between these variableswere weaker in spring compared to summer. In spring, Chlat
correlated with N0–125 m and P0–125 m, SST, and the stratifi-cation index. When tested for stratified stations (spring andsummer combined), surface Chla and Chla0–50 m showedsignificant inverse correlations with SST and stratificationindex, and positive correlations with N0–125 m and P0–125 m(Table 2). The relationships between Chla (surface Chlaand Chla0–50 m) and SST were best described by an expo-nentially declining function (Fig. 6). Chla concentrations ofnon-stratified stations were not correlated with N0–125 mandP0–125 m, SST, and stratification index (data not shown).
www.biogeosciences.net/10/4227/2013/ Biogeosciences, 10, 4227–4240, 2013

4234 W. H. van de Poll et al.: Phytoplankton, temperature, and stratification
Table 2.Spearman rank-order correlation coefficients of nitrate (N)and inorganic phosphate (P) concentrations in the potential euphoticzone (0–125 m), sea surface temperature (SST), and density differ-ences in the upper 200 m (density) versus phytoplankton biomassand productivity. Surface chlorophylla (surface Chla), Chl a inthe upper euphotic zone (Chla0–50 m), and Chla integrated fromthe surface to 200–410 m (Chlat ) were used as biomass indicators.Productivity in the upper euphotic zone (PP0–50 m) and productivityin the euphotic zone (PPZeu) were used as indicators for productiv-ity. Data are shown for spring and summer cruises (n = 32), and forthe stratified stations from both cruises (n = 52). Significant corre-lations are expressed in bold.
N(0–125 m) P(0–125 m) SST Density
Summer Surface Chla 0.95 0.95 −0.96 −0.86n = 32 Chla0–50 m 0.92 0.92 −0.92 −0.83
Chl at 0.66 0.66 −0.66 −0.51PP0–50 m 0.88 0.89 −0.89 −0.84PPZeu 0.87 0.88 −0.87 −0.83
Spring Surface Chla 0.59 0.59 −0.61 −0.34n = 32 Chla0–50 m 0.41 0.40 −0.41 −0.05
Chl at 0.89 0.89 −0.91 −0.72PP0–50 m 0.43 0.44 −0.47 −0.17PPt 0.48 0.49 −0.50 −0.20
Stratified Surface Chla 0.69 0.69 −0.91 −0.62n = 52 Chla(0–50 m) 0.72 0.72 −0.88 −0.60
Chl at 0.17 0.17 −0.56 −0.79PP0–50 m 0.78 0.80 −0.87 −0.46PPt 0.78 0.79 −0.85 −0.42
3.6 Primary production
Daily primary production in the euphotic zone (PPZeu) ofoligotrophic stations was higher in spring than in summer(on average 722± 192 and 457± 242 mg C m−2 d−1, respec-tively; Fig. 7). However, for mesotrophic stations, PPZeu wassignificantly higher in summer than in spring (on average1627± 416 and 1210± 225 mg C m−2 d−1, respectively).In summer, PPZeu and PP0–50 m correlated positively withN0–125 mand P0–125 m, and inversely with SST and the strat-ification index (n = 32, Table 2). These correlations wereweaker in spring (n = 32). PPZeu and PP0–50 m showed in-verse correlations with SST at stratified stations (summer andspring combined) (Table 2, Fig. 6), and positive correlationswith N0–125 m and P0–125 m (Table 2). The relationship be-tween PP0–50 m and SST was best described by an exponen-tially declining function (Fig. 6). There was a weak inversecorrelation between productivity and the stratification indexfor stratified stations (Table 2). Productivity of non-stratifiedstations showed no correlations with N0–125 m and P0–125 mand SST (data not shown).
Cyanobacteria contributed up to 40 % to the productivityof oligotrophic stations (group 1 and 2 combined; Figs. 6,8). At stratified stations (summer and spring combined), thecontribution of cyanobacteria was inversely correlated withN0–125 m and P0–125 m and positively with SST, whereas nosignificant relationship was found for the stratification index
Fig. 6. (A) Relationship between depth integrated (0–50m) Chl a (Chl a 0−50 m) and sea surface temperature (SST) for stratified stations from the summer and spring cruise (n = 52). (B) Relationship between depth integrated (0–50 m) daily productivity (PP0−50 m) and SST for stratified stations from the spring and summer cruises (n = 52). Note the exponential scale on the y-axis of graph A and B. (C) Estimated productivity by cyanobacteria in the euphotic zone (group 1 and 2 combined) versus SST for stratified stations from the spring and summer cruises (n = 52).
Ch
l-a
0-5
0 m
(m
g m
-2)
1
10
100
PP
0-5
0 m
(m
g C
m-2
da
y -1
)100
1000
A
B
SST (oC)
12 14 16 18 20 22 24
cya
nob
acte
ria
(%
of
PP
Zeu)
0
10
20
30
40 C
y = 1920 e-0.285(x)
r2 = 0.86
y = 51647 e-0.248(x)
r2 = 0.84
Fig. 6. (A) Relationship between depth-integrated (0–50 m) Chla
(Chl a0–50 m) and sea surface temperature (SST) for stratified sta-tions from the summer and spring cruise (n = 52).(B) Relationshipbetween depth-integrated (0–50 m) daily productivity (PP0–50 m)and SST for stratified stations from the spring and summer cruises(n = 52). Note the exponential scales on the y-axes of graphs A andB. (C) Estimated productivity by cyanobacteria in the euphotic zone(group 1 and 2 combined) versus SST for stratified stations from thespring and summer cruises (n = 52).
(Table 3). In mesotrophic stations, productivity of cyanobac-teria was of minor importance (Fig. 7). On average 30 % ofgroup 3 (prasinophytes, pelagophytes and cryptophytes) con-sisted of prasinophytes (data not shown). Group 3 showeda relatively stable contribution to productivity of stratifiedstations (on average 30 %). In non-stratified stations the
Biogeosciences, 10, 4227–4240, 2013 www.biogeosciences.net/10/4227/2013/

W. H. van de Poll et al.: Phytoplankton, temperature, and stratification 4235
Table 3.Spearman rank-order correlation coefficients of estimated contribution to primary production of group 1 (Prochlorococcus), group2 (Synechococcus), group 1 and 2 combined (cyanobacteria), group 3 (prasinophytes, cryptophytes and pelagophytes), group 4 (haptophytesand dinophytes), and group 5 (diatoms) between nitrate (N0–125 m) and inorganic phosphate (P0–125 m) concentrations in the potential eu-photic zone, sea surface temperature (SST), and density differences in the upper 200 m (density). Data are shown for stratified (n = 52) andnon-stratified (n = 12) stations from spring and summer cruises.
Stratified stations (n = 52) N(0–125 m) P(0–125 m) SST Density
Group 1, 2 (Cyanobacteria) −0.83 −0.83 0.82 0.38Group 1 (Prochlorococcus) −0.77 −0.77 0.88 0.53Group 2 (Synechococcus) −0.79 −0.80 0.77 0.35Group 3 (Prasinophytes) −0.01 −0.03 0.11 0.07Group 4 (Haptophytes) 0.60 0.60 −0.59 −0.29Group 5 (Diatoms) −0.09 −0.23 −0.26 −0.28
Non-stratified stations (n = 12) N(0–125 m) P(0–125 m) SST Density
Group 3 (Prasinophytes) 0.90 0.89 −0.79 −0.22Group 4 (Haptophytes) −0.76 −0.76 0.78 0.35Group 5 (Diatoms) −0.73 −0.71 0.59 0.01
Fig. 7. Latitudinal changes in daily primary production in the euphotic zone (PPZeu) during the spring (A) and summer (B) cruise. Productivity was estimated from in situ phytoplankton biomass and composition, light, light attenuation, and temperature using a bio-optical model (see method for details). Black symbols represent data from non-stratified stations.
latitude (oN)
30 40 50 60
PP
Ze
u (m
g C
m-2
da
y-1
)
0
500
1000
1500
2000
2500
30 40 50 60
spring summer
A B
Fig. 7. Latitudinal changes in daily primary production in the eu-photic zone (PPZeu) during the spring(A) and summer(B) cruise.Productivity was estimated from in situ phytoplankton biomass andcomposition, light, light attenuation, and temperature using a bio-optical model (see Methods section for details). Black symbols rep-resent data from non-stratified stations.
contribution of group 3 increased up to 73 % and showed pos-itive correlations with N0–125 m and P0–125 m and an inversecorrelation with SST (Table 3). Haptophytes were the mostimportant contributor of group 4 (haptophytes, dinophytes)in spring (91 %) and summer (75 %). On average, group 4accounted for 50 % of the production in mesotrophic sta-tions, whereas this was 37 % in oligotrophic stations (Fig. 8).At stratified stations (summer and spring), the contributionof group 4 correlated positively with N0–125 m and P0–125 mand inversely with SST (Table 3). At non-stratified sta-tions, group 4 showed inverse correlations with N0–125 mandP0–125 m and a positive correlation with SST. The contribu-tion of diatoms to productivity (groups 5) was maximum athigher latitudes (up to 60 %) during the spring compared tosummer (on average 8 %, Fig. 8). The contribution of diatomsto the productivity in stratified stations did not show correla-tions with N0–125 mand P0–125 mand SST (Table 3). At non-stratified stations, this group was inversely correlated with
N0–125 mand P0–125 mand positively correlated with SST (Ta-ble 3).
4 Discussion
4.1 Phytoplankton biomass and productivity inrelation to SST, stratification, and nutrients
The summer and spring comparison of open-ocean stationsin the North Atlantic (29–63◦ N) showed that phytoplank-ton biomass, productivity, and composition were correlatedwith N and P concentrations and SST. In the present study,the potential nutrient availability for phytoplankton was es-timated by integration of nutrient concentrations over 0–125 m (N0–125 mand P0–125 m). The positive correlations be-tween N0–125 mand P0–125 mand Chla and productivity sug-gested that open-ocean phytoplankton biomass and produc-tivity were controlled by the availability of these nutrientsin the investigated region. SST was inversely correlated withphytoplankton biomass and productivity and with N0–125 mand P0–125 m. This suggests that SST is important in deter-mining nutrient availability for phytoplankton by influencingvertical exchange with deeper nutrient-rich water. The rela-tionships were stronger with SST than with the stratificationindex. In spring nutrient concentrations were more uncou-pled from stratification, i.e., were less reflected by the differ-ences in density. The correlation between SST and nutrientsin non-stratified stations possibly reflects the relationship be-tween SST and the depth of winter mixing. In addition, cor-relations between SST and phytoplankton biomass and pro-ductivity were weaker under the weakly and non-stratifiedconditions in spring. Moreover, the fraction of the phyto-plankton biomass in the euphotic zone correlated with SST.Combined, this indicates that convective and wind mixing
www.biogeosciences.net/10/4227/2013/ Biogeosciences, 10, 4227–4240, 2013

4236 W. H. van de Poll et al.: Phytoplankton, temperature, and stratificationFig. 8. Contributions to daily primary production in the euphotic zone of (A, B) group 1 (Prochlorococcus) and cyanobacteria (group 1+2); (C, D) group 3 (prasinophytes, cryptophytes, pelagophytes); (E, F) group 4 (haptophytes, dinophytes); (G, H) group 5 (diatoms) for the spring (A, C, E, G) and summer (B, D, F, H) and cruises. Black symbols represent data from non-stratified stations.
gro
up 3
(%
of
PP
Ze
u)
20
40
60
80
latitude (oN)
30 40 50 60
gro
up 5
(%
of
PP
Ze
u)
0
20
40
60
gro
up 4
(%
of
PP
Ze
u)
20
40
60
80
30 40 50 60
gro
up 1
+2 (
% o
f P
PZ
eu)
0
10
20
30
40 cyanobacteria
Prochlorococcus
spring summer
A B
C D
E F
G H
Fig. 8. Contributions to daily primary production in the euphoticzone of (A, B) group 1 (Prochlorococcus) and cyanobacteria(group 1+ 2), (C, D) group 3 (prasinophytes, cryptophytes, pelago-phytes),(E, F) group 4 (haptophytes, dinophytes), and(G, H) group5 (diatoms) for the spring(A, C, E, G) and summer(B, D, F, H)cruises. Black symbols represent data from non-stratified stations.
exerted a stronger influence on the water column distributionof Chl a in spring.
The inverse relationships between SST and near-surfacephytoplankton biomass and PP0–50 m for stratified stationssuggest that within the SST range of 13–23◦C, North At-lantic open-ocean phytoplankton productivity co-varies withSST. If this also applies to interannual, and multidecadal SSTchanges, this would imply that anthropogenic warming ofthe ocean has a negative influence on phytoplankton biomassand productivity in the stratified open ocean within this tem-perature range. It should be noted that these correlations arenot proof of causation. Nevertheless, the existence of corre-lations between SST, nutrient concentrations, phytoplanktonPP and Chla in the surface oceans provide support for thehypothesis that SST influences nutrients in the open-oceansurface and thereby controls phytoplankton biomass, produc-tivity and composition.
The relationship between productivity and SST in strati-fied stations indicated that a 0.5◦C increase in SST would
cause a 11 % decline in daily productivity in the upper 50 m.Gregg et al. (2003) reported a 6–7 % decline in annual pro-ductivity in the central and northern section of the North At-lantic from a 0.3 to 0.7◦C SST increase. In addition, theresponse of Chla to SST observed in the present studysuggested that a SST rise of 0.5◦C would correspond toa 12–13 % decline in near-surface Chla (surface Chla,Chl a0–50 m) for stratified conditions between 13 to 23◦C.The nonlinear nature of the Chla and PP versus SST re-sponses also indicates stronger responses can be expected inregions with lower SST, whereas responses are smaller inregions with higher SST. Previously, relationships betweenstratification and phytoplankton biomass and Chla for theoligotrophic North Atlantic and Pacific were not detected(Dave and Lozier, 2010; Lozier et al., 2011), whereas theywere observed in remote sensing data with SST above 16◦C(Behrenfeld et al., 2006).
4.2 Stratification mediated shifts in phytoplanktonbiomass, productivity, and composition
In spring, stations above 47◦ N showed minimal strati-fication, with potential density differences in the upper200 m of 0.029± 0.02 kg m−3. This is less than the re-ported 0.12 kg m−3 difference for eddy-driven stratificationthat preceded thermal stratification in the same region in2008 (Mahadevan et al., 2012), but corresponds with val-ues (0.025 kg m−3) where phytoplankton biomass accumu-lation in the upper 150 m was observed around New Zealand(Chiswell, 2011). At our non-stratified stations, we observedrelatively low surface Chla (0.7± 0.3 mg Chla m−3), andup to 70 % of the Chla was below the euphotic zone. Com-parable observations were reported during late winter–earlyspring by Backhaus et al. (2003) for the Icelandic Basin.Inevitably, the occurrence of phytoplankton below the eu-photic zone will slow down growth rates of the phytoplank-ton standing stock. However, productivity estimates for theeuphotic zone of non-stratified stations in the present studywere not significantly different compared to those from strat-ified mesotrophic stations in spring.
Increased surface Chla in response to stratificationof the water column represents the classical view of thespring bloom at mid- and higher latitudes (Sverdrup, 1953).However, the present study suggests that the pre-bloomconditions, with minimal stratification in the upper 200 m(beginning of May, latitude 49–62◦ N), were more rich interms of depth-integrated Chla (129± 32 mg Chl a m−2)
compared with surface blooms at midlatitudes in spring(44–45◦ N, up to 112± 13 mg Chl a m−2) and sur-face blooms at higher latitudes in summer (59–62◦ N,42± 13 mg Chla m−2). This also illustrates that surfaceChl a concentration can be a poor indicator of phyto-plankton standing stock, since surface Chla was lowerduring pre-bloom conditions (0.7± 0.3 mg Chla m−3)
compared with spring (1.8± 0.3 mg Chla m−3) and summer
Biogeosciences, 10, 4227–4240, 2013 www.biogeosciences.net/10/4227/2013/

W. H. van de Poll et al.: Phytoplankton, temperature, and stratification 4237
(1.3± 0.3 mg Chla m−3) blooms. It was earlier observedthat phytoplankton growth increased with increasing lightin winter and early spring in the absence of stratification(Behrenfeld, 2010). This increase in Chla can be maskedby the diluting effect of deep convective and wind-inducedvertical mixing as proposed by Boss and Behrenfeld (2010).
Relationships between the contribution of taxonomicgroups to productivity and SST were different for strati-fied and non-stratified stations. In the latter stations, pro-ductivity of group 3 (prasinophytes, cryptophytes) was in-versely correlated with SST (7–12◦C), whereas group 4(haptophytes) and 5 (diatoms) were positively correlatedwith SST. This suggested that temperature constrains pro-ductivity of the latter groups within this temperature range. Inthe present study, the nutrient-rich conditions associated withnon-stratified stations supported significant diatom produc-tivity (up to 60 %) above SST of 8◦C. After stratification, therelatively large and heavy diatoms typically become nutrient(Si) limited (Alkire et al., 2012). Furthermore, contraction ofthe mixed layer and the euphotic zone due to stratificationtraps a large amount of the phytoplankton in the dark ocean(Backhaus et al., 2003). Estimated class-specific productivityfrom SeaWiFS observations showed that the strongest pro-ductivity anomalies occurred in early spring in the temperateand subpolar North Atlantic, coinciding with diatom produc-tivity (Uitz et al., 2010). Therefore, it can be expected thatdifferences in annual primary production are in large partcaused by variability in diatom productivity.
The nutrient concentrations in the euphotic zone of strat-ified stations were on average five times lower compared tothose of the non-stratified stations. Furthermore, low N : P ra-tios indicated mostly N-limitation in the upper euphotic zone(0–50 m) of stratified stations. This is consistent with facto-rial nutrient addition experiments in the oligotrophic NorthAtlantic that have identified N as the primary limiting nutri-ent (Davey et al., 2008; Moore et al., 2008). Therefore, theability to compete for nutrients can be expected to be an im-portant driver of changes in phytoplankton composition inthe stratified North Atlantic. In the present study, changesin phytoplankton groups that contributed to primary produc-tion were observed along the latitudinal gradient in N0–125 mand P0–125 m. Overall, the haptophyte pigment signature wasdominant in spring and summer. Moreover, an inverse cor-relation was observed for the contribution of group 4 (domi-nated by haptophytes) and SST, whereas there was a positivecorrelation between SST and group 1 and 2 (cyanobacteria)in stratified stations. This suggests that increased SST willincrease the contribution of less productive species, such asProchlorococcus, at the expense of more productive species,such as haptophytes, at low and midlatitudes. Furthermore,the present study also suggests that haptophytes succeed di-atoms after stratification in spring at higher latitudes. There-fore, earlier stratification in spring would prolong the growthseason of haptophytes at higher latitudes in the North At-lantic Ocean.
4.3 Productivity modeling and assumptions
Reported productivity in the North Atlantic subtropical gyrevaried between 100 and 350 mg C m−2 d−1 (Morel et al.,1996; Maranon et al., 2000, 2003). Claustre et al. (2005)estimated daily primary production rates of 939± 223 and393± 80 mg C m−2 d−1 for spring and summer, respectively,in the North Atlantic between 39 to 45◦ N, which agrees withour estimates for this region. In the present study, N andP were not depleted in summer in the upper euphotic zone(0–50 m) of mesotrophic stations. Therefore, wind eventscan temporarily raise nutrient concentrations in the mixedlayer in summer, making nutrient limitation less evident inthese stations. At mesotrophic stations, reported productivityvalues do not show clear differences between summer andspring (500–2000 mg C m−2 d−1, Bury et al., 2001; Weeks etal., 1993), whereas our estimates are in the same range butsuggest higher productivity in summer.
Our productivity calculations were significantly influ-enced by the assumed photoacclimation state of the phyto-plankton. Inclusion of these differences was motivated byobserved differences in Chla specific absorption and recov-ery of PSII quantum yield from excess light, which bothindicated acclimation to lower irradiance in spring. In thepresent study, Chla specific absorption was significantlylower (37 %) in spring compared to summer, as was alsoobserved by Claustre et al. (2005). This may be caused byincreased pigment packaging due to the presence of largerphytoplankton species such as diatoms. Furthermore, the re-lationships between Chla fluorescence (CTD) and HPLCdetermined Chla concentrations showed a decreased Chla
specific fluorescence yield in spring as compared to summer(data not shown), providing additional evidence for seasonaldifferences in the Chla package effect. Most variability inChl a specific absorption has been associated with changesin phytoplankton size structure (Bricaud et al., 2004). Inthe present study, reduced nutrient concentrations coincidedwith a shift to smaller phytoplankton species, which wasalso found in other studies (Agawin et al., 2000; Maranonet al., 2001; Bouman et al., 2011). Smaller species containless Chla per cell and therefore show less pigment packag-ing (Ciotti et al., 2002). Therefore, changes in phytoplanktoncell size may contribute to the observed nonlinear relation-ship between Chla and SST. However, acclimation to dif-ferent light and nutrient conditions can also influence cel-lular Chl a and Chla specific absorption, but the magni-tude of these changes can vary among phytoplankton species(Geider et al., 1993; Kulk et al., 2011). Stronger turbulencein spring (Jurado et al., 2012b) may have reduced the lightdose experienced by the phytoplankton, thereby increasingcellular pigment concentrations compared to the more sta-ble summer conditions. Therefore, contributions of phyto-plankton composition and photoacclimation on Chla spe-cific absorption cannot be fully separated. However, recoveryof PSII quantum yield from excess light provided additional
www.biogeosciences.net/10/4227/2013/ Biogeosciences, 10, 4227–4240, 2013

4238 W. H. van de Poll et al.: Phytoplankton, temperature, and stratification
evidence for acclimation to lower irradiance and less verticalstructure in photosynthetic parameters in spring as comparedto summer. Assuming low-light-acclimated phytoplankton inspring caused on average a 26 % lower productivity for olig-otrophic stations compared to the assumed vertical structurein photosynthetic parameters in summer. This underlines theimportance of photoacclimation on the model results.
In the present study, several assumptions were made tomodel primary production from field measurements. Firstly,we applied a linear temperature correction to total mod-eled productivity. Typically, growth shows temperature de-pendence in specific oceanic phytoplankton species (Mooreet al., 1995; Kulk et al., 2012). Eppley (1972) suggestedthat the temperature dependence of growth is exponential,with growth increasing with increasing temperature. How-ever, compiled carbon fixation data and lab experiments sug-gest a linear response of productivity within the tempera-ture range of 13–23◦C (Behrenfeld et al., 1997; Montagnesand Franklin, 2001). Secondly, the model assumes that nu-trient availability is reflected by differences in phytoplanktonbiomass and composition. This is in line with the observationthat nutrient availability does not influence Chla specificnet primary production inDunaliella tertiolecta (Halsey,2011). Moreover, phytoplankton turnover rates in the oceanare on the order of days, which would eliminate nutrientstarved phytoplankton species from the community. Finally,the model assumes a sinusoidal irradiance distribution dur-ing the day and therefore does not include effects of cloudcover and/or vertical mixing. However, Kulk et al. (2011)showed that there were no significant effects of a dynamic ir-radiance regime on phytoplankton carbon fixation character-istics (under nutrient replete conditions). At last, the produc-tivity model does not account for spectral irradiance changesat depth. Validation of the productivity calculations withfield productivity estimates was not possible in the presentstudy. Therefore, the current productivity estimates should beviewed as potential productivity estimates, rather than actualmeasurements. Overall, the model approach can expand theuse of phytoplankton pigments and provided useful insightin group specific productivity.
5 Conclusions
Our results show an inverse relationship between phyto-plankton productivity and biomass with SST for the strati-fied North Atlantic Ocean with SST between 13 and 23◦C.Furthermore, increasing SST was associated with a changein phytoplankton species composition from haptophytes tocyanobacteria at mid- and low latitudes. Since increases inNorth Atlantic SST are expected for the coming decades,phytoplankton may respond accordingly. Responses to a fu-ture temperature rise are more likely to be observed in highlatitude Chla and productivity due to the nonlinear relation-ship with SST. Increasing SST has been suggested to medi-ate different effects on phytoplankton biomass in subtropical
(less productivity) and subpolar regions (increased produc-tivity due to a longer growth season) in the North Atlantic.However, our data showed the highest depth-integrated Chla
at higher latitude non-stratified stations in spring, suggestingthat phytoplankton blooms can start under minimal stratifi-cation. This indicated that possible earlier onset of stratifi-cation (and surface blooming) would not necessarily resultin a longer and more productive season. In contrast, delayedstratification may prolong the growth season of diatoms, themost productive phytoplankton group that contributes signif-icantly to carbon export into the deep ocean, whereas earlierstratification may expand the contribution of haptophytes atthe expense of diatoms.
Supplementary material related to this article isavailable online at:http://www.biogeosciences.net/10/4227/2013/bg-10-4227-2013-supplement.pdf.
Acknowledgements.We thank the captain and crew of R/VPelagiaand the support of NIOZMRF onshore and onboard. The cruisewas supported by the Research Council for Earth and Life Sciences(ALW), with financial aid from the Netherlands Organization forScientific Research (NWO). This work is part of Stratiphyt subpro-ject 2 (project number 839.08.422), subsidized by ALW/NWO.
Edited by: E. Maranon
References
Agawin, N. S. R., Duarte, C. M., and Agustı, S.: Nutrient and tem-perature control of the contribution of picophytoplankton to phy-toplankton biomass and production, Limnol. Oceanogr.,45, 591–600, 2000.
Alkire M. B., Asaro, E., Lee, C., Perry, M. J., Gray, A., Cetinic,I., Briggs, N., Rehma, E., Kallin, E., Kaiser, J., and Gonzalez-Posada, A.: Estimates of net community production and exportusing high-resolution, Lagrangian measurements of O2, NO3,and POC through the evolution of a spring diatom bloom in theNorth Atlantic, Deep-Sea Res. Pt. I, 64, 157–174, 2012.
Backhaus, J. O., Hegseth, E. N., Wehde, H., Irigoien, X., Hatten,K., and Logemann, K.: Convection and primary production inwinter, Mar. Ecol.-Prog. Ser., 251, 1–14, 2003.
Baudoux, A. C., Veldhuis, M. J. W., Noordeloos, A. A. M., vanNoort, G., and Brussaard, C. P. D.: Estimates of virus- vs. grazinginduced mortality of picophytoplankton in the North Sea duringsummer, Aquat. Microb. Ecol., 52, 69–82, 2008.
Behrenfeld, M. J.: Abandoning Sverdrup’s critical depth hypothesis,Ecology, 91, 977–989, 2010.
Behrenfeld, M. J. and Falkowski, P. G.: Photosynthetic rates de-rived from satellite-based chlorophyll concentrations, Limnol.Oceanogr., 42, 1–20, 1997.
Behrenfeld, M. J., O’Malley, R. T., Siegel, D. A., McClain, C. R.,Sarmiento, J. L., Feldman, G. C., Milligan, A. J., Falkowski, P.G., Letelier, R. M., and Boss, E. S.: Climate-driven trends in con-temporary ocean productivity, Nature, 444, 752–755, 2006.
Biogeosciences, 10, 4227–4240, 2013 www.biogeosciences.net/10/4227/2013/
W. H. van de Poll et al.: Phytoplankton, temperature, and stratification 4239
Boss, E. and Behrenfeld, M. J.: In situ evaluation of initiation of theNorth Atlantic phytoplankton bloom, Geophys. Res. Lett., 37,1–5, 2010.
Bouman, H. A., Ulloa, O., Barlow, R., Li, W. K. W., Platt, T.,Zwirglmaier, K., and Sathyendranath, S.: Water-column strati-fication governs the community structure of subtropical marinepicophytoplankton, Environ. Microb. Rep., 3, 473–482, 2011.
Boyce, D. G., Lewis, M. R. and Worm, B.: Global phytoplanktondecline over the past century, Nature, 466, 752–755, 2010.
Bricaud, A., Claustre, H., Ras, J., and Oubelkheir, K.: Natural vari-ability of phytoplanktonic absorption in oceanic waters: influ-ence of the size structure of algal populations, J. Geophys. Res.,109, C11010, doi:10.1029/2004JC002419, 2004.
Bury, S. J., Boyd, P. W., Preston, T., Gavidge, G., and Owens, N.J. P.: Size-fractionated primary production and nitrogen uptakeduring a North Atlantic phytoplankton bloom: implications forcarbon export estimates, Deep-Sea Res. Pt. I, 48, 689–720, 2001.
Chaves, F. P., Messie, M., and Pennington, J. T.: Marine primaryproduction in relation to climate variability and change, Ann.Rev. Marine Sci., 3, 227–260, 2010.
Chisholm, S. W. and Morel, F. M. M.: What controls phytoplank-ton production in nutrient-rich areas of the open sea?, Limnol.Oceanogr., 36, 1507–1511, 1991.
Chiswell, S. M.: Annual cycles and spring blooms in phytoplank-ton: don’t abandon Sverdrup completely, Mar. Ecol.-Prog. Ser.,443, 39–50, 2011.
Ciotti, A. M., Lewis, M. R., and Cullen, J. J.: Assessment of the re-lationships between dominant cell size in natural phytoplanktoncommunities and the spectral shape of the absorption coefficient,Limnol. Oceanogr., 47, 404–417, 2002.
Claustre, H., Babin, M., Merien, D., Ras, J., Primeur, L., Dallot, S.,Prasil, O., Dousova, H., and Moutin, T.: Towards a taxon-specificparameterization of bio-optical models of primary production: acase study in the North Atlantic, J. Geophys. Res., 110, C07S12,doi:10.1029/2004JC002634, 2005.
Dave, A. C. and Lozier, M. S.: Local stratification control of marineproductivity in the subtropical North Pacific, J. Geophys. Res.,115, 1–16, doi:10.1029/2010JC006507, 2010.
Davey, M., Tarran, G. A., Mills, M. M., Ridame, C., Geider, R. J.,and LaRoche, J.: Nutrient limitation of picophytoplankton pho-tosynthesis and growth in the tropical North Atlantic, Limnol.Oceanogr., 53, 1722–1733, 2008.
De Boyer Montegut, C., Madec, G., Fischer, A. C., Lazar, A., andLudicone, D.: Mixed layer depth over the global ocean: an exam-ination of profile data and profile-based climatology, J. Geophys.Res., 109, C12003, doi:10.1029/2004JC002378, 2004.
Drinkwater, K. F., Belgrano, A., Borja, A., Conversi, A., Edwards,M., Greene, C. H., Ottersen, G., Pershing, A. J., and Walker, H.:The response of marine ecosystems to climate variability asso-ciated with the North Atlantic Oscillation, in: The North At-lantic Oscillation, edited by: Hurrell, J. W., Kushnir, Y., Ottersen,G., and Visbeck, M., American Geophysical Union, Washington,DC, 211–234, 2003.
Dutkiewicz, S., Follows, M., Marshall, J., and Gregg, W. W.: In-terannual variability of phytoplankton abundances in the NorthAtlantic, Deep-Sea Res. Pt. II, 48, 2323–2344, 2001.
Enfield, D. B., Mestas-Nunez, A. M., and Trimble, P. J.: The At-lantic multidecadal oscillation and its relation to rainfall and riverflows in the continental US, Geophys. Res. Lett., 28, 2077–2080,
2001.Eppley, R. W.: Temperature and phytoplankton growth in the sea,
Fish. Bull., 70, 1063–1085, 1972.Geider, R. J., LaRoche, J., Greene, R. M., and Olaizola, M.: Re-
sponse of the photosynthetic apparatus ofPhaeodactylum tricor-nutum(Bacillariophyceae) to nitrate, phosphate, or iron starva-tion, J. Phycol., 29, 755–766, 1993.
Gleckler, P. J., Santer, D. B., Domingues, C. M., Pierce, D. W.,Barnett, T. P., Church, J. A., Taylor, K. E., Boyer, M., Ishii,M., and Caldwell, P. M.: Human-induced global ocean warm-ing on multidecadal timescales, Nat. Clim. Change, 2, 524–529,doi:10.1038/NCLIMATE1553, 2012.
Gregg, W. W., Conkright, M. E., Ginoux, P., O’Reilly, J.E., and Casey, N. W.: Ocean primary production and cli-mate: global decadal changes, Geophys. Res. Lett., 30, 1809,doi:10.1029/2003GL016889, 2003.
Halsey, K. H., Milligan, A. J., and Behrenfeld, M. J.: Linking time-dependent carbon-fixation efficiencies inDunaliella Tertiolecta(Chlorophyceae) to underlying metabolic pathways, J. Phycol.,47, 66–76, 2011.
Hofmann, M., Worm, B., Rahmstorf, S., and Schellnhuber, H. J.:Declining ocean chlorophyll under unabated anthropogenic CO2emissions, Environ. Res. Lett., 6, 1–7, 2011.
Hooker, S. B., Van Heukelem, L., Thomas, C. S., Claustre, H., RasJ., Schluter, L., Clementson, L., Van der Linde, D., Eker-Develi,E., Berthon, J., Barlow, R., Sessions, H., Ismail, H., and Perl,J.: The third SeaWiFS HPLC Analysis Round-Robin Experiment(SeaHARRE-3), NASA Tech. Memo 2009–215849, NASA God-dard Space Flight Center, Greenbelt, Maryland, USA, 2009.
Johnson, Z. I., Zinser, E. R., Coe, A., McNulty, N. P., Wood-ward, E. M. S., and Chisholm, S. W.: Niche partitioning amongProchlorococcusecotypes along ocean-scale environmental gra-dients, Science, 311, 1737–1740, 2006.
Jurado, E., van der Woerd, H. J., and Dijkstra, H. A.: Mi-crostructure measurements along a quasi-meridional transectin the northeast Atlantic, J. Geophys. Res., 117, C04016,doi:10.1029/2011JC007137, 2012a.
Jurado, E., Dijkstra, H. A., and van der Woerd, H. J.: Microstructureobservations during the spring 2011 STRATIPHYT-II cruise inthe northeast Atlantic, Ocean Sci., 8, 945–957, doi:10.5194/os-8-945-2012, 2012.
Kirk, J. T. O.: Light and photosynthesis in aquatic environments, in:Advances in Photosynthesis and Respiration, Cambridge Univer-sity Press, 5, 321–346, 1994.
Kulk, G., van de Poll, W. H., Visser, R. J. W., and Buma, A. G.J.: Distinct differences in photoacclimation potential betweenprokaryotic and eukaryotic oceanic phytoplankton, J. Exp. Mar.Biol. Ecol., 398, 63–72, 2011.
Kulk, G., de Vries, P., van de Poll, W. H., Visser, R. J. W., and Buma,A. G. J.: Temperature dependent growth and photophysiologyof prokaryotic and eukaryotic oceanic picophytoplankton, Mar.Ecol.-Prog. Ser., 466, 43–55, 2012.
Laviale, M. and Neveux, J.: Relationships between pigment ratiosand growth irradiance in 11 marine phytoplankton species, Mar.Ecol.-Prog. Ser., 425, 63–77, 2011.
Li, W. K. W.: Primary production of prochlorophytes, cyanobacte-ria, and eukaryotic ultraphytoplankton measurements from flow-cytometric sorting, Limnol. Oceanogr., 39, 169–175, 1994.
www.biogeosciences.net/10/4227/2013/ Biogeosciences, 10, 4227–4240, 2013

4240 W. H. van de Poll et al.: Phytoplankton, temperature, and stratification
Litchman, E., Klausmeier, C. A., Schofield, O. M., and Falkowski,P. G.: The role of functional traits and trade-offs in structuringphytoplankton communities: scaling from cellular to ecosystemlevel, Ecol. Lett., 10, 1170–1181, 2007.
Lozier, S. M., Dave, A. C., Palter, J. B., Geber, L. M., and Bar-ber, R. T.: On the relationship between stratification and primaryproduction in the North Atlantic, Geophys. Res. Lett., 38, 1–6,doi:10.1029/2011GL049414, 2011.
Mackey, M. D., Higgins, H. W., Mackey, D. J., and Wright, S. W.:CHEMTAX – a program for estimating class abundances fromchemical markers: application to HPLC measurements of phyto-plankton, Mar. Ecol.-Prog. Ser., 144, 265–283, 1996.
Mahadevan A., D’Asaro, E. D., Lee, C., and Perry, M. J.: Eddy-driven stratification initiates North Atlantic spring phytoplanktonblooms, Science, 337, 54–58, 2012.
Maranon, E., Patrick, H., Holligan, M. M., Varela, B., Mourin, A.J., and Bale Maran, E.: Basinscale variability of phytoplanktonbiomass, production and growth in the Atlantic Ocean, Deep-SeaRes. Pt. I, 47, 825–857, 2000.
Maranon, M., Holligan, P. M., Barciela, R., Gonzalez, N., Mourino,B., Pazo, M. J., and Varela, M.: Patterns of phytoplankton sizestructure and productivity in contrasting open-ocean environ-ments. Mar. Ecol.-Prog. Ser., 216, 43–56, 2001.
Maranon, E., Behernfeld, M. J., Gonzalez, N., Mourino, B., andZubkov, M. V.: High variability of primary production in olig-otrophic waters of the North Atlantic Ocean: uncoupling fromphytoplankton biomass and size structure, Mar. Ecol.-Prog. Ser.,257, 1–11, 2003.
Martin, P., Lampitt, R. S., Perry, M. J., Sanders, R., Lee, C., andD’Asaro, E.: Export and mesopelagic particle flux during a NorthAtlantic spring diatom bloom, Deep-Sea Res. Pt. I, 58, 338–349,2011.
Mojica, K. D. A., van de Poll, W. H., Kehoe, M. J., Witte, H., Huis-man, J., Timmermans, K. R., Buma, A. G. J., van der Woerd,H. J., Dijkstra, H. A., and Brussaard, C. P. D.: Phytoplanktonabundance, size and community composition as a function ofvertical stratification in the Northeast Atlantic Ocean, Limnol.Oceanogr., submitted, 2013.
Montagnes, D. J. S. and Franklin, D. J.: Effect of temperature ondiatom volume, growth rate, and carbon and nitrogen content:reconsidering some paradigms, Limnol. Oceanogr., 46, 2008–2018, 2001.
Moore, C. M., Mills, M. M., Langois, R., Milne, A., Achterberg,E. P., LaRoche, J., and Geider, R. J.: Relative influence of nitro-gen and phosphorous availability on phytoplankton physiologyand productivity in the oligotrophic sub-tropical North AtlanticOcean, Limnol. Oceanogr., 53, 291–305, 2008.
Moore, L. R., Goericke, R., and Chisholm, S. W.: Comparativephysiology ofSynechococcusandProchlorococcus: influence oflight and temperature on growth, pigments, fluorescence and ab-sorptive properties, Mar. Ecol.-Prog. Ser., 116, 259–275, 1995.
Morel A., Antoine, D., Babin, M., and Dandonneau, Y.: Measuredand modeled primary production in the northeast Atlantic (EU-MELI JGOFS program): the impact of natural variations in pho-tosynthetic parameters on model predictive skill, Deep-Sea Res.Pt. I, 43, 1272–1304, 1996.
Platt, T., Gallegos, C. L., and Harrison, W. G.: Photoinhibition ofphotosynthesis in natural assem blages of marine-phytoplankton,J. Mar. Res., 38, 687–701, 1980.
Polovina, J. J., Howell, E. A., and Abecassis, M.: Ocean’s least pro-ductive waters are expanding, Geophys. Res. Lett., 35, L03619,doi:10.1029/2007GL031745, 2008.
Racault, M. F., Le Quere, C., Buitenhuis, E., Sathyendranath, S.,and Platt T.: Phytoplankton phenology in the global ocean, Ecol.Indic., 14, 152–163, 2012.
Richardson, A. J. and Schoeman, D. S.: Climate impact on planktonecosystems in the Northeast Atlantic, Science, 305, 1609–1612,2004.
Siegel, D. A., Doney, S. C., and Yoder, Y. A.: The North AtlanticSpring bloom and Sverdrups’s critical depth hypothesis, Science,296, 730–733, 2002.
Steinacher, M., Joos, F., Frolicher, T. L., Bopp, L., Cadule, P.,Cocco, V., Doney, S. C., Gehlen, M., Lindsay, K., Moore, J. K.,Schneider, B., and Segschneider, J.: Projected 21st century de-crease in marine productivity: a multi-model analysis, Biogeo-sciences, 7, 979–1005, doi:10.5194/bg-7-979-2010, 2010.
Sverdrup, H.: On conditions of vernal blooming of phytoplankton,J. Conseil, 18, 287–295, 1953.
Tassan, T. and Ferrari, G. M.: Proposal for the measurement ofbackscatter and total scattering by mineral particles suspendedin water, Appl. Optics, 34, 8345–8353, 1995.
Taylor, J. and Ferrari, R.: Shutdown of turbulent convection as a newcriterion for the onset of spring phytoplankton blooms, Limnol.Oceanogr., 56, 2293–2307, 2011.
Ting, M., Kushnir, Y., Seager, R., and Li, C.: Forced and internaltwentieth-century SST trends in the North Atlantic, J. Climate,22, 1469–1481, 2009.
Uitz, J., Huot, Y., Bruyant, F., Babin, M., and Claustre, H.: Relat-ing phytoplankton photophysiolofical properties to communitystructure on large scales, Limnol. Oceanogr., 53, 614–630, 2008.
Uitz, J., Claustre, H., Gentili, B., and Stramski, D.: Phytoplanktonclass-specific primary production in the world’s oceans: seasonaland interannual variability from satellite observations, GlobalBiogeochem. Cy., 24, 1–19, 2010.
Van de Poll, W. H., Alderkamp, A. C., Janknegt P. J., RoggeveldJ., and Buma, A. G. J.: Photoacclimation modulates effects ofexcessive photosynthetically and ultraviolet radiation in a tem-perate and an Antarctic marine diatom, Limnol. Oceanogr., 51,1239–1248, 2006.
Van de Poll, W. H., Lagunas, M., de Vries, T., Visser, R. J. W., andBuma A. G. J.: Non-photochemical quenching of chlorophyll flu-orescence and xanthophyll cycle responses after excess PAR andUVR in Chaetoceros brevis, Phaeocystis antarcticaand coastalAntarctic phytoplankton, Mar. Ecol.-Prog. Ser., 426, 119–131,2011.
Weeks, A., Conte, H. M., Harris, R. P., Bedo, A., Bellan, I., Burkhill,P. H., Edwards, E. S., Habour, D. S. Kennedy, H., Llewellyn, C.,Mantoura, R. F. C., Morales, C. E., Pomroy, A. J., and Turley,C. M.: The physical and chemical environment and changes incommunity structure associated with bloom evolution: the JointGlobal Flux Study North Atlantic Bloom Experiment, Deep-SeaRes. Pt. II, 40, 347–368, 1993.
Zapata, M., Jeffrey, S. M., Wright, S. M., Rodriguez, F., Garrido,J. L., and Clementson, L.: Photosynthetic pigments in 37 species(65 strains) of Haptophyta: implications for oceanography andchemotaxonomy, Mar. Ecol.-Prog. Ser., 270, 83–102, 2004.
Biogeosciences, 10, 4227–4240, 2013 www.biogeosciences.net/10/4227/2013/