Embed Size (px)
Citation preview
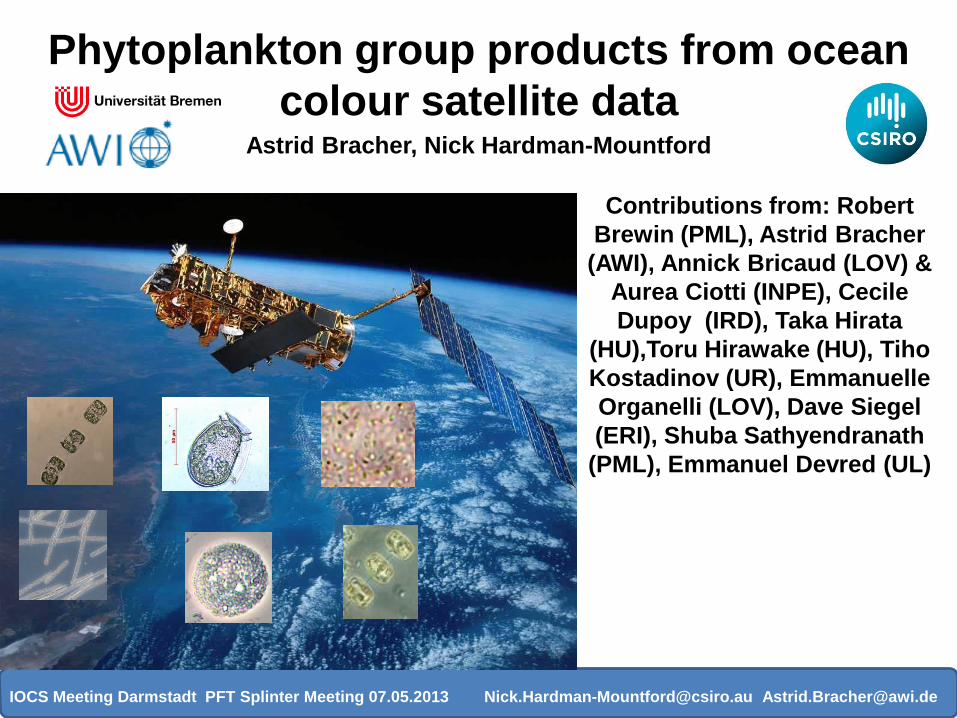
Phytoplankton group products from ocean
colour satellite data Astrid Bracher, Nick Hardman-Mountford
IOCS Meeting Darmstadt PFT Splinter Meeting 07.05.2013 [email protected] [email protected]
Contributions from: Robert
Brewin (PML), Astrid Bracher
(AWI), Annick Bricaud (LOV) &
Aurea Ciotti (INPE), Cecile
Dupoy (IRD), Taka Hirata
(HU),Toru Hirawake (HU), Tiho
Kostadinov (UR), Emmanuelle
Organelli (LOV), Dave Siegel
(ERI), Shuba Sathyendranath
(PML), Emmanuel Devred (UL)

Overview Main principles of different phytoplankton groups - basics of different
algorithms’ approaches
Short overview of current (not complete!!!) multiple phytoplankton
functional types (PFT) or size class (PSC) algorithms and satellite
products:
a) Abundance based - biomass/dominance of different PSC/PFT:
- using chl only
- combined with a443 or bb
- empirical reflectance ratios (via marker pigments conc.)
b) Spectral
- reflectance anomalies - dominant PFT)
- phytoplankton absorption (and bbp) - PSC conc.
- PFT absorption spectra (hyperspectral!) - PFT conc.
- particle backscatter to infer particle size distribution
Summary
IOCS Meeting Darmstadt PFT Splinter Meeting 07.05.2013 [email protected] [email protected]

Abundance approaches Large cells have more chlorophyll than small cells

Larger size classes add chlorophyll
Total Chl (log10)
Size
-cla
ss C
hl c
on
trib
uti
on
(lo
g 10)
Small (pico)
Medium (nano)
Large (micro)

Larger size classes add chlorophyll
Total Chl (log10)
Size
-cla
ss %
to
tal C
hl
Small (pico) Medium (nano) Large (micro)

Spectral approaches
no
rmal
ized
bb
p
no
rmal
ized
ap
h
wavelength [nm] wavelength [nm]
Plots courtesy of Toru Hirawake
Based on changes in shape and slope

From Brewin et al. Chapter 4: Detection of Phytoplankton Size Structure by Remote Sensing. In Sathyendranath et al. Phytoplankton Functional Types from Space. IOCCG Report 14, in prep.
Size-structure and PFT approaches

Chlorophyll or absorption abundance-based approaches to size and PFT fractionation
IOCS Meeting Darmstadt PFT Splinter Meeting 07.05.2013 [email protected] [email protected]

Hirata et al. 2008. Dominant size class
• Phytoplankton pigment composition related to Chl
Detect size class from Chl biomass
Also holds for optical absorption
Global Pigment/Optics Data Set AMT (PML) SeaBass (NASA, various contributors) Oshoro (Hokkaido Univ, NOAA) NOMAD (NASA, various contributors)
(N=5570)
Hirata et al., 2008 Rem. Sens. Env.
Chl-a
Dominance
Micro (>20μm)
Nano (2-20 μm)
Pico (<2 μm)

INPUT Satellite total chl-a (band-ratio
or IOP-based)
Advantages: Simple. Based on underlying conceptual model (Sathyendranath at al., 2001) on how phytoplankton populations change with chlorophyll. Disadvantages: Indirect approach, relies on observed patterns of change in size structure with a change in abundance. Vulnerable to changes in chlorophyll independent of size structure. Temporal -spatial coverage: Dependent on resolution of satellite sensor. Product been applied in other bgc/ecological/climate studies: see Brewin et al. (2012b) and Brotas et al. (2013). Main reference: Brewin et al. (2010) A three-component model of phytoplankton size class for the Atlantic Ocean. Ecological Modelling. 221 1472-1483
Brewin et al.: Relationship between total chlorophyll and phytoplankton size structure based on conceptual model of Sathyendranath et al. (2001)
OUTPUT Size-fractionated chl-a
Uncertainty: available (pixel-by-pixel and / or
based on biogeochemical provinces, see Hardman-Mountford et al. 2008)
Parameterisation / Validation: Global / regional pigment data (see Vidussi et al. 2001
and uitz et al. 2006) and using size-fractionated filtration data (see Brewin et al. 2010; 2011,
2012a, 2012b; and Brotas et al. 2013)

Hirata et al. (2011). Phytoplankton Functional Types for model comparisons Input: Only Chla or aph(443nm) derived from OC (L2/L3) Output: Chla [mg/m3] and percentage [%] of Microplankton, Nanoplankton, Picoplankton, Diatoms, Haptophytes (Prymnesiophytes), Green Algae, Pico-Eukaryotes, Prokaryotes, Prochlorococcus sp. Estimated uncertainties: <~ 30% Advantage: a. many groups of phytoplankton groups to be retrieved (3 size classes + 5 groups). b. Quantified outputs (pigment biomass in [mg/m3] or relative abundance in [%]). Disadvantage(?): a. Empirical relationships involved b. May not be applied to shelf- and coastal waters Spatio-Temporal coverage: Sensor resolution dependent Main Reference: Hirata, T., N.J. Hardman-Mountford, R.J.W. Brewin, J. Aiken, R. Barlow, K. Suzuki, T. Isada, E. Howell, T. Hashioka, M. Aita- Noguchi, Y. Yamanaka, Biogeosciences, 8, 311-327, 2011 Applications: a. Rousseaux et al. Satellite views of global phytoplankton community distributions using an empirical algorithm and a numerical model,
Biogeosciences Discuss., 10, 1083-1109, 2013 b. Hashioka et al. Phytoplankton competition during the spring bloom in four phytoplankton functional type models (submitted) c. Palacz et al. Distribution of phytoplankton functional types in high-nitrate low-chlorophyll waters in a new diagnostic ecological indicator
model (submitting)
Quantification of many phytoplankton groups
OC-PFT ver. 1.0/1.1

PFTs from space in the U.S. northeast coast
• Empirical ocean color algorithms were developed for pigments (Chl a, b, c, fucoxanthin, zeaxanthin, etc.) in the U.S. northeast coast.
• Field HPLC pigments were related to PFTs by chemotaxonomy (CHEMTAX).
• Combining the above two approaches to determine PFTs from space.
• The distributional patterns in PFTs are oceanographically reasonable, and agree well with previous works by cell counts.
Pan et al., Remote Sens. Environ. 114, 2403-2416 (2010); 115, 3731-3747 (2011); 128, 162-175 (2013).
Examples: Abundances (in TChl_a) of
diatoms and picoplankton in the U.S.
northeast coast in Feb and Aug.
Flowchart of methodology

Spectral approaches: Reflectance Anomalies
IOCS Meeting Darmstadt PFT Splinter Meeting 07.05.2013 [email protected] [email protected]

The PHYSAT approach
-> Based on Radiances anomalies : Removed the first order Chl a effect on the signal :
Ra()=nLw()/nLwref(, Chl a)
-> Main publications (methodology) : Alvain S., et al. Moulin C., Dandonneau Y., and Breon F.M, Remote sensing of phytoplakton groups in case 1 waters from global SeaWiFS imagery. DSR I- 52, (2005). Alvain S., Moulin C., Dandonneau Y., Loisel H., Seasonal distribution and succession of dominant phytoplankton groups in the global ocean : A satellite view, Global Biogeochemical Cycles, 22, GB3001, (2008) Alvain S., Loisel H. and D. Dessailly, Theoretical analysis of ocean color radiances anomalies and implications for phytoplankton groups detection in case 1 waters, Optics Express Vol. 20, N°2, (2012).
DATA AVAILABLE HERE : http://log.univ-littoral.fr/Physat
INPUT Chlorophyll-a concentration Visible radiances : -Mean signal from satellite archive -Daily pixels values Optical depth Theoretical expertise (IOP)
Validation (% of identification) Nanoeucaryotes : 82 % Diatoms : 73 % Prochlorococcus+SLC : 82% (SeaWiFS + MODIS dataset)
-> Some Applications : -Alvain S. et al. Rapid climatic driven shifts of diatoms at high latitudes, Remote Sensing of Environment, (2013). -Demarcq H. et al. (2011) ; Monitoring marine phytoplankton seasonality from space, Remote Sensing of Environment RSE-08090 -D’Ovidio F, et al., Fluid dynamical niches of phytoplankton types PNAS, Volume : 107 Issue : 43 Pages : 18366-18370 (2010) -Alvain S. et al. A species-dependent bio-optical model of case I waters for global ocean color processing. Deep Sea Res. I, 53, 917-925, (2006).
OUTPUT -Global maps of phytoplankton dominant groups (daily and period synthesis) -Detection frequencies -Confidence index (based on IOP)
Inter Deposit Digital Number (License APP) : IDDN.FR.001.330003.000.S.P.2012.000.30300.
+ In situ observations (pigments, counts, cytometry…)

4 mai 14h40
TRICHOSAT: Trichodesmium blooms in the STPO
Dupouy et al., Biogeosciences , 8, 1-17 (2011) .
Radiance anomaly spectrum
• Selection around New Caledonia and Vanuatu : 15°S-25°S
• Selection in SUMMER (max in February
1999, 2003, 2004)
• Complementary of the PHYSAT approach !
• Weakness: detects only surface blooms, low
number of pixels (0.1%), works in the
South Tropical Pacific Ocean
Seawifs image & Tricho obs STPO
WINTER INTER SUMMER
1997-2010 SeaWiFS series

Spectral approaches: Absorption-based
IOCS Meeting Darmstadt PFT Splinter Meeting 07.05.2013 [email protected] [email protected]

Deriving a phytoplankton size factor from satellite reflectances Reference: CIOTTI, A.M. and A. BRICAUD. 2006. Retrievals of a size parameter for phytoplankton and spectral light absorption by Colored Detrital Matter from water-leaving radiances at SeaWiFS channels in a continental shelf region off Brazil. L&O-Methods, 4: 237 – 253.
INPUTS
Satellite reflectances at 412, 443, 490, 510 nm (SeaWiFS channels)
OUTPUTS - Dimensionless size factor Sf, varying between
0 (100% micro) and 1 (100% pico) - Absorption coefficient of CDM (acdm(443)) - Spectral slope of CDM absorption (Scdm)
General principle: Sf is estimated from the spectral shape of normalized phytoplankton absorption (according to the package effect)
- Satellite reflectances inverted into total absorption coefficients - Then 3 output variables are derived from total absorption coefficients by non-linear optimization
Sf
Scdm
acdm(443)
[Chl]
Validation on shelf waters off Brazil : RMSE = 17% between Sf values estimated from SeaWiFS data and from hyperspectral absorption measured in the field.
Intercomparison with other methods: see Brewin et al. 2011

Deriving a phytoplankton size factor from satellite reflectances Reference: CIOTTI, A.M. and A. BRICAUD. 2006. L&O-Methods, 4: 237 – 253.
Advantages / disadvantages:
Application: BRICAUD, A., A.M. CIOTTI and B. GENTILI. 2012. Global Biogeochemical Cycles, 26, GB1010, doi :10.1029 /2010GB003952.
Sf
Scdm acdm(443)
[Chl]
• Spectral-based method: changes in size structure can be detected independently of [Chl] changes
• Sf estimates a continuum of differences in light absorption efficiency, not size fractions per se; ranges of sizes can be assumed, but validation is still in progress
• The spectral shape of algal absorption is ruled not only by cell size but also by photoacclimation -> source of uncertainty – we are looking for trends in time and space using Sf residuals
• The inversion of reflectances into non-water absorption coefficients, and therefore Sf estimates, are difficult in very clear waters (Sf overestimated)

Colleen. B. Mouw and James. A. Yoder (2010)
Optical determination of phytoplankton size
composition from global SeaWiFS imagery.
JGR 115, C12018, doi: 10.1029/2010JC006337.
Validation:
84% within 1 standard deviation,
12%, 2 std. dev., 4%, 3 std. dev.
All data: r2 =0.6, RMSE=12.64,
1 Std. Dev.: r2 =0.84,
RMSE=6.35 Sensitivity: SeaWiFS has the sensitivity to retrieve Sfm
when: [Chl] 0.05 - 1.75 mg m-3 and aCDM(443) < 0.17 m-1
Of decadal mean imagery, 84% of [Chl] and 99.7% of aCDM(443) fall within thresholds
Satellite Percent Microplankton, SeaWiFS May 2006
• Inputs: [Chl] and aCDM(443)
• Output: Percent Microplankton
• Advantages: Does not assume a direct
relationship with chlorophyll. Considers
thresholds of sensitivity and the
presence of other optically active
constituents.
• Disadvantages: Retrieves only percent
microplankton.
• Temporal spatial coverage:
Dependent on resolution of sensor.
Phytoplankton Cell Size:
An Absorption Approach Through
Look-up Tables

Pixel-based diatom discrimination using spectral information on absorption of diatoms and other phytoplankton populations
Spring Summer Fall
Spectrally-resolved approach, from phytoplankton absorption to Diatom (Sathyendranath et al. 2004) and size classes (Sathyendranath et al. 2001, Devred et al. 2006, 2011)
Two-step inversion scheme using linear combination of specific absorption spectra of pico-, nano and mircrophytoplankton derived from three-component absorption model
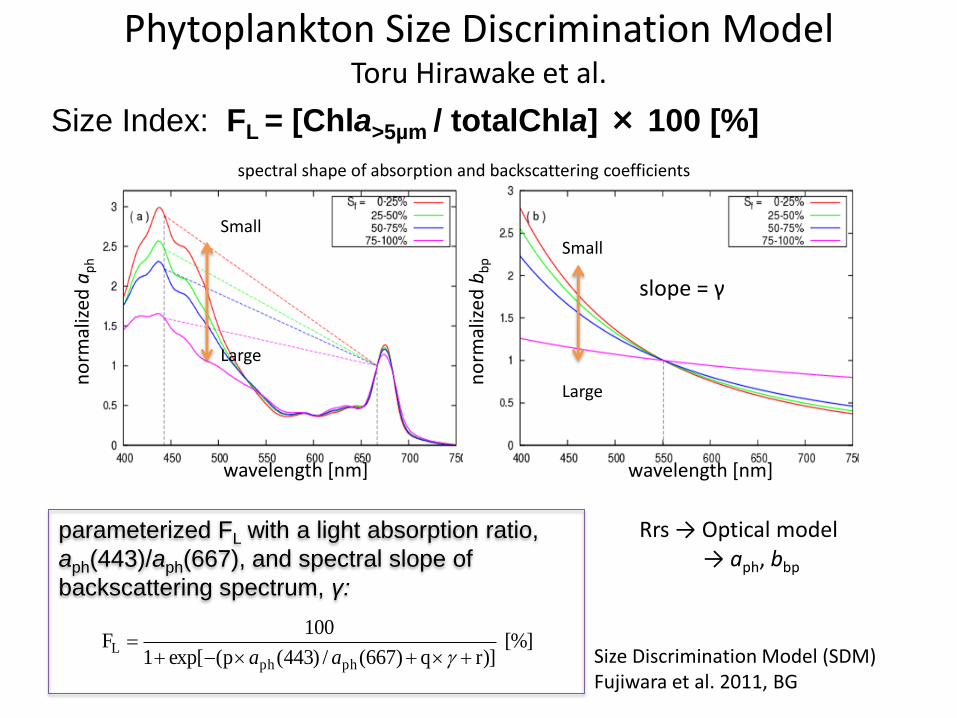
parameterized FL with a light absorption ratio,
aph(443)/aph(667), and spectral slope of
backscattering spectrum, γ:
[%] )]rq)667(/)443(p(exp[1
100F
phphL
aa Size Discrimination Model (SDM) Fujiwara et al. 2011, BG
Size Index: FL = [Chla>5µm / totalChla] × 100 [%]
no
rmal
ized
bb
p
no
rmal
ized
ap
h
wavelength [nm] wavelength [nm]
Small
Large
Large
Small
spectral shape of absorption and backscattering coefficients
Phytoplankton Size Discrimination Model Toru Hirawake et al.
Rrs → Optical model → aph, bbp
slope = γ

y = 0.5451x + 10.297 R² = 0.8372 RMSE = 14.48
y = 0.5017x + 20.955 R² = 0.8065 RMSE = 12.01
y = 0.1751x + 25.589 R² = 0.4258 RMSE = 8.81
Validation of the algorithm with in situ IOP
Toru Hirawake et al.
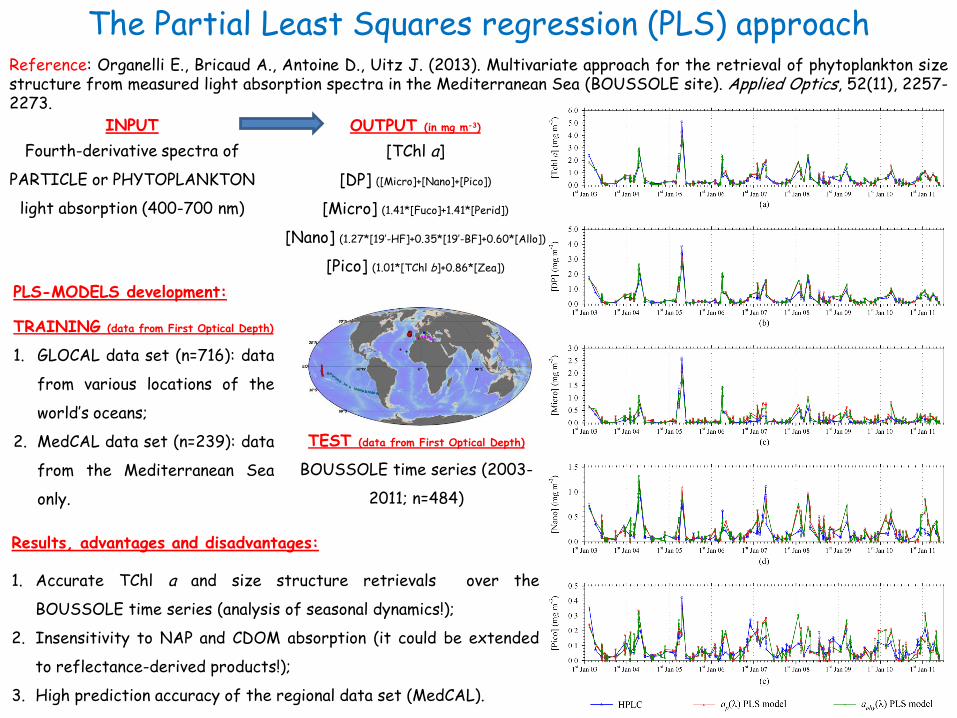
The Partial Least Squares regression (PLS) approach Reference: Organelli E., Bricaud A., Antoine D., Uitz J. (2013). Multivariate approach for the retrieval of phytoplankton size structure from measured light absorption spectra in the Mediterranean Sea (BOUSSOLE site). Applied Optics, 52(11), 2257-2273.
INPUT
Fourth-derivative spectra of
PARTICLE or PHYTOPLANKTON
light absorption (400-700 nm)
OUTPUT (in mg m-3)
[TChl a]
[DP] ([Micro]+[Nano]+[Pico])
[Micro] (1.41*[Fuco]+1.41*[Perid])
[Nano] (1.27*[19’-HF]+0.35*[19’-BF]+0.60*[Allo])
[Pico] (1.01*[TChl b]+0.86*[Zea])
TRAINING (data from First Optical Depth)
1. GLOCAL data set (n=716): data
from various locations of the
world’s oceans;
2. MedCAL data set (n=239): data
from the Mediterranean Sea
only.
TEST (data from First Optical Depth)
BOUSSOLE time series (2003-
2011; n=484)
PLS-MODELS development:
Results, advantages and disadvantages:
1. Accurate TChl a and size structure retrievals over the
BOUSSOLE time series (analysis of seasonal dynamics!);
2. Insensitivity to NAP and CDOM absorption (it could be extended
to reflectance-derived products!);
3. High prediction accuracy of the regional data set (MedCAL).

Four Phytoplankton Groups with PhytoDOAS
PFT SCIAMACHY data 2002-2012 Now: application to GOME-2 (2007-, 2012-, 2018-) Future: OMI (2004-), Sentinel-5-P, S-4, S-5 (2015-, 2019-, 2020-): daily – 7 km x 7 km pixel
Bracher et al. Biogeosciences 2009; Sadeghi et al. Ocean Science 2012
Hyperspectral SCIAMACHY/ENVISAT data: 240-2400 nm,<1 nm resol,30km x 60km
Differential Optical Absorption Spectroscopy (DOAS) at 430-530 nm:

Biomass of Four Phytoplankton Groups with PhytoDOAS Bracher et al. BG 2009; Sadeghi et al. OS 2012
Mean Chl-a Mar 2007
Diatoms Dinoflagellates
Coccolitho-
phores
Cyano-
bacteria
chl-a conc. [mg/m3]
Sensitivity tested with RTM SCIATRAN simulations: at 0.1-30 mg/m^3 chl-a within 15%
In-situ validation diatoms and cyanos: within 30%
Coccolithophore products agree well with MODIS PIC, ok with NOBM PFT, good with
RGB bloom detection
Appplication: coccolithophores (Sadeghi et al. BG 2012); cyanobacteria (Ye et al. 2012)
Spectral approach using backscatter: Particle (not phytoplankton only) size distribution
IOCS Meeting Darmstadt PFT Splinter Meeting 07.05.2013 [email protected] [email protected]

Particle Size Distribution (PSD) from Satellite
• Mie theory is used to model PSD as
a function of spectral backscatter
• The parameters of a power-law PSD
are retrieved
• Particle volumes can be partitioned
into pico-, nano- & micro-sizes
• Patterns follow expectations
Pico’s dominate oligotrophic regions
Micro’s are found only in high latitudes
& upwelling regions
• Size based approach for assessing
plankton functional type
Kostadinov, Siegel & Maritorena [2009] JGR Pico’s Nano’s
Micro’s
% of total particle volume

SeaWiFS PFT’s = f(PSD slope) Picoplankton % (0.5 mm to 2 mm)
Microplankton % (20 mm to 50 mm)
Nanoplankton % (2 mm to 20 mm)
Pico’s dominate oligotrophic
ocean (>90%)
Nano’s in transition regions
(~50%)
Micro’s only found in upwelling
zones & high latitudes (<60%)
Application: Kostadinov, Siegel and Maritorena, 2010, BG
Summary
IOCS Meeting Darmstadt PFT Splinter Meeting 07.05.2013 astrid.bracher@awi,de
Variety of approaches to get phytoplankton size class (PSC) or
functional type (PFT)
Techniques to retrieve the abundance or spectral differences of PSC
or PFTS range from
- fast and simple (abundance) versus getting direct physiological
interpretation via spectral variations
- purely empirically to purely physical (accounting for imprints of PSC
or PFTs on radiative transfer)
Most techniques shown were global
Applications of using these satellite PFTs have started, mostly for
evaluation of biogeochemical/ecosystem models, also inferring
atmospheric emissions
In order to become operational, these algorithms have to be validated,
intercompared and adaptated to new sensors in a concise way