Embed Size (px)
Citation preview
PIARC T.C. C2.1 & C2.3 Comparison of National
Road Safety Policies & Plans
Crash Analysis/Problem Definition&
Time of Return Methodology
October 2008
Larry E. TibbitsMichigan Department of Transportation
Kuala Lumpur, Malaysia
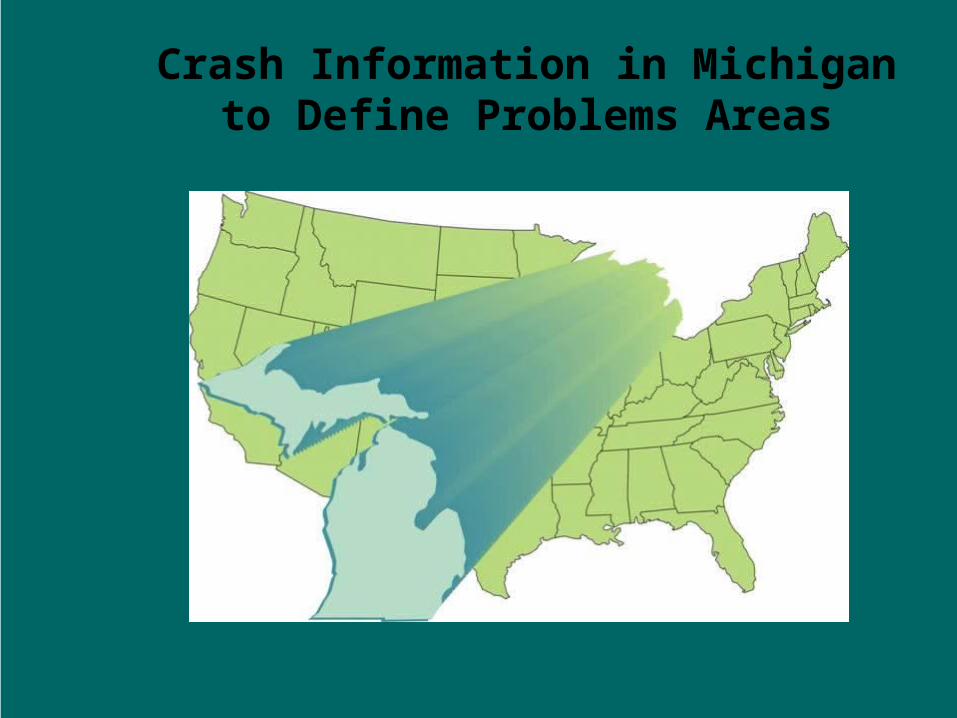
Crash Information in Michigan to Define Problems Areas
Crash Incident Documentation/ Processing
• Crash report is completed by Law Enforcement Officer
• All crashes involving injuries, and most property damage crashes must be reported
• Statewide standard crash report form (next slides)
• Paper and electronic version of crash report form
• All reports processed by Michigan State Police
• All reported crashes are located on linear and GIS based referencing systems
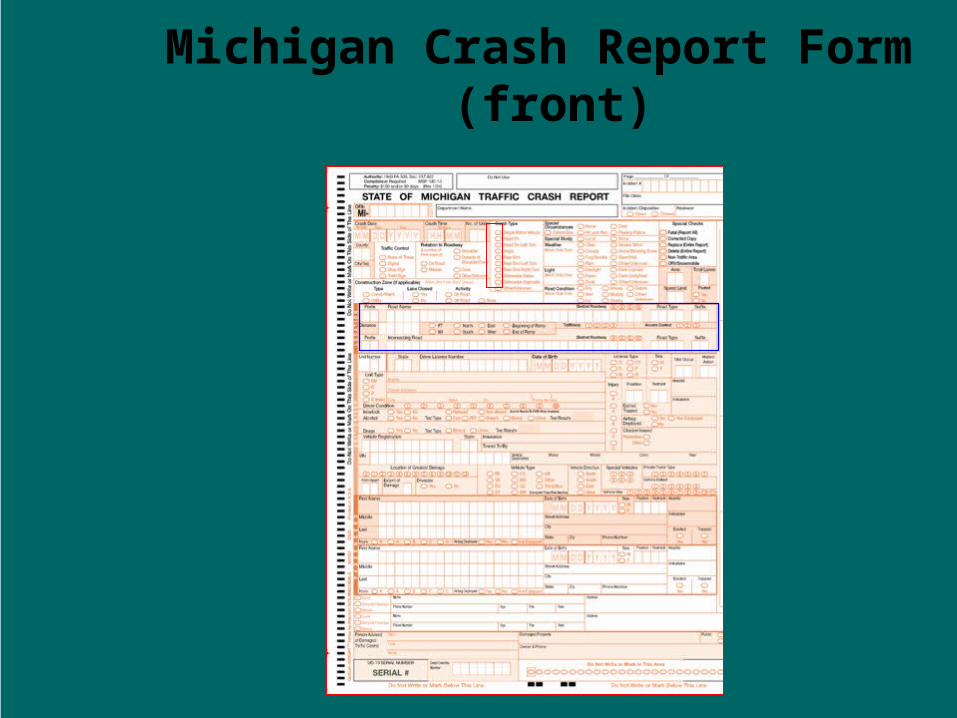
Michigan Crash Report Form (front)
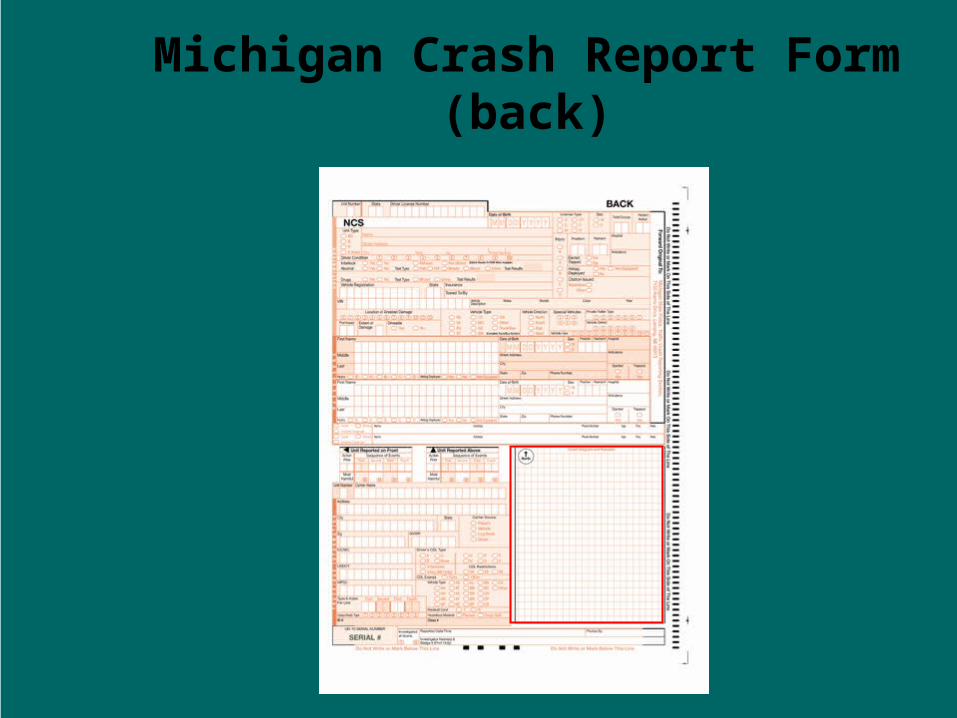
Michigan Crash Report Form (back)
Crash Processing
• Scan the form and create electronic image
• Use intelligent character recognition of written information
• Validate text data
• Attach location information
• Post crash data to crash data warehouse
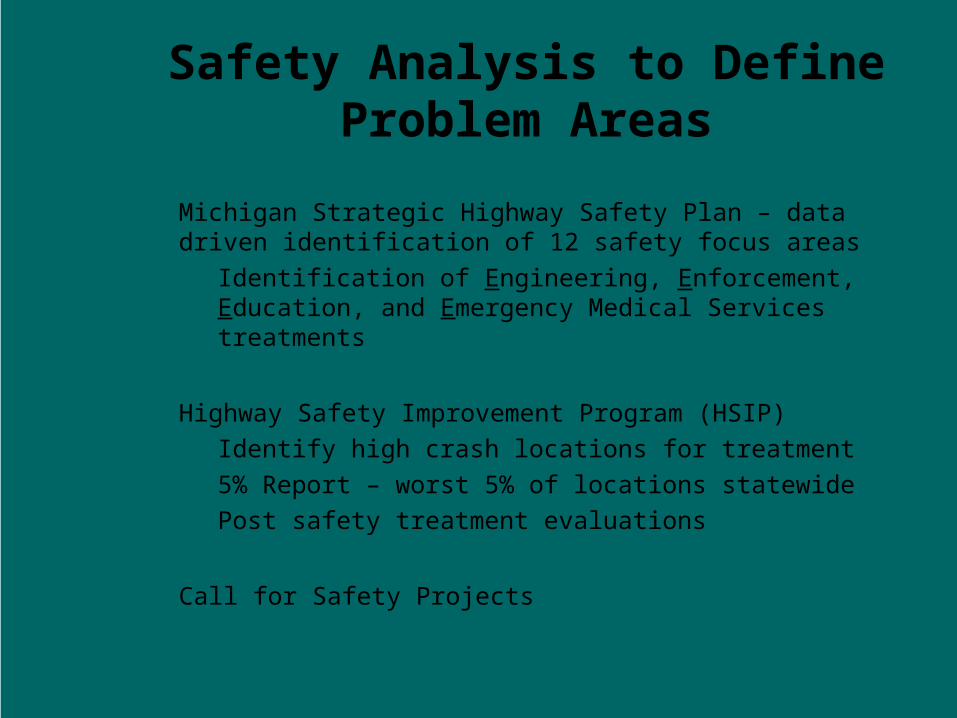
Safety Analysis to DefineProblem Areas
• Michigan Strategic Highway Safety Plan – data driven identification of 12 safety focus areas• Identification of Engineering, Enforcement,
Education, and Emergency Medical Services treatments
• Highway Safety Improvement Program (HSIP)• Identify high crash locations for treatment• 5% Report – worst 5% of locations statewide• Post safety treatment evaluations
• Call for Safety Projects
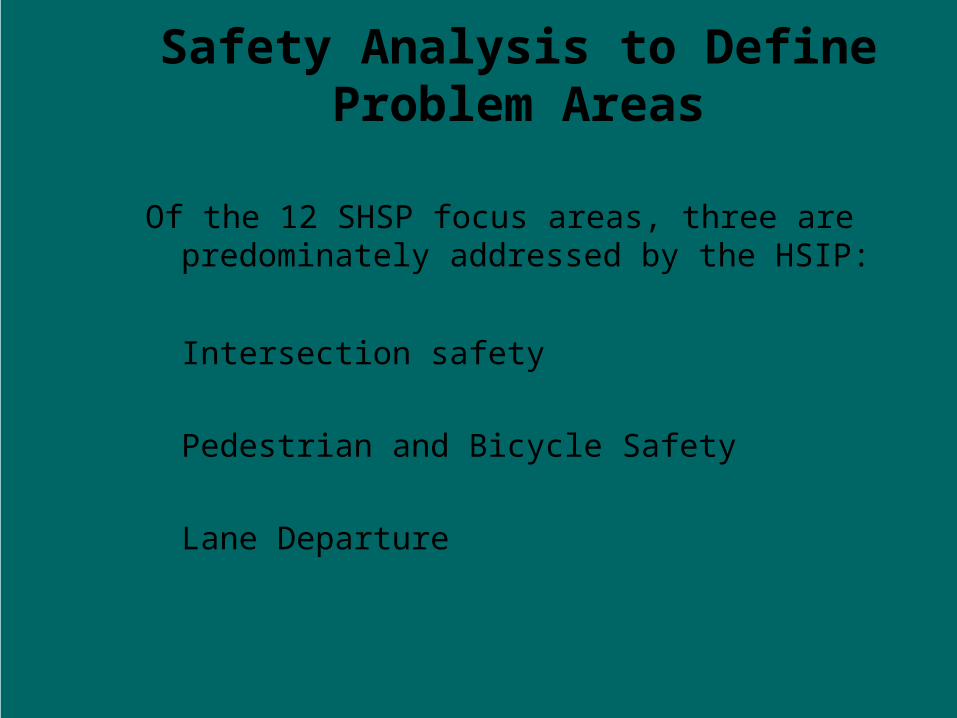
Safety Analysis to DefineProblem Areas
Of the 12 SHSP focus areas, three are predominately addressed by the HSIP:
• Intersection safety
• Pedestrian and Bicycle Safety
• Lane Departure
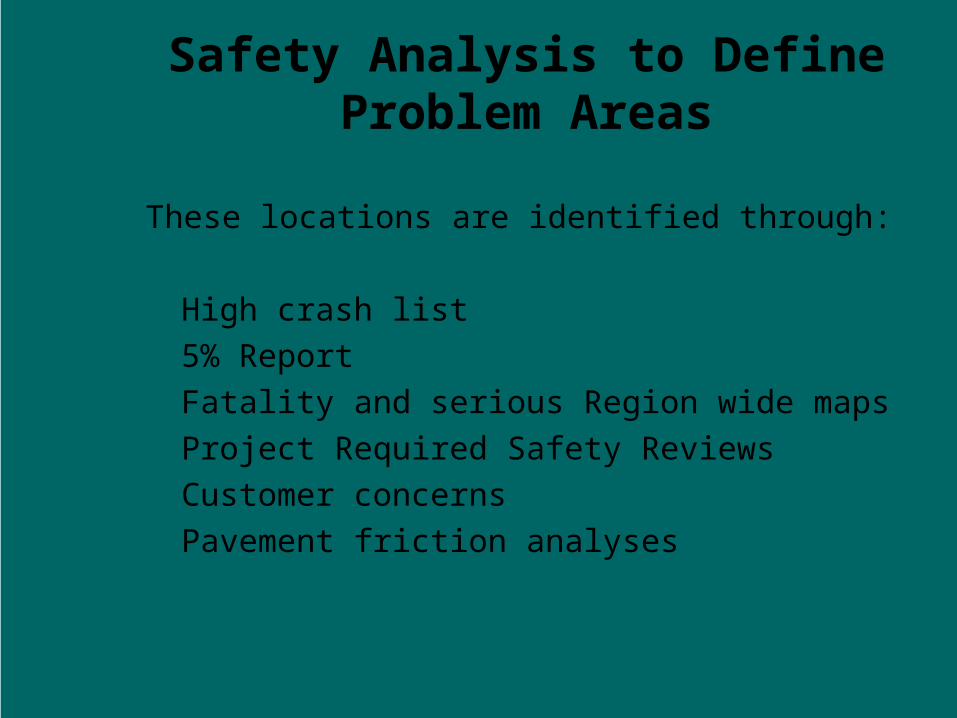
Safety Analysis to DefineProblem Areas
These locations are identified through:
• High crash list• 5% Report• Fatality and serious Region wide maps• Project Required Safety Reviews• Customer concerns• Pavement friction analyses
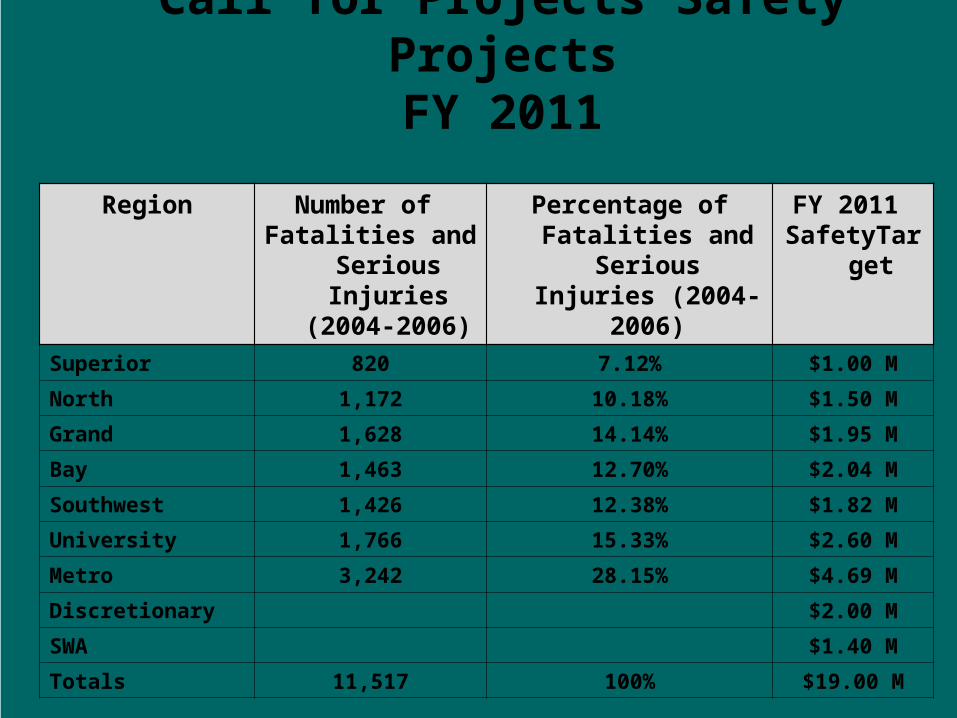
Call for Projects Safety ProjectsFY 2011
Region Number of Fatalities and Serious Injuries
(2004-2006)
Percentage of Fatalities and Serious Injuries
(2004-2006)
FY 2011 SafetyTarget
Superior 820 7.12% $1.00 M
North 1,172 10.18% $1.50 M
Grand 1,628 14.14% $1.95 M
Bay 1,463 12.70% $2.04 M
Southwest 1,426 12.38% $1.82 M
University 1,766 15.33% $2.60 M
Metro 3,242 28.15% $4.69 M
Discretionary $2.00 M
SWA $1.40 M
Totals 11,517 100% $19.00 M
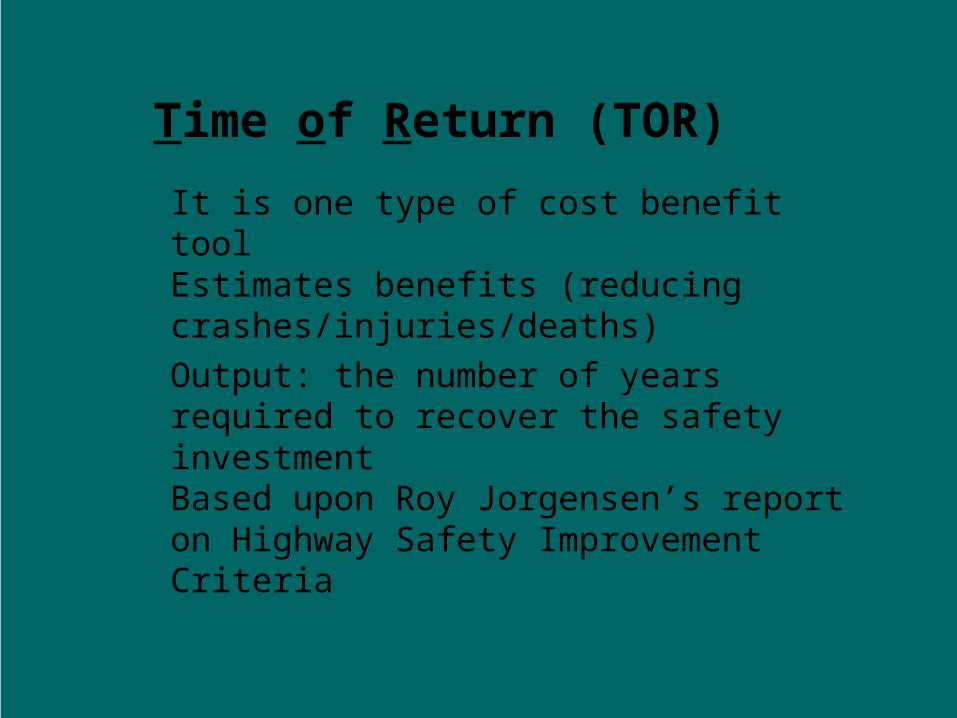
Time of Return (TOR)
• It is one type of cost benefit tool• Estimates benefits (reducing
crashes/injuries/deaths)• Output: the number of years required
to recover the safety investment• Based upon Roy Jorgensen’s report
on Highway Safety Improvement Criteria
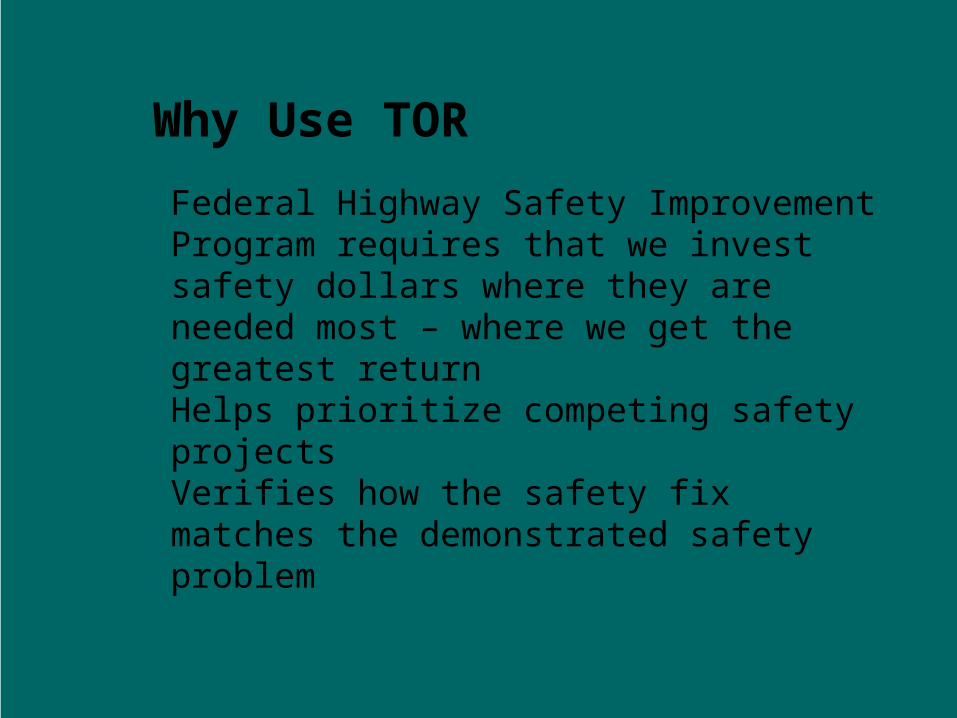
Why Use TOR
• Federal Highway Safety Improvement Program requires that we invest safety dollars where they are needed most – where we get the greatest return
• Helps prioritize competing safety projects
• Verifies how the safety fix matches the demonstrated safety problem
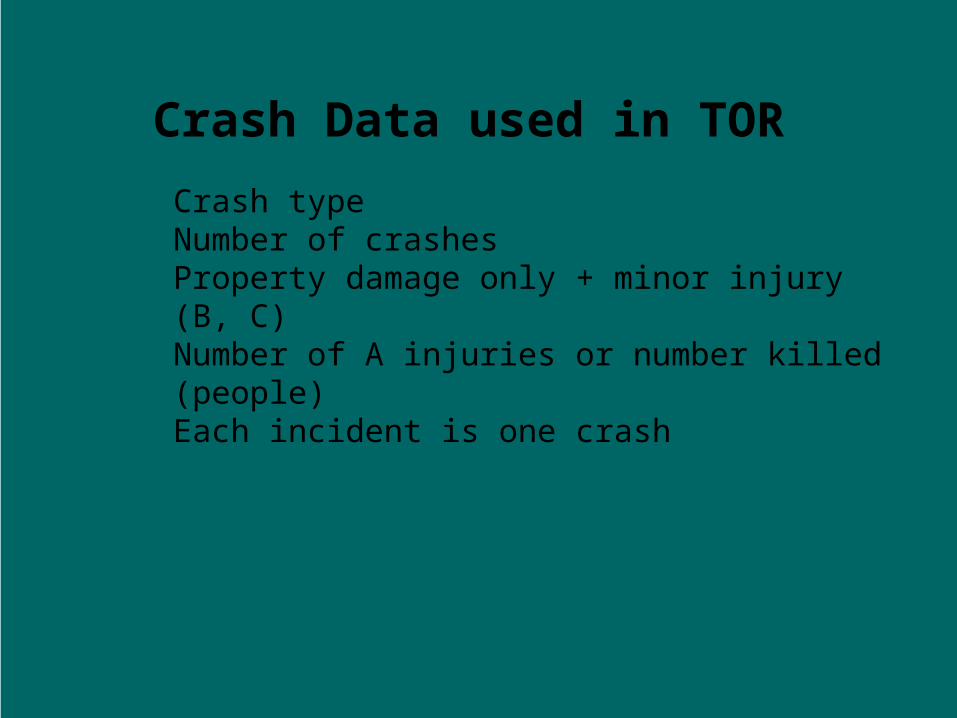
Crash Data used in TOR
• Crash type• Number of crashes• Property damage only + minor injury (B, C)• Number of A injuries or number killed
(people)• Each incident is one crash
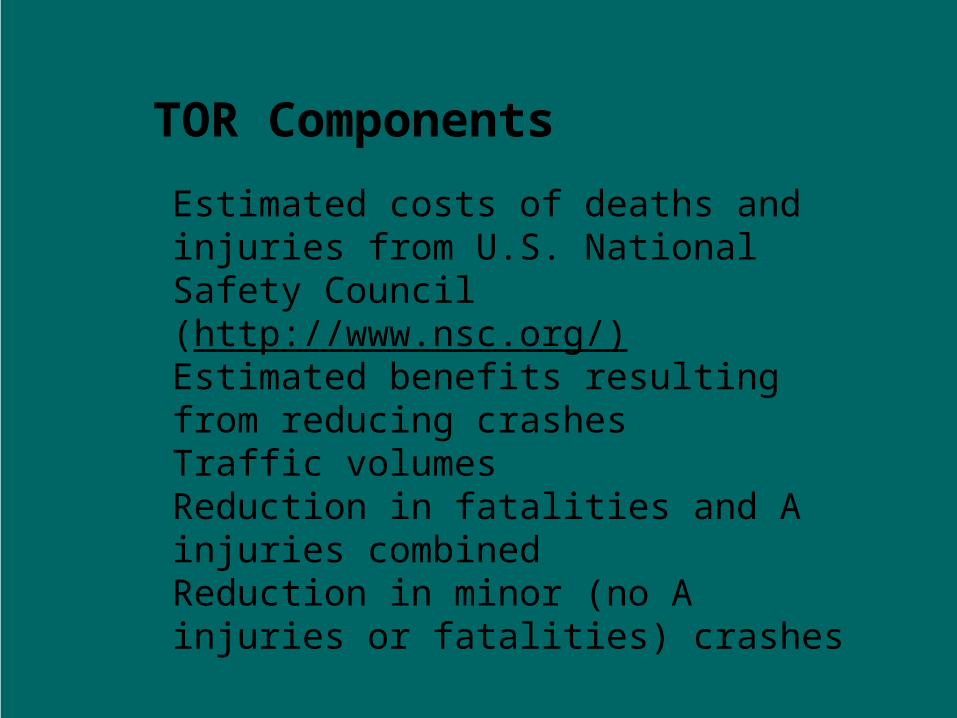
TOR Components
• Estimated costs of deaths and injuries from U.S. National Safety Council (http://www.nsc.org/)
• Estimated benefits resulting from reducing crashes
• Traffic volumes• Reduction in fatalities and A injuries
combined• Reduction in minor (no A injuries or
fatalities) crashes
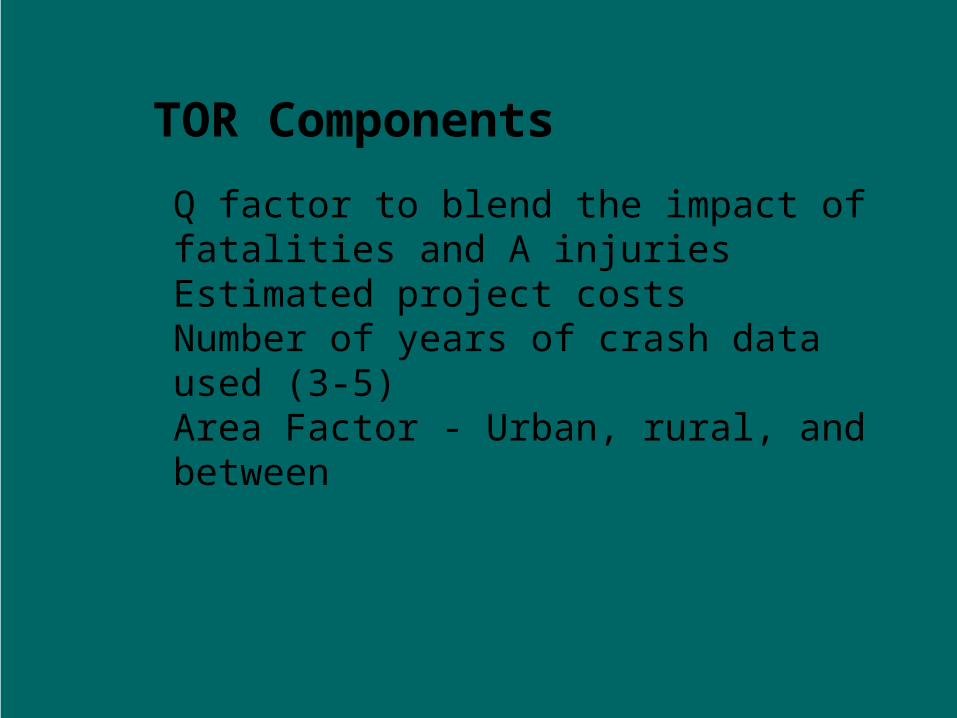
TOR Components
• Q factor to blend the impact of fatalities and A injuries
• Estimated project costs• Number of years of crash data used
(3-5)• Area Factor - Urban, rural, and
between
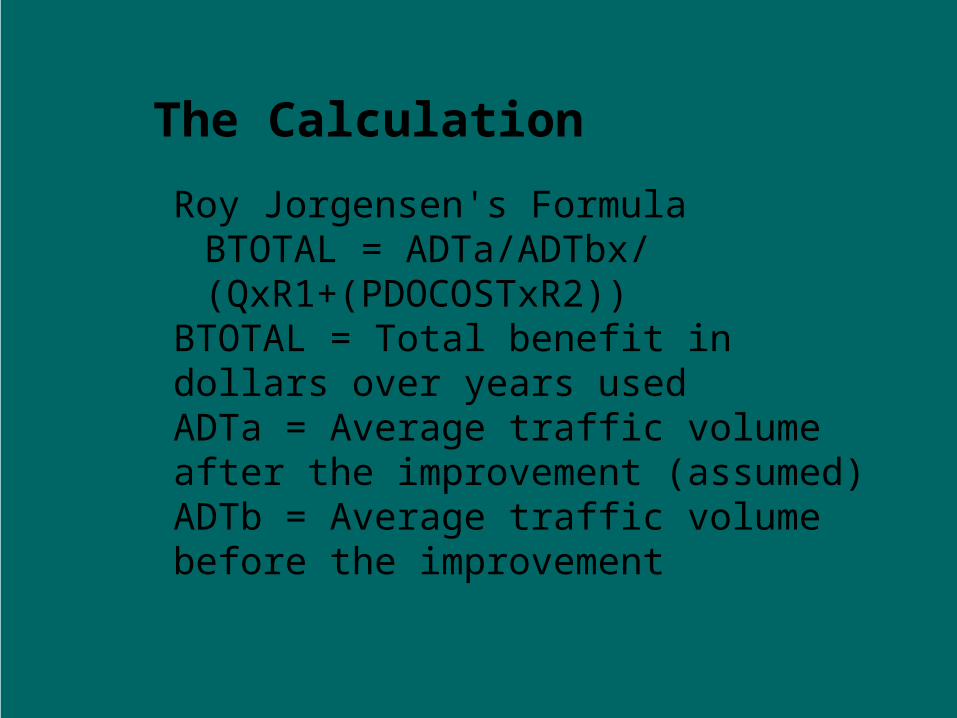
The Calculation
• Roy Jorgensen's Formula BTOTAL = ADTa/ADTbx/ (QxR1+(PDOCOSTxR2)) • BTOTAL = Total benefit in dollars
over years used• ADTa = Average traffic volume after
the improvement (assumed)• ADTb = Average traffic volume
before the improvement
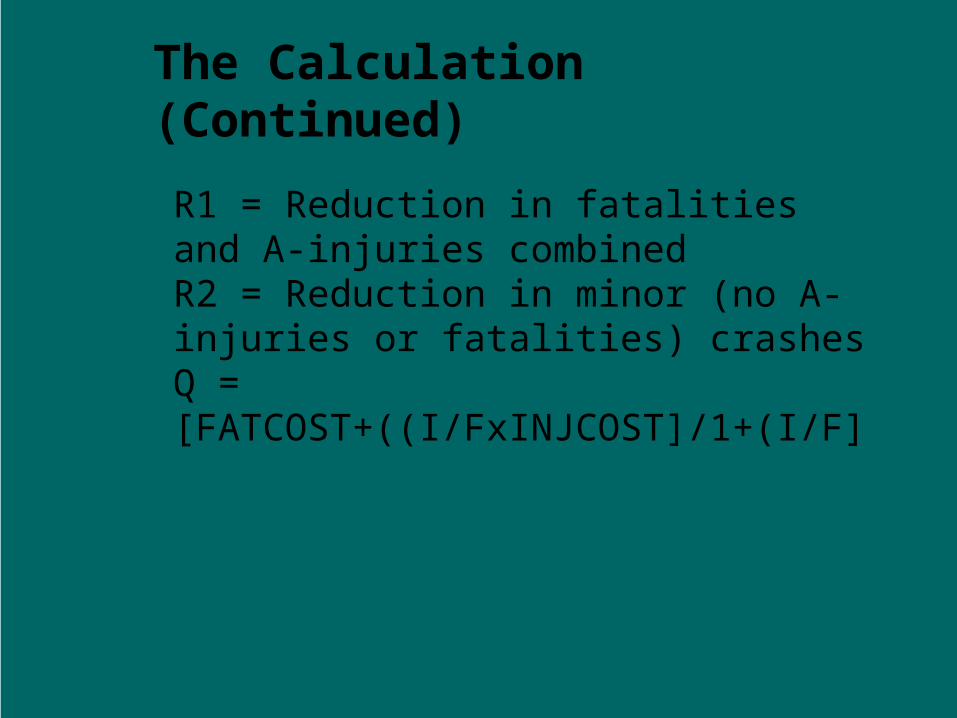
The Calculation (Continued)
• R1 = Reduction in fatalities and A-injuries combined
• R2 = Reduction in minor (no A-injuries or fatalities) crashes
• Q = [FATCOST+((I/FxINJCOST]/1+(I/F]
Summary
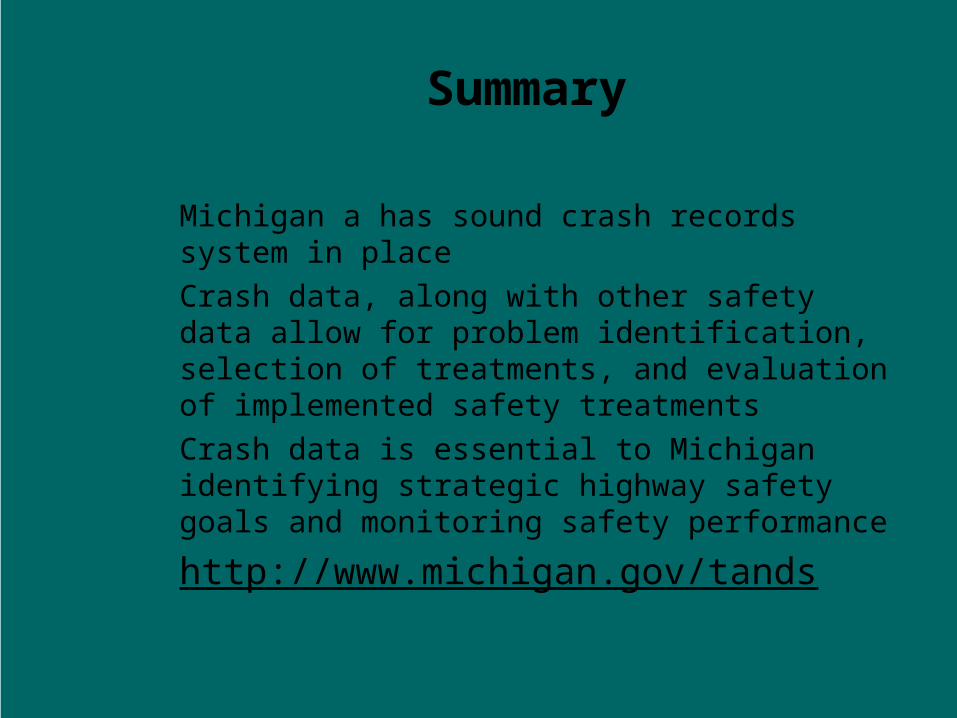
• Michigan a has sound crash records system in place
• Crash data, along with other safety data allow for problem identification, selection of treatments, and evaluation of implemented safety treatments
• Crash data is essential to Michigan identifying strategic highway safety goals and monitoring safety performance
• http://www.michigan.gov/tands