Embed Size (px)
Citation preview

Guy Fernando 1 v1.01, 14/10/2015
PIC Optical Spectrum Analyser Guy Fernando has presented his design for a practical working optical spectrum analyser. Having previous worked with these instruments 25 years ago, he thought it time to investigate creating a spectrum analyser that can easily and cheaply be constructed using readily available components.
The optical spectrometer is an instrument used to measure properties of light over a specific portion of the electromagnetic spectrum, typically used in spectroscopic analysis to identify materials, and in spectroscopy for producing spectral lines and measuring their wavelengths and intensities. Professional optical spectrum analysers, also known as spectrometers or monochromators are mostly prohibitively expensive, and often out of reach of the humble experimenter. However it is possible to construct a respectable visible range spectrometer from cheaply available optics, and electronic components. This document
aims to describe the means to build such a device. It is hoped that the open nature of this design will inspire others to add and extend to the design and functionality contained within.
The Optics The main objective was to design a spectrometer with no moving parts and for it to be powered and operated solely by the attached host computer via its USB port, with accompanying application software to provide both spectral and colour analysis. A solid state spectrometer typically uses mirrors or lenses to collimate and focus the light rays under measurement, and a prism or diffraction

Guy Fernando 2 v1.01, 14/10/2015
grating to refract and split the light into its constituent colours. A linear light sensitive device such as a CCD or CMOS detector is typically used to convert the projected spectrum into an electrical signal. The most expensive parts in a spectrometer are the detector, mirrors and diffraction gratings, which can each run into thousands of GPB depending on their quality and performance.
Figure 1 - Layout of Optics
Linear detectors specifically produced for this application with high sensitivity, linearity and optimised for spectrometers do of course exist, but they too run into hundreds of GPB. For this reason it was decided to opt for the modestly priced mass produced alternative as used in bar code readers and image scanners. The author decided to use a Sony ILX518K CCD detector salvaged from an old scanner. Although this spectrometer uses this particular Sony detector, there are provisions in the design to allow other detector to be
used, depending on the reader's requirement and how deep their pocket.
To keep the overall cost down, it was decided early on that lenses be used in favour of relatively expensive mirrors. Normal optical glass attenuates UV light transferring through. This limits the working range of the spectrometer to within the visible spectrum 350nm - 750nm, but since most experimental work is conducted in the visible range this was not considered a too much of a handicap. In the past sourcing a diffraction grating without braking the bank could pose a problem. But with the rise of mass produced holographic sheets, it is possible to source highly efficient embossed gratings housed in 35mm slides very cheaply. Despite their inexpensiveness, these gratings produce minimal stray light and have adequate linear efficiency across the optical spectral range. The dispersion angle range caused by diffraction for light at the extreme ends of the spectrum can be calculated using the following equation.
θ = sin
Where m = nth order (first order = 1) λ = wavelength d = distance between grating lines θ = angle of diffraction
For near infrared light at 750nm the angle is
θr = sin 1.750e-91e-6 = 48.6° For near ultraviolet light at 350nm the angle is
θb = sin 1.350e-91e-6 = 20.5° The dispersion angle range and the detector window width determine the focusing distance between the detector and the focusing lens. For the Sony ILX518K detector with a light sensitive window of 37.1mm, the

Guy Fernando 3 v1.01, 14/10/2015
focusing distance was found to be around 80mm. Although this distance is less than the 100mm focal length of the focusing lens, spectrum images falling on the detector were found to appear sharp and in focus.
The remaining optical hardware including the entrance slit, lens, grating and detector holders are made from items that are generally easily available either from the local hardware store or for purchase over the internet.
The first baffle, Baffle 1 blocks out any stray light from the entrance slit hitting the CCD detector. It should be positioned such that light from the entrance slit to the collimating lens should not be impeded. The second baffle, Baffle 2 diffuses the central zero-th and left nth order diffractions that would without the use of a baffle add to the overall background light level in the spectrometer. These baffles should be positioned to minimise the described effects.

Guy Fernando 4 v1.01, 14/10/2015
The Electronics The electronics is separated into three sections namely the microcontroller, power supply, and detector head section. The author selected a Microchip based microcontroller as
he has much experience working with this microcontroller manufacturer. The chosen PIC18F14K50 has the required inbuilt USB, SPI, ADC and I/O modules for interfacing with a host computer, reading and writing to external static RAM, and the acquisition/control crucial for reading the CCD pixel data. See Figure 2 - Microcontroller and Memory Schematic Diagram. Unfortunately as there is insufficient RAM within the microcontroller to store the acquired CCD pixel data and to run the firmware, external static memory chip 23LC1024 is used to store the acquired spectrum. When the firmware receives a READ_SPECTRUM USB command
from the host computer, the stored spectrum is streamed out to the host computer. (Note the serial debug interface is only used for debugging the firmware during development and does not affect the operation the
spectrometer.)
As the CCD detector requires a 12v supply to operate, the 5v USB power supply is stepped up using a standard boost converter as shown in Figure 3 - Boost Schematic Diagram.
Figure 2 - Microcontroller and Memory Schematic Diagram

Guy Fernando 5 v1.01, 14/10/2015
Figure 3 - Boost Schematic Diagram
The detector head is a separate PCB on a flying lead connector, which houses the CCD device and analogue signal conditioning electronics as shown in Figure 4 - Detector Head Schematic Diagram.
The single rail CA3140 op-amp is used to combine the R, G, and B colour pixels from the CCD and invert the signal such that increasing intensities result in a positive swing from the op-amp output. The two preset potentiometers VR1 and VR2 provide RGB
offset and RGB gain control respectively.
Figure 4 - Detector Head Schematic DiagramFigure 4 - Detector Head Schematic Diagram
Guy Fernando 6 v1.01, 14/10/2015
The Firmware The firmware implementation for the PIC18F14K50 microcontroller is fairly straightforward in that it is designed to receive one of the following USB commands and initiate an action based on that command. ACQUIRE_SPECTRUM READ_SPECTRUM GET_VERSION GET_SERIAL_NUMBER RESET
The ACQUIRE_SPECTRUM command clocks out every pixel from the CCD device and places the corresponding converted analogue pixel light level into storage in SRAM. The READ_SPECTRUM command can then be issued to transfer the stored pixel light level values in blocks of 64 bytes (or 32 10bit values). The other USB commands are fairly self explanatory; GET_VERSION receives the version of the firmware, GET_SERIAL_NUMBER receives the unique serial number of the spectrum analyser, and RESET resets the spectrum analyser by resetting the microcontroller.
The firmware can be downloaded from the author's website.
The Application Software The application software currently runs on Windows (XP, Vista, 7, 8 and 10). Depending on how well the project is received, the application may later be ported to Apple and Android operating systems in the not too distant future.
The software is used to acquire and view incoming real time spectral data from the attached spectrometer device. Once set to acquire, the real time data is displayed and refreshed once a second. The acquisition can be stopped at any time to freeze the spectrum
for closer inspection, or saved as a binary document for later analysis or as a means of archiving spectra.
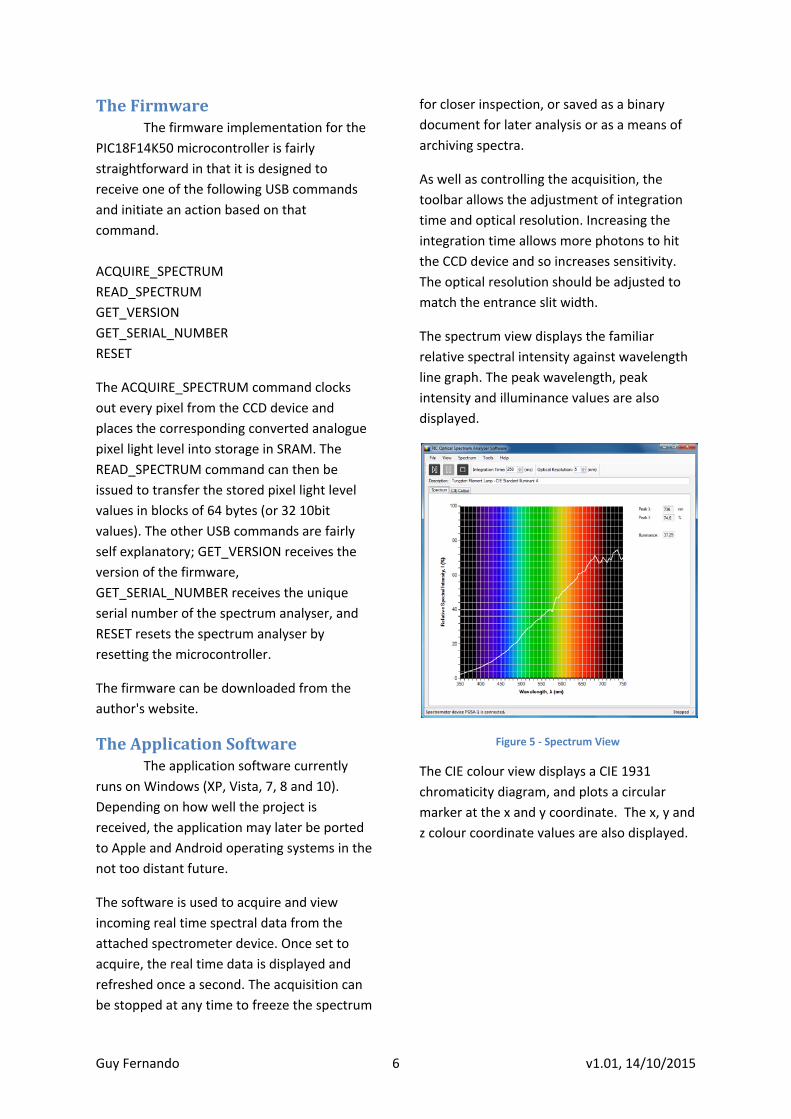
As well as controlling the acquisition, the toolbar allows the adjustment of integration time and optical resolution. Increasing the integration time allows more photons to hit the CCD device and so increases sensitivity. The optical resolution should be adjusted to match the entrance slit width.
The spectrum view displays the familiar relative spectral intensity against wavelength line graph. The peak wavelength, peak intensity and illuminance values are also displayed.
Figure 5 - Spectrum View
The CIE colour view displays a CIE 1931 chromaticity diagram, and plots a circular marker at the x and y coordinate. The x, y and z colour coordinate values are also displayed.

Guy Fernando 7 v1.01, 14/10/2015
Figure 6 - CIE Colour View
Prior to use, the spectrometer must be calibrated both in terms of wavelength calibration and intensity. The application software incorporates functions to perform these calibration steps, and is outlined in the Software Calibration section below.
The application software can be downloaded from the author's website.
Parts List
R1,R2,R3,R5 4 10k Resistor. R4 1 4k7 Resistor. R7,R8 2 100R Resistor. R9 1 1R Resistor. R11 1 1k Resistor. R10 1 220R Resistor. R12 1 8k2 Resistor. VR1 1 10k Resistor Trimmer. VR2 1 1k Resistor Trimmer. C1,C2,C6 3 100n Capacitor. C3,C4 2 15p,Capacitor. C7 1 220u Electrolytic Capacitor. C5 1 470n Capacitor. C8 1 470p Capacitor. L1 1 50uH Inductor. D1 1 1N4148 Diode. D2 1 1N5817 Diode. U1 1 PIC18F14K50 Microcontroller. U2 1 23LC1024 1Mbit SPI Serial SRAM. U3 1 CA3140E Op-Amp. U4 1 ILX518K Sony 5363-pixel x 3 line CCD Linear Detector. U5 1 MC34063 Buck/Boost IC. Y1 1 12MHz Crystal. H1 1 5 Way Molex Male Header. H2 1 3 Way Molex Male Header. P1 1 USB Type A Plug Lead. 1 35mm Slide Holder. 2 Razor Blades. 1 Diffraction Grating Slide 1000 lines/mm 2 Half-Size Lenses Plano-Cylindrical - +10. 1 Enclosure, 200x300x80mm. 1 Black Self Adhesive Hook & Loop Tape 20mm x 1M. 1 Aerosol Black Chalkboard Spray Paint 250ml. Also some other hardware, see text for information.

Guy Fernando 8 v1.01, 14/10/2015
Construction Both the main and detector boards are constructed on copper strip board as shown in Figure 7 - Microcontroller and Memory Board and Figure 8 - Detector Head Board. As the construction of these boards is not too critical it is left up to the reader to layout the components on the boards, although it is advised to loosely follow the layout as shown in the pictures.
The interconnecting lead between boards should be kept as short as possible.
Figure 7 - Microcontroller and Memory Board
Referring to Figure 8 - Detector Head Board shows the CCD partially covered with black insulating tape. This was done to reduce internal light scattering as there are reflective surfaces within the CCD device itself.
Figure 8 - Detector Head Board
The spectrometer can be housed in any suitable enclosure with dimension at least 300mm wide, 200mm long and 80mm high. The minimum size of the enclosure is dictated by the optical geometry and height of the optics. The half size 10 dioptre lenses have a focal length of 100mm and most of the optical components have a height of 50mm which essentially define the minimum length and minimum height of the enclosure.
Figure 9 - Spectrometer Top View
To make the optical mounts, the author used plastic tabs found on foolscap suspension files. These were cut to size and used to hold the entrance slit, the diffraction grating and the baffle slides. Integrated circuit tube holders were also cut and used to hold the lenses. The plastic tabs and IC holders were bonded using epoxy resin to small plastic stands made from cutting pieces of flat plastic plate. These items were already in the author's junk box. Of course the reader can choose anything they have to hand to make similar holders for the optical components.

Guy Fernando 9 v1.01, 14/10/2015
Figure 10 - Spectrometer Front View
All the optics can sourced directly from suppliers except for the entrance slit. To achieve spectrum resolutions of around 1nm, it is essential that the entrance slit width be adjusted to about 100 microns. It is possible to construct such a slit from two razor blades, some insulating tape and a plastic 35mm slide frame. Cover both sides of a razor blade in black insulating tape such that all is covered except for the cutting edge. Do this for the other blade. Then open the slide frame and insert both blades such that the razor edges face each other and then snap shut the slide frame again. The slit width can be adjusted by applying gentle pressure while holding the two sides of the gap between finger and thumb.
A hardboard base is screwed down to the enclosure, on to which the electronic boards are attached. The optical components and their mounts are also attached to the hardboard base, but using hook and loop tape (Velcro). This allows the optics to be repositioned easily during alignment, while
still giving adequate rigidity and stability of the optics during use. The furry side of the tape is attached to the hardboard and the hook and loop side to the components. To reduce internal light scattering, the inside of the enclosure, the hardboard base and the various optical holders were sprayed matt black using black chalkboard spray paint.
Figure 1 - Layout of Optics shows the rough placing of the optical components. The fine positioning of which will be adjusted during optical alignment described in the next section.
Optical Alignment The purpose of optical alignment is to initially arrange the optics such that desired range of wavelengths is incident on the detector, the light hitting the detector is in focus, and stray light is minimised. Accurate calibration is carried afterwards using the application software to precisely calibrate the wavelength and intensity.
First ensure that the optics are roughly positioned as shown in Figure 1 - Layout of Optics, and the entrance slit width is set to around 0.5mm to allow sufficient light to enter. Cut a small piece of white paper which is sticky on one side (such as a post-t note) so it just covers the whole CCD window opening.
Alignment is best carried out in a darkened room using a small white led torch, and if available a red and blue laser pen. Shine the light from the led torch into the entrance slit and move the detector head board sideways such that the whole visible spectrum produced falls on and in the centre of the CCD device. Then move the detector head board backwards or forwards in relation to the focusing lens to get the sharpest spectral lines produced by the led torch. Try moving the focusing lens and the collimating lens slightly in relation to the diffraction grating to further

Guy Fernando 10 v1.01, 14/10/2015
improve the clarity of the spectral lines. With a little care and patience the optics can be adjusted to give an optical resolution of 1nm.
Software Calibration First remove the sticky sided paper
from the CCD device. Plug in the spectrometer into a host computer and launch the application software. Once the application software has recognised that the spectrometer has been plugged in, set the integration time to 250ms and the optical resolution to 5nm on the toolbar.
Begin acquiring spectra. Cover up the entrance slit so that no light enters, and adjust VR1 (RGB offset) such that the noise floor is just visible at the bottom of the spectrum graph. Now shine a bright light source into the entrance slit, such that the peak is clipped at the top of the spectrum graph. Adjust VR2 (RGB gain) such that the flat top of the peak is just visible.
Adjust the entrance slit width to around 100 microns. There are now three software calibration stages that must be completed in succession before the spectrometer is fully calibrated. First the inherent CCD device dark current must be nullified, after which the spectrometer can be calibrated for wavelength accuracy. Finally the spectrometer can be intensity calibrated to normalize the CCD device’s varying sensitivities to differing wavelengths, so that radiometric measurements are linear across the wavelength range of the spectrometer.
Calibration is actually performed by clicking through each of the calibration menu options (Spectrum | Tools | Calibrate) and following the on screen procedures. Once all the calibration stages have been completed, click on the 'Save Calibration' menu option.
Conclusion It is certainly possible to construct a respectively well performing spectrometer from readily available cheap components for only a fraction of the cost of most commercially available spectrometers.
The author has so far successfully used the spectrometer to determine the colour variation in a batches of LEDs, chemical analysis using Raman spectroscopy, and for detecting the absorption lines from sunlight.
As already mentioned, the Sony ILX518K CCD device used was pulled from an old scanner and is not specifically intended primarily for use in spectroscopy. As a result the spectrometer is prone to lacking sensitivity especially when using narrow slit widths. The sensitivity of course can be improved by increasing the integration time setting from the application software.
The half second spectrum update rate is about the best that can be achieved with the current hardware. However by using a faster ADC converter, using local memory instead of external memory, and improving the USB data transfer, a better update rate could be achieved.
It is expected that by replacing the current CCD and microcontroller to higher performance parts in the next version, these limitations will be improved upon.


![Chapter 1: Diode circuits vtusolutionvtusolution.in/uploads/9/9/9/3/99939970/analog_electronic[15ec32].pdf · Chapter 1: Diode circuits ... • Diode testing • Zener diode • Diode](https://img.pdfslide.net/doc/110x75/5aedefea7f8b9a9031905d54/chapter-1-diode-circuits-vt-15ec32pdfchapter-1-diode-circuits-diode.jpg)