Embed Size (px)
Citation preview
Picking the Best Funds and ETFs
Using AmiBroker to Evaluate Fund Selec;on For When the Market Takes its Next Dive
Bob Krishfield
WCCC Sept 25, 2012
What I Plan to Show
• Selec;on Process Steps – Build List of Funds, ETFs, CEFs – Screen out Leveraged, $1M Ini;al Buy, Age – Screen on Performance and Rela;ve Strength – Screen by Up and Down Markets
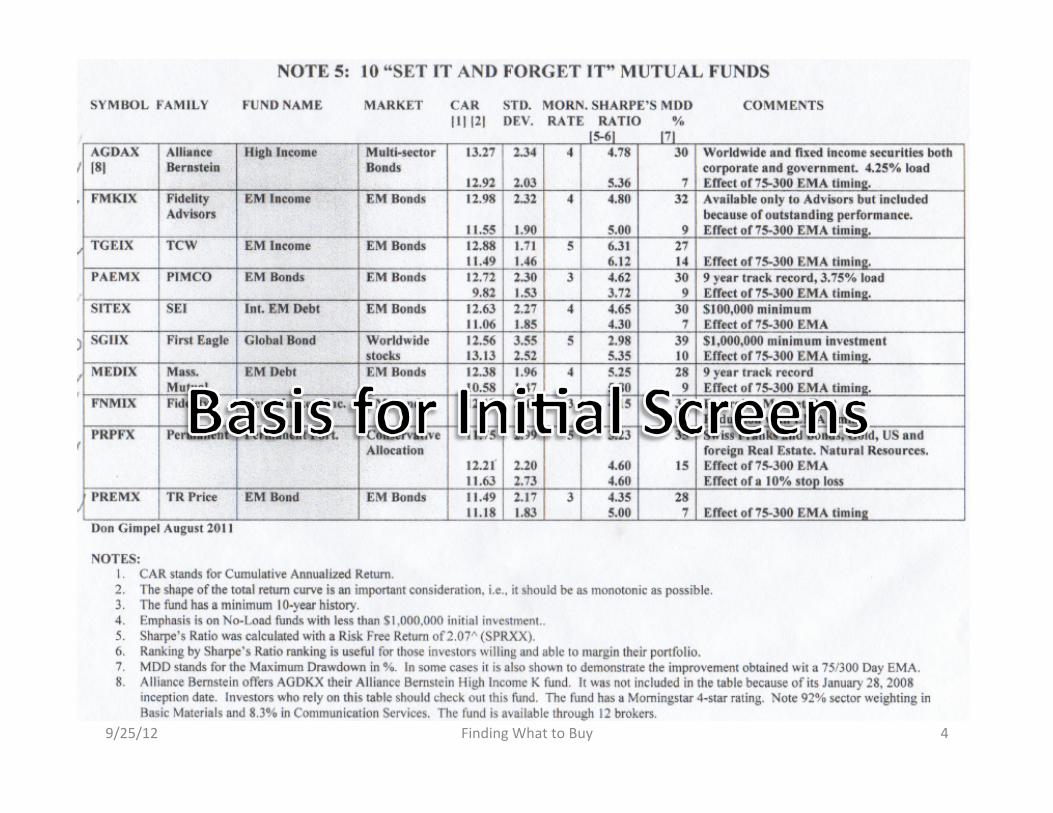
• Apply the Process using AmiBroker – Review Don Gimpel’s “Set & Forget Funds” – Look at Other Funds that Pass & Rank – View Charts for What the Stats Don’t Show
9/25/12 Finding What to Buy 2
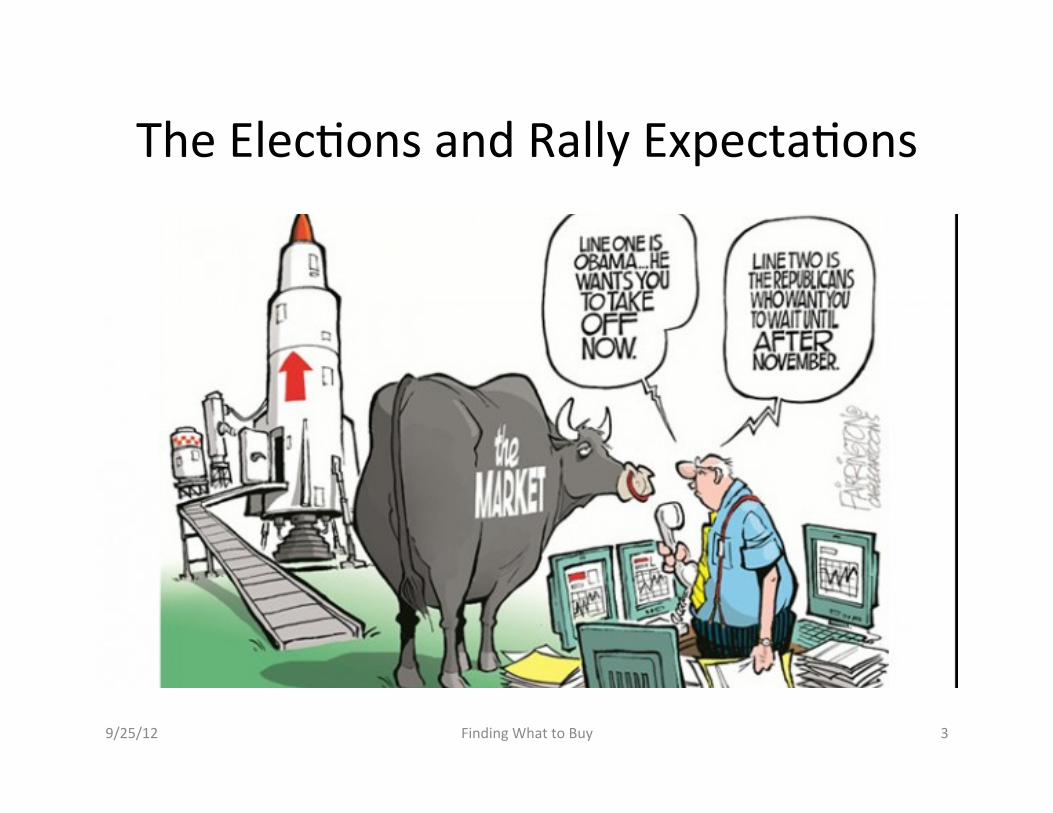
The Elec;ons and Rally Expecta;ons
9/25/12 Finding What to Buy 3
9/25/12 Finding What to Buy 4
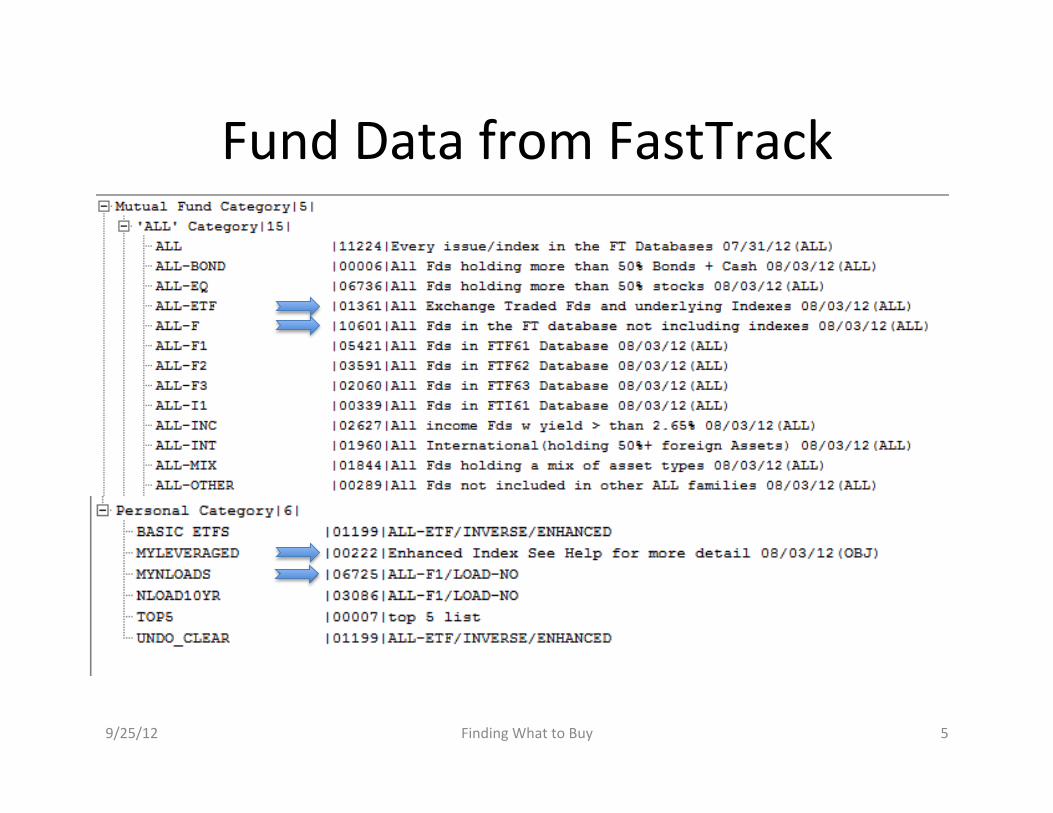
Fund Data from FastTrack
9/25/12 Finding What to Buy 5
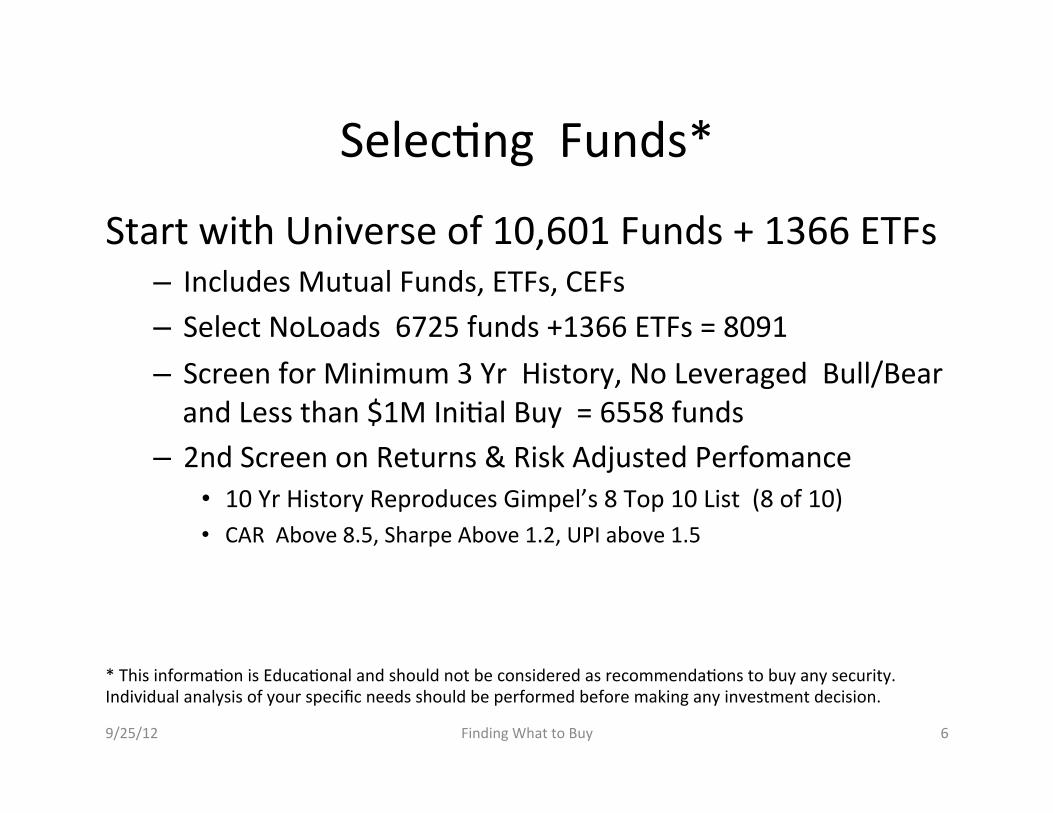
Selec;ng Funds*
Start with Universe of 10,601 Funds + 1366 ETFs – Includes Mutual Funds, ETFs, CEFs – Select NoLoads 6725 funds +1366 ETFs = 8091 – Screen for Minimum 3 Yr History, No Leveraged Bull/Bear and Less than $1M Ini;al Buy = 6558 funds
– 2nd Screen on Returns & Risk Adjusted Perfomance • 10 Yr History Reproduces Gimpel’s 8 Top 10 List (8 of 10) • CAR Above 8.5, Sharpe Above 1.2, UPI above 1.5
9/25/12 Finding What to Buy 6
* This informa;on is Educa;onal and should not be considered as recommenda;ons to buy any security. Individual analysis of your specific needs should be performed before making any investment decision.
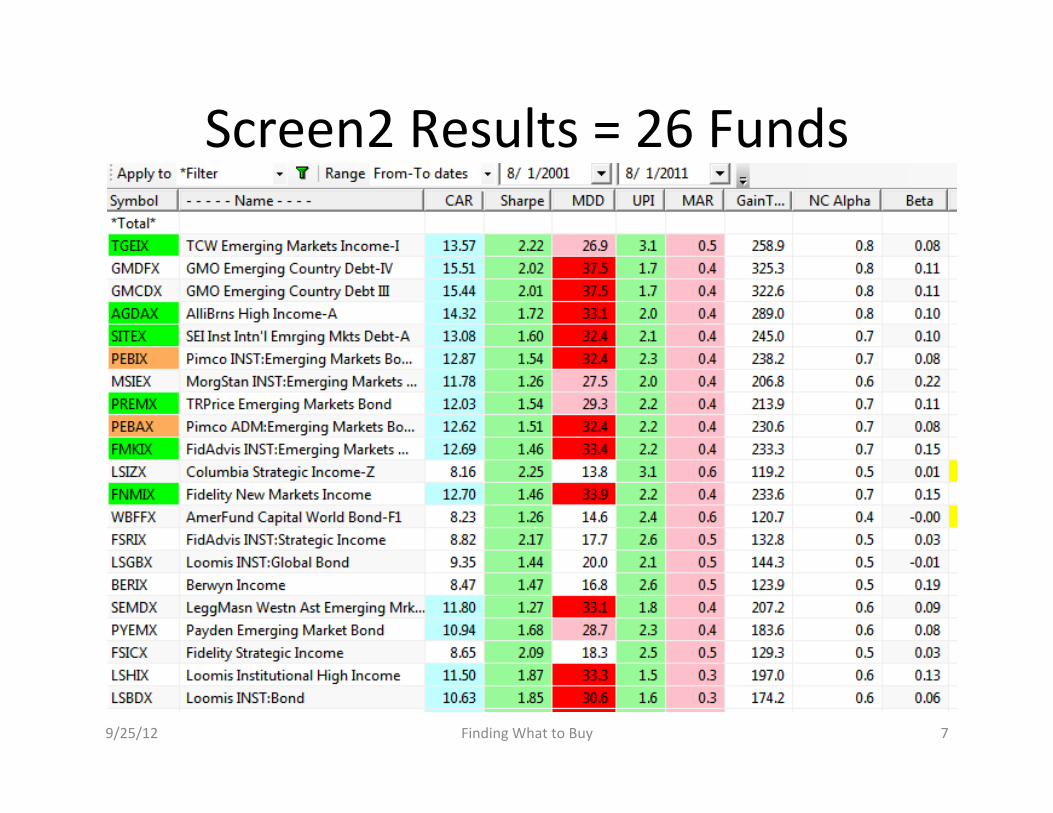
Screen2 Results = 26 Funds
9/25/12 Finding What to Buy 7
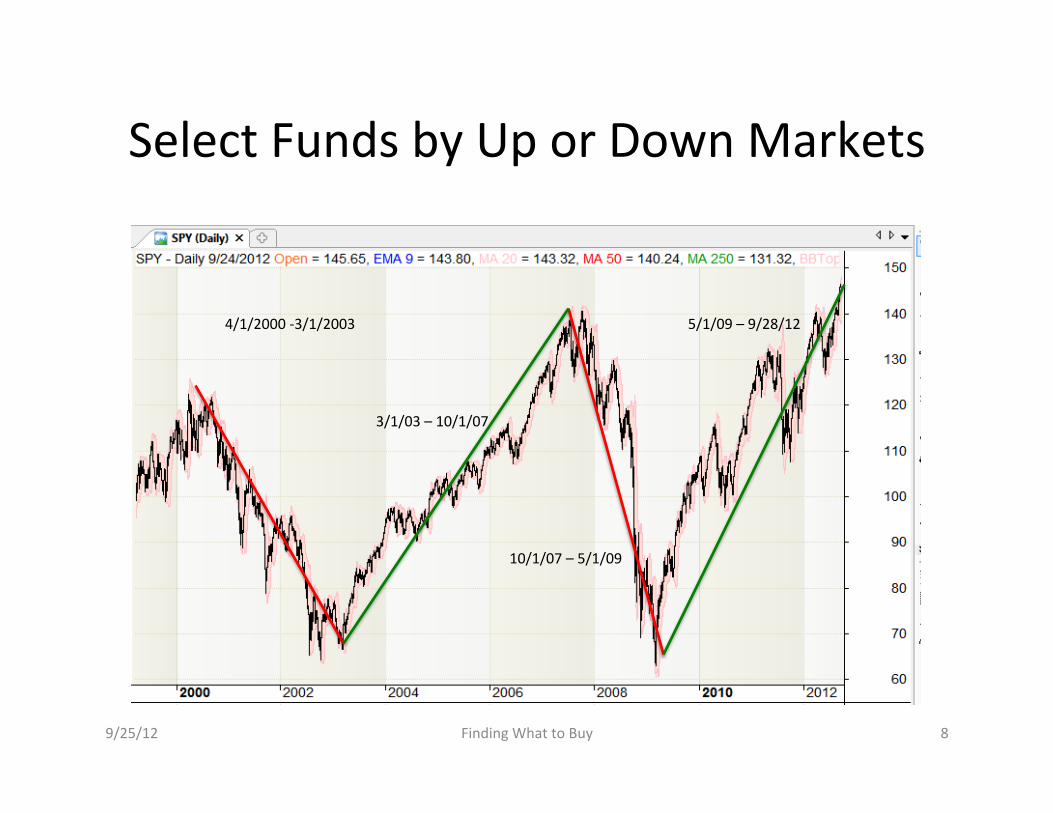
Select Funds by Up or Down Markets
9/25/12 Finding What to Buy 8
4/1/2000 -‐3/1/2003
3/1/03 – 10/1/07
10/1/07 – 5/1/09
5/1/09 – 9/28/12
Up and Down Mkt Lists
• Up List = 2541 • Dn List = 279
• Build Composite (Equal Wt Averages) for Lists and compare performances. – Up Mkts, Dn Mkts – Gimpels Top 10 – SP500, TLT Bond ETF used as Benchmarks
9/25/12 Finding What to Buy 9
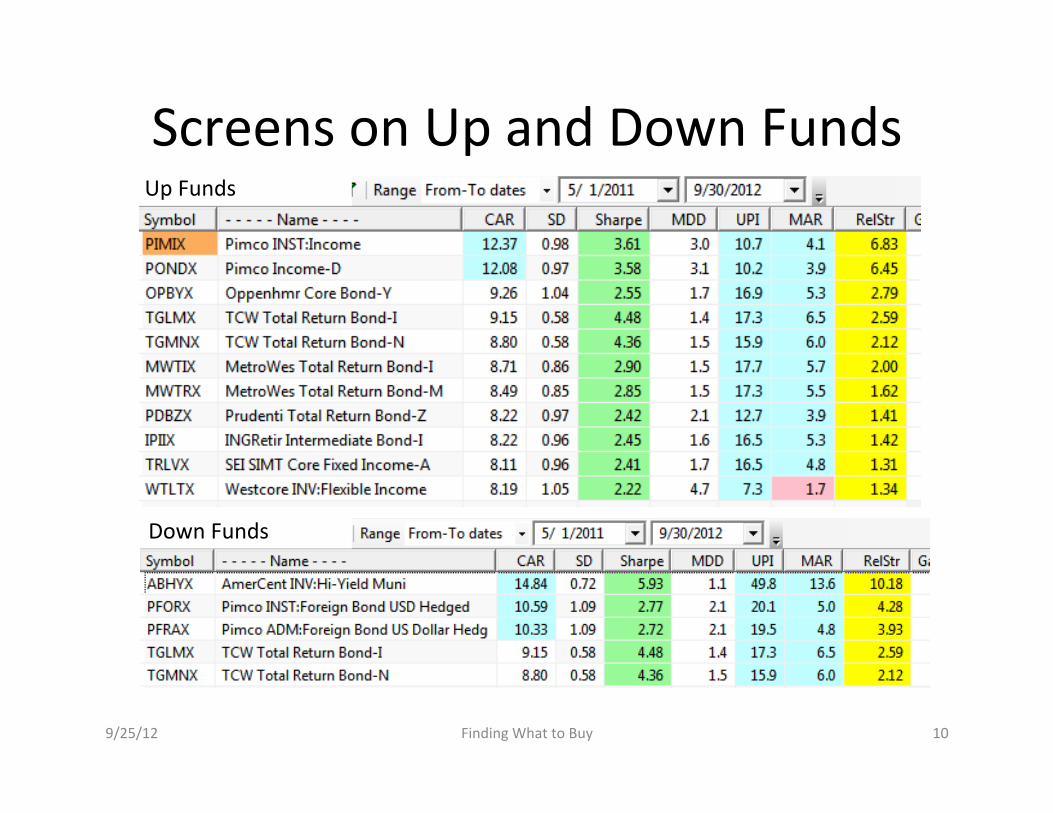
Screens on Up and Down Funds
9/25/12 Finding What to Buy 10
Up Funds
Down Funds
Screening for Risk Adj Perf
9/25/12 Finding What to Buy 11
Screen / Rank Sharpe = 1.2 or Beler Ulcer Performance Index = 1.5 or beler NC Alpha – Not Used Here, Varia;on to Small
Look at XY Plots – Combo final, filter 0 or 1, 09-‐12

Results for Gimpel’s Top10
9/25/12 Finding What to Buy 12
Risk Selec;on Criteria using Sharpe, UPI Dropped 2 of the 10 High Drawdowns (May Cause Investors to Sell Early) Need to
Addressed Using Hedging/Trading Strategy 10 Yr Time Period Used – Need to Examine More Recent Results
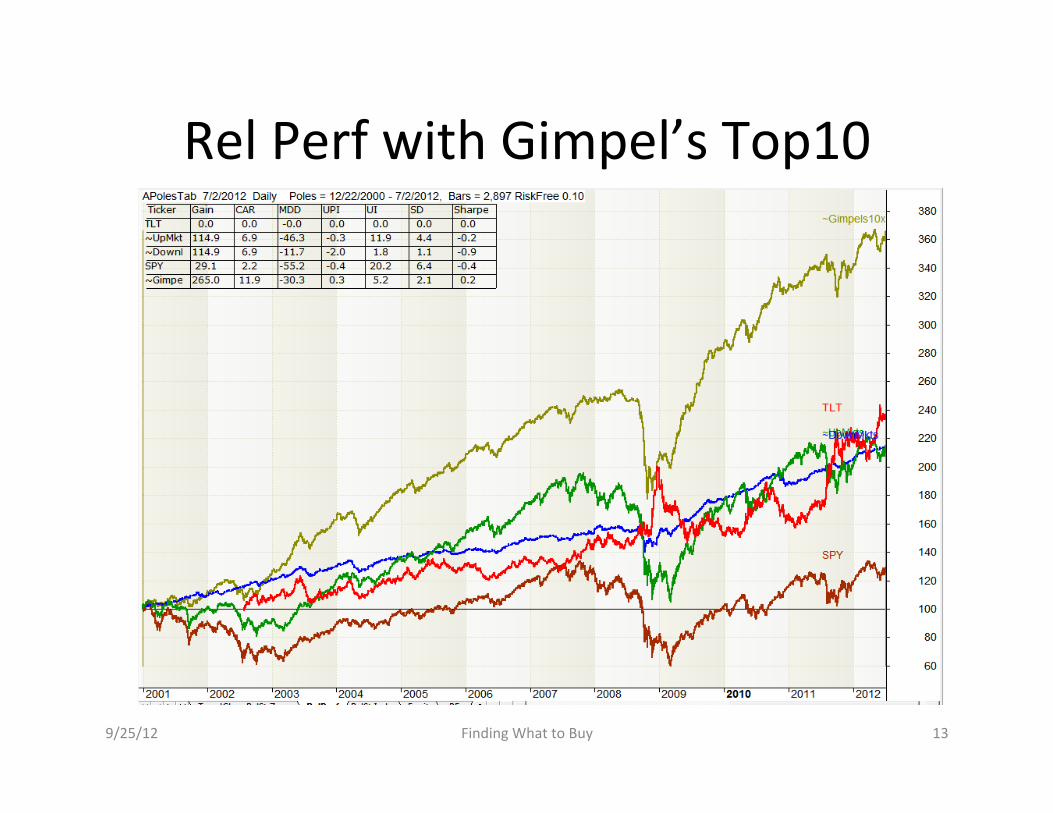
Rel Perf with Gimpel’s Top10
9/25/12 Finding What to Buy 13
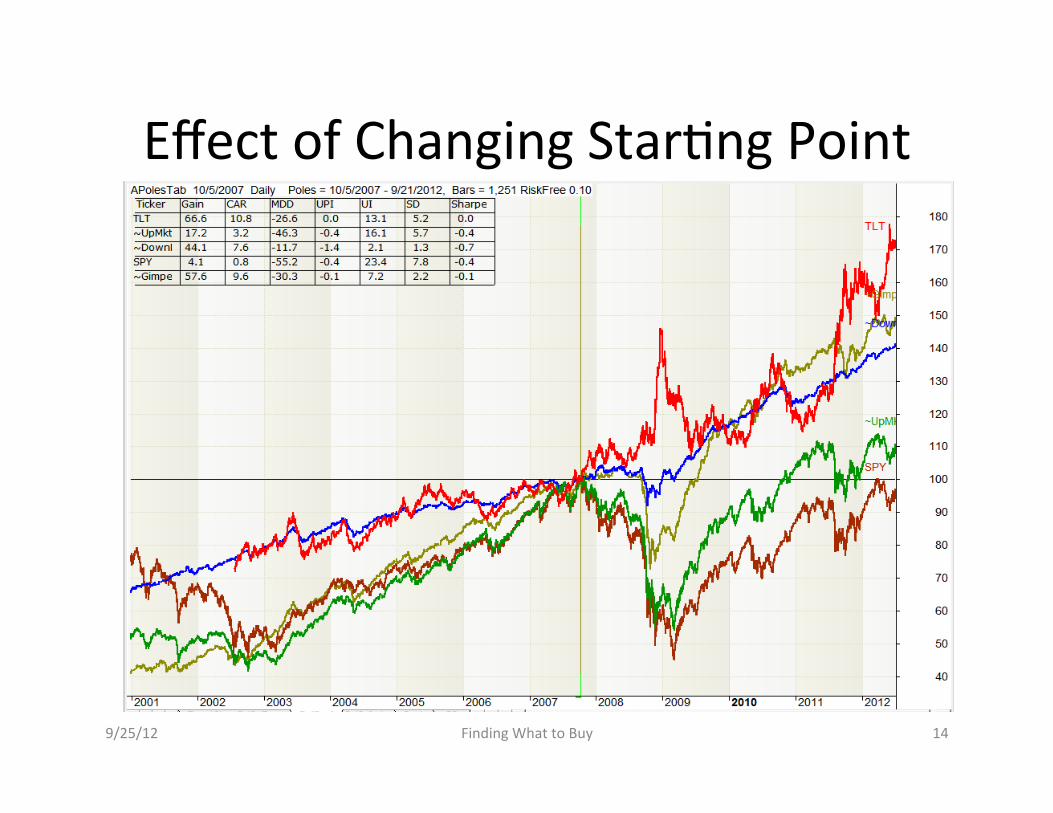
Effect of Changing Star;ng Point
9/25/12 Finding What to Buy 14
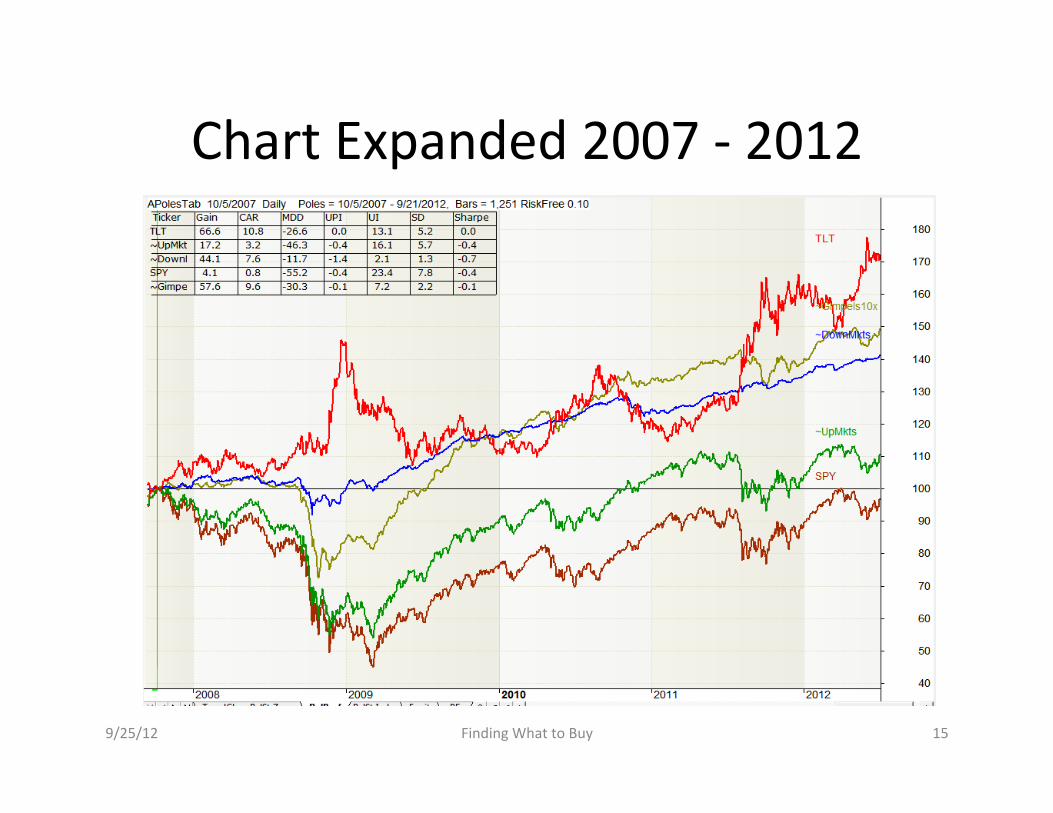
Chart Expanded 2007 -‐ 2012
9/25/12 Finding What to Buy 15
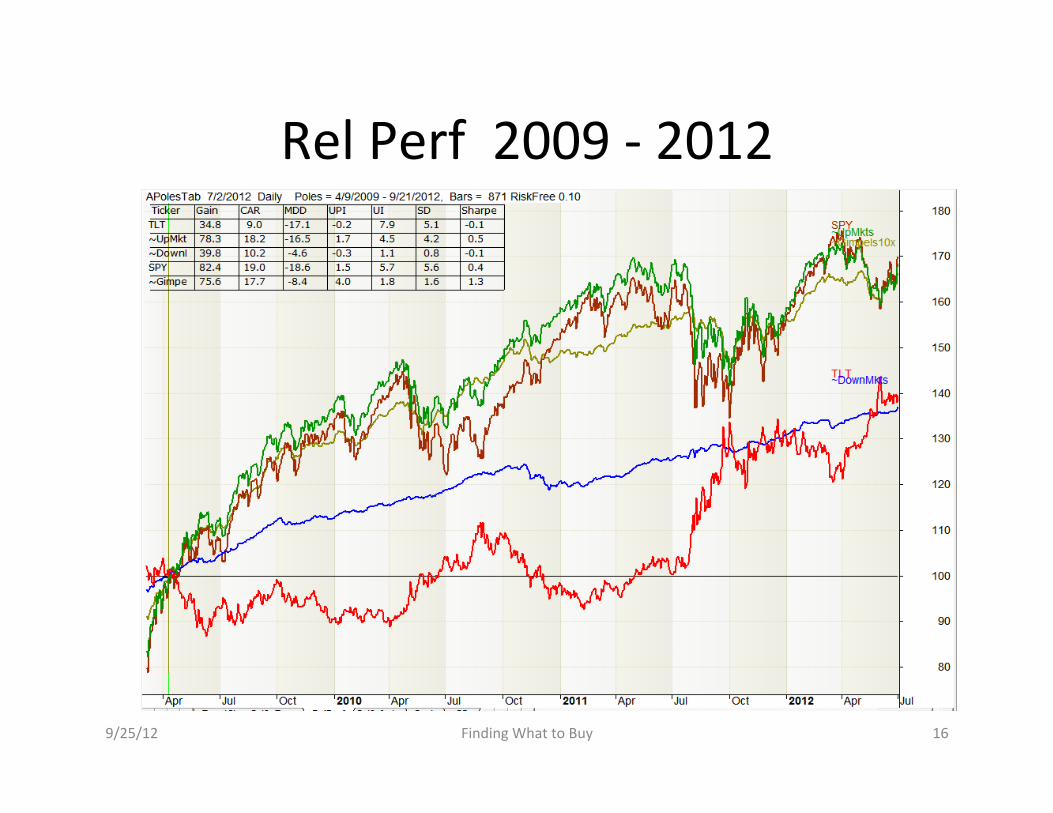
Rel Perf 2009 -‐ 2012
9/25/12 Finding What to Buy 16
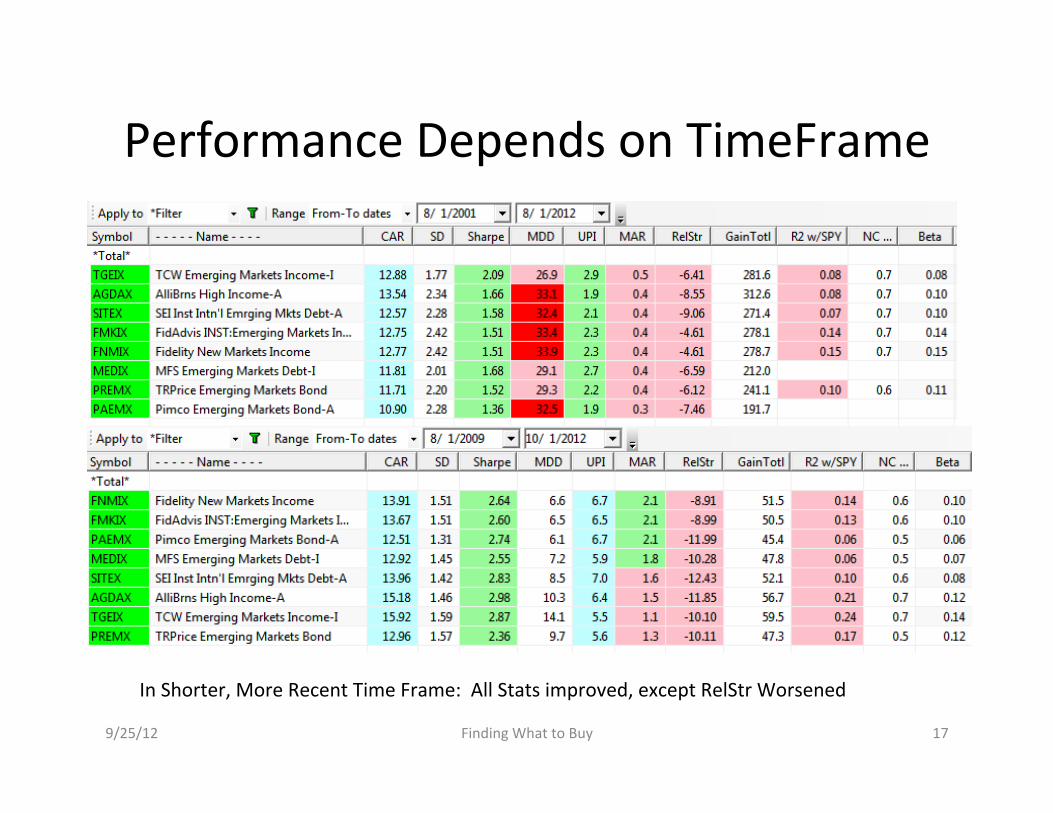
Performance Depends on TimeFrame
9/25/12 Finding What to Buy 17
In Shorter, More Recent Time Frame: All Stats improved, except RelStr Worsened
Other Results
• Funds Evaluated Last 3 years (9/09 -‐ 9/12) – Started with 6723 Funds – Aper Screen 1 (3 yrs, no Leveraged)
• 5651 Funds incl 742 ETFs and All of top10 – Aper Screen 2 (CAR > 8, Sharpe > 1.2, UPI > 1.5)
• 526 Funds , incl 24 ETFs and 8 or top10
– CAR, Sharpe, UPI Not Enough to Pick the Best
9/25/12 Finding What to Buy 18
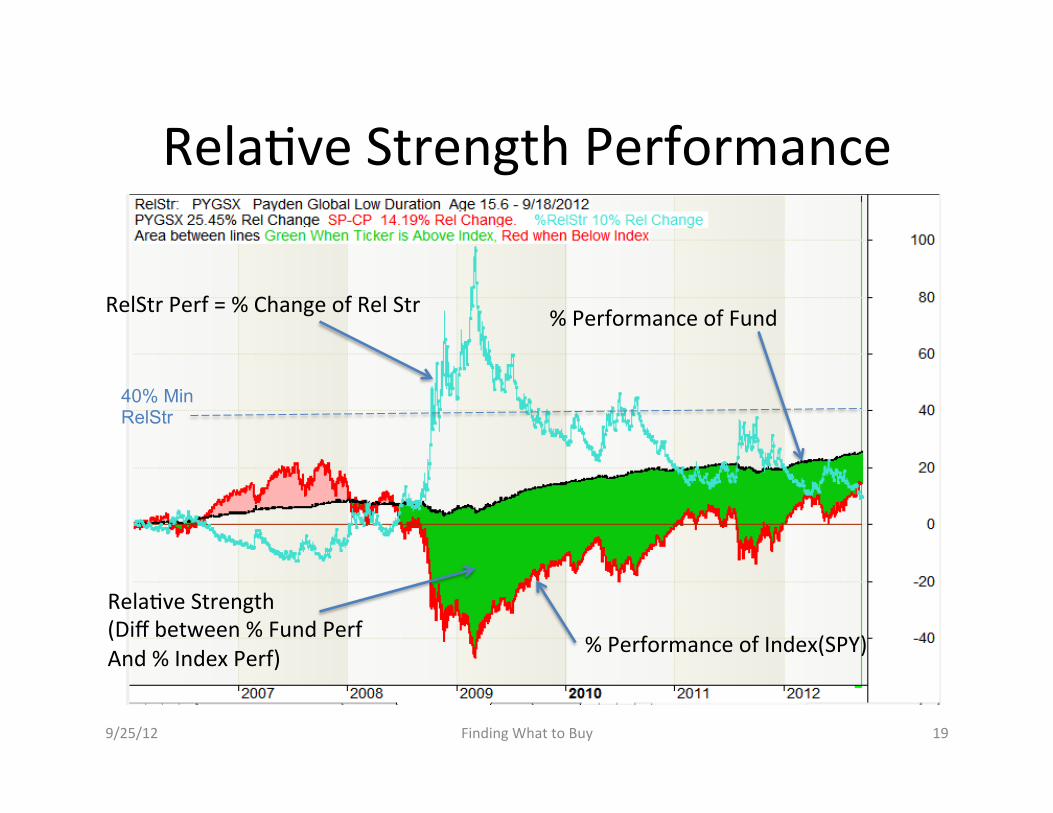
Rela;ve Strength Performance
9/25/12 Finding What to Buy 19
40% Min RelStr
RelStr Perf = % Change of Rel Str
Rela;ve Strength (Diff between % Fund Perf And % Index Perf)
% Performance of Fund
% Performance of Index(SPY)
Rela;ve Strength Performance
9/25/12 Finding What to Buy 20
• Use Chart of RelStr to Screen Recent Performance – CARSTATS set RelStr for the most recent 2 yrs – Plots use plot scale for RelStr star;ng point
• If RelStr is below zero, drop from list • Warnings:
– If performance frequently poor, open switching to red – If RelStr Performance (Blue Line) Not Up Trend
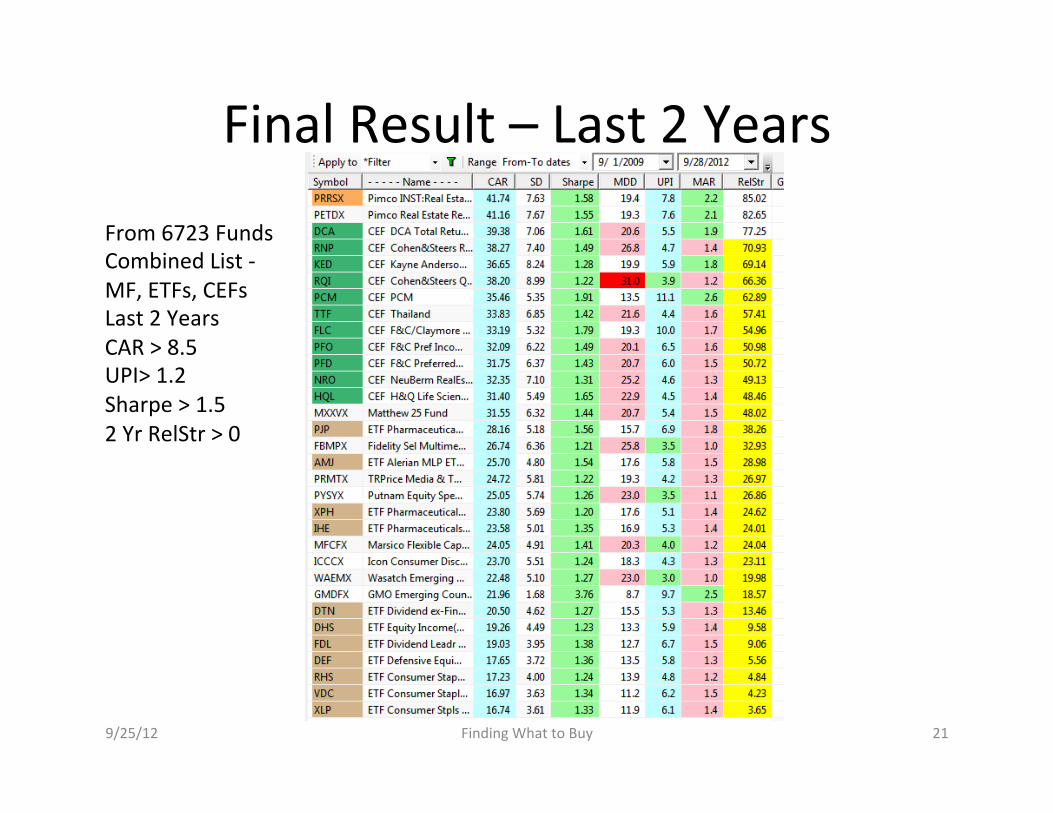
Final Result – Last 2 Years
9/25/12 Finding What to Buy 21
From 6723 Funds Combined List -‐ MF, ETFs, CEFs Last 2 Years CAR > 8.5 UPI> 1.2 Sharpe > 1.5 2 Yr RelStr > 0
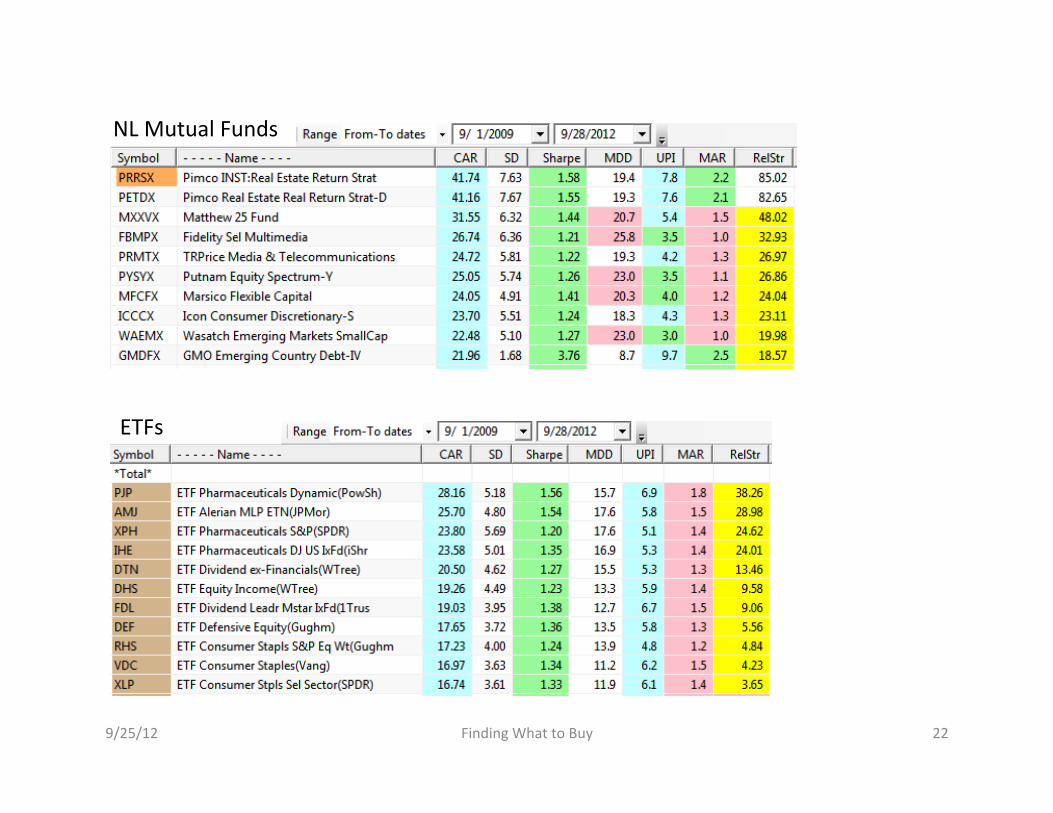
9/25/12 Finding What to Buy 22
NL Mutual Funds
ETFs
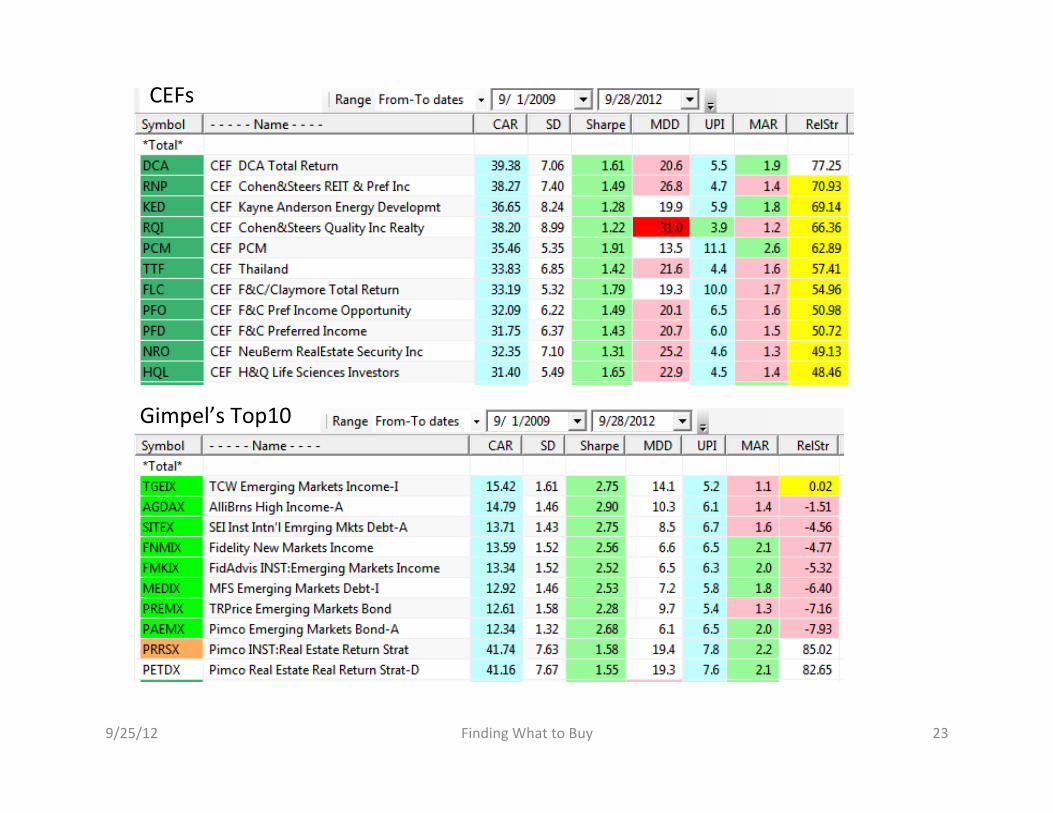
9/25/12 Finding What to Buy 23
CEFs
Gimpel’s Top10


![Mega Region Wccc Trb[2]](https://img.pdfslide.net/doc/110x75/54bc25804a7959e7158b4656/mega-region-wccc-trb2.jpg)