Embed Size (px)
DESCRIPTION
Citation preview
January 2013
Japanese Equities

1Japanese EquitiesPictet Asset Management
Japan is cheap versus history…
Source: Bloomberg
Dividend Yield / Price-to-Book
0%
0.5%
1.0%
1.5%
2.0%
2.5%
3.0%
3.5%
1994 1995 1996 1997 1998 1999 2000 2001 2002 2003 2004 2005 2006 2007 2008 2009 2010 2011 2012
0
0.5
1.0
1.5
2.0
2.5
3.0
TOPIX Dividend Yield TOPIX Price to Book
Despite the ‘Abe-nomics’
rally, the market remains
cheap…

2Japanese EquitiesPictet Asset Management
… and other markets…
Source: Bloomberg
Dividend Yield… although the rally has
(just) closed the yield
advantage over the US
market.
0
0.5%
1.0%
1.5%
2.0%
2.5%
3.0%
3.5%
4.0%
1994
1995
1996
1997
1998
1999
2000
2001
2002
2003
2004
2005
2006
2007
2008
2009
2010
2011
2012
TOPIX Dividend Yield S&P 500 Dividend Yield
3Japanese EquitiesPictet Asset Management
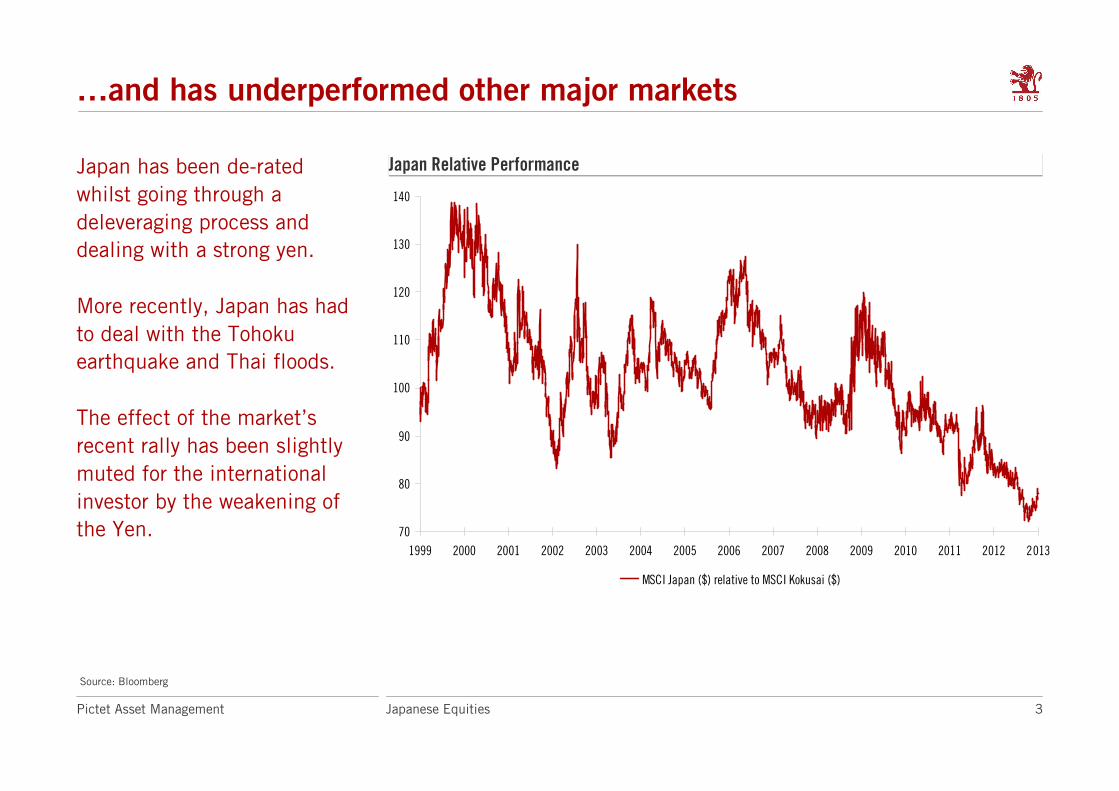
…and has underperformed other major markets
Japan Relative PerformanceJapan Relative Performance
Source: Bloomberg
Japan has been de-rated
whilst going through a
deleveraging process and
dealing with a strong yen.
More recently, Japan has had
to deal with the Tohoku
earthquake and Thai floods.
The effect of the market’s
recent rally has been slightly
muted for the international
investor by the weakening of
the Yen. 70
80
90
100
110
120
130
140
1999 2000 2001 2002 2003 2004 2005 2006 2007 2008 2009 2010 2011 2012 2013
MSCI Japan ($) relative to MSCI Kokusai ($)

4Japanese EquitiesPictet Asset Management
… although Spain may be cheaper …
Source: Haver Analytics, Datastream, GSAM* Length of series varies: most DMs 30+ years, others 15 years.
CAPE ratios – deviation from historical averageCAPE ratios – deviation from historical average
-80%
-70%
-60%
-50%
-40%
-30%
-20%
-10%
0%
10%
20%
US
Mexic
oInd
ones
ia
Korea UK
India
China
Turke
y
Braz
ilGe
rman
y
Franc
e
Russ
ia
Japa
n
Spain Ita
ly
CAPE deviation from historical average*

5Japanese EquitiesPictet Asset Management
We are positive on Japanese Equities
• Valuations are extremely low
• Japan still has world-leading technology
• The domestic economy is resilient
• No credit given for restructuring efforts
• The banking system is healthy
• The corporate sector is becoming bolder
Nothing new – Japan’s been
cheap for a while…
… but a lot of the old saws
about the Japanese economy
are no longer true…
… and the corporate sector is
very different to 2002 – when
it was trading above current
valuations
6Japanese EquitiesPictet Asset Management
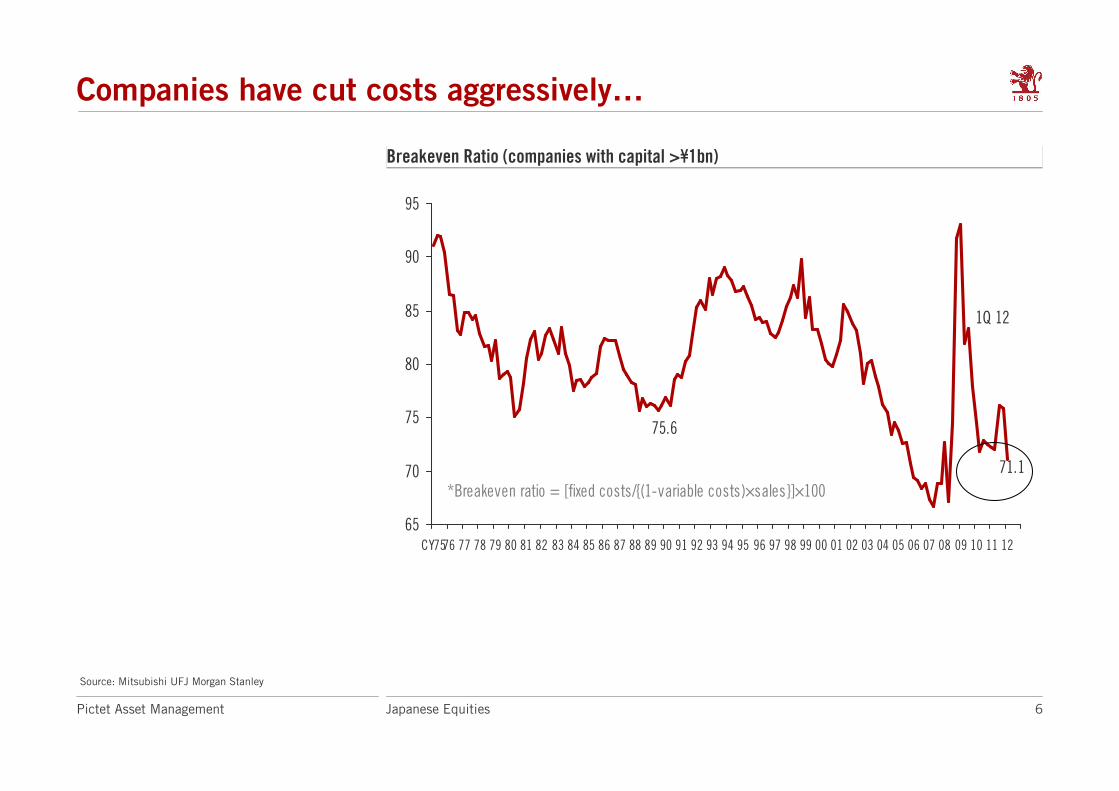
Companies have cut costs aggressively…
75.6
71.1
65
70
75
80
85
90
95
CY7576 77 78 79 80 81 82 83 84 85 86 87 88 89 90 91 92 93 94 95 96 97 98 99 00 01 02 03 04 05 06 07 08 09 10 11 12
*Breakeven ratio = [fixed costs/{(1-variable costs)×sales}]×100
1Q 12
Breakeven Ratio (companies with capital >¥1bn)Breakeven Ratio (companies with capital >¥1bn)
Source: Mitsubishi UFJ Morgan Stanley
7Japanese EquitiesPictet Asset Management
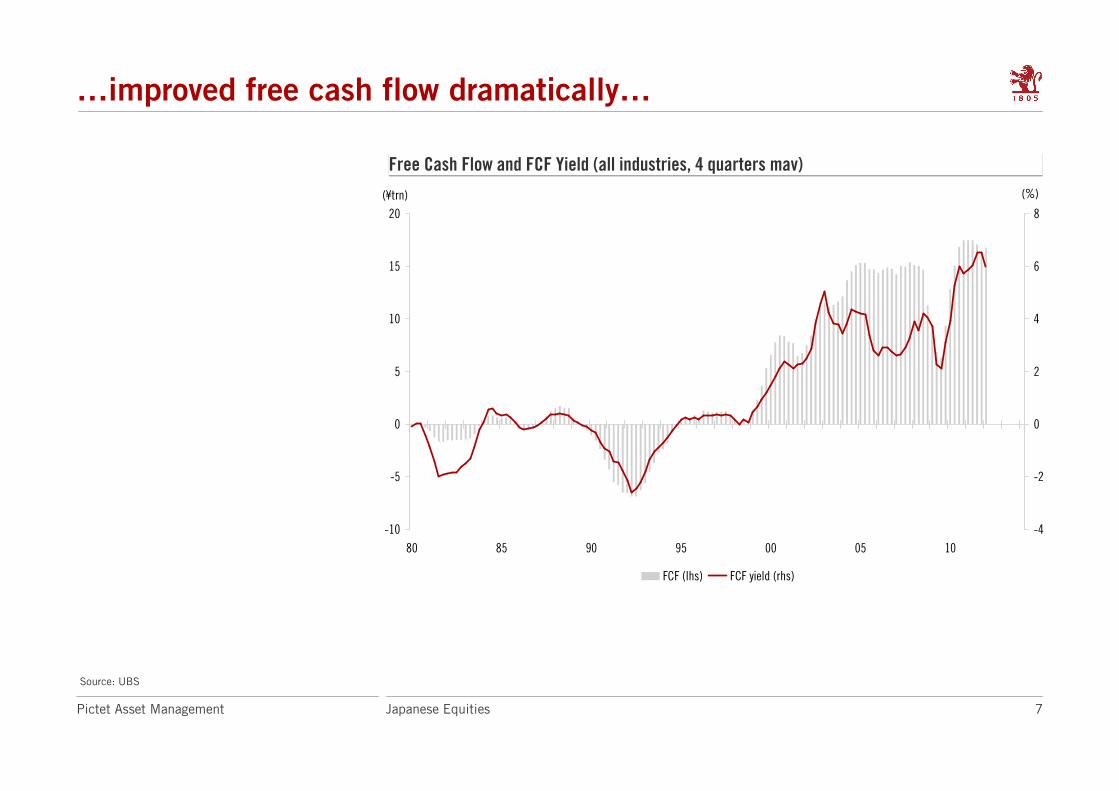
…improved free cash flow dramatically…
Source: UBS
Free Cash Flow and FCF Yield (all industries, 4 quarters mav)Free Cash Flow and FCF Yield (all industries, 4 quarters mav)
-10
-5
0
5
10
15
20
80 85 90 95 00 05 10
-4
-2
0
2
4
6
8
FCF (lhs) FCF yield (rhs)
(¥trn) (%)
8Japanese EquitiesPictet Asset Management
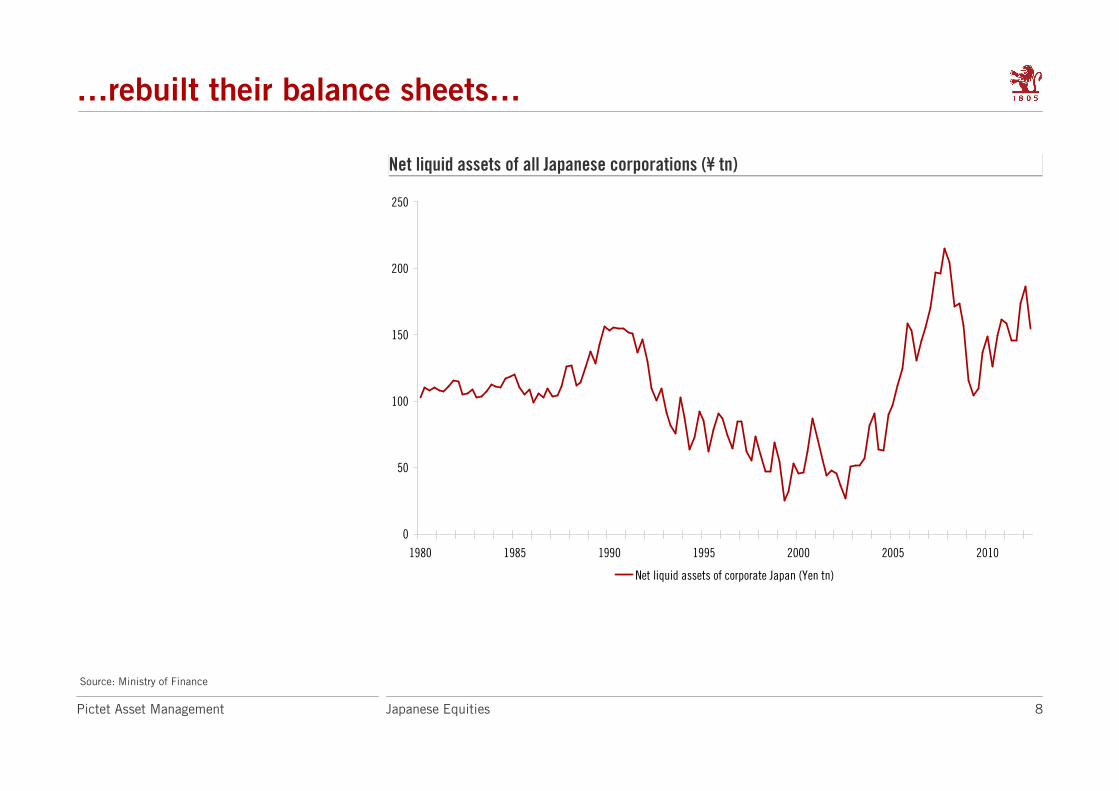
…rebuilt their balance sheets…
Source: Ministry of Finance
Net liquid assets of all Japanese corporations (¥ tn)Net liquid assets of all Japanese corporations (¥ tn)
0
50
100
150
200
250
1980 1985 1990 1995 2000 2005 2010
Net liquid assets of corporate Japan (Yen tn)
9Japanese EquitiesPictet Asset Management
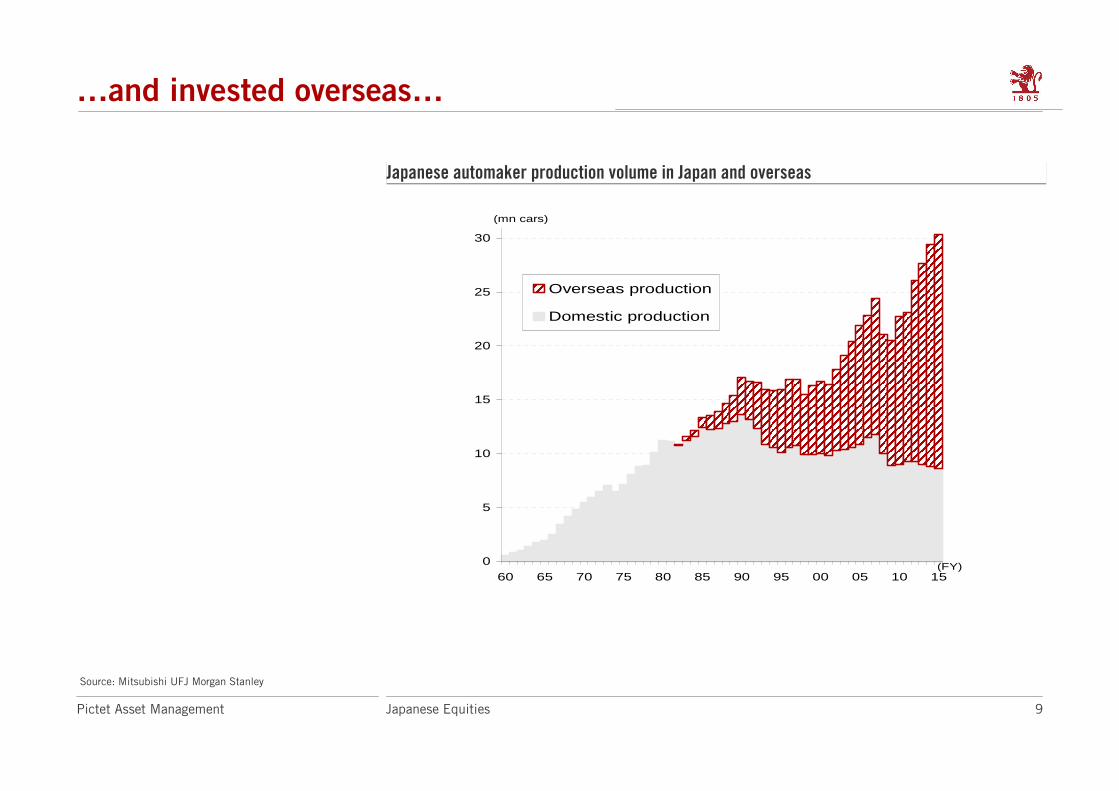
Japanese automaker production volume in Japan and overseasJapanese automaker production volume in Japan and overseas
…and invested overseas…
0
5
10
15
20
25
30
60 65 70 75 80 85 90 95 00 05 10 15
Overseas production
Domestic production
(mn cars)
(FY)
Source: Mitsubishi UFJ Morgan Stanley

10Japanese EquitiesPictet Asset Management
…where returns are higher
0.0
0.5
1.0
1.5
2.0
2.5
3.0
3.5
4.0
4.5
5.0
5.5
88 90 92 94 96 98 00 02 04 06 08 10
Overseascorporation
Domesticcorporation
(FY)
(%)
<Recurring profit margin>
RP margin for domestic corporations and overseas subsidiaries/affiliates
Source: Mitsubishi UFJ Morgan Stanley, Ministry of Economy
Japan is doing much more
than just moving factories to
China.
Over the last two years,
Japanese companies have
represented more than 10%
of all cross-border M&A
(by value).
Japanese companies are
second only to the Americans
in making cross-border deals.

11Japanese EquitiesPictet Asset Management
The export mix has changed dramatically
Export values by destination
1
2
3
4
5
6
7
8
90 92 94 96 98 00 02 04 06 08 10 12
To developed countries To EM countries
(JPY trn, sa)
Emerging markets are now
the key driver of exports
Source: DB Global Markets Research, Ministry of Finance

12Japanese EquitiesPictet Asset Management
Japan is highly competitive
Unit Labour Costs (rebased 100 in 2000, FX adjusted)
Insert here your graphs
and tables
70
90
110
130
150
170
190
210
2000 2001 2002 2003 2004 2005 2006 2007 2008 2009 2010
Japan Germany Korea UK USA Italy Spain
Employee cost (US$ PPP adjusted)
20,000
25,000
30,000
35,000
40,000
45,000
50,000
55,000
60,000
65,000
70,000
2000 2001 2002 2003 2004 2005 2006 2007 2008 2009 2010
Japan Germany Korea UK USA Italy Spain
Source: OECD
13Japanese EquitiesPictet Asset Management
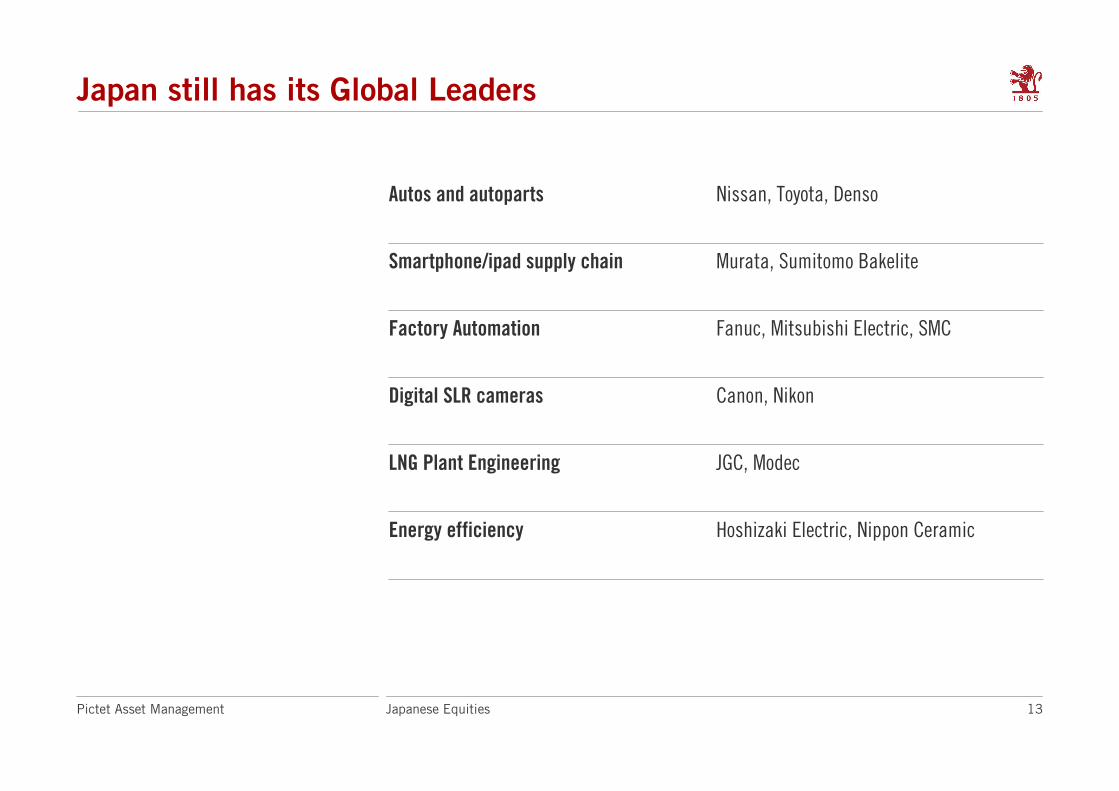
Japan still has its Global Leaders
Hoshizaki Electric, Nippon CeramicEnergy efficiency
JGC, ModecLNG Plant Engineering
Canon, NikonDigital SLR cameras
Fanuc, Mitsubishi Electric, SMCFactory Automation
Murata, Sumitomo BakeliteSmartphone/ipad supply chain
Nissan, Toyota, DensoAutos and autoparts

14Japanese EquitiesPictet Asset Management
It’s not just an export story
Non-manufacturing profit marginsProfit margins have improved
sharply in non-manufacturing
sectors
1.0%
1.5%
2.0%
2.5%
3.0%
3.5%
4.0%
1986
1987
1988
1989
1990
1991
1992
1993
1994
1995
1996
1997
1998
1999
2000
2001
2002
2003
2004
2005
2006
2007
2008
2009
2010
2011
2012
Current Profit Margin of Non-Manufacturing Sector (ex-electric utilities)
Source: BNP Paribas, Ministry of Finance

15Japanese EquitiesPictet Asset Management
The domestic economy is relatively robust
Source: Bloomberg
The recovery from the
earthquake and Thai floods
has been impressive
This is before the impact of
reconstruction really takes
hold
SME Confidence indices in Japan and USSME Confidence indices in Japan and US
50
60
70
80
90
100
110
120
2001 2002 2003 2004 2005 2006 2007 2008 2009 2010 2011 2012
Shoko Chukin Small Business Confidence Index NFIB Small Business Optimism Index
16Japanese EquitiesPictet Asset Management
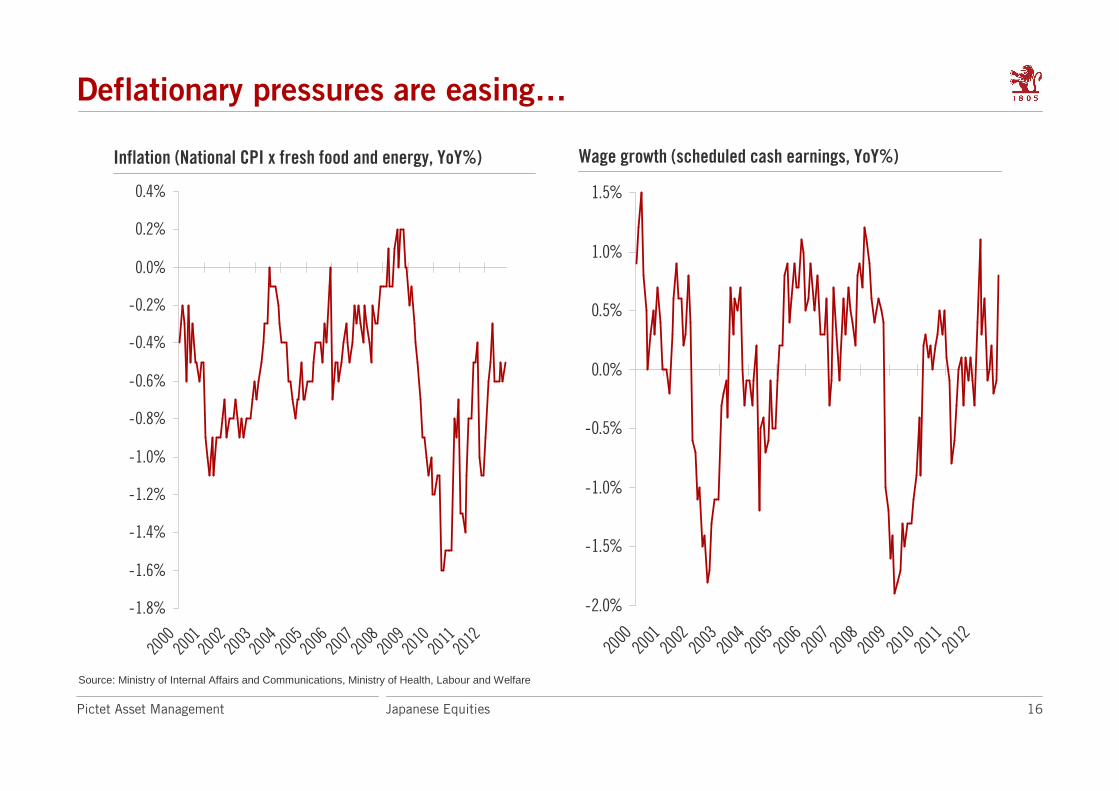
Deflationary pressures are easing…
Source: Ministry of Internal Affairs and Communications, Ministry of Health, Labour and Welfare
Inflation (National CPI x fresh food and energy, YoY%) Wage growth (scheduled cash earnings, YoY%)
-1.8%
-1.6%
-1.4%
-1.2%
-1.0%
-0.8%
-0.6%
-0.4%
-0.2%
0.0%
0.2%
0.4%
200020
0120
0220
0320
0420
0520
0620
0720
0820
0920
1020
1120
12
-2.0%
-1.5%
-1.0%
-0.5%
0.0%
0.5%
1.0%
1.5%
200020
0120
0220
0320
0420
0520
0620
0720
0820
0920
1020
1120
12
17Japanese EquitiesPictet Asset Management
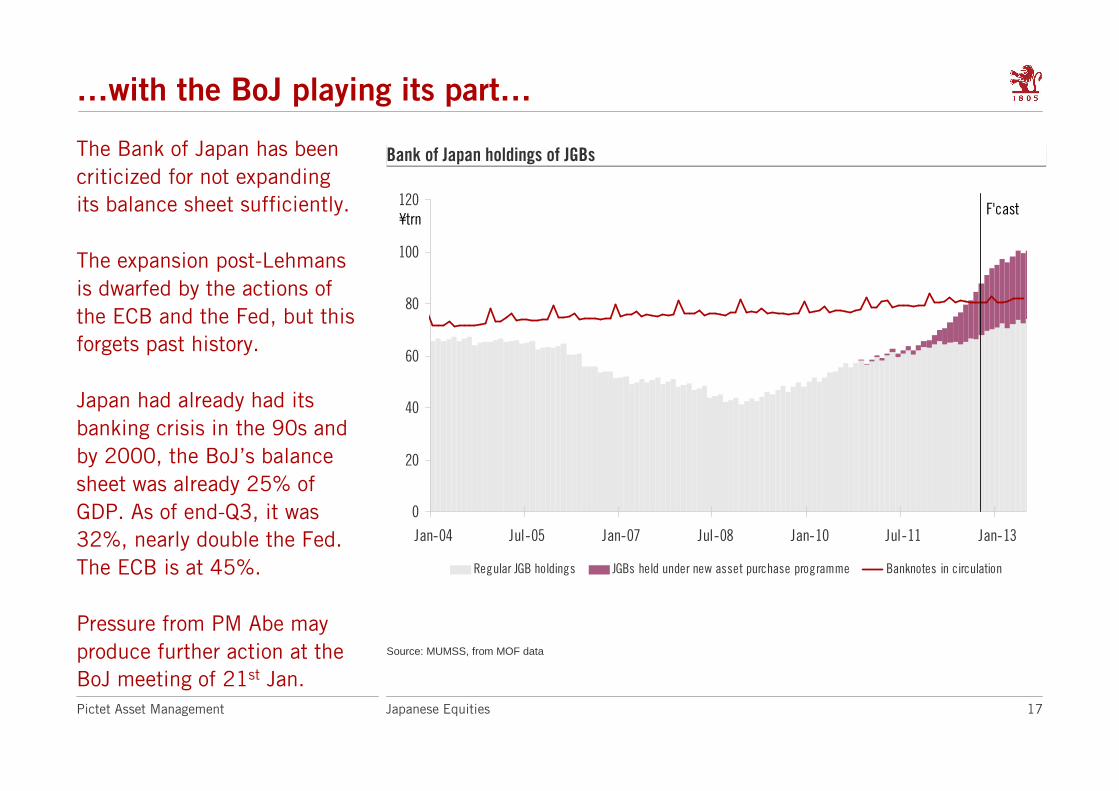
…with the BoJ playing its part…
Source: MUMSS, from MOF data
Bank of Japan holdings of JGBsBank of Japan holdings of JGBs
0
20
40
60
80
100
120
Jan-04 Jul-05 Jan-07 Jul-08 Jan-10 Jul-11 Jan-13
Regular JGB holdings JGBs held under new asset purchase programme Banknotes in circulation
¥trnF'cast
The Bank of Japan has been
criticized for not expanding
its balance sheet sufficiently.
The expansion post-Lehmans
is dwarfed by the actions of
the ECB and the Fed, but this
forgets past history.
Japan had already had its
banking crisis in the 90s and
by 2000, the BoJ’s balance
sheet was already 25% of
GDP. As of end-Q3, it was
32%, nearly double the Fed.
The ECB is at 45%.
Pressure from PM Abe may
produce further action at the
BoJ meeting of 21st Jan.
18Japanese EquitiesPictet Asset Management
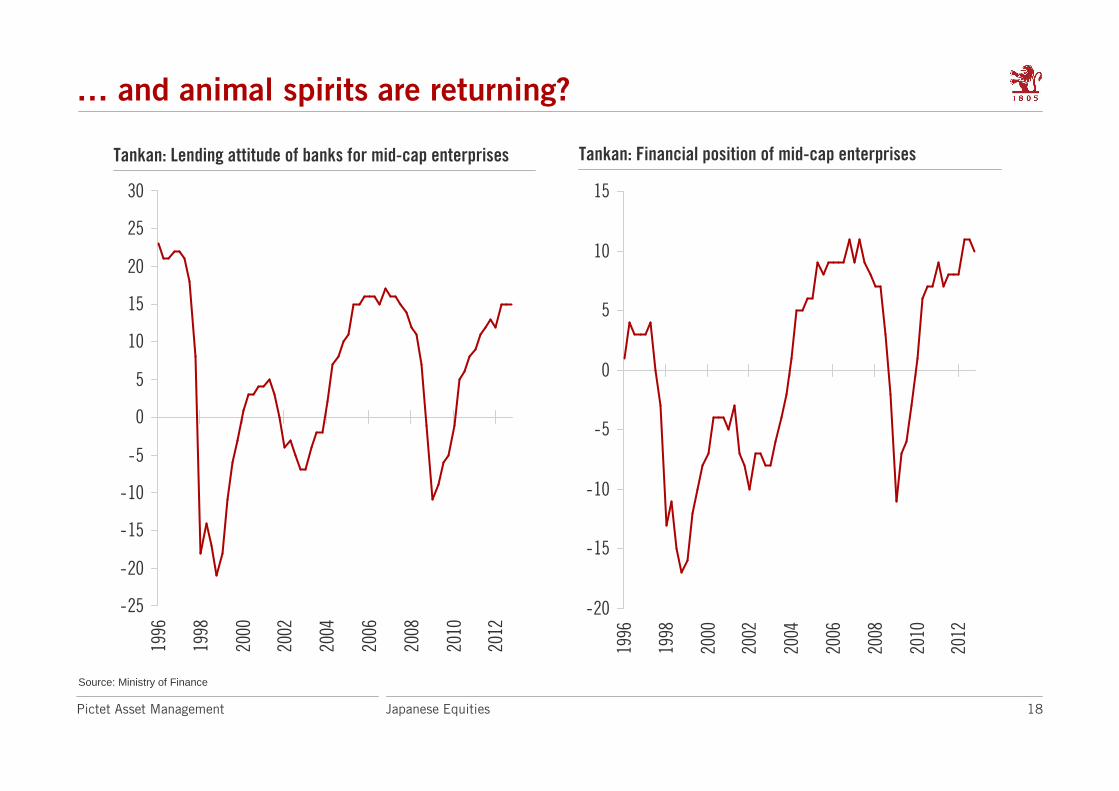
… and animal spirits are returning?
Source: Ministry of Finance
Tankan: Lending attitude of banks for mid-cap enterprises Tankan: Financial position of mid-cap enterprises
-25
-20
-15
-10
-5
0
5
10
15
20
25
30
1996
1998
2000
2002
2004
2006
2008
2010
2012
-20
-15
-10
-5
0
5
10
15
1996
1998
2000
2002
2004
2006
2008
2010
2012
19Japanese EquitiesPictet Asset Management
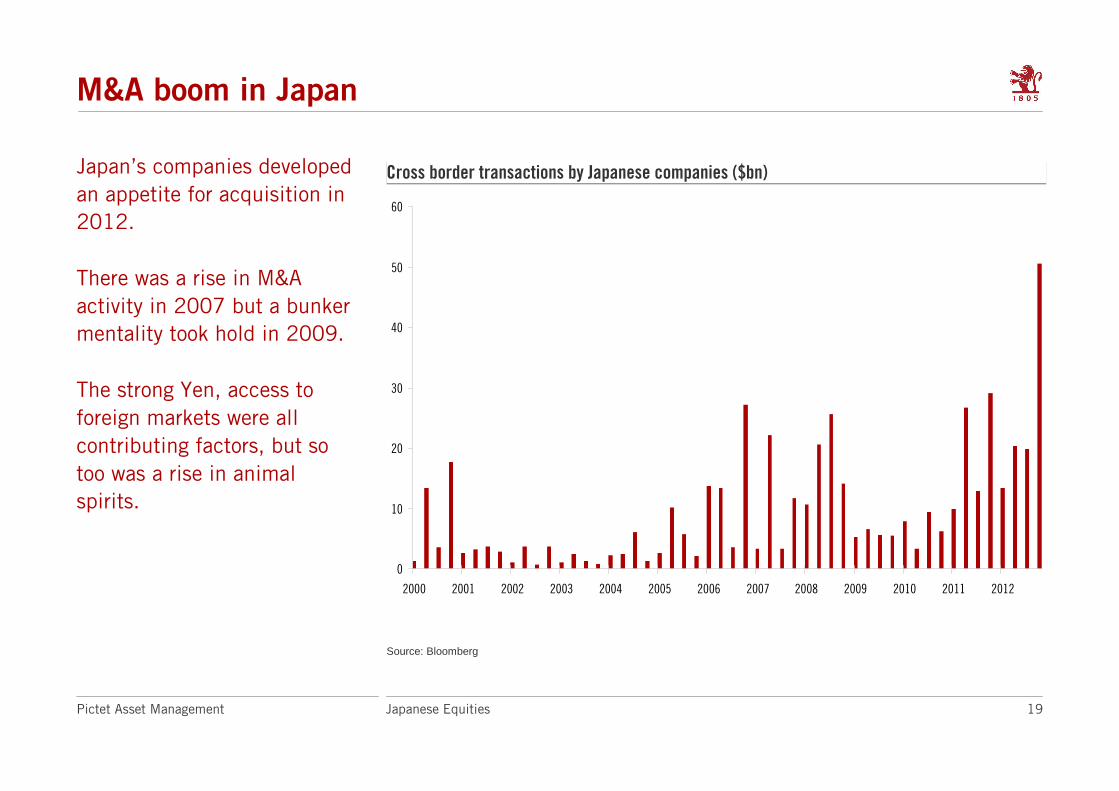
M&A boom in Japan
Source: Bloomberg
Cross border transactions by Japanese companies ($bn)Cross border transactions by Japanese companies ($bn)Japan’s companies developed
an appetite for acquisition in
2012.
There was a rise in M&A
activity in 2007 but a bunker
mentality took hold in 2009.
The strong Yen, access to
foreign markets were all
contributing factors, but so
too was a rise in animal
spirits.
0
10
20
30
40
50
60
2000 2001 2002 2003 2004 2005 2006 2007 2008 2009 2010 2011 2012

20Japanese EquitiesPictet Asset Management
Dangerous debt position?
Source: OECD
Gross Government Debt as % GDP Net Government Debt as % GDP
0
50
100
150
200
Japa
n US UKGe
rman
yFra
nce
Austr
iaIta
lySp
ainPo
rtuga
lIre
land
Gree
ce0
20
40
60
80
100
120
140
Japa
n US UKGe
rman
yFra
nce
Austr
iaIta
lySp
ainPo
rtuga
lIre
land
Gree
ce
21Japanese EquitiesPictet Asset Management
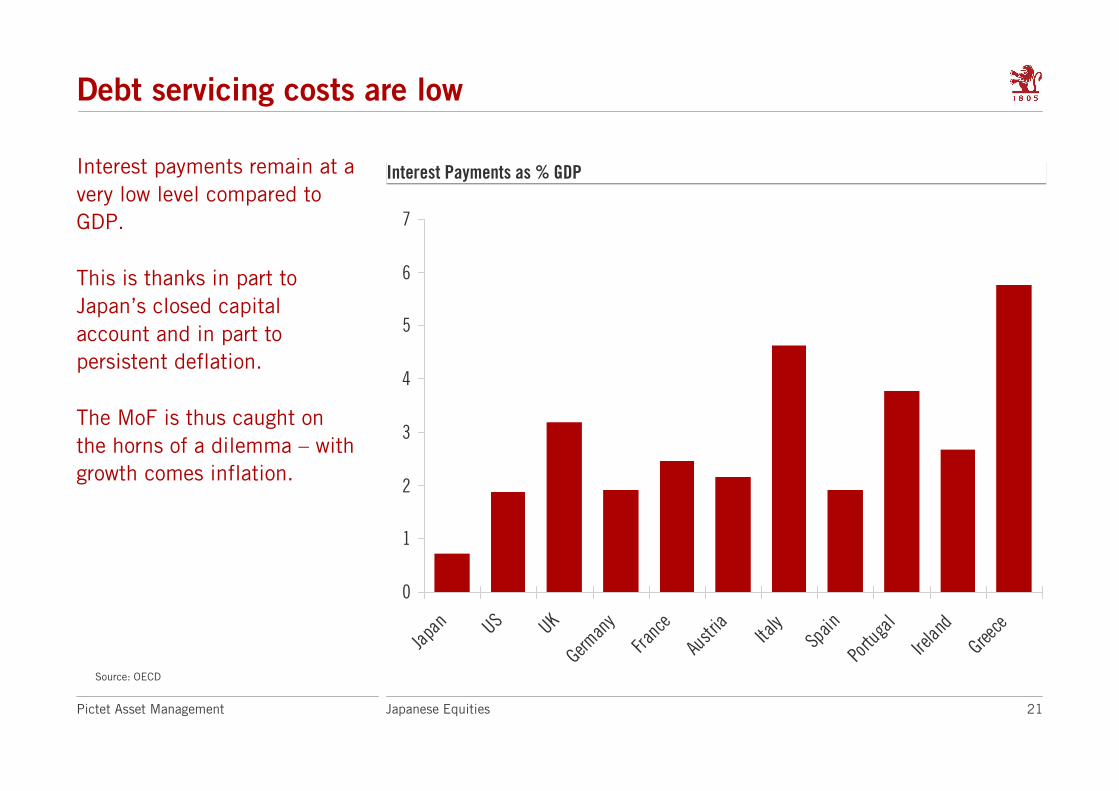
Debt servicing costs are low
Source: OECD
Interest Payments as % GDPInterest Payments as % GDP
0
1
2
3
4
5
6
7
Japa
n US UKGe
rman
y
Franc
e
Austr
ia
Italy
Spain
Portu
gal
Irelan
d
Gree
ce
Interest payments remain at a
very low level compared to
GDP.
This is thanks in part to
Japan’s closed capital
account and in part to
persistent deflation.
The MoF is thus caught on
the horns of a dilemma – with
growth comes inflation.
22Japanese EquitiesPictet Asset Management
What funding crisis?
Source: IMF, Credit Suisse
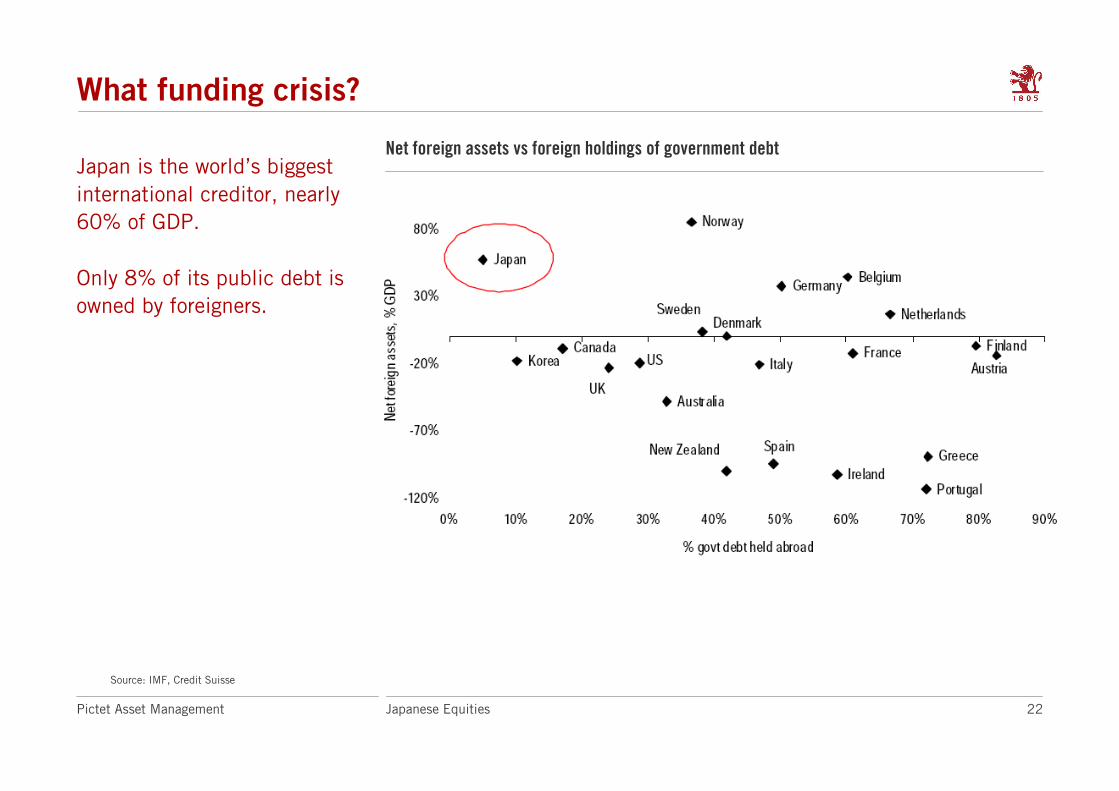
Net foreign assets vs foreign holdings of government debtJapan is the world’s biggest
international creditor, nearly
60% of GDP.
Only 8% of its public debt is
owned by foreigners.
23Japanese EquitiesPictet Asset Management
What funding crisis?
• All the ratings agencies have downgraded Japan over the last couple of years
• This looks like they are playing to the crowd…
• While the size of the gross debt is high (225% GDP), the net debt is only about
121% (IMF estimate)
• Almost all debt is held locally – only 8% is held by foreigners
• The private sector has an enormous amount of cash
– The corporate sector has a cash pile equivalent to 30% of GDP
– The household sector holds net savings of about another 4% of GDP
• Japan is the world’s largest net creditor (57% of GDP)
• If the Yen fell to ¥120, then net foreign assets would rise to nearly 90% GDP
• This would enable Japan to retire a significant part of the debt pile.
24Japanese EquitiesPictet Asset Management
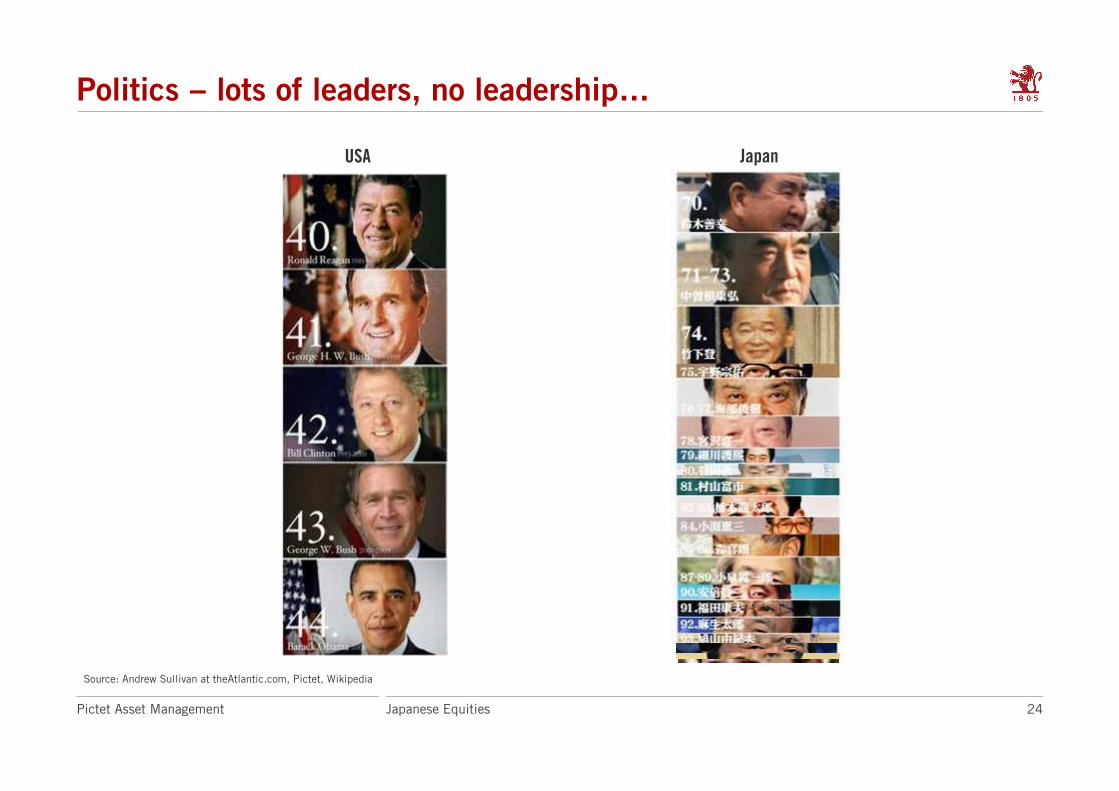
Politics – lots of leaders, no leadership…
Source: Andrew Sullivan at theAtlantic.com, Pictet, Wikipedia
JapanUSA

25Japanese EquitiesPictet Asset Management
Demography – everyone else is on the demographic cliff
Elderly support ratio – number of working age (20-64) per person of pension age (65+)Elderly support ratio – number of working age (20-64) per person of pension age (65+)One of the many headwinds
that Japan has had is the
aging of the population.
What is less well known is
that while Japan has fallen
off the cliff, everyone else is
teetering on the edge.
Japan’s demography is
comparatively stable over the
next several decades.
Demography is everyone
else’s problem.
Source: OECD
0
2
4
6
8
10
12
14
16
1950 1960 1970 1980 1990 2000 2010 2020 2030 2040 2050
Japan Korea China OECD USA Germany Italy
Western OECD countries
Asia
Projection
26Japanese EquitiesPictet Asset Management
Investors in general still sceptical
• Perception that Japanese companies no longer competitive
– But Sony and Sharp do not represent the whole picture
• Concerns over corporate governance
– Again, Olympus is not typical of corporate Japan
– Recent track record no worse than other regions
• Concerns over government debt and demographics
– Other countries facing similar issues: views on Japan being re-assessed
– Accept that domestic growth is limited but this does not mean equities should be written off
– Understandable concern over currency risk: Sterling and Euro investors have a hedged share class

27Japanese EquitiesPictet Asset Management
Large parts of the market are being totally overlooked
Source: Bloomberg
Stock coverage: Number of analysts S&P 1500 vs. Topix (1672 companies)Percentage of companies with
2 or fewer analysts: US 2%
versus Japan 58% 175
170
237
308
407
172
17
14
0
3
30
107
117
202
244
151
291
527
over 25
21 to 25
16 to 20
11 to 15
6 to 10
3 to 5
2
1
0
USA Japan

28Japanese EquitiesPictet Asset Management
Potential catalysts
• Recovery in domestic demand
– post-earthquake reconstruction to come
• An end to yen appreciation
– the BoJ is playing its part, further pressure from Abe?
• An end to deflation
– implications for asset allocation
• A turn in the global cycle
– policy shift in China

29Japanese EquitiesPictet Asset Management
Pictet core Japanese equity funds
The performance target, risk figures and exposures given above provide an indication of the probable characteristics in normal market conditions and are not intended to be legally binding outside of the
Investment Management Agreement
Remain close to 100% investedNet exposure maintained close to 100%Cash
Full market cap spectrum
c.100 holdings: 80 long, 20 short
Topix
4% +
3 – 8%
Long: +4%, Short: -3%
Japanese Equity Opportunities
No “micro” capsExposure
50 – 60 holdingsFocused portfolio
MSCI JapanBenchmark
3% +Alpha target
3 – 7%Ex-ante tracking error
Sectors: +10% active betStocks: +4%
Construction guidelines
Japanese Equity Selection
We manage our funds with a strong bottom-up approach within a sector framework

30Japanese EquitiesPictet Asset Management
Performance – Pictet - Japanese Equity Opportunities (JPY)
Source: Pictet/Performa Global
Annual Performance %
0.00
0.00
0.00
0.00
-1.33
-1.45
6.65
4.28
3.58
3.96
Performance Portfolio Benchmark Difference Portfolio Benchmark
YTD 13.69% 9.73% 3.96% 23.00% 21.70%
Since Inception (31.07.07) -9.49% -11.81% 2.33% 3.58%
1 Year 14.05% 9.87% 4.18% 0.80
3 Years 3.81% -0.23% 4.04%
5 Years -8.15% -10.75% 2.60%
Standard Deviation
Gross Performance in JPY
Benchmark: Topix (TRI)
Portfolio: Pictet- Japanese Equity Opportunities
Reported in JPY
Tracking Error
Information Ratio
Cumulative Performance %
(annualised per 30.11.12)
Risk Figures
(annualised 5 years per 30.11.12)
-60
-40
-20
0
20
2007 (Aug) 2008 2009 2010 2011 2012 (Nov)
- 60
- 40
- 20
0
20
Pictet- Japanese Equity Opportunities Topix (TRI)

31Japanese EquitiesPictet Asset Management
Biographies
Adrian HickeyHead of Japanese Equities
Developed Equities team
Adrian Hickey joined Pictet Asset Management in
2006 and is Head of the Japanese Equities Team.
Adrian has concentrated on Japanese equity fund
management since joining Scottish Equitable in
Edinburgh in 1991. After Scottish Equitable he
spent four years working as a buy-side analyst in
Tokyo with Commerz International Capital
Management. On returning to the UK, Adrian
worked for Edinburgh Fund Managers and Shell
Pensions. Adrian's most recent position before
joining Pictet was Director of Japanese Equities at
Foreign & Colonial in London.
Adrian graduated with a BA (Hons) in Economics
and Economic History from the University of
Birmingham and holds an MA in Philosophy from
Lancaster University.
Sam PerrySenior Investment Manager
Developed Equities team
Sam Perry joined Pictet Asset Management in
1997 and is a Senior Investment Manager
specialising in Japanese equities.
Sam graduated from the University of Oxford with
a first class degree in Philosophy and Psychology.
He later gained a Doctorate in Experimental
Cognitive Psychology, also at Oxford University.
He is also a Chartered Financial Analyst (CFA)
charter holder.
Serena RobinsonSenior Investment Manager
Developed Equities team
Serena Robinson joined Pictet Asset Management
in 2000. She is a Senior Investment Manager
specialising in Japanese equities
She began her finance career at INVESCO in
1999.
Serena graduated from Trinity College Dublin with
a BA in Economics & Business Studies and has a
First Class Master’s degree in Business Studies
from University College Dublin. She is a Chartered
Financial Analyst (CFA) charter holder.

32Japanese EquitiesPictet Asset Management
Biographies
Takeshi Suzuki Senior Investment Analyst
Pictet Asset Management (Japan)
Takeshi Suzuki joined Pictet Asset Management
(Japan) Ltd. as a Senior Investment Analyst in
2001 with a focus on technology sectors
He began his investment career in 1987, joining
Okasan Securities as an institutional salesman,
later becoming an analyst in the research
department.
Takeshi graduated from Rikkyo University with a
BA in Economics. He is a Chartered Financial
Analyst (CFA) charter holder and a Chartered
Member of the Security Analysts Association of
Japan (CMA).
Go ShiinaSenior Investment Analyst
Pictet Asset Management (Japan)
Go Shiina joined Pictet Asset Management (Japan)
Ltd. in 2009, as a Senior Investment Analyst with
a focus on industrial sectors
Before joining Pictet, he spent ten years at
Goldman Sachs Asset Management and began his
career in 1997 as an analyst at Dai-Ichi Kangyo
Bank.
Go graduated with a BA in Economics and Finance
from the University of Tokyo. He is also a
Chartered Member of the Security Analysts
Association of Japan.

Pictet Asset Management (“PAM”) definition: In this document, Pictet Asset Management includes all the operating subsidiaries and divisions of the Pictet group that carry out institutional asset management: Pictet Asset Management SA, a Swiss corporation registered with the Swiss Financial Market Supervisory Authority FINMA, Pictet Asset Management Limited, a UK company authorised and regulated by the Financial Services Authority, and Pictet Asset Management (Japan) Limited, a Japanese company regulated by the Financial Services Agency of Japan.
This document is for distribution to professional investors only. However it is not intended for distribution to any person or entity who is a citizen or resident of any locality, state, country or other jurisdiction where such distribution, publication, or use would be contrary to law or regulation. Information used in the preparation of this document is based upon sources believed to be reliable, but no representation or warranty is given as to the accuracy or completeness of those sources. Any opinion, estimate or forecast may be changed at any time without prior warning. Investors should read the prospectus or offering memorandum before investing in any Pictet managed funds. This document has been issued in Switzerland by Pictet Asset Management SA and/or Pictet & Cie and in the rest of the world by Pictet Asset Management Limited and may not be reproduced or distributed, either in part or in full, without their prior authorisation.
For UK investors, the Pictet and Pictet Total Return umbrellas are domiciled in Luxembourg and are recognised collective investment schemes under section 264 of the Financial Services and Markets Act 2000. Swiss Pictet funds are only registered for distribution in Switzerland under the Swiss Fund Act, they are categorised in the United Kingdom as unregulated collective investment schemes. The Pictet group manages hedge funds, funds of hedge funds and funds of private equity funds which are not registered for public distribution within the European Union and are categorised in the United Kingdom as unregulated collective investment schemes.
For US investors, the Shares of the funds managed by the Pictet Group are being offered to United States tax-exempt investors Shares sold in the United States or to US Persons will only be sold in private placements to accredited investors pursuant to exemptions from SEC registration under the Section 4(2) and Regulation D private placement exemptions under the 1933 Act and qualified clients as defined under the 1940 Act. The Shares of the Pictet funds have not been registered under the 1933 Act and may not, except in transactions which do not violate United States securities laws, be directly or indirectly offered or sold in the United States or to any US Person. The Management Fund Companies of the Pictet Group will not be registered under the 1940 Act.
For more information, please contact
www.pictet.com
Pictet Asset Management SA
Route des Acacias 60, 1211 Geneva 73
Pictet Asset Management Limited
Authorised and regulated by the Financial Services Authority
Moor House, Level 11
120 London Wall
London EC2Y 5ET