Embed Size (px)
Citation preview

www.omnitek.tv Advanced Measurement Technology
12 May. 14 APPLICATION NOTE
Picture Quality Analysis on the OmniTek OTM and OTR
Quality Analysis facilities are of value everywhere signal degradation is an issue. In today’s
multi-media broadcast environment, this degradation comes just as much from the
compression techniques used to maximise the payload carried by a transmission line as from
the physical properties of the transmission line itself. The compression algorithms used to
minimise the data storage required for video images also introduce a level of image
degradation. Assessment of the image quality is essential in both cases to ensure that the
best use is made of the available resources.
From V3.1, both OTM and OTR systems have been able to compare – in real-time – either a
stored image or sequence against a reference copy of those images, a transmitted image or
sequence against the original; or two transmitted video streams, taken for example from two
points on a transmission line. Differences in Picture Quality between the images are
displayed both in the form of difference images and through quantitative measurements.
There are quantitative measurements too of Lip-Sync delay, measured directly from the
compared video sequences.
Picture Quality Analysis on OmniTek OTM and OTR systems will seem very familiar to
anyone who has used the company’s earlier ‘classic’ PQA system. OmniTek has been at
pains to ensure that the assessment given on the OTM and OTR will give identical results to
that given by the classic PQA system. Moreover remote monitoring scripts that have been
developed to run on the earlier systems should both run on the OTM/OTR and give the same
results as on OmniTek’s classic PQA system.
Note: The Quality Analysis facilities described in this document are only available on OTM
and OTR systems on which the new PQA and AV_ISD software options have been installed.
Other software options are also required, though precisely which options are needed depends
on the type of comparisons you want to make. For details, see Appendix II of this application
note.
Video Quality Analysis Application Note
Page 2 of 36
Contents 1. Introduction .................................................................................................................................. 3
References ........................................................................................................................................ 4
2. Background .................................................................................................................................. 5
Picture Quality Assessment Techniques .......................................................................................... 5
Subjective Tests ........................................................................................................................... 6
Objective Tests ............................................................................................................................. 7
Other Quality Checks ................................................................................................................... 8
3. The OmniTek Quality Analysis System ...................................................................................... 9
Operating Modes ............................................................................................................................ 11
Architecture .................................................................................................................................... 12
Toolbar ........................................................................................................................................... 13
4. The Picture Quality Tests ........................................................................................................... 15
Comparing Stored Video against a Reference Copy ..................................................................... 16
Setting Up the OTM/OTR for the Test ...................................................................................... 16
Comparing Live Video against a Stored Reference ....................................................................... 18
Setting Up the OTM/OTR for the Test ...................................................................................... 19
Comparing One Live Video against Another ................................................................................ 21
Setting Up the OTM/OTR for the Test ...................................................................................... 21
Choice of Test Materials ................................................................................................................ 23
5. Capturing the Results ................................................................................................................. 24
Picture Quality Graphs ................................................................................................................... 24
Controls over the Display .......................................................................................................... 26
Picture Difference Display ............................................................................................................. 27
Lip-Sync Issues .............................................................................................................................. 27
6. Comparing Sets of Test Results ................................................................................................. 29
Capturing the data .......................................................................................................................... 29
Comparing the data ........................................................................................................................ 29
7. Driving Quality Analysis Remotely ........................................................................................... 31
Installing SNMP ............................................................................................................................. 31
Remote Control .............................................................................................................................. 31
Alarm Traps ................................................................................................................................... 32
Appendix I: The Picture Quality Algorithms ..................................................................................... 33
PSNR .............................................................................................................................................. 33
CSNR ............................................................................................................................................. 34
Appendix II: Required Software Options .......................................................................................... 35
Video Quality Analysis Application Note
Page 3 of 36
1. Introduction The professional video business is built around a myriad of technologies. In the production arena,
a vast array of high-definition formats are used both for acquisition and post-production editing.
Broadcasters use MPEG-based compression schemes for content delivery. Other services that may
be offered include low bit-rate programme delivery to portable devices, internet media streaming,
and home video-on-demand services.
The differing technical requirements of these media services mean a wide variety of image
compression techniques are needed in order to meet the bandwidth limits of the chosen transmission
path. Picture quality and A/V Delay assessment on the resulting video signal are essential to ensure
that the best use is being made of the available bandwidth.
The assessments made by the OmniTek OTM and OTR waveform analysis systems include
standard measurements seen in other quality assessment systems such as macroblock counts and
peak signal-to-noise ratios (PSNR) but also incorporate some important enhancements over the
standard offering.
The issue with the standard measures is that, while these directly reflect artefacts in the test image,
the value obtained makes no allowance for the effect of the brightness level on the viewer’s ability
to perceive defects within an image. Proximity to the edge of an object within the image is another
factor that subjective tests have shown affects the viewer’s perception of errors.
OmniTek addresses these additional factors by offering variants of the standard algorithms
including an ‘edge-adjusted’ version of the PSNR known as CSNR that raises the importance of
defects near to object edges where they are more noticeable. Another variant is a luma-adjusted
version of the macroblock calculation that reduces the importance of macroblocks in either very
bright or very dark parts of the image where they are not so easily seen.
Another special feature of the OmniTek video quality analysis facilities is the option to specify an
overall measure by which to judge image degradation based on a user-defined combination of the
various measures offered. It is also possible to log measurements to disk for subsequent inspection
and analysis either inside or outside of the OTM/OTR system, while users also have access to signal
integrity assessment and most of the other facilities offered either as standard or through software
options on the OTM/OTR.
There are four key areas where picture analysis equipment is required:
R&D Laboratories: To assist with the design and development of new codec algorithms and
technologies;
TV Studios: Assessing the performance of different storage devices;
Transmission Engineering: Determining the degree of picture quality degradation over the
entire transmission path, from studio output to consumer set-top-box;
Equipment Manufacturers: Checking the performance and accuracy of video systems
coming off the production line.
In the past, measurements of picture quality in these target areas have been performed using
traditional equipment such as oscilloscopes, waveform monitors, etc. However this type of
equipment is inadequate in an environment where complex motion-based or object-based data
compression techniques are employed. Moreover, the measurements made need to accord
reasonably well with subjective judgments of picture quality.
OmniTek’s PQA facilities have been designed specifically to meet this need.

Video Quality Analysis Application Note
Page 4 of 36
Figure 1: Picture difference display,
comparing a 1.5Mbit MPEG-2
compressed signal against an
uncompressed reference signal.
This Application Guide introduces these PQA facilities and explains how they can be used to assess
picture quality across a range of possible set-ups. Please refer to Section S of the OTM or OTR
User Guide (V3.1 or later) for further details of the actions described.
References
1. V3.1 or later of either the OTM 1000, the OTR 1001 or the OTR 1003 User Guide,
supplied with V3.1 or later of the OTM/OTR Software. (Also available to download from the
Manuals, Guides and Help Notes page of the OmniTek website www.omnitek.tv)
2. ITU-R BT.500 “Methodology for the Subjective Assessment of the Quality of Television
Pictures”
3. ITU-T J.144 “Objective Perceptual Video Quality Measurement Techniques for Digital Cable
Television in the Presence of a Full Reference”
4. Final Report of the Video Quality Experts Group on the “Validation of Objective Models of
Video Quality Assessment”
Video Quality Analysis Application Note
Page 5 of 36
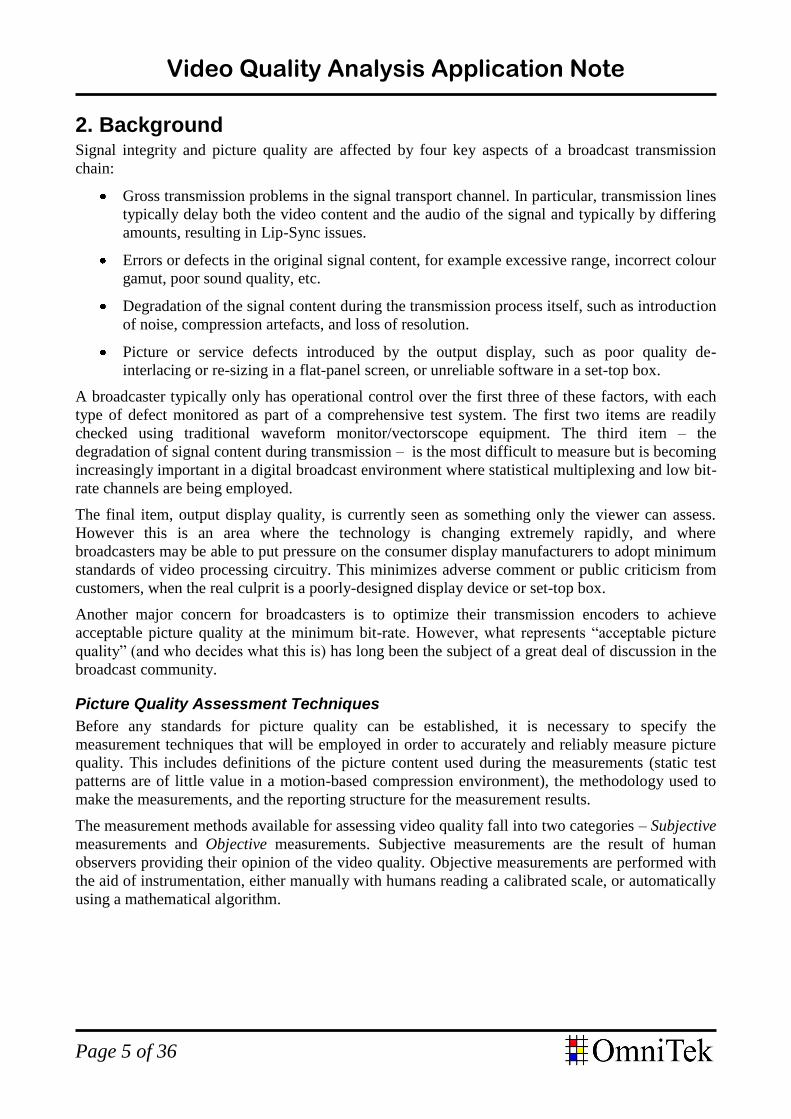
2. Background Signal integrity and picture quality are affected by four key aspects of a broadcast transmission
chain:
Gross transmission problems in the signal transport channel. In particular, transmission lines
typically delay both the video content and the audio of the signal and typically by differing
amounts, resulting in Lip-Sync issues.
Errors or defects in the original signal content, for example excessive range, incorrect colour
gamut, poor sound quality, etc.
Degradation of the signal content during the transmission process itself, such as introduction
of noise, compression artefacts, and loss of resolution.
Picture or service defects introduced by the output display, such as poor quality de-
interlacing or re-sizing in a flat-panel screen, or unreliable software in a set-top box.
A broadcaster typically only has operational control over the first three of these factors, with each
type of defect monitored as part of a comprehensive test system. The first two items are readily
checked using traditional waveform monitor/vectorscope equipment. The third item – the
degradation of signal content during transmission – is the most difficult to measure but is becoming
increasingly important in a digital broadcast environment where statistical multiplexing and low bit-
rate channels are being employed.
The final item, output display quality, is currently seen as something only the viewer can assess.
However this is an area where the technology is changing extremely rapidly, and where
broadcasters may be able to put pressure on the consumer display manufacturers to adopt minimum
standards of video processing circuitry. This minimizes adverse comment or public criticism from
customers, when the real culprit is a poorly-designed display device or set-top box.
Another major concern for broadcasters is to optimize their transmission encoders to achieve
acceptable picture quality at the minimum bit-rate. However, what represents “acceptable picture
quality” (and who decides what this is) has long been the subject of a great deal of discussion in the
broadcast community.
Picture Quality Assessment Techniques
Before any standards for picture quality can be established, it is necessary to specify the
measurement techniques that will be employed in order to accurately and reliably measure picture
quality. This includes definitions of the picture content used during the measurements (static test
patterns are of little value in a motion-based compression environment), the methodology used to
make the measurements, and the reporting structure for the measurement results.
The measurement methods available for assessing video quality fall into two categories – Subjective
measurements and Objective measurements. Subjective measurements are the result of human
observers providing their opinion of the video quality. Objective measurements are performed with
the aid of instrumentation, either manually with humans reading a calibrated scale, or automatically
using a mathematical algorithm.

Video Quality Analysis Application Note
Page 6 of 36
Subjective Tests
Subjective tests may be used for to assess system performance both under optimum conditions and
under non-optimum performance due to transmission limitations (impairment assessment).
Informal and formal subjective measurements have long been used to evaluate system performance
from the design lab to the operational environment. Television programs are produced for the
enjoyment or education of human viewers, so it is their opinion of the video quality that is most
important. Casual or informal subjective testing by a reasonably expert viewer can therefore be
expected to remain an important part of system evaluation or monitoring. Even with all the
excellent objective testing methods available today for analog and full-bandwidth digital video, it is
important to have human observation of the pictures. There are impairments which are not easily
measured yet are obvious to a human observer. This situation certainly has not changed with the
introduction of modern digital compression.
Prior to the advent of digital compression, formal subjective testing had been used for many years
with a relatively stable set of standard methods. The standard methodology for subjective testing is
described in ITU-R BT.500 (Ref. 2). The process can be summarised as follows: a number of non-
expert observers are selected, tested for their visual capabilities, shown a series of test scenes for
about 10 to 30 minutes in a controlled environment, then asked to score the quality of the scenes in
one of a variety of prescribed schemes.
A detailed description of the various subjective quality measurement techniques is outside the scope
of this document, but here is a list of some of the well-known methods:
Double Stimulus Impairment Scale (DSIS)
Double Stimulus Continuous Quality Scale (DSCQS)
Single Stimulus (SS) Methods
Stimulus Comparison Method
Single Stimulus Continuous Quality Evaluation (SSCQE)
Simultaneous Double Stimulus for Continuous Evaluation (SDSCE)
Alongside these defined methods are some that start to bridge the gap between subjective and
objective picture quality measurements (added as appendices to ITU-R BT.500). These concern the
analysis of picture-content failure characteristics and composite failure characteristics of program
and transmission conditions.
As well as having a range of measurement methods to choose from, there are also alternative
approaches to take over viewing conditions, choice of observers, scaling method for scoring
opinions, reference conditions, signal sources for the test scenes, timing of the presentation of the
various test scenes, selection of a range of test scenes, and analysis of the resulting scores which
leads to a complex maze of possibilities. Ideally the selection of the parameters for each of these
elements should reflect the intended application of the television system.
The main advantages of subjective testing techniques are:
Valid results are produced for both conventional and compressed television systems.
A scalar mean opinion score (MOS) is obtained.
It works well over a wide range of still and motion picture applications.
Video Quality Analysis Application Note
Page 7 of 36
Its weaknesses are:
The wide variety of possible methods and test element parameters that must be considered.
Meticulous test set-up and control is required.
The number of observers that are required, each of whom must be selected and screened.
The overall complexity makes it very time consuming and expensive.
The net result is that subjective tests are really only applicable to R&D. They do not lend
themselves to operational monitoring, production line testing, or system troubleshooting.
Objective Tests
The need for an objective method of testing picture quality is clear. Subjective testing is too
complex and the results are too variable. However, since it is the observers' opinion of picture
quality that counts, the primary goal of any objective measurement system must be to correlate well
with subjective results for the same system and test material.
Objective testing methods typically do not measure picture quality directly. Instead, they provide an
indication of how much a picture or scene has degraded compared to a reference copy of that
picture or scene. Such comparisons help to eliminate variations due to the actual content of the
pictures (introduced for example when comparing fast-action sports with a drama). These types of
measurements are usually called full-reference or reduced-reference measurements.
Over the past few years a wide variety of methods have been investigated for objective testing of
picture quality in compressed video systems. Many of these techniques are described in the
documents ITU-T J.144 (Ref. 3) and the Final Report of the Video Quality Experts Group (Ref. 4).
The methods proposed fall into two categories: Feature Extraction and Picture Differencing.
Feature Extraction methods involve the mathematical analysis of a source image or sequence, in
order to derive certain key characteristics which describe the essential features of the image. This
information can typically be coded using much less data than the source image itself. The calculated
characteristics of both reference and degraded images are compared to determine an objective
quality score.
Picture Differencing methods involve pixel-by-pixel comparison of reference and degraded images.
Some techniques employ pre-filtering of the image data, or post-filtering of the resulting difference
information, in order to improve the accuracy of the results. The difference detected between the
images is summed and scaled to give the objective quality score.
Feature Extraction techniques have the advantage that the feature information is contained in a
relatively small amount of data, and therefore may be sent in the transmission channel along with
the image content. This enables “in-service” measurement of objective picture quality, without the
need for special test patterns or sequences. However, research undertaken by a variety of image
processing laboratories has shown that results provided by feature extraction techniques do not
correlate very well with subjective test results, and it is the picture differencing methods that tend to
produce more reliable results.
The most obvious picture differencing method is to simply subtract the reference and degraded
pictures without any filtering or pre-processing. If the difference is zero, the pictures are identical.
When the pictures are different, a mean-square-error (MSE) can be calculated pixel-by-pixel, the
value of which is larger the bigger the difference between the reference and degraded pictures.
Video Quality Analysis Application Note
Page 8 of 36
Another way to express this direct picture difference is as the peak signal-to-noise ratio or PSNR,
which is calculated in a similar way to analog signal-to-noise ratios as the log of the ratio of the
square of the peak signal (255 in an 8-bit system) to the MSE. There are several picture quality
analyzers currently available which support this measurement technique. The principal advantage of
the PSNR method is that it is a well-understood and repeatable algorithm that is in the public
domain. The disadvantage of PSNR is that the results do not correlate particularly well with the
results of subjective picture tests.
To improve on the accuracy of the PSNR, OmniTek developed an algorithm which combines the
picture-difference calculation with compensation factors based on the overall brightness of the
image (because errors in dark parts of an image are not visible) and an edge-enhancement facility
which localizes ‘mosquito noise’ around sharp edge transitions. The result is the compensated
signal-to-noise ratio measurement, or CSNR. This technique aims to provide a more accurate real-
world assessment of picture degradation, and the correlation of objective picture quality with the
subjective tests is indeed improved.
Details of the PSNR and CSNR algorithms are given in an appendix to this application guide.
Other Quality Checks
While comparing the degraded image against a reference image is the most reliable way of
assessing the change in quality of a picture as it progresses through a transmission chain, there are a
number of “single-ended” absolute measurements which can be made on the degraded image that
are useful for ensuring that pictures are of adequate quality for broadcast.
Macroblock Detection
As part of the processing algorithm, MPEG and JPEG image compression schemes split the source
pictures into macroblocks e.g. of 8x8 or 16x16 pixels. When the compression bit-rate is reduced too
far, these macroblocks become highly visible in the processed image. The human visual system is
very sensitive to regular edges in a picture, so it is important to be able to monitor the level of
macroblock artefacts in a processed image. This level can be determined directly from the test
signal.
YCbCr Range and RGB Gamut
Broadcast engineers need to know that the picture colour component levels are within the
recommended broadcast limits (as specified for example in ITU-R BT.601, or SMPTE 274M etc.)
This is an important test as it is quite possible for data compression to introduce artefacts into
broadcast pictures that add out-of-range values. In addition to gross signal range checks, it is also
useful for video editors to know whether images contain colour values that are in-range but are
“illegal” in RGB colour space (and so could clip or distort the image on a final display device).
Again all these measurements can be made directly on the test image.
Picture Freeze and Black Detection
Picture quality analysis of broadcast images is often carried out in a remote-control environment. In
such set-ups, it is useful for the system to be able to detect catastrophic errors in the transmission
path such as loss of input, picture freeze, or black output and to raise a suitable alarm (for example
via network SNMP trap, GPO trigger, etc.).
Video Quality Analysis Application Note
Page 9 of 36
3. The OmniTek Quality Analysis System OmniTek’s Quality Analysis system is designed to meet the needs of broadcast & transmission
engineers, research laboratories, and manufacturing companies who require a reliable and cost-
effective system for making picture quality measurements. The system is compatible with all SD,
HD and 3Gb/s video formats.
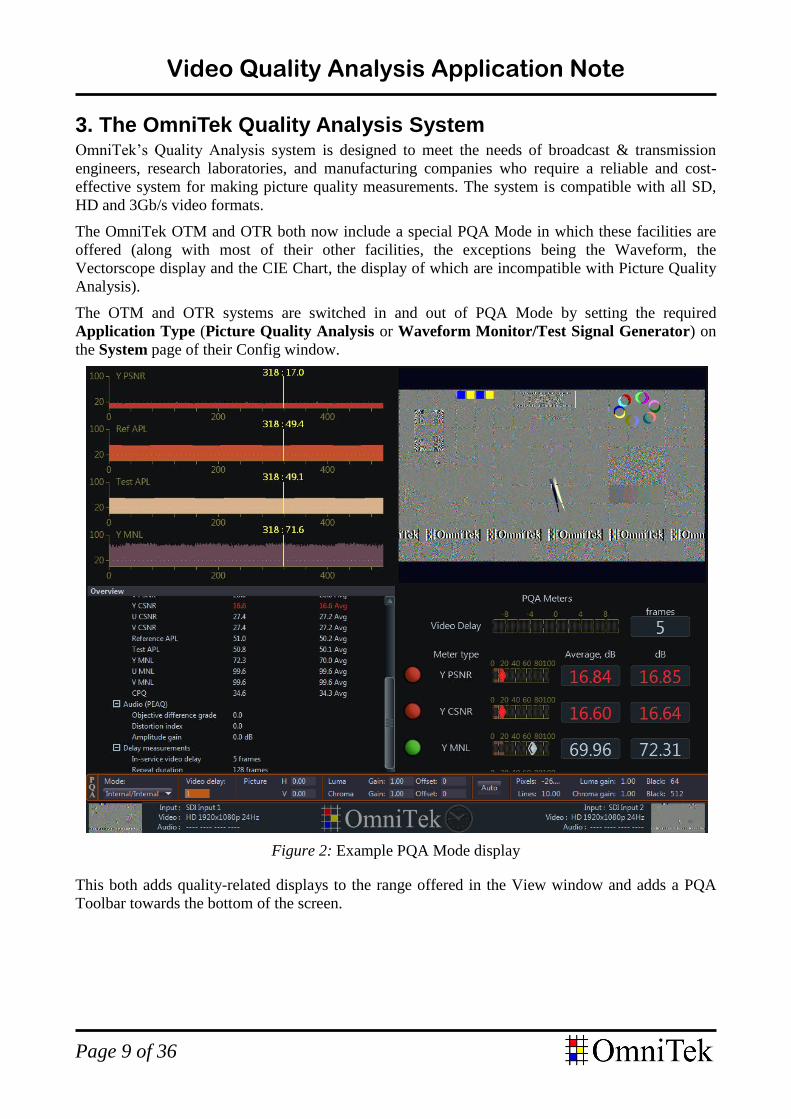
The OmniTek OTM and OTR both now include a special PQA Mode in which these facilities are
offered (along with most of their other facilities, the exceptions being the Waveform, the
Vectorscope display and the CIE Chart, the display of which are incompatible with Picture Quality
Analysis).
The OTM and OTR systems are switched in and out of PQA Mode by setting the required
Application Type (Picture Quality Analysis or Waveform Monitor/Test Signal Generator) on
the System page of their Config window.
Figure 2: Example PQA Mode display
This both adds quality-related displays to the range offered in the View window and adds a PQA
Toolbar towards the bottom of the screen.
Video Quality Analysis Application Note
Page 10 of 36
The core of an objective picture quality analysis is the use of either the standard PSNR algorithm or
OmniTek’s Compensated Signal-To-Noise Ratio (CSNR) to obtain accurate, robust, and repeatable
measurements of image degradation through a transmission path. However, a real-world
implementation of a complete picture quality measurement system also needs to provide:
Storage and play out of reference images and motion sequences;
Input processing of degraded images, including automatic gain & delay compensation;
Visual display of differences between reference & degraded images;
Error checking and analysis of the signal input transport streams;
Checking and logging of gross content errors;
Presentation of test results, including comparisons with previous tests;
Audio/Video lip-sync delay measurement capabilities.
The OTM and OTR systems offer a complete, fully-integrated picture quality and status monitoring
system that meets the performance requirements as listed above. The system supports all SD, HD
and 3Gb/s broadcast video formats, and is equally at home in an R&D laboratory, broadcast studio,
multi-channel play-out centre, or manufacturing production line.
They perform two classes of signal measurement:
Full-Reference Measurements comparing reference and test images in real-time:
PSNR: Calculated every field for luma and chroma separately.
CSNR: Compensated SNR, using edge-enhancement and picture-level compensation.
Picture difference: Real-time display of difference between test & reference sources.
Single-Ended Measurements performed directly on a test video signal.
SDI transport checks: TRS codes, CRC/EDH error counts, ANC checksums.
Signal range checks: YCbCr / RGB range & gamut calculations.
Content checks: Picture black & picture freeze.
Picture Level: Average picture level calculation.
Artefacts: Macroblock detection & counting.
The results of the various measurements are displayed as continuous-time or static graphs, together
with a range of real-time image/data displays. In addition, snapshots of this data can be saved to
XML-format files. The OmniTek systems are also fully SNMP compliant, providing capabilities
such as full remote control of the operation of the system plus generation of alarm traps when any
measurement parameter exceeds user-defined threshold levels.
The images that are analysed may be taken either from external live SDI inputs or from internal
real-time video signal generators that play image sequences in any video format, from data stored
on the PC internal hard disk or transferred into the PC over a data network.

Video Quality Analysis Application Note
Page 11 of 36
Three basic comparisons can be made: these are of:
one stored image against another stored image;
a live image against a stored image; and
a live image against another live image.
It is therefore possible to compare an external signal which has been through a suspect transmission
path against an uncompressed reference version of the image sequence, generated internally.
The types of comparison that can be made are reflected both in the PQA Operating Modes and in
the System Architecture.
Operating Modes
Quality Analysis is carried out in three distinct modes – Internal/Internal; Internal/External; and
External/External.
Internal/Internal
In Internal/Internal mode, the two internal generators are each used to play stored images or image
sequences. Generator 1 is used to play the reference sequence, while Generator 2 is used to play the
test sequence. No external connections to the unit are necessary.
This mode is typically used to test the quality of copies generated by other equipment.
Internal/External
Internal/External mode is used to determine the effect on picture quality of a transmission path
(typically through one or more pieces of equipment).
The chosen sequence is played in an infinite loop on Generator 1. The output from this generator is
fed both to the external hardware under test and directly into the OTM/OTR’s Analyzer, while the
output from the external hardware is fed back into one of the SDI inputs. (The usual configuration
requires this output to be fed into Input 2 but it can alternatively be fed into Input 1 if the SDI Input
Swap option is ticked.) Calculations then show the differences that have resulted from passing the
signal through the external hardware.
External/External
In this mode, two separate source signals are fed into the OTM/OTR, which looks at the difference
between the two signals. This mode may be used to determine the level of degradation suffered at
different points in a transmission chain. Another typical use for the External/External mode is in
production testing.
For these tests, the choice of which signal takes the role of the reference signal and which takes the
role of the test signal depends on which signal has suffered the greater external delay because that
signal needs to be treated as the Test signal.

Video Quality Analysis Application Note
Page 12 of 36
Architecture
The system architecture used to carry out Quality Analysis is outlined in the following diagram:
SD/HD/3G SDI In 2
SD/HD/3G SDI Out 2
Generator 2
SDI Input
Error Checks
SD/HD/3G SDI In 1
SD/HD/3G SDI Out 1
Generator 1
SDI Input
Error Checks
Picture Quality
Analysis
In-Service
A/V Delay
Reference
Test
‘Auto’
option
Manual
Control
Gain/Offset
Adjustment
Delay
Figure 3: System overview, showing how live inputs and stored sequences are compared
to assess Picture Quality and ‘In-Service’ A/V Delay
The key components of this architecture are as follows:
SDI Inputs: The two multi-format SDI inputs (75 ohm BNC connectors) provided on the
OTM/OTR back panel.
SDI Outputs: The two similarly multi-format SDI outputs (75 ohm BNCs), with the video sources
coming from the internal generators (or as an active loop-thru from the corresponding SDI input).
Generators: Generators are needed for Internal/Internal and Internal/External comparisons.
One generator is needed for Internal/External comparisons: two for Internal/Internal comparisons.
(The second generator is provided by adding the GEN_2 software option. The generators play out
image data from the hard disk.
Delay: Since passing a signal through a test channel inevitably adds some delay, this block acts as a
Delay Compensator. It can be adjusted both automatically and manually.
In-Service A/V Delay: This block has two roles. Its principal role is to provide Lip-Sync
measurements from the video being processed. Its other role is to provide A/V Delay data for use in
setting the above Delay block.
Picture Quality Analysis: This block carries out the required comparisons of the Reference and
Test video streams.
Video Quality Analysis Application Note
Page 13 of 36
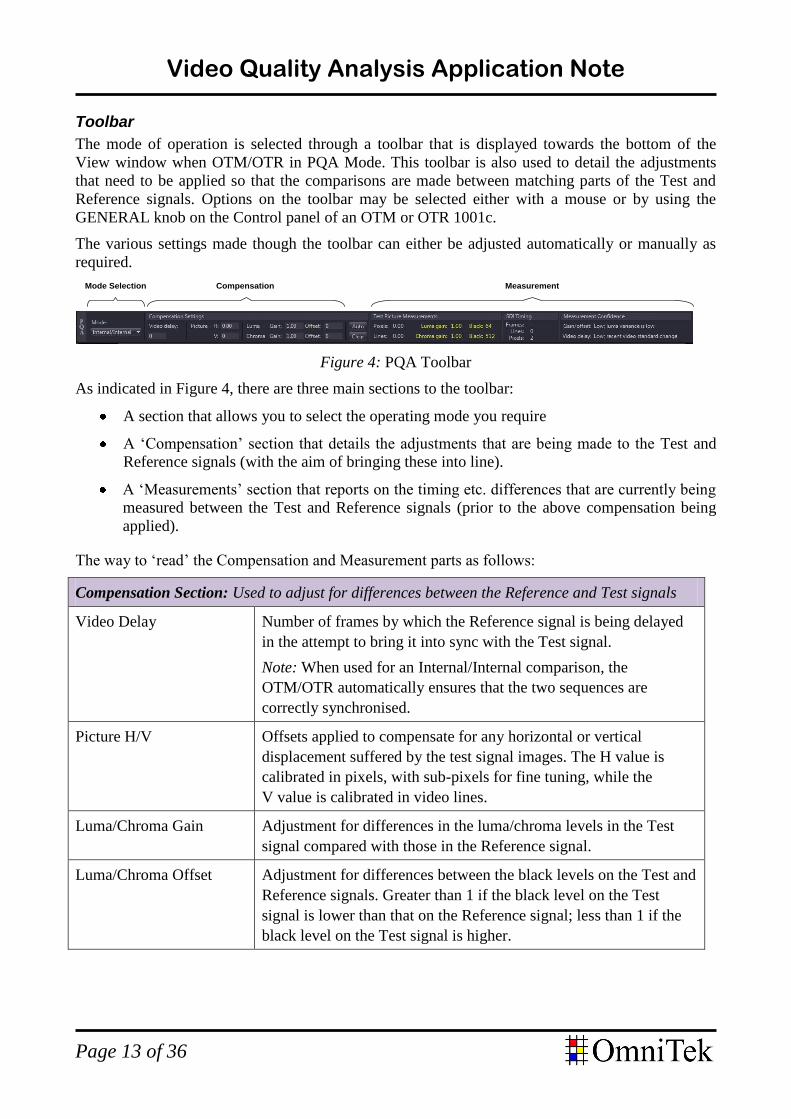
Toolbar
The mode of operation is selected through a toolbar that is displayed towards the bottom of the
View window when OTM/OTR in PQA Mode. This toolbar is also used to detail the adjustments
that need to be applied so that the comparisons are made between matching parts of the Test and
Reference signals. Options on the toolbar may be selected either with a mouse or by using the
GENERAL knob on the Control panel of an OTM or OTR 1001c.
The various settings made though the toolbar can either be adjusted automatically or manually as
required.
Mode Selection Compensation Measurement
Figure 4: PQA Toolbar
As indicated in Figure 4, there are three main sections to the toolbar:
A section that allows you to select the operating mode you require
A ‘Compensation’ section that details the adjustments that are being made to the Test and
Reference signals (with the aim of bringing these into line).
A ‘Measurements’ section that reports on the timing etc. differences that are currently being
measured between the Test and Reference signals (prior to the above compensation being
applied).
The way to ‘read’ the Compensation and Measurement parts as follows:
Compensation Section: Used to adjust for differences between the Reference and Test signals
Video Delay Number of frames by which the Reference signal is being delayed
in the attempt to bring it into sync with the Test signal.
Note: When used for an Internal/Internal comparison, the
OTM/OTR automatically ensures that the two sequences are
correctly synchronised.
Picture H/V Offsets applied to compensate for any horizontal or vertical
displacement suffered by the test signal images. The H value is
calibrated in pixels, with sub-pixels for fine tuning, while the
V value is calibrated in video lines.
Luma/Chroma Gain Adjustment for differences in the luma/chroma levels in the Test
signal compared with those in the Reference signal.
Luma/Chroma Offset Adjustment for differences between the black levels on the Test and
Reference signals. Greater than 1 if the black level on the Test
signal is lower than that on the Reference signal; less than 1 if the
black level on the Test signal is higher.
Video Quality Analysis Application Note
Page 14 of 36
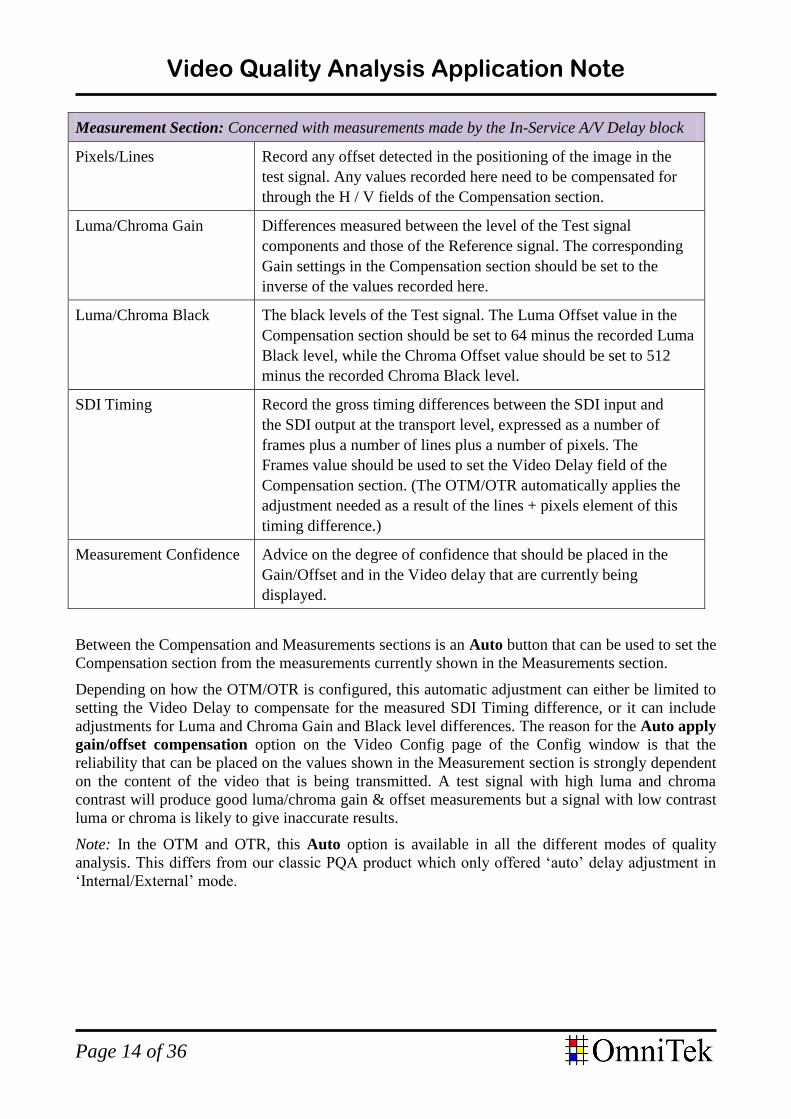
Measurement Section: Concerned with measurements made by the In-Service A/V Delay block
Pixels/Lines Record any offset detected in the positioning of the image in the
test signal. Any values recorded here need to be compensated for
through the H / V fields of the Compensation section.
Luma/Chroma Gain Differences measured between the level of the Test signal
components and those of the Reference signal. The corresponding
Gain settings in the Compensation section should be set to the
inverse of the values recorded here.
Luma/Chroma Black The black levels of the Test signal. The Luma Offset value in the
Compensation section should be set to 64 minus the recorded Luma
Black level, while the Chroma Offset value should be set to 512
minus the recorded Chroma Black level.
SDI Timing Record the gross timing differences between the SDI input and
the SDI output at the transport level, expressed as a number of
frames plus a number of lines plus a number of pixels. The
Frames value should be used to set the Video Delay field of the
Compensation section. (The OTM/OTR automatically applies the
adjustment needed as a result of the lines + pixels element of this
timing difference.)
Measurement Confidence Advice on the degree of confidence that should be placed in the
Gain/Offset and in the Video delay that are currently being
displayed.
Between the Compensation and Measurements sections is an Auto button that can be used to set the
Compensation section from the measurements currently shown in the Measurements section.
Depending on how the OTM/OTR is configured, this automatic adjustment can either be limited to
setting the Video Delay to compensate for the measured SDI Timing difference, or it can include
adjustments for Luma and Chroma Gain and Black level differences. The reason for the Auto apply
gain/offset compensation option on the Video Config page of the Config window is that the
reliability that can be placed on the values shown in the Measurement section is strongly dependent
on the content of the video that is being transmitted. A test signal with high luma and chroma
contrast will produce good luma/chroma gain & offset measurements but a signal with low contrast
luma or chroma is likely to give inaccurate results.
Note: In the OTM and OTR, this Auto option is available in all the different modes of quality
analysis. This differs from our classic PQA product which only offered ‘auto’ delay adjustment in
‘Internal/External’ mode.
Video Quality Analysis Application Note
Page 15 of 36
4. The Picture Quality Tests The steps used to make the quality measurements can be broadly summarised as follows:
1. Select the ‘Mode’ corresponding to the comparison you want to make (Internal/Internal,
Internal/External or External/External).
2. Set the Output Video Standard to the standard of the video you are testing (Internal/Internal
and Internal/External modes only).
3. Set the video inputs as required.
4. Select the appropriate Video Timing Reference.
5. Align the test video to the reference copy.
6. Monitor and, where appropriate, capture the generated graphs etc.
The detailed steps to take, however, depend on the details of the comparison you want to make – as
described below.
The section ends with a brief discussion of test materials.
IMPORTANT: For quality assessments to be meaningful, the sequences that are being compared
need to be co-timed horizontally (including sub-pixel phase shift), vertically, and temporally –
and to be of equal gain & offset. OmniTek provide tools to assist in achieving correct alignment
(as described in the following sections). However, before carrying out the test, we would always
recommend carrying out a quick visual check that all is correct by displaying one of the PSNR or
CSNR difference displays (see page 24). If both pictures are timed correctly, the difference
display will be mid-gray and the only visible features will be the artefacts which represent the
difference between the two signals. If there is an H, V, or T difference between the images, this
will typically show up as “fringing effects” on parts of the display.
You also need to have the correct software options installed on your system. The options you
need depend on the type of comparison you want to carry out. For details, see Appendix II of this
Application Note.
Video Quality Analysis Application Note
Page 16 of 36
Comparing Stored Video against a Reference Copy
Note: This type of comparison requires the GEN_2 and GEN_MOTION software options in
addition to the standard options needed for quality analysis.
The effect of different coding algorithms (for example) may be assessed by comparing a stored
section of video against a reference copy of that video (also stored).
For this test, the OTM/OTR is set into Internal/Internal mode, Generator 1 is used to play the
reference copy, and Generator 2 is used to play the test copy.
The image data you work with can be either individual images or sets of images forming a
sequence, and can be in any of the standard PC file formats (.bmp, .jpg, .yuv, .tif file formats etc.).
The generators can also use uncompressed video captured live from the SDI inputs (but note that to
do this, you need the CAP_MOTION option to be installed on your system).
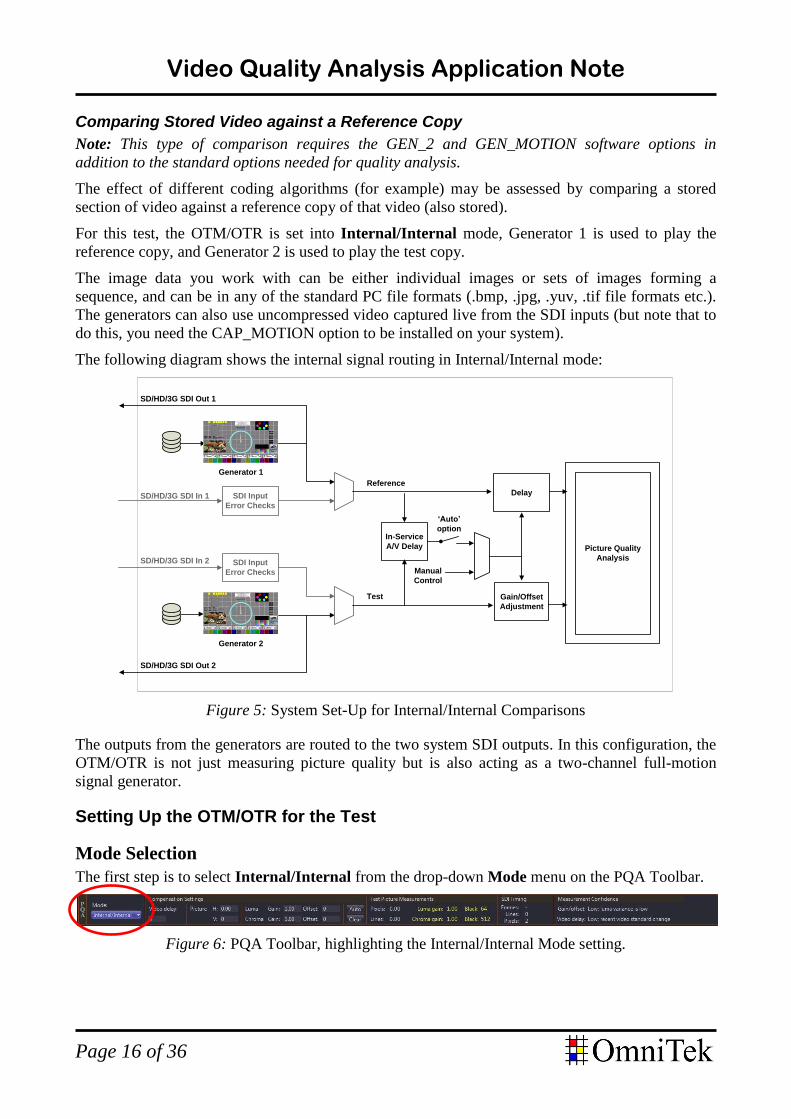
The following diagram shows the internal signal routing in Internal/Internal mode:
SD/HD/3G SDI In 2
SD/HD/3G SDI Out 2
Generator 2
SDI Input
Error Checks
SD/HD/3G SDI In 1
SD/HD/3G SDI Out 1
Generator 1
SDI Input
Error Checks
Picture Quality
Analysis
In-Service
A/V Delay
Reference
Test
‘Auto’
option
Manual
Control
Gain/Offset
Adjustment
Delay
Figure 5: System Set-Up for Internal/Internal Comparisons
The outputs from the generators are routed to the two system SDI outputs. In this configuration, the
OTM/OTR is not just measuring picture quality but is also acting as a two-channel full-motion
signal generator.
Setting Up the OTM/OTR for the Test
Mode Selection
The first step is to select Internal/Internal from the drop-down Mode menu on the PQA Toolbar.
Figure 6: PQA Toolbar, highlighting the Internal/Internal Mode setting.

Video Quality Analysis Application Note
Page 17 of 36
Video Standard
The video standard of the video under test needs to be set in the Gen window. (Use the Video
Standard option on the Button Bar to set this.)
It might seem that setting the precise format isn’t critical when you are working from files as the
data can always be rescaled to suit. However any rescaling should be avoided as it will inevitably
change the nature of the data to some degree, making the calculated results less accurate.
Setting the Video Timing Reference
It is also necessary to set the video timing reference to which the signals should be synchronised.
Set this either in the Gen window Properties control or by clicking on the entry at the top of the Gen
window. For Internal/Internal mode tests, Genlock is usually set to Free Run. It is only necessary
to synchronize the OTM/OTR to an external video timing reference if the serial digital outputs are
connected to external equipment.
Setting up the Inputs
The OTM/OTR is designed to treat the video analyzed by Analyser 1 as the reference video and the
video analysed by Analyser 2 as the test video. So you need to load and run the original sequence in
Generator 1 and the processed version in Generator 2. Important: The Resize Type for the video
being played out must be set to None in the Gen Window Properties control as any scaling will
affect the quality of the results.
Synchronising and Aligning
Outputs are synchronised through the PQA Toolbar.
The left-hand part of this toolbar is concerned with the adjustments made to the test signal; the
right-hand part of the toolbar shows the current values of the various measurements being made by
the In-Service A/V Delay facility. Full details of the fields included on this toolbar are given in
Section S.2 of the User Guide. With everything correctly aligned, the OTM/OTR will start
producing meaningful picture quality measurements based on the differences in the two sequences.
The values in the left-hand part of the toolbar can be set by hand, however the toolbar also includes
an Auto option that sets the left-hand section of the toolbar based on the values currently being
shown in the right-hand part of the toolbar.
Two options are available here – setting all the details or just setting the Video delay, depending on
the setting of the Auto apply gain/offset compensation option on the Video Config page of the
Config window. The reason for allowing this choice is that the reliability that can be placed on the
values shown in the Measurement section is strongly dependent on the content of the video that is
being transmitted. A test signal with high luma and chroma contrast will produce the best results for
the luma/chroma gain & offset measurement. A signal with low contrast luma or chroma will likely
give inaccurate results. The level of confidence that you can have in the current readings is reported
in the rightmost column of the PQA Toolbar.
With Internal/Internal tests, there should never be any need to set the Video delay as the OTM/OTR
automatically arranges that the reference and test sequences are played out synchronously.
However, when the confidence level is good enough, it makes sense to tick the Auto apply option
on the Video Config page and use the Auto button to adjust the gain and offset values
automatically.
How to control the calculations and the graphs, plus how to interpret the results, is explained
starting on page 24 of this Application Note.
Video Quality Analysis Application Note
Page 18 of 36
Comparing Live Video against a Stored Reference
Note: This type of comparison requires the GEN_MOTION software option in addition to the
standard options needed for quality analysis.
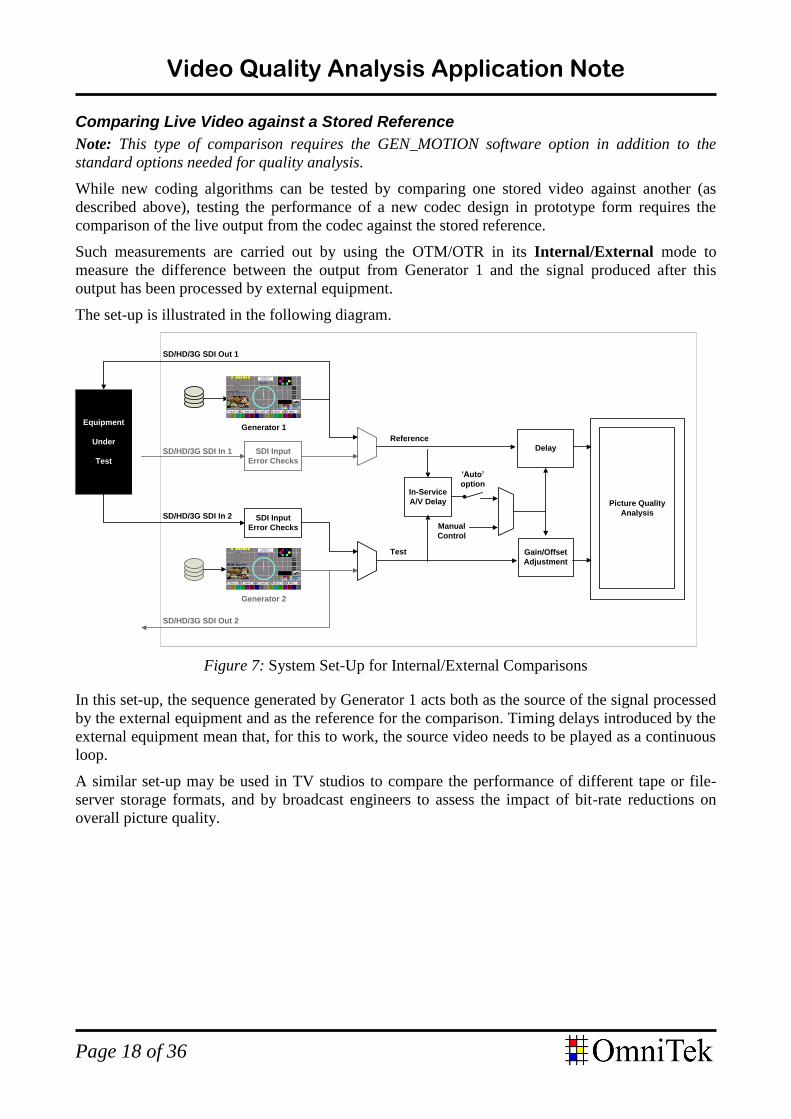
While new coding algorithms can be tested by comparing one stored video against another (as
described above), testing the performance of a new codec design in prototype form requires the
comparison of the live output from the codec against the stored reference.
Such measurements are carried out by using the OTM/OTR in its Internal/External mode to
measure the difference between the output from Generator 1 and the signal produced after this
output has been processed by external equipment.
The set-up is illustrated in the following diagram.
SD/HD/3G SDI In 2
SD/HD/3G SDI Out 2
Generator 2
SDI Input
Error Checks
SD/HD/3G SDI In 1
SD/HD/3G SDI Out 1
Generator 1
SDI Input
Error Checks
Picture Quality
Analysis
In-Service
A/V Delay
Reference
Test
‘Auto’
option
Manual
Control
Gain/Offset
Adjustment
Delay
Equipment
Under
Test
Figure 7: System Set-Up for Internal/External Comparisons
In this set-up, the sequence generated by Generator 1 acts both as the source of the signal processed
by the external equipment and as the reference for the comparison. Timing delays introduced by the
external equipment mean that, for this to work, the source video needs to be played as a continuous
loop.
A similar set-up may be used in TV studios to compare the performance of different tape or file-
server storage formats, and by broadcast engineers to assess the impact of bit-rate reductions on
overall picture quality.
Video Quality Analysis Application Note
Page 19 of 36
Setting Up the OTM/OTR for the Test
Mode Selection
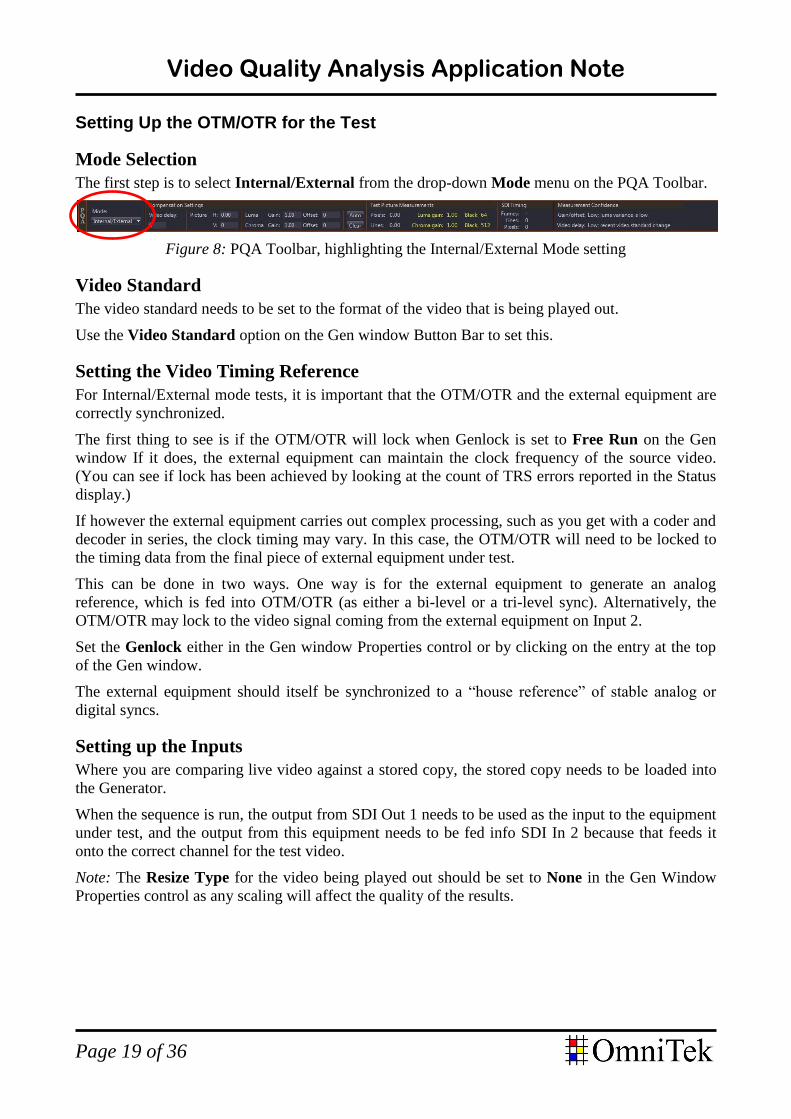
The first step is to select Internal/External from the drop-down Mode menu on the PQA Toolbar.
Figure 8: PQA Toolbar, highlighting the Internal/External Mode setting
Video Standard
The video standard needs to be set to the format of the video that is being played out.
Use the Video Standard option on the Gen window Button Bar to set this.
Setting the Video Timing Reference
For Internal/External mode tests, it is important that the OTM/OTR and the external equipment are
correctly synchronized.
The first thing to see is if the OTM/OTR will lock when Genlock is set to Free Run on the Gen
window If it does, the external equipment can maintain the clock frequency of the source video.
(You can see if lock has been achieved by looking at the count of TRS errors reported in the Status
display.)
If however the external equipment carries out complex processing, such as you get with a coder and
decoder in series, the clock timing may vary. In this case, the OTM/OTR will need to be locked to
the timing data from the final piece of external equipment under test.
This can be done in two ways. One way is for the external equipment to generate an analog
reference, which is fed into OTM/OTR (as either a bi-level or a tri-level sync). Alternatively, the
OTM/OTR may lock to the video signal coming from the external equipment on Input 2.
Set the Genlock either in the Gen window Properties control or by clicking on the entry at the top
of the Gen window.
The external equipment should itself be synchronized to a “house reference” of stable analog or
digital syncs.
Setting up the Inputs
Where you are comparing live video against a stored copy, the stored copy needs to be loaded into
the Generator.
When the sequence is run, the output from SDI Out 1 needs to be used as the input to the equipment
under test, and the output from this equipment needs to be fed info SDI In 2 because that feeds it
onto the correct channel for the test video.
Note: The Resize Type for the video being played out should be set to None in the Gen Window
Properties control as any scaling will affect the quality of the results.
Video Quality Analysis Application Note
Page 20 of 36
Synchronising and Aligning
The video sequence that has been loaded into Generator 1 runs in an infinite loop. This provides
both the reference signal and the signal that is passed through the external equipment.
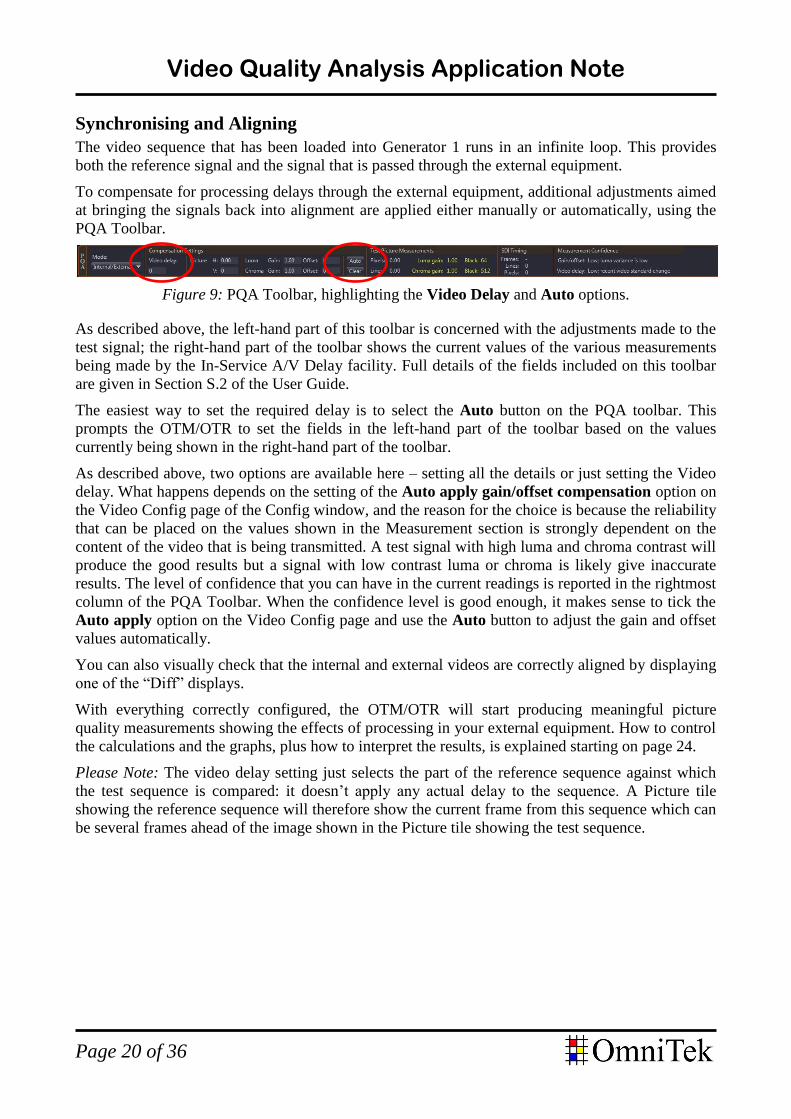
To compensate for processing delays through the external equipment, additional adjustments aimed
at bringing the signals back into alignment are applied either manually or automatically, using the
PQA Toolbar.
Figure 9: PQA Toolbar, highlighting the Video Delay and Auto options.
As described above, the left-hand part of this toolbar is concerned with the adjustments made to the
test signal; the right-hand part of the toolbar shows the current values of the various measurements
being made by the In-Service A/V Delay facility. Full details of the fields included on this toolbar
are given in Section S.2 of the User Guide.
The easiest way to set the required delay is to select the Auto button on the PQA toolbar. This
prompts the OTM/OTR to set the fields in the left-hand part of the toolbar based on the values
currently being shown in the right-hand part of the toolbar.
As described above, two options are available here – setting all the details or just setting the Video
delay. What happens depends on the setting of the Auto apply gain/offset compensation option on
the Video Config page of the Config window, and the reason for the choice is because the reliability
that can be placed on the values shown in the Measurement section is strongly dependent on the
content of the video that is being transmitted. A test signal with high luma and chroma contrast will
produce the good results but a signal with low contrast luma or chroma is likely give inaccurate
results. The level of confidence that you can have in the current readings is reported in the rightmost
column of the PQA Toolbar. When the confidence level is good enough, it makes sense to tick the
Auto apply option on the Video Config page and use the Auto button to adjust the gain and offset
values automatically.
You can also visually check that the internal and external videos are correctly aligned by displaying
one of the “Diff” displays.
With everything correctly configured, the OTM/OTR will start producing meaningful picture
quality measurements showing the effects of processing in your external equipment. How to control
the calculations and the graphs, plus how to interpret the results, is explained starting on page 24.
Please Note: The video delay setting just selects the part of the reference sequence against which
the test sequence is compared: it doesn’t apply any actual delay to the sequence. A Picture tile
showing the reference sequence will therefore show the current frame from this sequence which can
be several frames ahead of the image shown in the Picture tile showing the test sequence.
Video Quality Analysis Application Note
Page 21 of 36
Comparing One Live Video against Another
Note: This type of comparison just requires the standard options needed for quality analysisto be
installed.
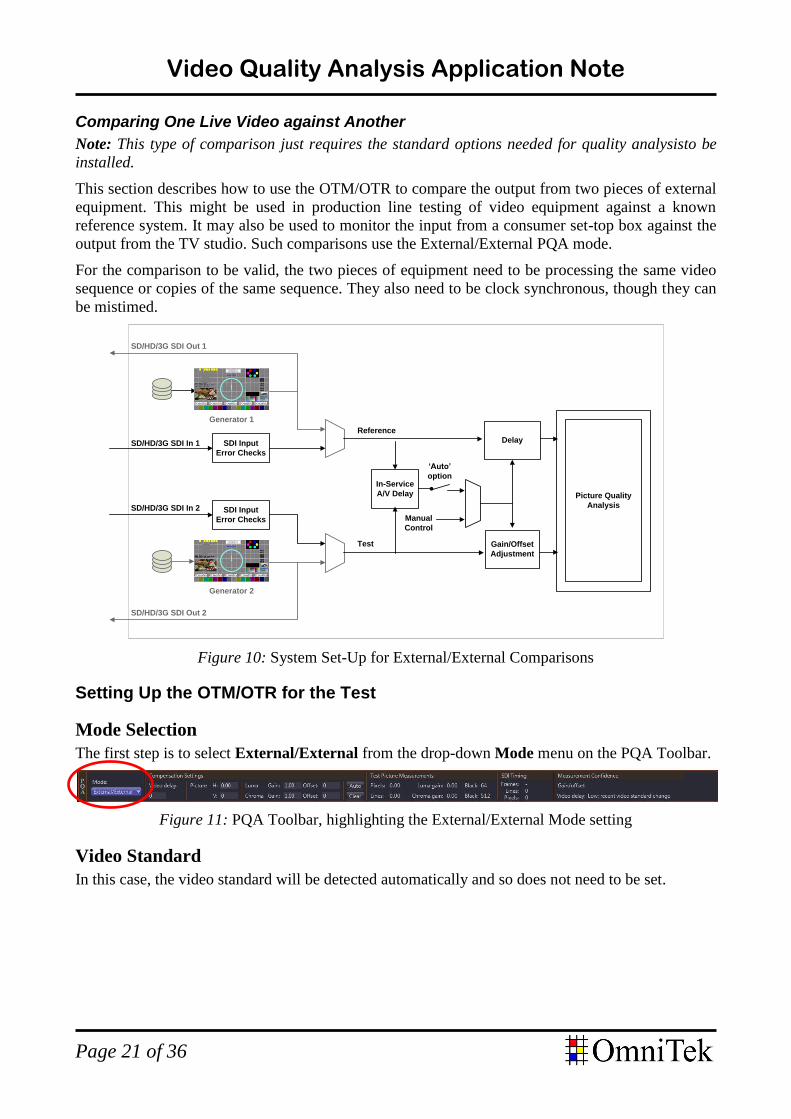
This section describes how to use the OTM/OTR to compare the output from two pieces of external
equipment. This might be used in production line testing of video equipment against a known
reference system. It may also be used to monitor the input from a consumer set-top box against the
output from the TV studio. Such comparisons use the External/External PQA mode.
For the comparison to be valid, the two pieces of equipment need to be processing the same video
sequence or copies of the same sequence. They also need to be clock synchronous, though they can
be mistimed.
SD/HD/3G SDI In 2
SD/HD/3G SDI Out 2
Generator 2
SDI Input
Error Checks
SD/HD/3G SDI In 1
SD/HD/3G SDI Out 1
Generator 1
SDI Input
Error Checks
Picture Quality
Analysis
In-Service
A/V Delay
Reference
Test
‘Auto’
option
Manual
Control
Gain/Offset
Adjustment
Delay
Figure 10: System Set-Up for External/External Comparisons
Setting Up the OTM/OTR for the Test
Mode Selection
The first step is to select External/External from the drop-down Mode menu on the PQA Toolbar.
Figure 11: PQA Toolbar, highlighting the External/External Mode setting
Video Standard
In this case, the video standard will be detected automatically and so does not need to be set.

Video Quality Analysis Application Note
Page 22 of 36
Setting the Video Timing Reference
For consistent results to be produced, the two video input signals need to be synchronized.
The OTM/OTR will need to be locked to the timing data from the final piece of external equipment
under test. This can be done in two ways. One way is for the external equipment to generate an
analog reference, which is fed into OTM/OTR (as either a bi-level or a tri-level sync). Alternatively,
the OTM/OTR may lock to the video signal coming from the external equipment. To do this, the
OTM/OTR should be set to lock to the appropriate serial input (typically Input 2).
The external equipment should itself be synchronized to a “house reference” of stable analog or
digital syncs.
Setting up the Inputs
The inputs need to arranged such that whichever signal is in advance of the other is used as the
reference, while the signal that is behind is treated as the test signal. The reason for this is because
the mechanism available for aligning the signals involves applying a delay to the reference signal.
Alignment can only be achieved if the reference signal is in advance of the test signal. Hence the
signal that is in advance has to be used as the reference.
Synchronising and Aligning
The two sources compared in an External/External mode test need to be clock synchronous but they
can be mis-timed.
The two signals are re-timed by altering the relative delay on the receiver circuits. The bulk of this
adjustment is done by adjusting the Video delay at the left-hand end of the PQA toolbar. The
remainder of the adjustment is carried out automatically.
This is most easily done by selecting the Auto button on the PQA toolbar. This prompts the
OTM/OTR to set the fields in the left-hand part of the toolbar based on the values currently being
shown in the right-hand part of the toolbar.
Figure 12: PQA Toolbar, highlighting the Video delay setting and the Auto option.
As in the other types of test, the range of fields that are adjusted when Auto is selected depends on
setting of the Auto apply gain/offset compensation option on the Video Config page of the
Config window. If the level of confidence reported at the rightmost end of the PQA toolbar is good
enough, it is worth ticking this Auto apply option whereupon selecting the Auto option will set all
aspects of the Compensation section. If the confidence level is not so good, however, you may be
better off leaving the Auto apply option unticked and setting the other parameters manually.
Once the Frame delay and the other adjustments have been made, the PQA can start making valid
measurements showing the effects of processing in your external equipment. How to control the
calculations and the graphs, plus how to interpret the results, is explained starting on page 24.
Note: Again it should be remembered that the video delay setting just selects the part of the
reference sequence against which the test sequence is compared: it doesn’t apply any actual delay to
the sequence. A Picture tile showing the reference sequence will therefore show the current frame
from this sequence which can be several frames ahead of the image shown in the Picture tile
showing the test sequence.
Video Quality Analysis Application Note
Page 23 of 36
Choice of Test Materials
The following organizations have source video material available which is of interest for picture
quality measurement purposes.
Society of Motion Picture and Television Engineers (SMPTE)
SMPTE have a variety of source material available. Probably best known are the Recommended
Practice 222 sequences for 525-line and 625-line tests, which includes familiar image sequences
such as “flower garden” and “mobile and calendar”. These sequences are all derived from
uncompressed original material, and they are available for purchase in the form of tapes or YUV-
format data files on a hard-disk drive. The images are fully compatible with the OmniTek PQA
system.
http://store.smpte.org/
Video Quality Experts Group (VQEG)
VQEG perform a lot of research work on the subject of picture quality, and they have made
available a range of materials in both SD and HD formats for testing purposes. These image
sequences are available as reference images, together with versions of the same images that have
been through a variety of different compression codecs. The data is in the form of uncompressed
YUV files and is downloadable free-of-charge from the VQEG website.
http://www.its.bldrdoc.gov/vqeg/

Video Quality Analysis Application Note
Page 24 of 36
5. Capturing the Results The OTR reports signal quality and status in a range of ways:
Scrolling graphs showing the results of various picture quality measurements
Real-time displays of difference measurements
Real-time status information about system inputs
These displays can be used to assess different aspects of the overall quality of live or stored images.
In addition, measurements can be logged in XML files for further analysis (this is described in
Sections 5 and 6).
Picture Quality Graphs
Real-time graphical displays of the results of the various quality calculations are displayed in the
PQA Charts window, which is called up either by pressing the WFM button (on an OTM or an OTR
1001c) or by taking PQA Charts from the WFM section of the View Tile Browser.
An example of the display is shown below.
Figure 13: Example PQA Charts display.
The display comprises a number of graphs, each with a horizontal ‘time’ axis (calibrated in video
frames) and a vertical axis showing ‘picture quality’ on a scale of 0 – 100 where 100 is best. The
horizontal axis is normally set to show the results from the last 500 frames (with the results from the
most recent frame on the right) but you can set a different ‘Duration’ (on the Video Config page).
The display includes a cursor which can be moved left and right, and used to read-off the values of
the different parameters at a particular frame number.
The Properties control associated with the PQA Charts display allows you (among other things) to
select which graphs are displayed.
Video Quality Analysis Application Note
Page 25 of 36
The different graphs that may be displayed are described below.
PSNR Graphs
The PSNR graphs show peak signal-to-noise ratio measurements, calculated in real-time for the
luma component (PSNR-Y) and the chroma component (PSNR-C). The algorithm used to calculate
the results is the industry-standard algorithm for PSNR, details of which are given in Appendix I.
Measurements are made on every field of the input video signal (or frame in progressive-scan
formats).
The vertical axis is calibrated in dB. In practical terms, a PSNR value of 100dB means that the test
and reference signals are identical, to an accuracy of one pixel per field. Opinions on the
interpretation of other PSNR values vary, but it is generally accepted that 30dB or below is
“unacceptable quality”.
CSNR Graphs
The CSNR graphs also show signal-to-noise ratio measurements but here edge-enhancement and
luma compensation techniques have been used to provide a measurement that reflects more closely
subjective visual determinations of picture quality. The CSNR algorithm is proprietary to OmniTek
and is dependent on an Edge-threshold parameter which is set on the Video Config page of the
Config window. Details of the algorithm are given in Appendix I.
Again the vertical axis of the quality graph is calibrated in dB, with a value of 100 indicating that
the test and reference images are identical. What CSNR level represents the boundary between
unacceptable quality and acceptable quality for any specific environment is really for the user to
decide, but it is suggested that a value of 40dB is a useful starting point for discussion.
APL Graphs
The APL graphs show the average luma level of the test image and the reference image. This level
is calculated simply by summing the total value of the pixel luma values over the whole video field
or frame, then dividing by the size of the field or frame.
On this graph, the vertical axis is calibrated in “percent full-scale digital”, such that a flat-field
image at SMPTE digital white level (940) will have a value of 940 / 1023 = 91.9% on the graph.
MNL Graphs
The MNL-Y and MNL-C graphs show the Macroblock Noise Level detected in the test image in
luma and chroma, respectively. These are single-ended measurements that do not require the
reference video to be present.
Macroblocks are artefacts typical of certain types of compression techniques, in particular those
used in JPEG and MPEG files. The MNL values are calculated by summing the number of block
edges detected in the image on a field-by-field (or, in progressive formats, frame-by-frame) basis.
The values obtained are scaled such that a value of 100 means no edges detected while 0 means that
many edges have been detected (i.e. poor overall quality).
The nature of the detection algorithm means that the basic MNL-Y and MNL-C measurements are
dependent on picture content and are anyway somewhat subjective. The OmniTek macroblock
algorithm therefore provides alternative edge and luma compensation modes that enhance the
accuracy of the basic calculation. These modes are enabled through the Video Config page of the
Config window. (Further details of the Video Config page are given in Section T.2 of the
OTM/OTR User Guide.)
Video Quality Analysis Application Note
Page 26 of 36
CPQ Graph
The OmniTek PQA software also allows you to specify a Combined Picture Quality (CPQ) value,
expressed as a weighted-average of the various PSNR, CSNR, and MNL graphs. The weighting
applied to each component measurement is set on the Video Config page of the Config window.
It is expected that each user will derive an in-house set of percentage weightings for the CPQ graph
that reflects the nature of the measurements they are performing. For example, wavelet compression
techniques such as JPEG2000 do not introduce any macroblock artefacts, so don’t need MNL-Y or
MNL-C values to be included in the CPQ weightings.
Note: It is up to the user to ensure that the total of the weightings adds up to 100%.
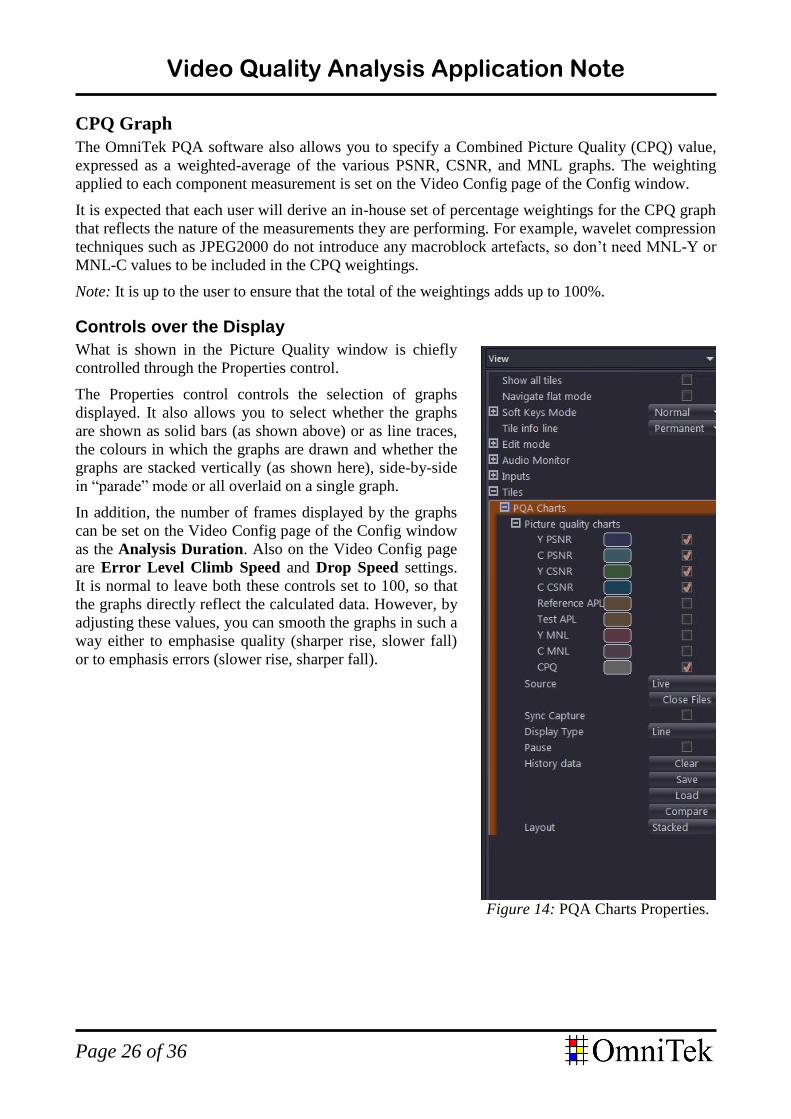
Controls over the Display
What is shown in the Picture Quality window is chiefly
controlled through the Properties control.
The Properties control controls the selection of graphs
displayed. It also allows you to select whether the graphs
are shown as solid bars (as shown above) or as line traces,
the colours in which the graphs are drawn and whether the
graphs are stacked vertically (as shown here), side-by-side
in “parade” mode or all overlaid on a single graph.
In addition, the number of frames displayed by the graphs
can be set on the Video Config page of the Config window
as the Analysis Duration. Also on the Video Config page
are Error Level Climb Speed and Drop Speed settings.
It is normal to leave both these controls set to 100, so that
the graphs directly reflect the calculated data. However, by
adjusting these values, you can smooth the graphs in such a
way either to emphasise quality (sharper rise, slower fall)
or to emphasis errors (slower rise, sharper fall).
Figure 14: PQA Charts Properties.

Video Quality Analysis Application Note
Page 27 of 36
Picture Difference Display
The Picture Difference display is one of the most useful “at a glance” quality measurement tools in
the OmniTek PQA system.
A number of difference displays are supported:
The difference between the PSNR values, with an overall signal gain of 1x, 2x, or 4x.
The difference between the CSNR values, with gain of 0.5x, 1x, 2x, or 4x.
The Edge map from the CSNR algorithm (see Appendix I).
For PSNR and CSNR difference displays, differences between the two channels are shown against a
grey background. If the two channels are identical, the difference output will be a mid-level grey.
The Difference display makes it relatively easy to spot if the two signals are correctly lined up
spatially and temporally:
Figure 14: Example difference image
Lip-Sync Issues
Another way is which video is degraded on transmission is through the differential effects of the
transmission channel on the audio and video elements of the signal, resulting in lip-sync issues.
These timing differences need to be adjusted for in carrying out picture quality assessments and
determining these differences is the job of the In-Service A/V Delay block within the OTM/OTR’s
quality analysis system.
One place the resulting measurements are displayed is on the PQA Toolbar where the delay to the
video signal is displayed as the SDI Timing details towards the right-hand end of the toolbar.
Full details are shown under the heading ‘Delay Measurements’ in the Quality Analysis section of
the Status Overview and on the Quality Analysis Status Summary (illustrated overleaf).
The maximum delay that can be measured by the In-Service A/V Delay block is 15s seconds across
all video standards. The audio delay is accurate to 1/48000 of a second (approx. 20µs).

Video Quality Analysis Application Note
Page 28 of 36
Figure 15: A/V Delay measurements displayed in Status Overview
Figure 16: Picture Quality and A/V Delay measurements displayed on
Quality Status Summary page

Video Quality Analysis Application Note
Page 29 of 36
6. Comparing Sets of Test Results The PQA Charts display is normally set to show the results from the most recent ‘N’ frames where
N is the Duration set on the Video config page of the Config window. (The default is for the results
from the last 500 frames to be shown.) The results from the most recent frame are added at the
right-hand end of each graph, making the graphs scroll from right to left continuously.
This is fine for viewing instantaneous picture quality results in real-time. However, for some
applications, it is useful to capture the results shown at different times and compare them.
Capturing the data
OmniTek offer two approaches to capturing this data:
Taking snapshots of the screen display; and
Capturing data synchronised to the play-out of the reference video being played out as a
loop on Generator 1 (but note that this is only offered when the OTM/OTR is operating in
either Internal/Internal mode or Internal/External mode)
Both sets of results may then be stored on disk as XML files.
Capturing a snapshot of the screen display is driven from the Save option on the Button Bar in the
PQA Charts display (or from the equivalent History data: Save option included in the Properties
control). Selecting this option takes the required snapshot: a File Save dialogue is then displayed for
you to specify where the data is to be stored and its filename.
The ‘Synchronous Capture’ offered in Internal/Internal or Internal/External mode uses the Sync
Capture option included on the PQA Charts Button Bar (or the corresponding option included in
the Properties control) – but the first thing to set is the number of cycles of the reference video that
you want to capture data from. This is set as the value of the Synchronised capture passes
parameter included on the System page of the Config window (default value 1). Selecting Sync
Capture then taking the Save option will capture the data from the selected number of loops
through the reference video, starting at Frame 1.
Comparing the data
Once the data has been captured, there are a couple of ways in which it can be compared against
other similar sets of data.
One option is to carry out a rough visual comparison of sets of saved data using the Source option
on the Button Bar in the PQA Charts display (also included in the Properties control). This calls up
one by one the sets of saved data that are currently available either as a result of having been
recently captured or recalled to the screen from disk by taking the Load option on the Button Bar
(or the equivalent History data: Load option in the Properties control).
The OTM/OTR also provides a graph trace comparison feature, which allows two stored XML
traces to be directly compared in the PQA Charts display. This mode is selected by taking the
Compare option on the Button Bar (or the equivalent History data: Compare option in the
Properties control), then using the File Selector that is displayed to pick out two XML files to
compare.
The resulting display shows the results from the two files, one as a set of green traces and the other
as a set of blue traces.

Video Quality Analysis Application Note
Page 30 of 36
Figure 17: Graph Trace Comparison Display
The green traces show the data from the first XML file you picked out while the blue traces show
the data from the second file. (The details of the files together with the colours used are shown as a
legend at the bottom of the display.) In addition, two values are shown alongside the cursor for each
graph in the display: the first value gives the value at the cursor position from the first file while the
second value gives the value at the cursor position from the second file.

Video Quality Analysis Application Note
Page 31 of 36
7. Driving Quality Analysis Remotely In common with other areas of operation, Picture Quality Monitoring can be driven remotely using
the SNMP Simple Network Management Protocol. This is an Ethernet-based control system that is
popular in the broadcast and electronics manufacturing sectors.
There are two parts to the SNMP capability. Firstly, the OTM/OTR can respond to certain SNMP
commands. Controllable functions include starting and stopping logging. Secondly, it is capable of
sending SNMP alerts when events that have been set as ‘Alarm traps’ occur.
All the functions that are controllable or reportable are recorded in a Management Information Base
(MIB) file which is supplied alongside the OTM/OTR.
The special feature of this SNMP control is that all the commonly used commands associated with
the ‘Classic’ OmniTek PQA system are also included in the relevant MIB. As a result, SNMP
scripts that have been created for use with the Classic OmniTek PQA system may be used without
modification to control an OTM or OTR running in PQA Mode. Moreover, the results given will be
the same as if the quality assessment had been carried out on a Classic PQA system.
You may however wish to modify the SNMP script to take advantage of the additional features
offered by the OTM and OTR:
Analysis of 3Gb/s video
Auto delay measurement in all three operation modes, not just Internal/External
Both Reference and Test APL measurements
This section looks at the various actions that are involved in setting up the PQA for remote control,
starting with installing SNMP.
Installing SNMP
In order to make use of the SNMP mechanism, you need to have installed the SNMP support
software. This software is an optional part of the Microsoft Windows XP or 2000 operating system.
Then, after the SNMP software has been installed, the PQA host PC needs to be told what IP
address to send any SNMP alarm traps to.
Information on how to install SNMP is available from the Microsoft Developer Network at
http://msdn.microsoft.com/<language>/library/ms950400.aspx.
Remote Control
The PQA may be controlled remotely by an external SNMP manager issuing GET and SET
commands to the PQA. These commands include Object IDs (OIDs) identifying the aspect of the
PQA which is affected. They typically also include a range of control parameters.
Examining the supplied MIB will show that full range of control capabilities that are supported,
together with the relevant Object IDs and control parameters to use. There is also further
information in Appendix II of the OTM/OTR User Guide.
Video Quality Analysis Application Note
Page 32 of 36
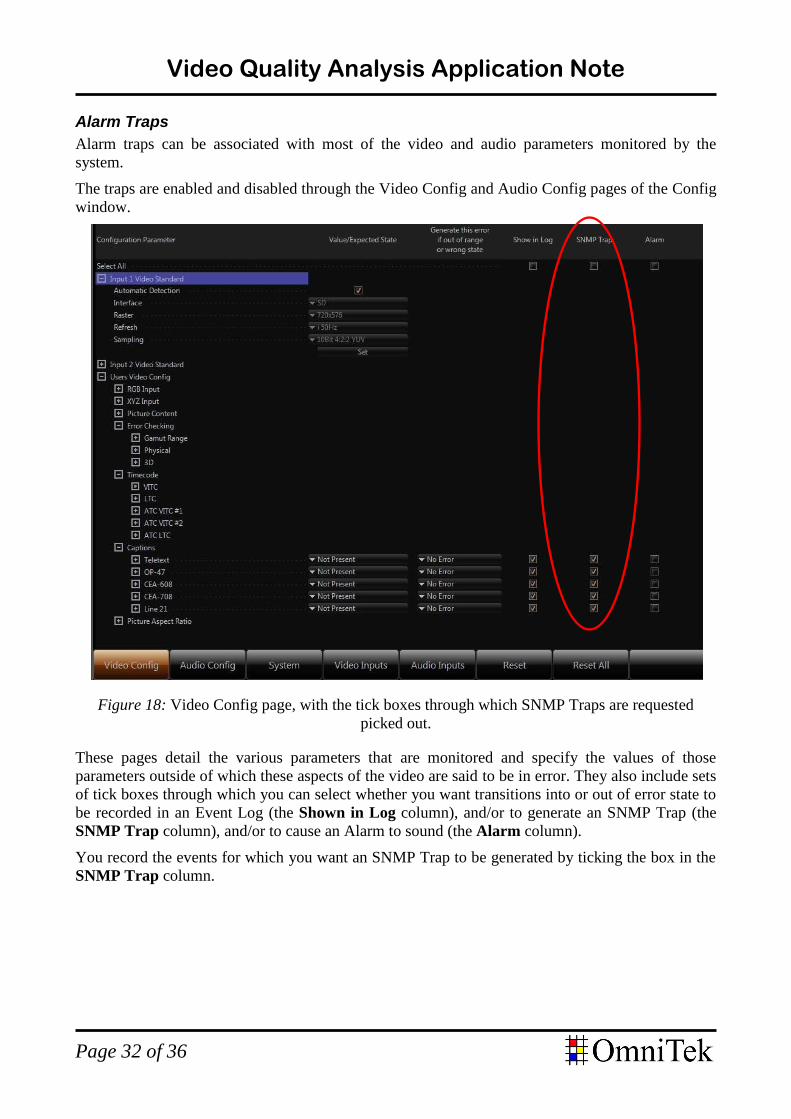
Alarm Traps
Alarm traps can be associated with most of the video and audio parameters monitored by the
system.
The traps are enabled and disabled through the Video Config and Audio Config pages of the Config
window.
Figure 18: Video Config page, with the tick boxes through which SNMP Traps are requested
picked out.
These pages detail the various parameters that are monitored and specify the values of those
parameters outside of which these aspects of the video are said to be in error. They also include sets
of tick boxes through which you can select whether you want transitions into or out of error state to
be recorded in an Event Log (the Shown in Log column), and/or to generate an SNMP Trap (the
SNMP Trap column), and/or to cause an Alarm to sound (the Alarm column).
You record the events for which you want an SNMP Trap to be generated by ticking the box in the
SNMP Trap column.
Video Quality Analysis Application Note
Page 33 of 36
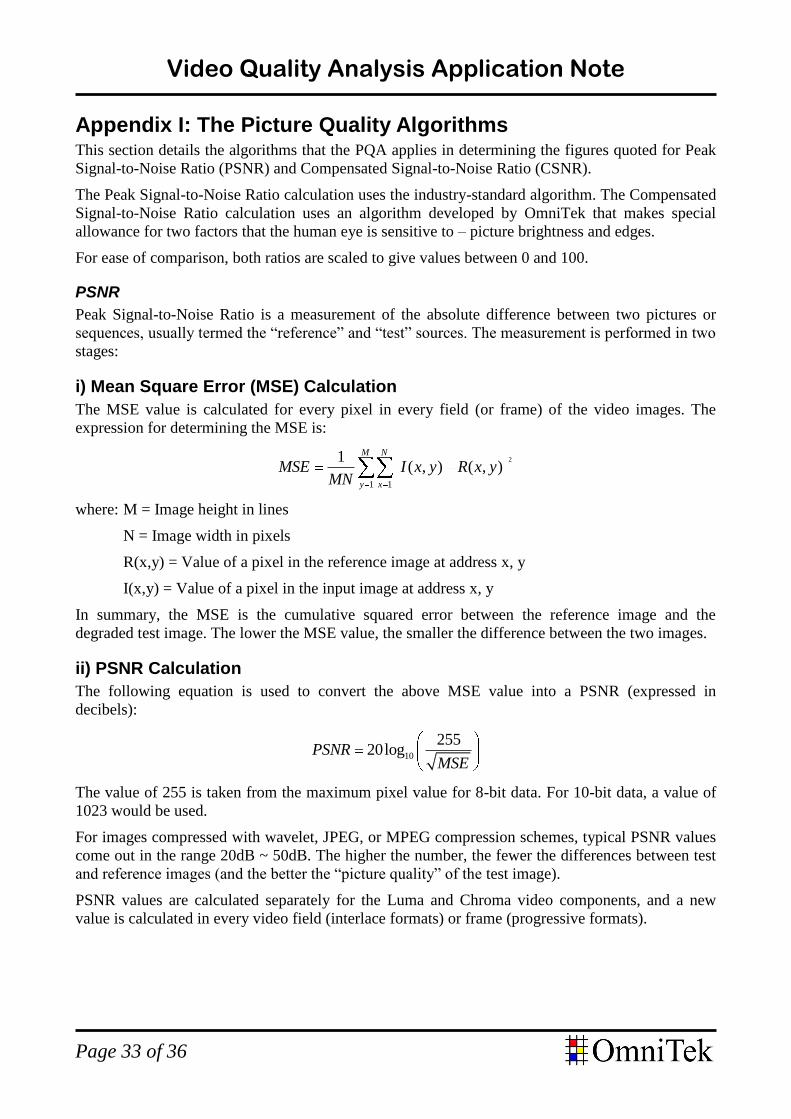
Appendix I: The Picture Quality Algorithms This section details the algorithms that the PQA applies in determining the figures quoted for Peak
Signal-to-Noise Ratio (PSNR) and Compensated Signal-to-Noise Ratio (CSNR).
The Peak Signal-to-Noise Ratio calculation uses the industry-standard algorithm. The Compensated
Signal-to-Noise Ratio calculation uses an algorithm developed by OmniTek that makes special
allowance for two factors that the human eye is sensitive to – picture brightness and edges.
For ease of comparison, both ratios are scaled to give values between 0 and 100.
PSNR
Peak Signal-to-Noise Ratio is a measurement of the absolute difference between two pictures or
sequences, usually termed the “reference” and “test” sources. The measurement is performed in two
stages:
i) Mean Square Error (MSE) Calculation
The MSE value is calculated for every pixel in every field (or frame) of the video images. The
expression for determining the MSE is:
2
1 1
1( , ) ( , )
M N
y x
MSE I x y R x yMN
where: M = Image height in lines
N = Image width in pixels
R(x,y) = Value of a pixel in the reference image at address x, y
I(x,y) = Value of a pixel in the input image at address x, y
In summary, the MSE is the cumulative squared error between the reference image and the
degraded test image. The lower the MSE value, the smaller the difference between the two images.
ii) PSNR Calculation
The following equation is used to convert the above MSE value into a PSNR (expressed in
decibels):
10
25520logPSNR
MSE
The value of 255 is taken from the maximum pixel value for 8-bit data. For 10-bit data, a value of
1023 would be used.
For images compressed with wavelet, JPEG, or MPEG compression schemes, typical PSNR values
come out in the range 20dB ~ 50dB. The higher the number, the fewer the differences between test
and reference images (and the better the “picture quality” of the test image).
PSNR values are calculated separately for the Luma and Chroma video components, and a new
value is calculated in every video field (interlace formats) or frame (progressive formats).
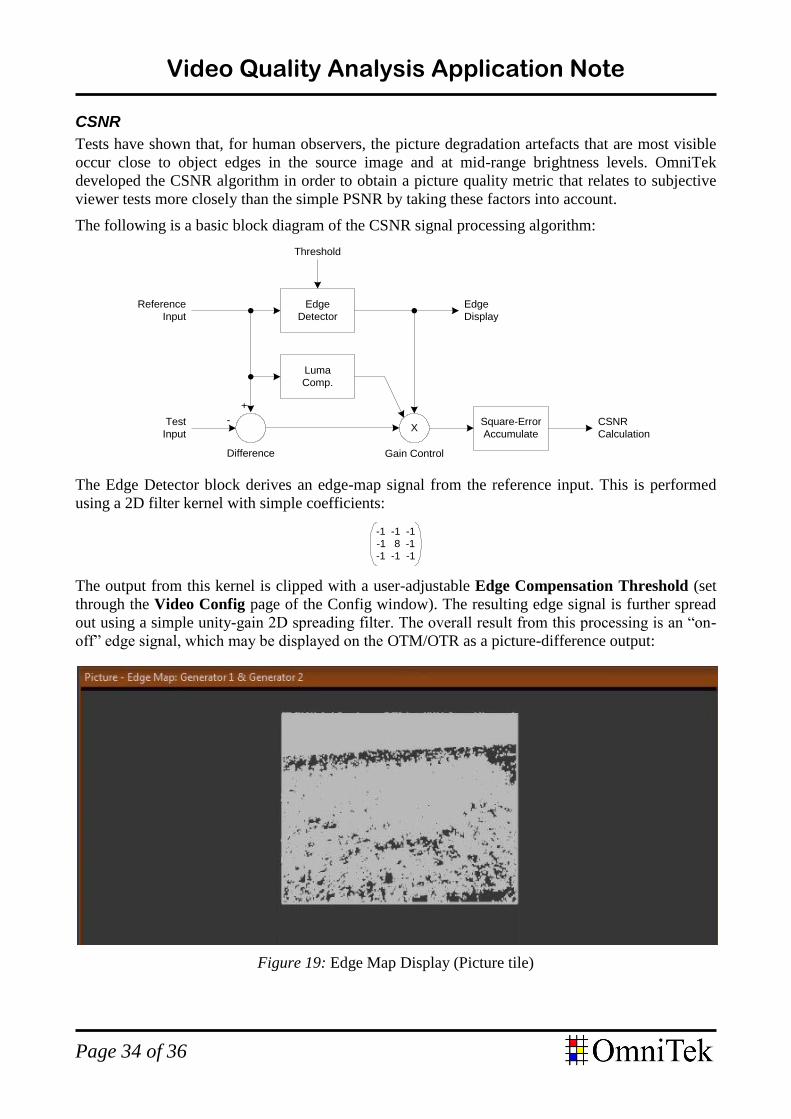
Video Quality Analysis Application Note
Page 34 of 36
CSNR
Tests have shown that, for human observers, the picture degradation artefacts that are most visible
occur close to object edges in the source image and at mid-range brightness levels. OmniTek
developed the CSNR algorithm in order to obtain a picture quality metric that relates to subjective
viewer tests more closely than the simple PSNR by taking these factors into account.
The following is a basic block diagram of the CSNR signal processing algorithm:
Edge
Detector
Threshold
Difference
+
-X
Gain Control
Luma
Comp.
Square-Error
Accumulate
Reference
Input
Test
Input
CSNR
Calculation
Edge
Display
The Edge Detector block derives an edge-map signal from the reference input. This is performed
using a 2D filter kernel with simple coefficients:
-1 -1 -1
-1 8 -1
-1 -1 -1
The output from this kernel is clipped with a user-adjustable Edge Compensation Threshold (set
through the Video Config page of the Config window). The resulting edge signal is further spread
out using a simple unity-gain 2D spreading filter. The overall result from this processing is an “on-
off” edge signal, which may be displayed on the OTM/OTR as a picture-difference output:
Figure 19: Edge Map Display (Picture tile)

Video Quality Analysis Application Note
Page 35 of 36
The Reference and Test input video signals are first subtracted in the Difference block, to establish
signed pixel-difference values in Y and C for each pixel (this is similar to the first stage in the
PSNR calculation).
The output from the Difference block is then multiplied by the signal from the Edge Detector in the
Gain Control block, such that wherever an edge is detected the difference is doubled. Where there is
no edge detected, the difference is halved.
The Luma Compensation block uses a simple look-up-table to create a
pixel-by-pixel gain profile from the reference input signal. This profile
is used to modulate the picture difference values from the Gain
Control block, in order to remove the influence of picture difference
values in very dark or very bright areas of the image. Errors at these
extreme luma levels are less visible than in the mid-grey region. The
shape of the gain profile curve is shown in the diagram.
After luma compensation, the resulting picture difference values are squared and accumulated in the
Square-Error Accumulate block, in exactly the same way as for the PSNR calculation. The
OTM/OTR software then calculates the Mean Square Error (MSE) value, which is converted to the
final CSNR graph value in dB using the same expression as for the PSNR:
10
25520 logCSNR
MSE
Appendix II: Required Software Options The following table details the software options that need to be installed in order to carry out
Internal/Internal, Internal/External or External/External quality comparisons.
Note: It is assumed that the VIEW and AUDIO options delivered as standard with both OTM and
OTR systems are enabled, and that the system includes the VIDEO_xx option needed to support the
video standard being used.
Comparison Type
Software Options Required
PQA* AV_ISD VIEW_2 GEN GEN_MOTION GEN_2
Internal/Internal (for comparing a stored
video against a reference
copy)
Internal/External (for comparing live video
against a reference copy)
External/External (for comparing one live
video against another)
* In-Service Lip-Sync and Loop Delay measurements can be carried out without the PQA option being installed.
Output
Input

Video Quality Analysis Application Note
Intec 2 Unit 3, Wade Road, Basingstoke, Hants RG24 8NE, UK
Tel: +44 (0)1256 345900 Fax: +44 (0)1256 345901
Email: [email protected] Web: www.omnitek.tv