Embed Size (px)
Citation preview
IS THE FUTURE ELECTRIC?
Pathways to a Low Carbon Economy – The Role
of Natural Gas and Biofuels
British Institute of Energy Economics
September 2011
Ben Taylor, Commercial Manager UK & Ireland
Shell Upstream International - Europe
2
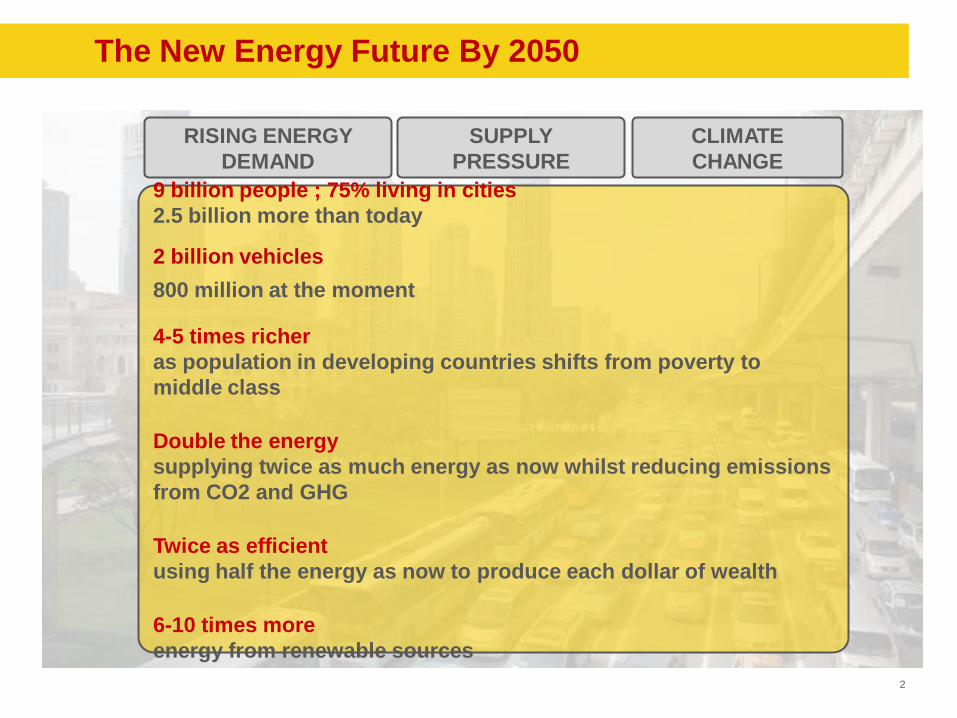
The New Energy Future By 2050
The World in 2050
9 billion people ; 75% living in cities
2.5 billion more than today
2 billion vehicles
800 million at the moment
4-5 times richer
as population in developing countries shifts from poverty to
middle class
Double the energy
supplying twice as much energy as now whilst reducing emissions
from CO2 and GHG
Twice as efficient
using half the energy as now to produce each dollar of wealth
6-10 times more
energy from renewable sources
RISING ENERGY
DEMAND
SUPPLY
PRESSURE
CLIMATE
CHANGE
3 Copyright of Royal Dutch Shell Plc 3 7/19/2012
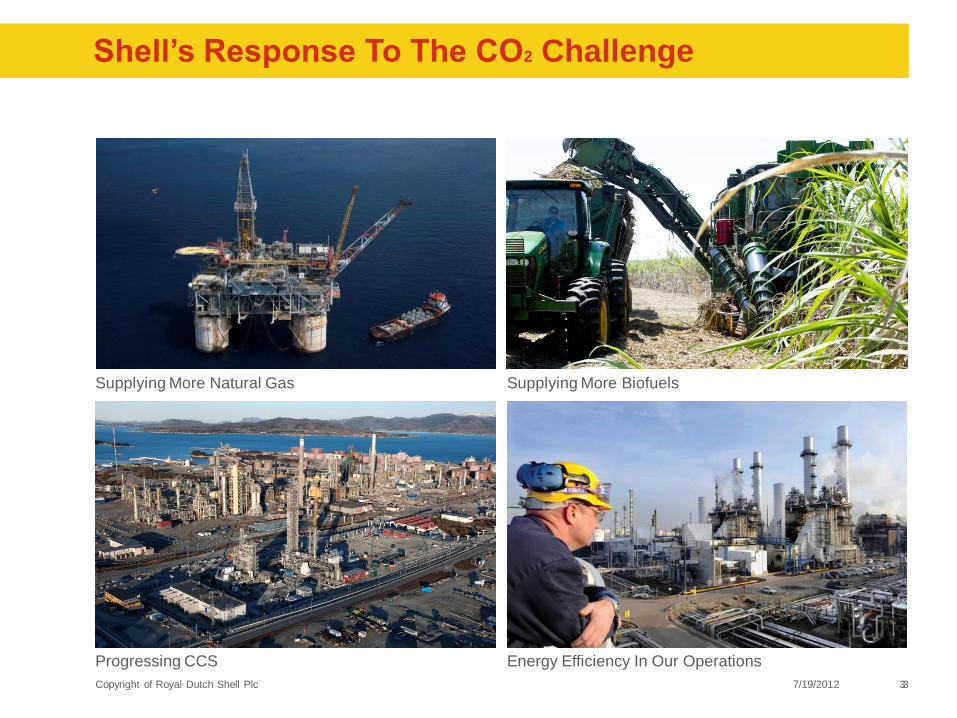
Supplying More Natural Gas Supplying More Biofuels
Progressing CCS Energy Efficiency In Our Operations
Shell’s Response To The CO2 Challenge
4
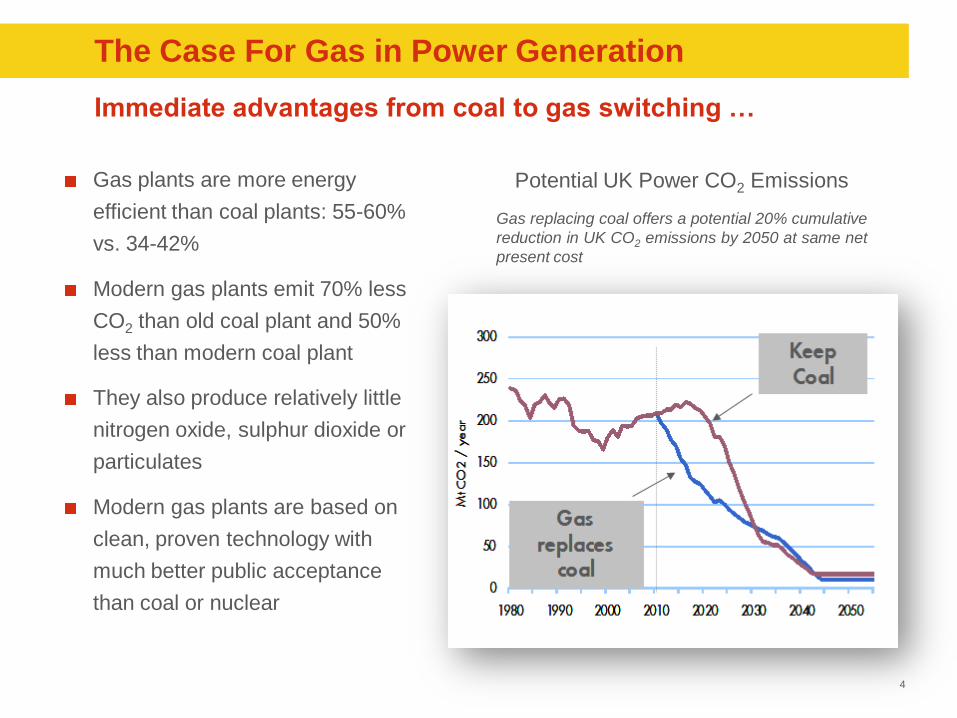
The Case For Gas in Power Generation
Gas plants are more energy
efficient than coal plants: 55-60%
vs. 34-42%
Modern gas plants emit 70% less
CO2 than old coal plant and 50%
less than modern coal plant
They also produce relatively little
nitrogen oxide, sulphur dioxide or
particulates
Modern gas plants are based on
clean, proven technology with
much better public acceptance
than coal or nuclear
Potential UK Power CO2 Emissions
Gas replacing coal offers a potential 20% cumulative
reduction in UK CO2 emissions by 2050 at same net
present cost
Immediate advantages from coal to gas switching …
5
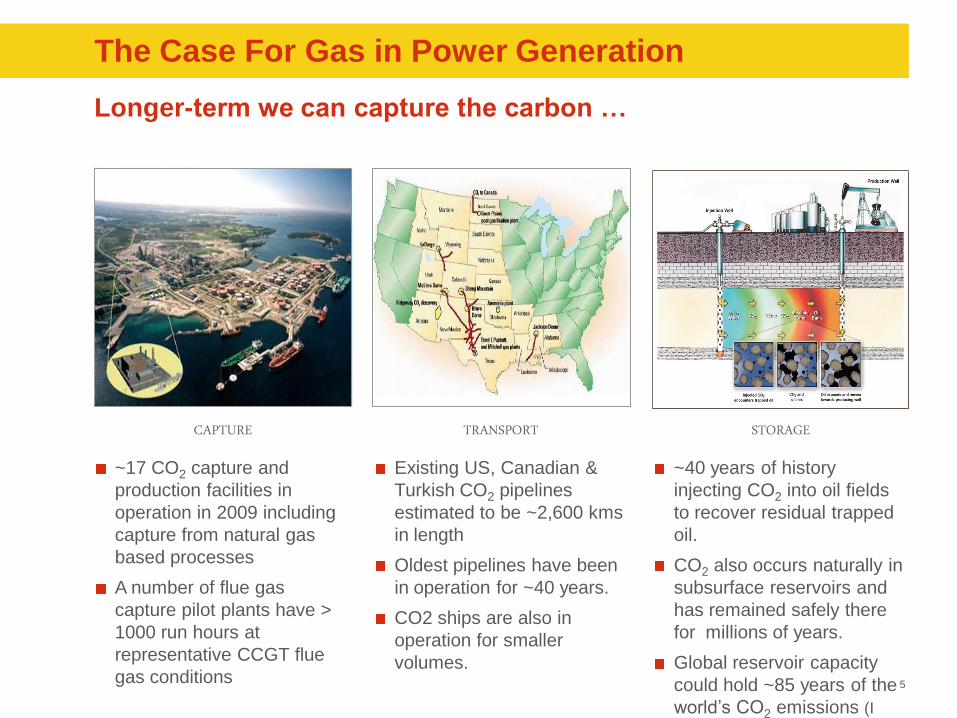
~40 years of history
injecting CO2 into oil fields
to recover residual trapped
oil.
CO2 also occurs naturally in
subsurface reservoirs and
has remained safely there
for millions of years.
Global reservoir capacity
could hold ~85 years of the
world’s CO2 emissions (I PCC)
CAPTURE TRANSPORT STORAGE
Existing US, Canadian &
Turkish CO2 pipelines
estimated to be ~2,600 kms
in length
Oldest pipelines have been
in operation for ~40 years.
CO2 ships are also in
operation for smaller
volumes.
~17 CO2 capture and
production facilities in
operation in 2009 including
capture from natural gas
based processes
A number of flue gas
capture pilot plants have >
1000 run hours at
representative CCGT flue
gas conditions
The Case For Gas in Power Generation
Longer-term we can capture the carbon …
6
-6
-4
-2
0
2
4
6
8
10
12
14
16
0%
10%
20%
30%
40%
50%
60%
70%
80%
90%
Outturn Temperature
% supplied by wind
wind load factor
% supplied by gas
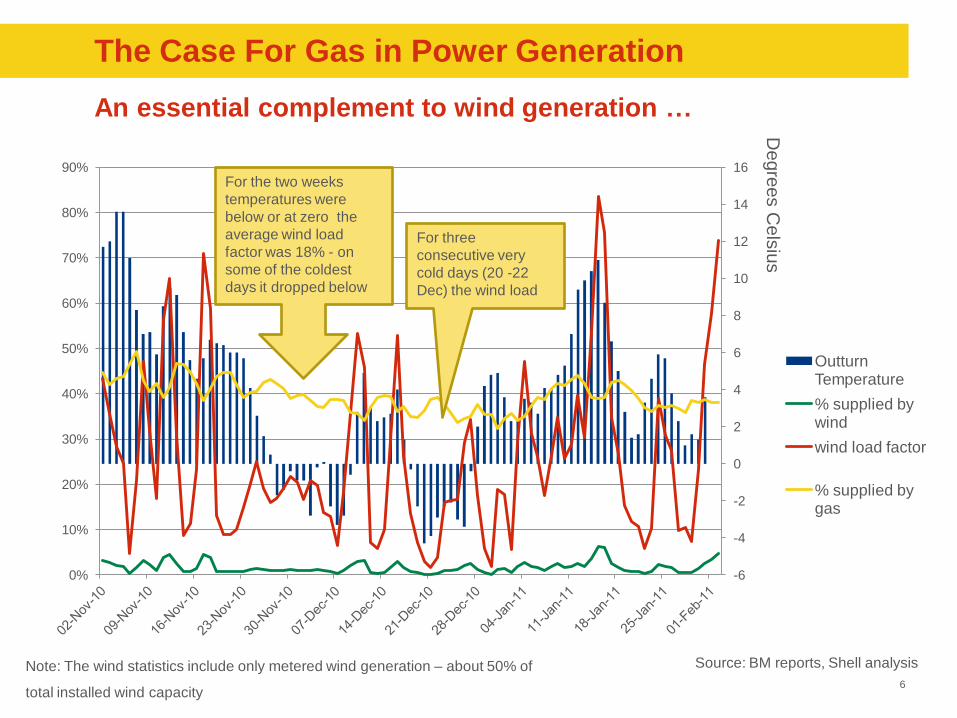
For three
consecutive very
cold days (20 -22
Dec) the wind load
For the two weeks
temperatures were
below or at zero the
average wind load
factor was 18% - on
some of the coldest
days it dropped below
Degre
es C
els
ius
Note: The wind statistics include only metered wind generation – about 50% of
total installed wind capacity
Source: BM reports, Shell analysis
The Case For Gas in Power Generation
An essential complement to wind generation …
7
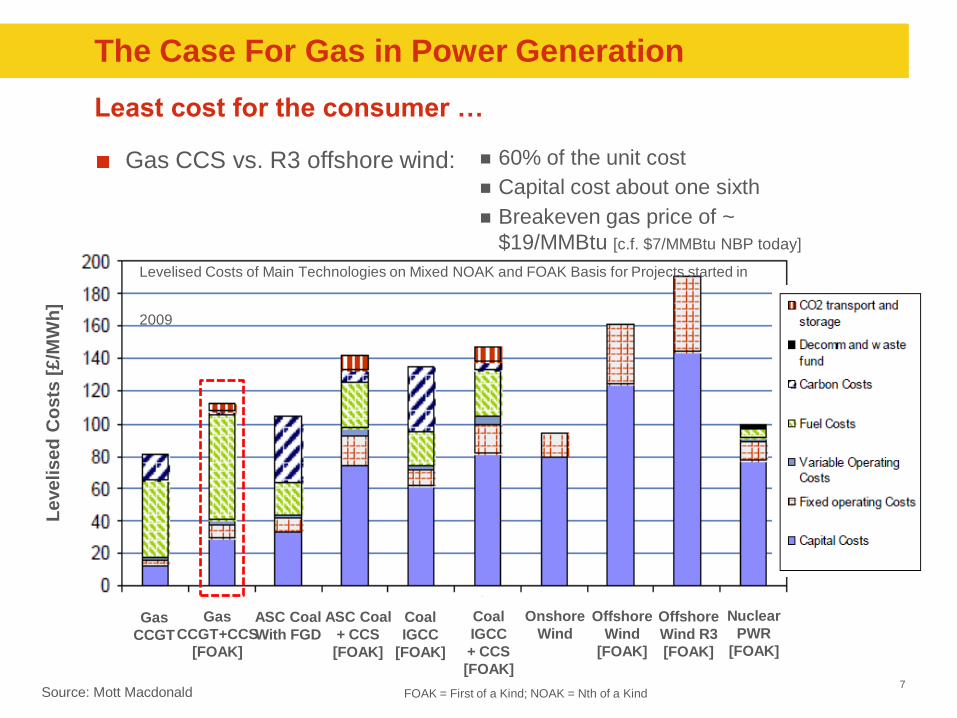
Gas CCS vs. R3 offshore wind:
Source: Mott Macdonald
Levelised
Co
sts
[£/M
Wh
]
Gas
CCGT
Gas
CCGT+CCS
[FOAK]
ASC Coal
With FGD
ASC Coal
+ CCS
[FOAK]
Coal
IGCC
[FOAK]
Coal
IGCC
+ CCS
[FOAK]
Onshore
Wind
Offshore
Wind
[FOAK]
Offshore
Wind R3
[FOAK]
Nuclear
PWR
[FOAK]
60% of the unit cost
Capital cost about one sixth
Breakeven gas price of ~
$19/MMBtu [c.f. $7/MMBtu NBP today]
Levelised Costs of Main Technologies on Mixed NOAK and FOAK Basis for Projects started in
2009
FOAK = First of a Kind; NOAK = Nth of a Kind
The Case For Gas in Power Generation
Least cost for the consumer …
8
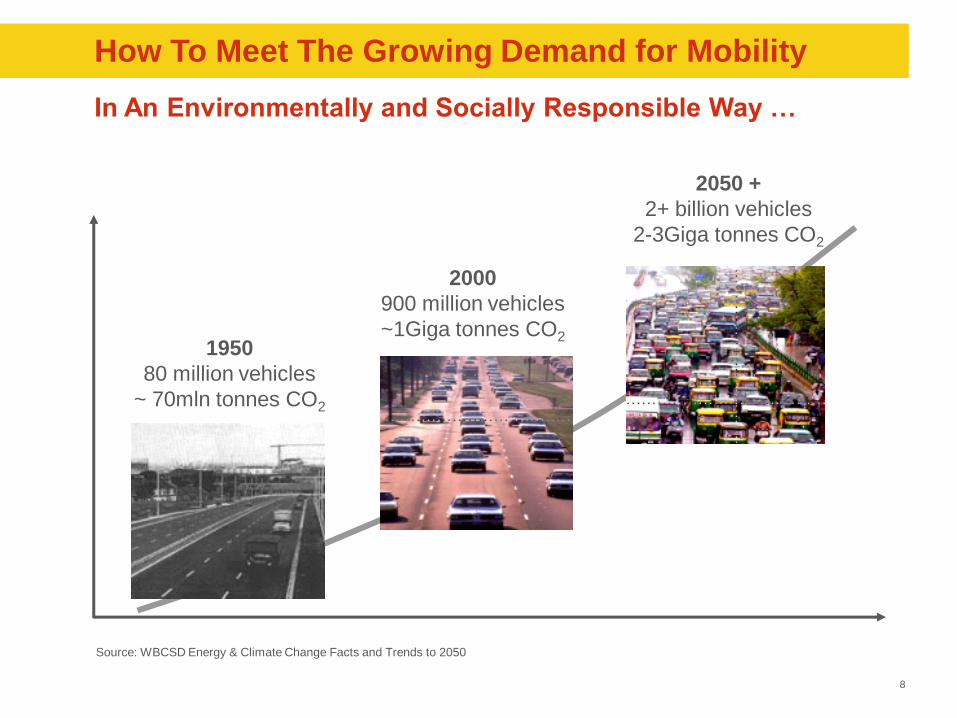
How To Meet The Growing Demand for Mobility
In An Environmentally and Socially Responsible Way …
Source: WBCSD Energy & Climate Change Facts and Trends to 2050
2000
900 million vehicles
~1Giga tonnes CO2 1950
80 million vehicles
~ 70mln tonnes CO2
2050 +
2+ billion vehicles
2-3Giga tonnes CO2
9
0
10,000
20,000
30,000
2000 2010 2020 2030 2040 2050
0
10,000
20,000
30,000
40,000
2000 2010 2020 2030 2040 2050
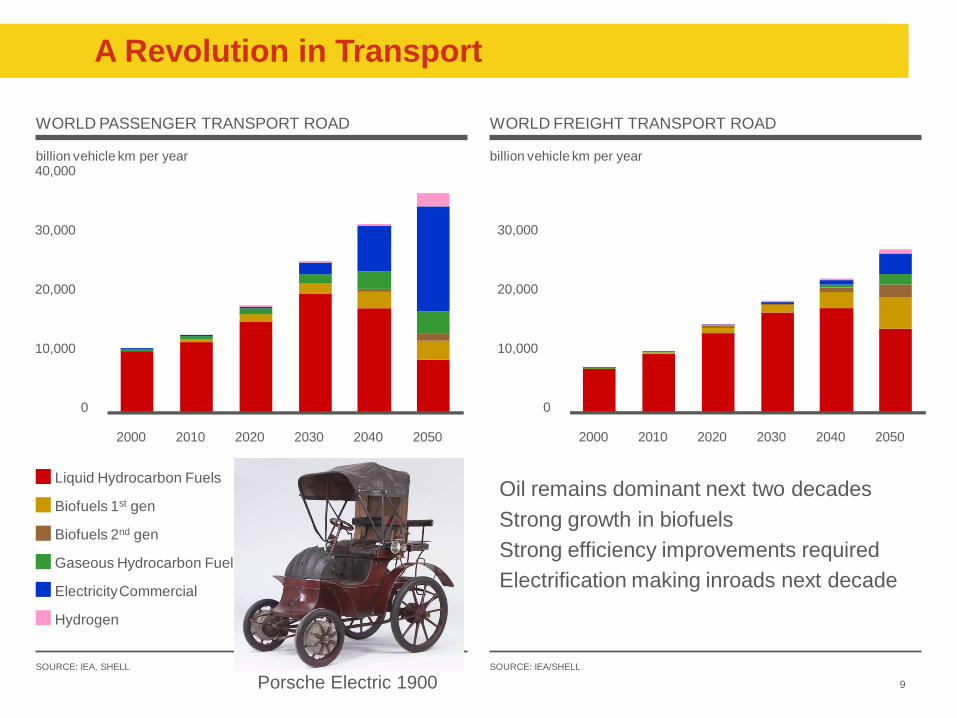
billion vehicle km per year
WORLD PASSENGER TRANSPORT ROAD
billion vehicle km per year
WORLD FREIGHT TRANSPORT ROAD
SOURCE: IEA, SHELL SOURCE: IEA/SHELL
A Revolution in Transport
Oil remains dominant next two decades
Strong growth in biofuels
Strong efficiency improvements required
Electrification making inroads next decade
Liquid Hydrocarbon Fuels
Gaseous Hydrocarbon Fuels
Electricity Commercial
Hydrogen
Biofuels 1st gen
Biofuels 2nd gen
Porsche Electric 1900
10
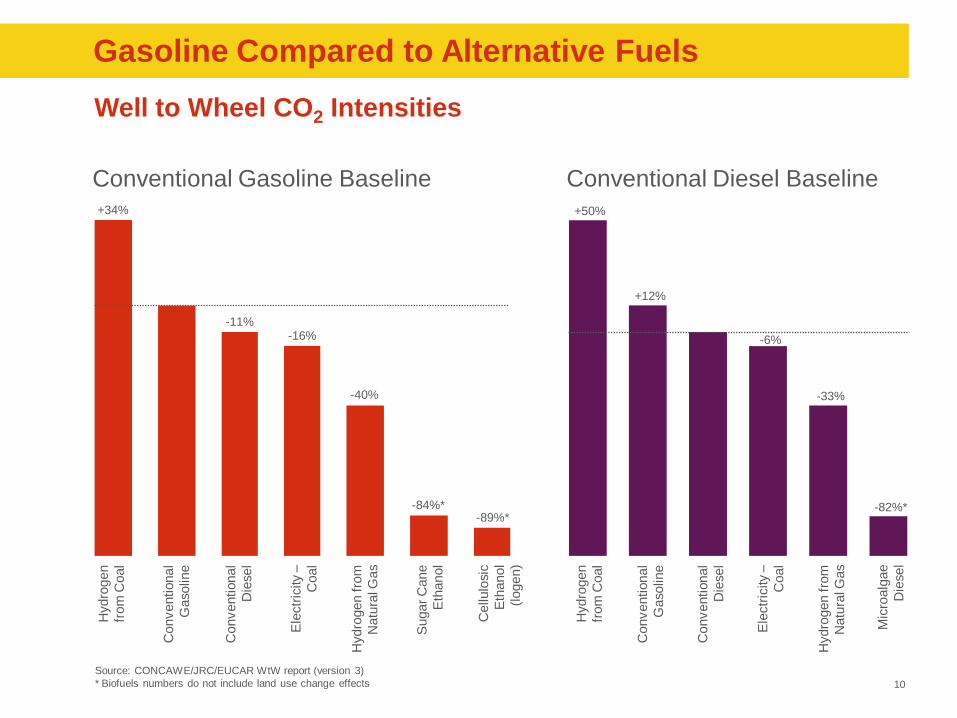
Gasoline Compared to Alternative Fuels
Well to Wheel CO2 Intensities
Source: CONCAWE/JRC/EUCAR WtW report (version 3)
* Biofuels numbers do not include land use change effects
Conventional Gasoline Baseline
Hydro
gen
from
Coal
Conventional
Gasoline
Conventional
Die
sel
Ele
ctr
icity –
Coal
Hydro
gen fro
m
Natu
ral G
as
Sugar
Cane
Eth
anol
Cellulo
sic
Eth
anol
(logen)
Hydro
gen
from
Coal
Conventional
Gasoline
Conventional
Die
sel
Ele
ctr
icity –
Coal
Hydro
gen fro
m
Natu
ral G
as
Mic
roalg
ae
Die
sel
+34%
-11% -16%
-40%
-84%* -89%*
+50%
+12%
-6%
-33%
-82%*
Conventional Diesel Baseline
11
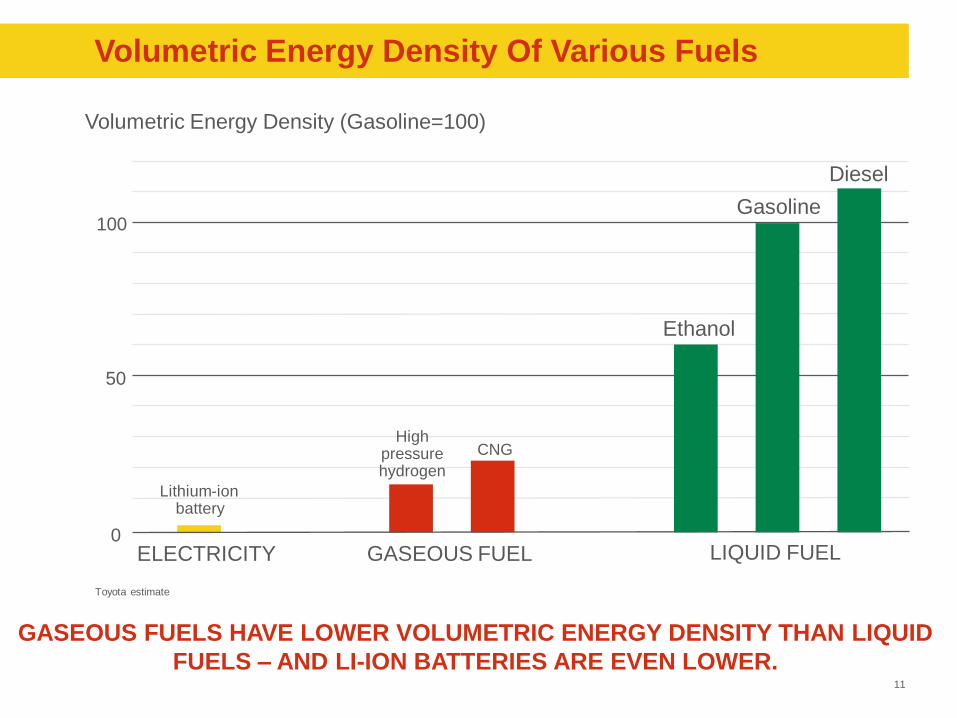
Volumetric Energy Density Of Various Fuels
Volumetric Energy Density (Gasoline=100)
50
100
CNG
Ethanol
Lithium-ion battery
0
Gasoline
Diesel
LIQUID FUEL GASEOUS FUEL ELECTRICITY
High pressure hydrogen
Toyota estimate
GASEOUS FUELS HAVE LOWER VOLUMETRIC ENERGY DENSITY THAN LIQUID
FUELS – AND LI-ION BATTERIES ARE EVEN LOWER.
12
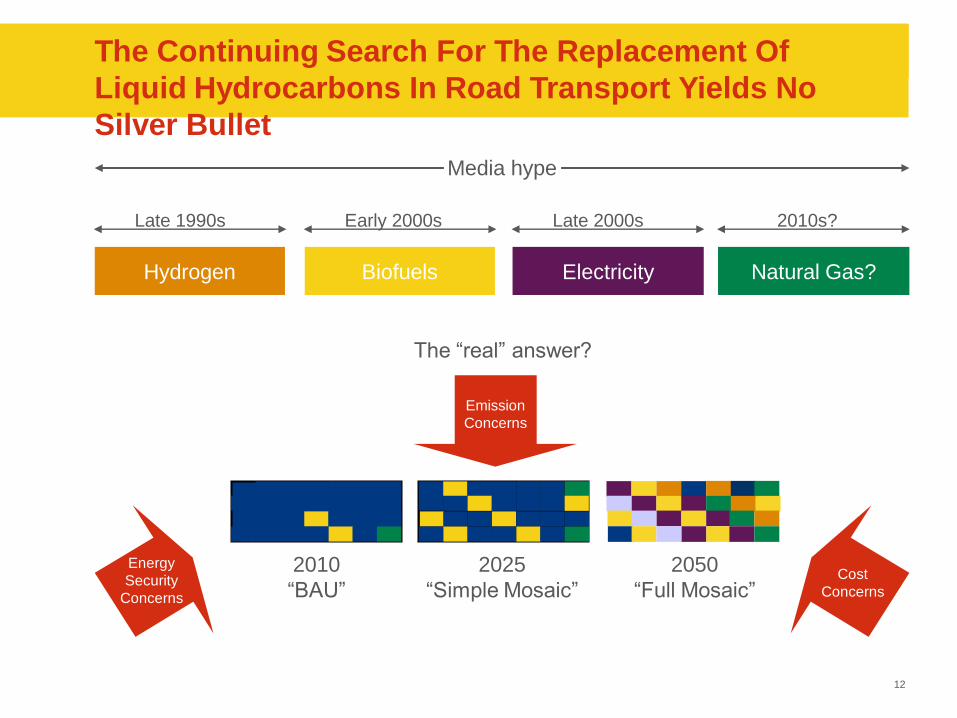
The Continuing Search For The Replacement Of
Liquid Hydrocarbons In Road Transport Yields No
Silver Bullet
Hydrogen
Late 1990s
Biofuels
Early 2000s
Electricity
Late 2000s
Natural Gas?
2010s?
Media hype
The “real” answer?
Emission
Concerns
2025
“Simple Mosaic”
2010
“BAU”
2050
“Full Mosaic”
Energy
Security
Concerns
Cost
Concerns
13
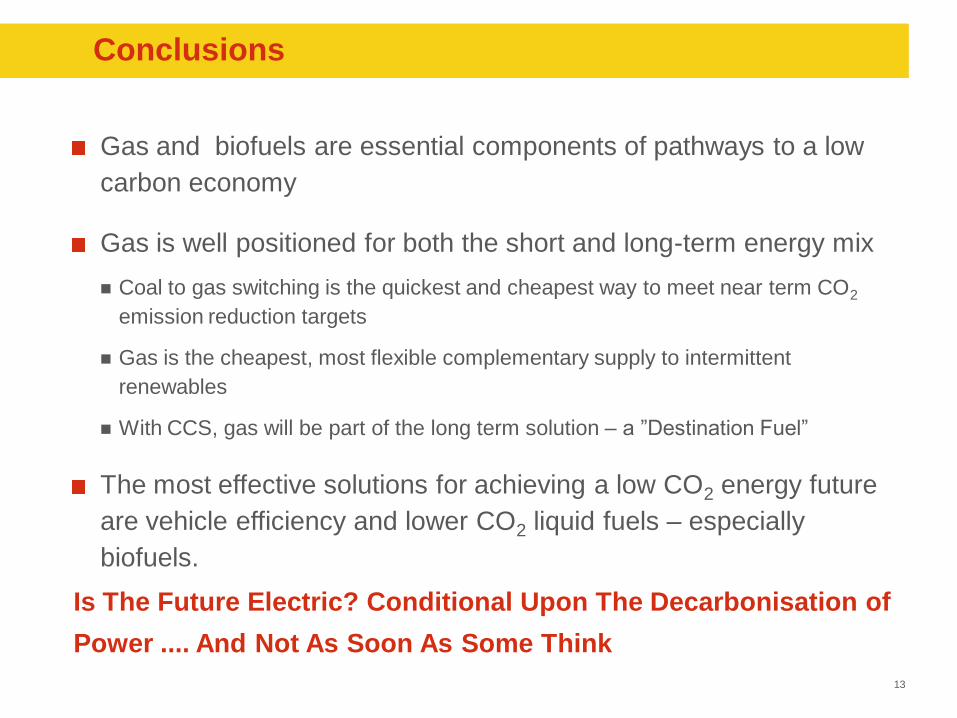
Conclusions
Gas and biofuels are essential components of pathways to a low
carbon economy
Gas is well positioned for both the short and long-term energy mix
Coal to gas switching is the quickest and cheapest way to meet near term CO2
emission reduction targets
Gas is the cheapest, most flexible complementary supply to intermittent
renewables
With CCS, gas will be part of the long term solution – a ”Destination Fuel”
The most effective solutions for achieving a low CO2 energy future
are vehicle efficiency and lower CO2 liquid fuels – especially
biofuels.
Is The Future Electric? Conditional Upon The Decarbonisation of
Power .... And Not As Soon As Some Think

14