Embed Size (px)
Citation preview

I
Old school: The relevance of nostalgia in
advertising
DONOVAN PIETERSE
Student number 11104555
A thesis submitted to the
Gordon Institute of Business Science, University of Pretoria,
in partial fulfilment of the requirements for the degree of
Master of Business Administration
1 August 2011
Copyright © 2012, University of Pretoria. All rights reserved. The copyright in this work vests in the University of Pretoria. No part of this work may be reproduced or transmitted in any form or by any means, without the prior written permission of the University of Pretoria.
©© UUnniivveerrssiittyy ooff PPrreettoorriiaa
II
ABSTRACT
As the use of nostalgia (an individual’s yearning for positive associations with
the past) as an evoked emotional appeal in advertising increases in popularity
in South Africa, questions begin to arise as to whom this nostalgic appeal is
most relevant. For marketers and advertisers to create the most effective
advertising, they need to be able to communicate with their target markets using
the appeals that are most relevant to them.
This study addresses this in the context of South African print advertisements
by analysing whether consumers are indeed receptive to the nostalgic appeals
used in the ads, and then seeking to associate their receptiveness to their
demographic characteristics (age group, gender and population group). This
research was conducted via an online survey and then parametrically tested.
The results indicated that insufficient evidence exited to predict the relevance of
nostalgia in advertising by gender or population group. However, evidence was
found that suggests that the relevance of nostalgia does vary depending on the
consumers’ age.

III
KEYWORDS
1. Nostalgia
2. Advertising
3. South Africa
4. Emotional appeals

IV
DECLARATION
I declare that this research project is my own work. It is submitted in partial
fulfilment of the requirements for the degree of Master of Business
Administration at the Gordon Institute of Business Science, University of
Pretoria. It has not been submitted before for any degree or examination in any
other university. I further declare that I have obtained the necessary
authorisation and consent to carry out this research.
Donovan Pieterse
Student number 11104555
1 August 2011

V
ACKNOWLEDGEMENTS
Special mention and thanks must be made to the following people:
• Nicola Kleyn
A supervisor beyond comparison. I doubt my research will ever do justice to the guidance
Nicola provided. Helping me realise my topic right through to tweaking the final document;
Nicola’s patience, commitment and passion have been invaluable in this research process.
• Muhammad Jamal
The “Stats Ninja”. Muhammad is an extraordinary statistician and was essential to the accurate
calculation and analysis of my data. Against all odds, every ridiculous deadline asked of him
was met.
• Robyn Rennison
GIBS MBA classmate, friend and “partner-in-crime”. Experiencing similar “speed-bumps” on the
way to completing our thesis, Robyn provided the companionship and comic relief that helped
make the long days easier.
• My Family
Indirect yet essential involvement. None of this would have been possible without you.
• Channon Selwood
Last, but very far from least; my “long-suffering” girlfriend. Channon selflessly endured
everything the MBA threw at me. Her unwavering expressions of love, support and
encouragement were instrumental in getting me through this MBA and thesis. Thank you!

VI
TABLE OF CONTENTS
1 INTRODUCTION TO THE RESEARCH PROBLEM ................................... 1
1.1 INTRODUCTION ..................................................................................... 1
1.2 NEED FOR RESEARCH ........................................................................... 2
1.3 SOUTH AFRICAN CONTEXT .................................................................... 4
1.4 PROBLEM ............................................................................................. 6
1.5 OBJECTIVES ......................................................................................... 7
1.6 RELATIONSHIP BETWEEN PROBLEM AND OBJECTIVES .............................. 8
1.7 TERMINOLOGY ...................................................................................... 8
1.8 SCOPE AND STRUCTURE OF REPORT ..................................................... 9
2 THEORY AND LITERATURE REVIEW .................................................... 11
2.1 INTRODUCTION ................................................................................... 11
2.2 ADVERTISING ..................................................................................... 12
2.2.1 Defining Advertising ............................................................. 12
2.2.2 Emotional Appeals in Advertising ........................................ 13
2.3 NOSTALGIA ........................................................................................ 17
2.3.1 Defining Nostalgia ............................................................... 17
2.3.2 Personal Nostalgia .............................................................. 19
2.3.3 Historical Nostalgia .............................................................. 21
2.4 NOSTALGIC APPEALS IN ADVERTISING .................................................. 23
2.4.1 Personal vs. Historical Nostalgia Ads .................................. 26
2.4.2 Nostalgic vs. Non-Nostalgic Ads .......................................... 26
2.5 CONCLUSION ...................................................................................... 28
3 HYPOTHESES ......................................................................................... 29
3.1 HYPOTHESIS - 1 .................................................................................. 29
3.2 HYPOTHESIS - 2 .................................................................................. 30
3.3 HYPOTHESIS - 3 .................................................................................. 30
4 RESEARCH METHODOLOGY AND DESIGN ......................................... 31
4.1 INTRODUCTION ................................................................................... 31
4.2 RESEARCH DESIGN ............................................................................. 31
4.3 POPULATION AND SAMPLING ................................................................ 33
4.4 SAMPLE SIZE ...................................................................................... 34
4.5 SCALE SELECTION .............................................................................. 34
4.6 ADVERTISEMENT SELECTION ............................................................... 35
4.6.1 Pre-testing ........................................................................... 36
4.6.2 Final Ad Selection ................................................................ 36
4.7 SURVEY ............................................................................................. 37
4.8 DATA GATHERING ............................................................................... 38
4.9 DATA ANALYSIS .................................................................................. 38
4.9.1 Cronbach’s Alpha ................................................................ 39
4.9.2 Homogeneity of Variance Assumption ................................. 39
4.9.3 Analysis of Variance (Anova) ............................................... 40
4.9.4 Independent T-Test ............................................................. 40
VII
4.10 ASSUMPTIONS .................................................................................... 41
5 RESULTS 42
5.1 INTRODUCTION ................................................................................... 42
5.2 DESCRIPTIVE STATISTICS .................................................................... 42
5.2.1 Age group ............................................................................ 43
5.2.2 Gender................................................................................. 44
5.2.3 Population group ................................................................. 45
5.2.4 Female respondents by population group............................ 46
5.2.5 Female respondents by age group ...................................... 47
5.2.6 Male respondents by population group ................................ 48
5.2.7 Male respondents by age group .......................................... 49
5.2.8 Black respondents by age group ......................................... 50
5.2.9 White respondents by age group ......................................... 51
5.2.10 Coloured respondents by age group ................................... 52
5.2.11 Indian respondents by age group ........................................ 53
5.2.12 Asian respondents by age group ......................................... 54
5.3 HYPOTHESIS TESTING ......................................................................... 55
5.3.1 Reliability Results ................................................................ 56
5.3.2 Assumption of Homogeneity of Variance ............................. 57
5.3.3 ANOVA Results ................................................................... 58
5.3.4 T-Test results ....................................................................... 59
5.4 HYPOTHESES ..................................................................................... 62
5.4.1 Hypothesis - 1 ...................................................................... 62
5.4.2 Hypothesis - 2 ...................................................................... 63
5.4.3 Hypothesis - 3 ...................................................................... 63
6 DISCUSSION OF RESULTS .................................................................... 64
6.1 INTRODUCTION ................................................................................... 64
6.2 DESCRIPTIVE STATISTICS .................................................................... 64
6.2.1 Age Group ........................................................................... 65
6.2.2 Gender................................................................................. 65
6.2.3 Population Group ................................................................. 66
6.2.4 Group Comparisons ............................................................ 66
6.3 HYPOTHESIS TESTING ......................................................................... 66
6.3.1 Cronbach’s Alpha ................................................................ 67
6.3.2 Levene’s Test ...................................................................... 67
6.3.3 ANOVA Results ................................................................... 68
6.3.4 T-test Results ...................................................................... 69
6.4 HYPOTHESIS - 1 .................................................................................. 70
6.5 HYPOTHESIS - 2 .................................................................................. 72
6.6 HYPOTHESIS - 3 .................................................................................. 72
7 CONCLUSION .......................................................................................... 74
7.1 INTRODUCTION ................................................................................... 74
7.2 LIMITATIONS ....................................................................................... 75
7.3 FUTURE RESEARCH ............................................................................ 76
7.4 RECOMMENDATIONS ........................................................................... 78

VIII
8 REFERENCES.......................................................................................... 80
9 APPENDIX 85
9.1 SURVEY CONSENT .............................................................................. 85
9.2 ADVERTISING DEFINITIONS .................................................................. 86
9.3 SURVEY ADVERTISEMENTS .................................................................. 89
IX
LIST OF FIGURES
Figure 1: Proportion of Nostalgic Thoughts to Total Thoughts Generated Across
Advertisement Conditions. ............................................................................... 24
Figure 2: Examples of Personal vs. Historical Nostalgia Ads ........................... 26
Figure 3: Examples of Nostalgic vs. Non-nostalgic Ads ................................... 27
Figure 4: Age group profile of respondents ...................................................... 43
Figure 5: Gender profile of respondents ........................................................... 44
Figure 6: Population group profile of respondents ............................................ 45
Figure 7: Female respondents by population group ......................................... 46
Figure 8: Female respondents by age group ................................................... 47
Figure 9: Male respondents by population group ............................................. 48
Figure 10: Male respondents by age group ...................................................... 49
Figure 11: Black respondents by age group ..................................................... 50
Figure 12: White respondents by age group .................................................... 51
Figure 13: Coloured respondents by age group ............................................... 52
Figure 14: Indian respondents by age group .................................................... 53
Figure 15: Asian respondents by age group .................................................... 54
Figure 16: t-Test for Age and Financial Services ads ...................................... 60
Figure 17: t-Test for Age and Cake Flour ads .................................................. 60
Figure 18: t-Test for Age and Car ads .............................................................. 61
Figure 19: Financial Services Ads Used in Survey ........................................... 89
Figure 20: Battery Ads Used in Survey ............................................................ 89
Figure 21: Toy Ads Used in Survey .................................................................. 89
Figure 22: Cake Flour Ads Used in Survey ...................................................... 90
Figure 23: Car Ads Used in Survey .................................................................. 90

X
LISTS OF TABLES
Table 1: 2010 Mid-year Population Estimate ..................................................... 5
Table 2: Online Questionnaire.......................................................................... 37
Table 3: Summary of Cronbach’s Alpha Results .............................................. 56
Table 4: Summary of Levene test results ......................................................... 57
Table 5: Summary of ANOVA results ............................................................... 58
Table 6: Summary of mean values ................................................................... 59
Table 7: Summary t-test Results ...................................................................... 61
Table 8: Advertising Textbook Definitions of Advertising ................................. 86
Table 9: Marketing Textbook Definitions of Advertising ................................... 86
Table 10: Older Textbook Definitions of Advertising ........................................ 87
Table 11: Other Definitions of Advertising ........................................................ 87

Introduction
1
1 INTRODUCTION TO THE RESEARCH PROBLEM
1.1 INTRODUCTION
Our world is a highly materialistic one. New products are developed every day,
and marketers and manufacturers will seize any opportunity to present and
promote their goods and services over those of their competitors. In many
markets, competition is increasing while demand is decreasing (Keller, 1993).
South African consumers, as with consumers all over the world, are now
bombarded by more advertising than ever before.
The media that carry advertising messages can take many forms, from
traditional media like print, radio and television; to more modern options like
internet and cell phone marketing; as well as the multitude of new promotional
concepts that marketers come up with every day. Considerations like the reach,
frequency and target demographic of these media must all be considered by
marketers when deciding how best to interact with their customers.
Yet, when companies are not able to create or utilise new media sources, many
other options do still exist for them. One of the key ways of tailoring an
advertising message to ensure it stands out among the competition is by using
various emotional appeals.
Advertising practitioners have adapted their ads from simply being a product
description, list of attributes or a product or company image or logo, to
something far more effective. Something that is often very subtle yet sometimes

Introduction
2
blatantly obvious. Advertisers found a way to actually engage the prospective
customers and consumers with their advertised product, through the
advertisements. These advertisements were now crafted with an emotional
appeal relative to the product and audience.
Moriarty (1991) listed 11 different emotional appeals, of which nostalgia is one.
The focus of this study is on this nostalgic appeal as it is used in advertising.
1.2 NEED FOR RESEARCH
In recent history, developments in technology have allowed people access to
detailed, accurate information about times gone by. This information has been
communicated in many forms, from historical researchers creating
documentaries about life several centuries ago, to people simply looking
through photos, reading articles or watching cell phone video clips of something
that happened the previous week.
Should these recollections be positive and generate an emotional appeal or
associated connection to something, they can be termed nostalgic. Braun-
LaTour (2007) says that nostalgia makes people feel good and it is generally
thought that if the brand can connect to those positive thoughts associated with
remembering the past, the brand can benefit.
In recent times, nostalgia is an appeal that has begun to feature quite
prominently in South African ads. Holak, Matveev & Havlena (2008) point out

Introduction
3
that nostalgic appeal has recently attracted attention in marketing and
consumer research. Many advertisers, at some stage, have used some form of
nostalgia to connect with their target audience and get their message across
more effectively. This nostalgia can take the form of a historical point being re-
told, the longing for something or someone that is no longer around, or even
just reminiscing about a recent happening. Nostalgia can be a direct memory of
an earlier version of a product or an associated memory that was simply
created in the consumers mind.
Either way, advertisers now use this nostalgia to create positive associations to
brands, companies, products or services; realised in the present and hopefully
projected into the future (Holak, Matveev & Havlena, 2008).
However nostalgia is most often a personal reaction. Different situations and
memories elicit different feelings and reactions in different people. Prior to going
some way to address it with their own study, Pascal, Sprott & Muehling (2002)
said that while practitioners have adopted nostalgia-based marketing and
advertising strategies, it is not certain whether or not any benefit is realised by
companies when a consumer reacts nostalgically to these strategies.
How is an advertiser to know with any level of certainty whether the nostalgic
appeal he or she is trying to create is having the desired effect on the target
audience? Can generalisations be accurately assumed for different target age
groups, genders and population groups?

Introduction
4
Verma’s (2009) research stated that no communication is complete without
feedback or reaction. He said the intent behind advertising is to persuade
consumers to purchase and repurchase a product over and over again, but
questioned whether the consumer actually responded to all communications
sent by the advertisers? He points out that human brains have a limited
processing capacity and consumers have the tendency to process the most
useful and appealing information first.
1.3 SOUTH AFRICAN CONTEXT
While by no means an anomaly, South Africa is a rather unique country. It is
classified as first world by some standards yet third world by others. A highly
developed economy, a world leading Constitution and newly implemented
advanced Consumer Protection laws all do battle with the huge lack of
education and growing unemployment that affects many of its citizens.
The table that follows (Stats SA, 2011) gives an idea of the population
breakdown by age group, gender and population group. The Indian and Asian
populations have been combined for the purposes of their research.
It is clear that there is an overwhelming Black majority, but the other population
groups are still present in sufficient numbers for marketers to take notice. The
gender split is roughly half male, half female. Yet, unlike Japan and some other
developed European countries, the youth make up the majority in South Africa.

Introduction
5
Table 1: 2010 Mid-year Population Estimate
Age Population Male Female Population Male Female
15-19 African/Black 2210177 2184746 White 162934 158519
20-24 2116775 2095198 157423 153476
25-29 1792817 1942214 145914 146331
30-34 1578026 1685401 139625 140783
35-39 1294725 1419755 141971 144165
40-44 848497 943228 168803 169371
45-49 716176 820608 169962 172292
50-54 632708 743831 169372 176866
55-59 502357 603271 152843 159667
60-64 368423 475551 140967 154796
Age Population Male Female Population Male Female
15-19 Coloured 199981 201671 Indian/Asian 54713 53471
20-24 186216 189911 61005 58529
25-29 175742 188715 65902 61333
30-34 181105 196521 58544 55758
35-39 176529 194521 46863 46557
40-44 146452 164345 41308 42169
45-49 127904 145063 38599 39864
50-54 104372 120040 35168 36691
55-59 78765 92904 30719 33056
60-64 56758 70930 24419 27765
(Stats SA, 2011)
Local advertising agencies need to find ways to serve their clients better. In
South Africa, the Association for Communication and Advertising, as well as
numerous advertising practitioners, are concerned about the perceived
misalignment between advertisers’ service expectations and advertising
agencies’ service delivery (ACA, 2004). 75% of respondents to the Financial
Mail’s Adfocus Opinion Survey have indicated that advertising agencies could
do more to understand their clients business better (Maggs, 2006)
Introduction
6
An increasing number of businesses are focussing their efforts on maintaining
existing customers rather than trying to attract new ones (Bhat, 2004).
Globalisation and liberalisation are affecting economies around the world, and
organisations have therefore had to their strategies from pure profit
maximisation to rather maximising profits through increased customer
satisfaction (Seth, Deshmukh & Vrat, 2005).
By understanding the target markets of their clients better, agencies would be
able to adapt the appeals in their ads to ensure the most desirable response by
the target consumers. This more focussed output would equate to providing
superior service to their clients.
1.4 PROBLEM
South Africa is a country rich in nostalgia. With over 49 million citizens (CIA,
2011) and so many different cultures all being represented in the same
geographic region, memories and recollections of the past must be as many as
they are diverse.
Yet with such a large young population (CIA, 2011) and such ethnic diversity
(CIA, 2011), advertisers can never be certain that the association they are
hoping for is what is really felt by their target audience. Are their messages
failing completely, or even worse alienating their intended audience?

Introduction
7
Keller (1993) notes that with escalating costs, marketers need to increase the
efficiency of their marketing expenditure, and should therefore have a more
thorough understanding of consumer behaviour in order to make the most
strategically effective decisions when determining where their marketing budget
will be spent.
1.5 OBJECTIVES
This research aims to provide a clearer indication as to who in South Africa
nostalgic advertising is relevant; particularly whether this group can be can be
defined by age, gender or population group. Academic literature indicates that
gender and age are indicators of responsiveness toward nostalgia. For
example, when Holbrook (1993) researched American movie watchers he found
that women were marginally more nostalgia prone than men. He also said that
developmental experiences that were associated with age influenced both the
targets of nostalgia as well as the amount of nostalgia they process.
However none of this research is specific to the South African market. South
Africa is a country with 11 official languages and an even greater number of
represented cultures (CIA, 2011). Products and services are developed to
satisfy the different demands created by such ethnic diversity but, are the
appeals used in the advertisements actually connecting with these diverse
consumers?

Introduction
8
The population groups selected for this research are those used by Statistics
South Africa (2011) for the national census and other demographic reporting,
with the exception that Statistics South Africa combines the Indian and Asian
groups; possibly due to their comparatively small size. However as the Indian
and Asian groups represent very different sub-cultures, a potential value in
reporting them separately is inferred. There appears to be a significant enough
difference in terms of attitudes and preferences to justify this.
1.6 RELATIONSHIP BETWEEN PROBLEM AND OBJECTIVES
The purpose of this research is to understand the relevance of the nostalgic
appeals used in advertising, to different age groups, population groups and
genders; specifically with regard to the South African public relating to South
African print advertisements.
It is assumed that this research will provide an indication as to whether clearly
identifiable differences do exist using these parameters, and will assist
advertisers and marketers in determining the relevance of using nostalgic
appeals when targeting specific groups; to build brand preference and drive
purchase decisions.
1.7 TERMINOLOGY
This study refers to a number of core constructs. These are defined below:

Introduction
9
NOSTALGIA - An individual’s positive response to, recollection of or longing for
experiences, objects or themes that featured in times gone by; from last week,
to their childhood or even before birth (Holbrook & Schindler, 1991).
ADVERTISING - The element of the marketing communications mix that is non-
personal, paid for by an identified sponsor, and disseminated through mass
channels of communication to promote the adoption of goods, services,
persons, or ideas. (Bearden, Ingram & LaForge, 1998). More specifically, the
context of this report is only concerned with print advertising; traditional, non-
interactive advertisements that would appear in magazines or newspapers.
POPULATION GROUP – One of three demographic variables against which
respondents will be analysed. The term is used by Statistics South Africa in the
national census. In this research, it refers to the five most accepted and
prominent classifications of South African citizens, defined by racial and ethnic
characteristics (Stats SA, 2011).
1.8 SCOPE AND STRUCTURE OF REPORT
Considering the size of the South African population and the number of
advertisements to which they are exposed on a daily basis, this report can only
be seen as an indicator; not an all-encompassing, conclusive evaluation. The
segmentation criteria selected (age group, gender and population group) are
also only three of a multitude of other criteria that are available, and the degree
to which the results can be segmented will depend on the diversity of
Introduction
10
respondents; something which can’t be accurately predicted before the final
data is collected. Similarly, selecting only print (magazine or newspaper)
advertisements for use in the survey can also be seen as a possible limitation of
this study.
The literature review that follows will delve deeper into the intricacies of the
research topic. It will explore in some detail the appeals used in advertising,
nostalgia, advertising, nostalgic advertising and the South African public.
Thereafter empirical research will be conducted and evaluated to determine the
relevance of nostalgia in advertising to different South African consumers; as
per the parameters mentioned above.

Theory and Literature Review
11
2 THEORY AND LITERATURE REVIEW
2.1 INTRODUCTION
Marketers are faced with numerous challenges, including globalisation and
advancing technologies (SDL, 2006). However, the primary challenge to
marketers is to ensure that their brands go beyond flashy advertisements or
striking logos, and that they consistently create positive customer experiences
that encourage repeat purchases (SDL, 2006).
Nostalgia is a prominent theme underlying many of today’s marketing and
advertising strategies (Cosgrove & Sheridan, 2002). Although it might be
idealised, in the marketplace of today we see many firms using nostalgia to
address a growing desire by consumers to recapture the past through the
consumption of this nostalgia (Naughton & Vlassic, 1998). With the rise of
nostalgia in popular culture, collective marketing research attention has
focussed on defining, categorising, and/or measuring the construct in an effort
to better understand how it influences consumer behaviour (Muehling & Sprott,
2004). Although marketplace observations would suggest that nostalgic
advertising is a viable creative strategy, surprisingly few academic studies
seeking to examine its relative effectiveness have been reported in academic
literature (Muehling & Sprott, 2004).
The purpose of this chapter is to inform a study designed to establish whether
there is a link between South African consumers to whom nostalgic advertising
is relevant, and their age group, gender and/or population group.

Theory and Literature Review
12
2.2 ADVERTISING
2.2.1 DEFINING ADVERTISING
Bearden, Ingram, and LaForge (1998) define advertising as “The element of the
marketing communications mix that is non-personal, paid for by an identified
sponsor, and disseminated through mass channels of communication to
promote the adoption of goods, services, persons, or ideas.” However, the
official definition of advertising has been the subject of debate for many years
(see: Appendix 9.2, pg. 86).
For the purpose of finding the true definition of advertising, Richards and Curran
(2002) assembled a panel of 14 experts who debated the topic, prompted
suggestions and voted on opinions; using the Delphi method. They finally
agreed that the new definition of advertising would be:
“Advertising is a paid, mediated form of communication from an identifiable
source, designed to persuade the receiver to take some action, now or in the
future.”
However, even at the final stage of the process, consensus in the panel was not
reached and they had to concede to certain possible flaws in their process and
then finally, that definitions are by nature dynamic (Richards & Curran, 2002).
As for the purpose of this research it will be viewed in a broader, more basic,
consumer assumed definition sense. An exact academic definition of
Theory and Literature Review
13
advertising is not material to this study. What must be kept in mind is that only
print (magazine or newspaper) advertisements will be used the research.
Advertisers are experts in getting people interested in what they have to say
and they also know how to make the advertised messages memorable (Verma,
2009). Advertising practitioners acknowledge that effective image based
advertising should address both the head and heart. Research is only now
beginning to apply learning from cognitive psychology and other sciences on
how meaning is created and memories retained when we are looking at these
visuals (Verma, 2009).
2.2.2 EMOTIONAL APPEALS IN ADVERTISING
In 1991, Moriarty listed 11 different emotional appeals. These included
excitement; fear (danger, personal embarrassment); family (love, protection);
guilt; love (affection, romance); nostalgia; pleasure (humour, happiness, joy);
poignancy; pride; relief; and sorrow (grief, suffering). Some of these appeals are
discussed in the pages that follow.
Consumer behaviour researchers have pointed out that individual differences
among people receiving the message may lead to wide variations in the way in
which they respond to emotional advertising appeals (Moore, Harris & Chen,
1995). Verma (2009) points out that the human brain has a limited processing
capacity and consumers have the tendency to process the most useful and

Theory and Literature Review
14
appealing information first. Advertisers use a variety of different appeals and
demonstrations to attract and retain customers.
Much research has been conducted into the individual different appeals,
including:
Fear (Henthorne, LaTour & Nataraajan, 1993, pg. 67): “…the findings of this
study suggest that "energizing" potential customers to "take action" should be a
primary consideration in the design of fear appeal ads. Advertising practitioners
should not merely trust their own "intuition" as to whether or not a fear appeal
will be effective.”
Humour (Gelb & Zinkhan, 1986, Abstract): “Findings indicate that adding
humour to a conventional hierarchy-of-effects model did not improve the
model's overall explanatory power. Humour was found to be negatively related
to recall and positively related to brand attitude.”
Irritation (Aaker & Bruzzone, 1985): After studying 524 television commercials,
16 copy characteristics or advertising approaches that appear to either increase
or decrease irritation were identified. The results of this study showed that
irritation levels varied by product class and by socioeconomic level.
Nostalgia (Muehling & Sprott, 2004, pg. 25): “The results of our investigation
suggest that nostalgic cues in advertising do indeed influence the type of
thoughts consumers have during ad exposure, and that these thought
Theory and Literature Review
15
processes appear to have an influence on attitudes toward the advertisement
and advertised brand.”
Sex/Arousal (Severn, Belch & Belch, 1990, pg. 13): “Respondents also reported
that sexual appeals were more attention getting, likeable, dynamic, and
somewhat more apt to increase their interest in the topic than were nonsexual
appeals. These findings suggest that persuasion is largely the result of
peripheral processing and distraction from somewhat unpleasant messages
when receivers are expected to counter argue the message or be resistant to
change.”
Warmth (Aaker, Stayman & Hagerty, 1986): Significant and substantial
correlations were also found between warmth and liking of the ad, as well as
between warmth and purchase likelihood. However the lack of a relationship
between warmth and recall suggests that some forms of arousal are not related
to recall.
According to the theory that consumers choose brands to fulfil both rational and
emotional needs, it is not surprising to discover that ads which evoke feelings of
personal enhancement have proven to be very effective (Kover, Goldberg &
James, 1995). An advertisement with distinctive influencing appeals positively
affects the degree to which it is memorised and recalled, as well as the degree
to which it is able to attract the consumers’ attention (Childers and Houston,
1984).
Theory and Literature Review
16
As advertisers increasingly seek greater communication effectiveness, more
careful consideration needs to be given to the selection of the type of
advertising appeal used for each target group (Verma, 2009).
Sanjeev Verma’s (2009) research eventually suggested that when looking at all
rational appeals, appeals depicting refreshment affected consumer purchase
decisions throughout the ad. It also showed that consumers are more likely to
pay more attention to advertisements which portray soft-drinks as refreshing
products, and less attention to other rational appeals like product attributes,
logic and educative information. However, the results did still suggest that
besides refreshment, information like product attributes and educative
information may also influence the consumers’ purchase and repurchase
decisions (Verma, 2009). The advertisements that contained a rational appeal
depicting logic had no influence on any of the stages of consumer purchase
decision. When looking at the emotional appeals, affection, fear, thrill and pride
all managed to attract the consumer’s attention towards the advertisement, but
thrill and pride were the only constructs that could be said to have had a major
influence on consumer purchase decision (Verma, 2009).
Verma (2009) however took note in his region specific study that not many
advertisers in India routinely collected data on the differential impact of
advertising appeals on the consumer purchase decision. He said the findings
indicated that not all emotional ad appeals are equally attractive and that
consumers are only influenced by some of them.

Theory and Literature Review
17
Once the advertising appeal with the highest likeability is determined, the
advertisers would know the relative importance of these emotional appeals in
terms of the relevant target market’s perception. Managers can then generate
strategies that would be designed specifically for those target market segments
(Verma, 2009). With this research however not including many of the
recognised emotional appeals and also being subject to relative national
respondent biases, the results cannot be seen as conclusive or all
encompassing. What can be taken from the findings though, is that there is a
need for unique evaluation of the effects of individual emotional appeals relative
to the applicable target markets (Verma, 2009).
2.3 NOSTALGIA
2.3.1 DEFINING NOSTALGIA
Davies (1979) explains that the word ‘nostalgia’ is derived from the Greek terms
‘nostos’ referring to a return home to one’s native land, and ‘algos’ which refers
to pain, suffering or grief. This can be loosely interpreted as a longing to return
to something in the past or, as stated by Hirsch (1992), the bittersweet yearning
for the past. Sedikides et al (2008) wrote that nostalgia can literally be
described as the suffering endured due to relentless yearning for the homeland.
The term nostalgia was coined in the 17th century by the Swiss physician
Johaness Hofer (1688/1934), but references to the emotion state it defines can
be found in Hippocrates, Caesar, and the Bible.
Theory and Literature Review
18
Although homesickness refers to one’s place of origin, nostalgia can refer to a
variety of objects, persons, places or events. With this in mind we could assume
the contemporary definition of nostalgia as a sentimental longing for one’s past
(Wildschut et al, 2006).
Marchgiani & Phau (2011) say nostalgia may also be generated either from a
personally remembered past (personal nostalgia) or from a time in history
before one was born (historical nostalgia). Both these appeals are evident in the
marketplace, for example in campaigns that connect the brand to a consumer’s
experience in childhood (personal nostalgia) or the recent surge in younger
consumers’ fascination with ‘retro’ items (historical nostalgia).
Muehling (2011) notes that several other academics have also defined different
types and forms of nostalgia. Baker and Kennedy (1994), Havlena and Holak
(1991), and Stern (1992) have categorised nostalgia as an emotion evoked
either by recalling a personally experienced past (referred to as real or personal
nostalgia), or recalling simulated, historical, vicarious nostalgia (a sentimental
yearning for an indirectly experienced past). Hirsch (1992) also offered an
explanation as to the emergence of nostalgia as a dominant theme in society.
He said that nostalgia increases as consumers become more dissatisfied with
life as it is today.
The value of future investigations into nostalgia as an emotional appeal cannot
be disputed. Sedikides et al (2008) said that although throughout centuries it
was regarded as a psychological ailment, nostalgia is now emerging as a

Theory and Literature Review
19
fundamental human strength. It is acknowledged as being part of the fabric of
everyday life and serves at least four key psychological functions. These
include the generation of positive affect; elevation of self-esteem; fostering
social connectedness; and alleviating existential threat. By so doing, nostalgia
can help one navigate successfully the changing phases and conditions of daily
life (Sedikides et al, 2008)
2.3.2 PERSONAL NOSTALGIA
While it is confirmed that nostalgia has a significant presence in the advertising
world, it must still be established whether nostalgic experiences are consistent
among individual consumers. Researchers find some people are more nostalgia
prone in that they more actively seek out nostalgic information (Holbrook &
Schindler, 1996). According to Baker and Kennedy (1994) and Goulding (2001),
personal nostalgia is a longing for the personally experienced past; as well as
all the things, memories, and people associated with it.
The personal nostalgia experience is made up of both cognitive
(autobiographical memories) and emotional dimensions (Baumgartner, 1992).
People experiencing personal nostalgia remember things and events in a more
positive light than they actually occurred (Ford 2010).
It has also been said that advertisers should move beyond the traditional way of
thinking about nostalgic advertising and rather use their consumers’ childhood
memories as a more general theme in their advertising campaigns. This could

Theory and Literature Review
20
be seen as a way to form a closer emotional bond (Braun-LaTour, 2007). To
understand how this can be accomplished, it is important to first differentiate
nostalgia from the simple experience of recollection, and the content and
meaning associated with these recalled memories (Braun-LaTour, 2007).
Personal nostalgia has been found to influence a preference for certain
products and services (Braun-LaTour, LaTour & Zinkhan, 2007). Sullivan (2009)
attributes this specifically to the increasing use of personal nostalgia in the
advertising for consumer goods; including products like banking, beer, breakfast
cereal, colas and insurance. Ford and Merchant (2010) regard personal
nostalgia as a particularly relevant construct to be used in communications by
companies that claim a long, storied history; as it is possible that several
generations of consumers have had past experiences that can be connected to
happy periods or events in their lives that have the potential to enhance their
emotional orientation towards the company involved.
Memory is a reconstructive process so, what is remembered at any one time
may differ substantially from how the event actually occurred. Consumers
unconsciously fill in the gaps with their own personality and lifestyle preferences
so that the final resultant memories contain important insights into these
preferences (Braun-LaTour, 2007).
Some individuals show a higher propensity for nostalgia than others. This
propensity has been defined as “a facet of individual character - a
psychographic variable or aspect of life-style, or a general customer

Theory and Literature Review
21
characteristic that may vary among consumers” (Holbrook, 1993). Braun-
LaTour (2007) suggests that advertisers wanting to form deeper connections to
their consumers via childhood memories tap into the underlying meaning that
these consumers associate with their specific product or brand, rather than the
more generic cultural associations assumed by most advertisers.
However it was suggested that for individuals exposed to personally nostalgic
ads that are not aligned to their expectations or do not resonate with their own
past or nostalgic recollections, the outcome may be less favourable attitudes
towards the brand and advertisement (Muehling and Sprott, 2004).
2.3.3 HISTORICAL NOSTALGIA
Marchegiani & Phau (2011) have termed the recent rapid increase in younger
consumers’ level of fascination with “retro” items, historical nostalgia. The
appeal and resulting prevalence of historical nostalgia can be seen in the
fashion industry, movies and in the resurgence of pop-culture personalities and
items amongst members of the younger generation who did not experience
these products and icons when they first entered the market. Meuhling (2011)
defines historical nostalgia as a type of nostalgia that deals with collective
memory and includes events the consumer could not have experienced directly
due to time they actually occurred.
Experiencing historical nostalgia involves the employment of collective memory
(Meyers, 2001) combined with a little bit of fantasy (Stern, 1992). Collective
Theory and Literature Review
22
memory is described as being shared, passed on and even constructed by the
group, or members of modern society. It is also discussed as being in some
ways the nostalgic equivalent of virtual reality (Holak et al, 2008).
Research has shown that some cognitive responses and attitudes towards the
brand change substantially when respondents experience moderate to high
levels of historical nostalgia, as opposed to low ones (Marchegiani & Phau,
2011). Attitudes towards the advert and the resulting purchase intentions
continue to improve significantly each time the level of historical nostalgia is
increased. As the level of historical nostalgia experienced increases, a
corresponding increase in thoughts related specifically to this historical
nostalgia is also expected (Marchegiani & Phau, 2011). It was also suggested
that nostalgic adverts may prompt a certain type of thought production, as
opposed simply to prompting more thoughts in general (Muehling and Sprott,
2004).
The findings of Marchegiani & Phau’s (2011) research concluded that significant
changes in the observed responses that resulted from the intensity of historical
nostalgia experienced, are of clear importance to both academics and business
people. As marketers become more successful in evoking historical nostalgic
reactions in consumers by exposing them to various cues, their increasingly in-
depth understanding of and ability to predict reactions, grow more valuable.
These findings also show that various cognitive, attitudinal and purchase intent
reactions change significantly as a result of the levels of historical nostalgia.
When trying to change attitude towards a brand, consumers must at times
Theory and Literature Review
23
experience at least a high level of historical nostalgia before any significant
change can be seen (Marchegiani & Phau, 2011). Other reactions require only
a moderate level of response to be achieved. For example, by increasing the
number of historical nostalgia-related thoughts, after an initial change no benefit
was observed when moving from the moderate to the high level of historical
nostalgia. Lastly, some reactions, such as the number of message or brand-
related thoughts, showed no significant change at any level of historical
nostalgia experienced (Marchegiani & Phau, 2011).
Holbrook and Schindler (1996) noted that individual differences in nostalgia
proneness may aid marketers in understanding consumption-related
preferences that supersede those explained by age alone.
2.4 NOSTALGIC APPEALS IN ADVERTISING
Halbwachs (1992) contended that the process of creating collective memories is
absolute and the need to reconstruct the past and the social group’s ability to
utilise it are so important, that the actual origins of past events recalled are only
of secondary importance. This implied that the factual past only has limited
significance in the nostalgic process of shaping collective memories so that they
suit current needs.
As can be seen in the graph below, nostalgic thoughts have been found to
accommodate a significant proportion of total thoughts experienced by a
consumer when being exposed to advertising.

Theory and Literature Review
24
Figure 1: Proportion of Nostalgic Thoughts to Total Thoughts Generated Across Advertisement Conditions.
(Muehling, 2004)
Essentially the literature leans towards the opinion that nostalgia is created by
society, to serve an ideal that they long for. “The positioning of products as
constructed realms of memory offers consumers an emotional and immediate
connection to an assumed better past. During this process, advertising also
influences the way consumers perceive “real” history” (Meyers, 2009, pg 752).
Advertisers are fully aware of the potential of using this nostalgia to generate
sales. Reisenwitz et al (2004) confirms this saying that nostalgia is an attention-
getting technique that advertisers are using to break through the advertising
clutter. Reisenwitz et al (2004) also state that product managers are using
Theory and Literature Review
25
nostalgia in the reintroduction of products, and that many firms use nostalgia in
at least a portion of their advertising strategy.
In 1987 Mercedes-Benz launched a campaign that showed the milestones of
the company’s history with images of vintage Mercedes-Benz vehicles
juxtaposed against factory workers as vehicles ran off an old assembly line, and
race car drivers from the past. All this while “Falling in Love Again” by Marlene
Dietrich played in the background. Reminding consumers of past experiences
has also been the foundation of Disney’s “100 Years of Magic” advertising
campaign. This campaign featured all the unforgettable park moments, like a
child meeting Mickey Mouse for the first time. Pepsi tried to remind the public of
their history by using Britney Spears in a highly publicised Super Bowl ad that
tried to try and symbolise different eras of Pepsi consumers. This is what most
consumers think of when it comes to nostalgic advertising – advertising that
tries to transport consumers back to their past through the use of cultural or
symbolic references (Braun-LaTour, 2007).
By associating brands with a consumer’s significant memory, marketers can
create the impression that the brand is similar to them, like a “friend” or a
“companion” that has been there for the full duration of their lives (Kassarjian,
1971). Past research has also shown that nostalgic advertisements produce
more favourable attitudes toward the ad and the brand as compared to similar
non-nostalgic advertisements (Muehling & Sprott, 2004).
Theory and Literature Review
26
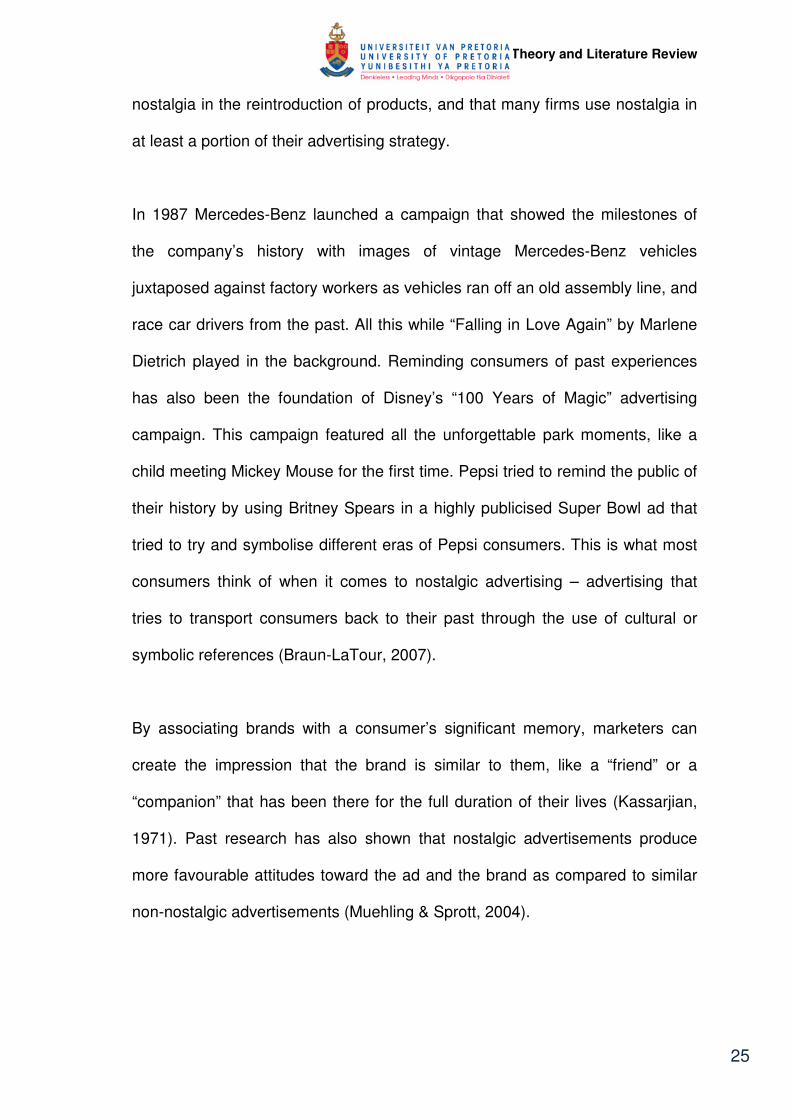
2.4.1 PERSONAL VS. HISTORICAL NOSTALGIA ADS
Figure 2: Examples of Personal vs. Historical Nostalgia Ads
PERSONAL HISTORICAL
(Muehling, 2011)
These ads for a fictitious camera brand were developed for Muehling’s (2011)
research. They are identical except for the copy. The ad on the left was written
to communicate personal nostalgia and the ad on the right, historical nostalgia.
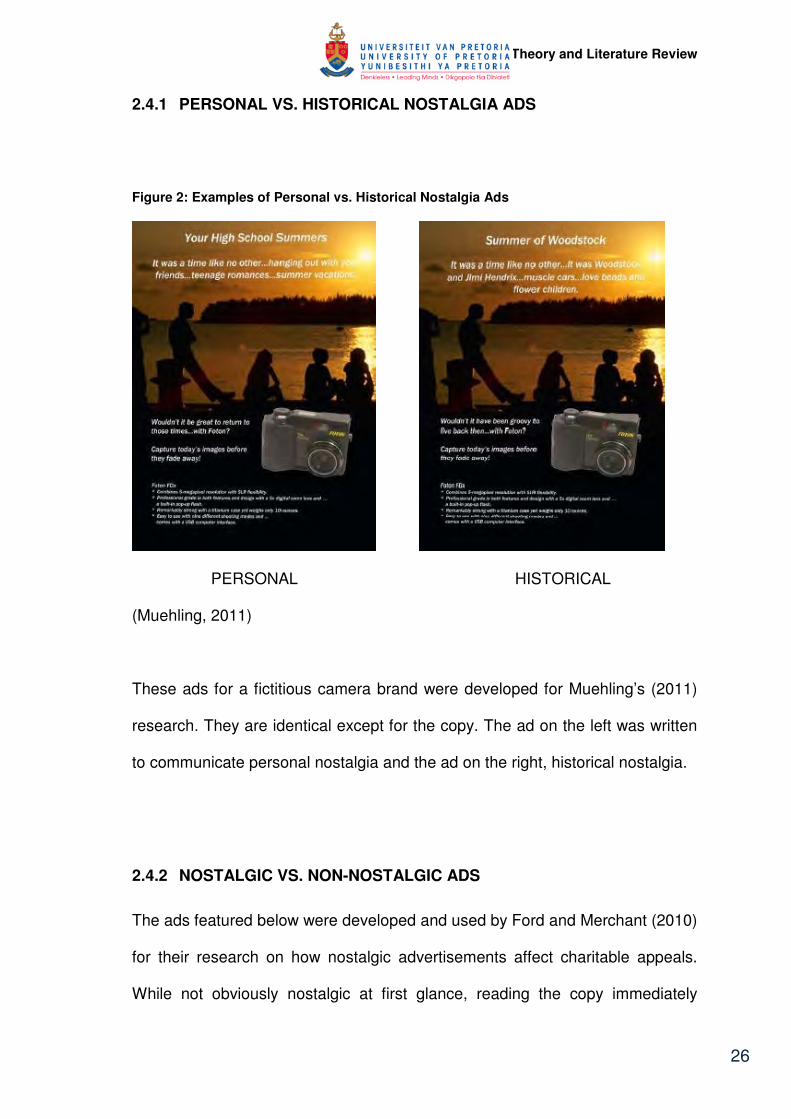
2.4.2 NOSTALGIC VS. NON-NOSTALGIC ADS
The ads featured below were developed and used by Ford and Merchant (2010)
for their research on how nostalgic advertisements affect charitable appeals.
While not obviously nostalgic at first glance, reading the copy immediately
Theory and Literature Review
27
points out the difference between nostalgic and non-nostalgic ads used for the
same product or purpose.
Figure 3: Examples of Nostalgic vs. Non-nostalgic Ads
NOSTALGIC NON-NOSTALGIC
NOSTALGIC NON-NOSTALGIC
(Ford & Merchant, 2010)
Theory and Literature Review
28
2.5 CONCLUSION
Current academic literature provides many opinions on nearly all aspects
relating to this research topic; but nothing conclusive regarding the most
appropriate audiences to target with nostalgic advertisements, and nothing that
refers to the South African population and the diversity of its consumers.
Nostalgic appeals are used globally and in virtually every product category
advertised. Academic research has established that in most cases, if the
marketer is able to connect with the consumer through nostalgic appeals used
in advertisements, positive effects relating to brand perception, ad perception
and future decision to purchase can be observed.
Yet despite this widespread use, little is known about the consumer audiences
most or least receptive to these ads. As Verma (2009) said, as advertisers
increasingly seek greater communication effectiveness, more careful
consideration needs to be exercised when selecting the type of advertising
appeal used for each target group.
Subsequent to this literature review, the empirical research seeks to determine
to whom in the South African population nostalgic advertising appeals; based
on the parameters mentioned above (age group, gender & population group).
Hypotheses
29
3 HYPOTHESES
The purpose of this research is to determine the relevance of nostalgic
advertisements to different age groups, genders and population groups in South
Africa. “Population groups” is the term used by Statistics SA (2011) to classify
the most prominent South African ethnic-racial groups.
When used as an advertising strategy; ads containing a nostalgic cue, where
retrieval of pleasant rather than unpleasant memories or associations are
encouraged (hereafter, referred to as nostalgic advertisements), are more likely
to generate positively associated feelings than would ads devoid of such
nostalgic reference (hereafter, referred to as non-nostalgic advertisements)
(Muehling & Sprott, 2004).
With different products having sometimes vastly different target markets, it
seems essential that advertisers know whether the nostalgic advertising
appeals that they are communicating, are in fact having the desired effect on
their specific target market.
3.1 HYPOTHESIS - 1
H1: The relevance of nostalgic appeals in advertising varies depending on the
consumer’s age.
H0: The relevance of nostalgic appeals in advertising does not vary depending
on the consumer’s age.
Hypotheses
30
3.2 HYPOTHESIS - 2
H1: The relevance of nostalgic appeals in advertising varies depending on the
consumer’s gender.
H0: The relevance of nostalgic appeals in advertising does not vary depending
on the consumer’s gender.
3.3 HYPOTHESIS - 3
H1: The relevance of nostalgic appeals in advertising varies depending on the
consumer’s population group.
H0: The relevance of nostalgic appeals in advertising does not vary depending
on the consumer’s population group.

Research Methodology and Design
31
4 RESEARCH METHODOLOGY AND DESIGN
4.1 INTRODUCTION
The following chapter explains the research methodology and design that was
used to empirically test the hypotheses presented in chapter three. Beginning
with the research design, it goes on to look at the population and sampling
methods used. The actual survey is then reviewed before discussing the means
of evaluating the results.
4.2 RESEARCH DESIGN
The design selected to best test the hypotheses was a survey. This survey
represented an exploratory quantitative design, and was conducted in the form
of an online questionnaire.
A web-based questionnaire was used where an invitation (see: Appendix 9.1,
pg. 85) and related survey link was emailed to some members of the sample.
Another link was also placed on the researcher’s Facebook social networking
page, with a paragraph urging “friends” to “click” on the link and complete the
survey. Respondents were then prompted to answer three questions which
defined their age group, gender and population group; followed by analysing
five print advertisements that were rated on a ten-statement, five-point likert
scale ranging from “strongly agree” to “strongly disagree”.
Research Methodology and Design
32
Exploratory research was selected as it helps establish familiarity with the
problem situations and identify important variables when forming hypotheses
that can be tested in subsequent research (Weiers, 2008)
Saunders, Lewis and Thornhill (2009) urge researchers to make pre-survey
contact advising recipients to expect a questionnaire or to send a covering letter
with the link; to send a survey link rather than an attachment; and to ensure the
message arrive at times when potential respondents are most receptive.
Weiers (2008) also warns of a number of issues that can arise if a survey or
questionnaire is not appropriately worded. These include inappropriate
vocabulary level; confusing frame of reference; “leading” words or phrases; and
sensitive topics.
Weiers (2008) also pointed out the following possible errors of survey research:
Sampling error - When the sample used is not representative of the population
as a whole).
Response error - When respondents distort the truth and give answers that they
imagine will be more acceptable.
Non-response error - When respondents either do not return the questionnaire
or return it incomplete.
Research Methodology and Design
33
4.3 POPULATION AND SAMPLING
In this research the population was defined as all literate South African
consumers.
The survey link was initially emailed to approximately 45 members of the
sample. These members were clients, colleagues or social contacts of the
researcher. The second link was placed on the researcher’s Facebook social
networking page, with a paragraph urging “friends” to “click” on the link and
complete the survey. In both instances, respondents were urged to “forward”
the link on to their “contacts” so as to increase the eventual total number and
diversity of respondents to the survey. It was assumed that all respondents
were consenting adults as the introductory page specified that respondents
should only proceed with the questionnaire if they were 18 years or older.
This method is termed Snowball sampling and is used when it is difficult to
identify or make contact with members of the desired population (Saunders,
Lewis and Thornhill, 2009). The process involves making initial contact with
several members of the population; ask them to identify further members; ask
these new members to identify even further new members; and then stop when
either new members cease to present themselves or when the sample is large
enough to be utilised in the research (Saunders, Lewis and Thornhill, 2009).
Limitations to this kind of sampling included the fact that it was not random. In
order to participate they also needed internet access. This internet access
needed to be associated with a corresponding email address or Facebook

Research Methodology and Design
34
profile. Lee (1993) also recognises the problem of bias as respondents are most
likely to identify other respondents that are similar to them, resulting in a
homogenous sample. Several respondents did not complete all the questions in
the survey and their responses were thus disregarded.
4.4 SAMPLE SIZE
The survey was initially emailed to 45 recipients and made open to voluntary
participation through Facebook. Respondents were then urged to encourage
other contacts in their own social and business networks to also complete the
survey. The target was a minimum of 75 responses. This number was deemed
adequate given the time and budget constraints of student research.
4.5 SCALE SELECTION
When reviewing the literature in preparation for this research, an often quoted
scale was the ten-item evoked nostalgia (NOST) scale developed by Pascal,
Sprott and Muehling (2002). This scale was developed by them for the
purposes of their research into the influence of evoked nostalgia on consumers’
responses to advertising. The Cronbach’s alpha for this scale when used in
their study was 0.96, indicating the very high reliability of this scale.
The ten statements used in the scale were:
– Reminds me of the past
– Helps me recall pleasant memories
Research Methodology and Design
35
– Makes me feel nostalgic
– Makes me reminisce about a previous time
– Makes me think about when I was younger
– Evokes fond memories
– Is a pleasant reminder of the past
– Brings back memories of good times from the past
– Reminds me of the good old days
– Reminds me of good times in the past
The purpose of using this scale was to determine respondents’ receptiveness to
nostalgic appeals used in advertising.
4.6 ADVERTISEMENT SELECTION
The online database of global advertising, Adsoftheworld.com was searched
using the filter “South Africa”. From the results, the researcher selected 18 print
advertisements (two each from nine different campaigns) that were deemed to
meet the basic description of nostalgic ads.
These ads were not developed specifically for this research but were existing
advertisements used for South African products, and were freely available in the
public domain. They were selected to provide a variety of different image types;
depict ads that were both copy intensive or that had almost no copy; and reflect
a variety of different product types being advertised.

Research Methodology and Design
36
4.6.1 PRE-TESTING
These 18 advertisements were then sent to 20 of the researchers advertising
and marketing industry colleagues. These colleagues were then given a brief
overview of the research to be conducted as well as standard definition
nostalgia, before being asked to vote for the five advertisements they deemed
most appropriate. 13 people responded by simply stating “yes” or “no” besides
each ad; indicating whether or not they deemed to be a “nostalgic
advertisement.”
4.6.2 FINAL AD SELECTION
The five advertisements that scored the highest in the pre-test were then used
to compile “Survey 1”; which was sent out via email. The five corresponding ads
from the same campaigns as the winning ads were then (regardless of their
score) compiled into “Survey 2”; the link to which was placed on Facebook.
The purpose of running two surveys; identical except for the five images used,
was to minimise the effect of respondent biases that may have been present
towards individual images used in one particular ad in a campaign, over
another. The five types of ads selected were referred to as financial services,
battery, toy, cake flour and car ads. The results of the two surveys were
combined and viewed as one data set when evaluating the final results.

Research Methodology and Design
37
4.7 SURVEY
As can be seen in the table below, the survey began with three introductory
questions, which would later be used to segment respondents.
Table 2: Online Questionnaire
A.01 – Age: 18-24 25-34 35-44 45-54 >54
A.02 – Gender: Male Female
A.03 – Population Group: Black White Coloured Indian Asian
B.01 – Reminds me of the past Strongly Agree
Agree Neutral Disagree Strongly Disagree
B.02 – Helps me recall pleasant memories
Strongly Agree
Agree Neutral Disagree Strongly Disagree
B.03 – Makes me feel nostalgic Strongly Agree
Agree Neutral Disagree Strongly Disagree
B.04 – Makes me reminisce about a previous time
Strongly Agree
Agree Neutral Disagree Strongly Disagree
B.05 – Makes me think about when I was younger
Strongly Agree
Agree Neutral Disagree Strongly Disagree
B.06 – Evokes fond memories Strongly Agree
Agree Neutral Disagree Strongly Disagree
B.07 – Is a pleasant reminder of the past
Strongly Agree
Agree Neutral Disagree Strongly Disagree
B.08 – Brings back memories of good times from the past
Strongly Agree
Agree Neutral Disagree Strongly Disagree
B.09 – Reminds me of the good old days
Strongly Agree
Agree Neutral Disagree Strongly Disagree
B.10 – Reminds me of good times in the past
Strongly Agree
Agree Neutral Disagree Strongly Disagree
These three questions were then followed by ten five-point likert scale rated
statements, repeated five times (once for each advertisements). This was used
to determine the respondents’ receptiveness to and the subsequent relevance
Research Methodology and Design
38
of nostalgic appeals used in advertising, to them. This form of scaling is easy to
construct but can make it difficult to interpret the true meaning of an individual
statement score (Zikmund, 2003).
4.8 DATA GATHERING
The online survey site Surveymonkey.com was employed to host the surveys.
Surveymonkey provided the platform on which to create the surveys; provided
the links for respondents; and securely gathered all the respondent data.
Once the time was reached to gather the data, Surveymonkey allows users to
download the results in a format that can be pre-coded and easily be used in
more advanced statistical analysis programs.
4.9 DATA ANALYSIS
Once the survey site was closed and all data downloaded, it was analysed with
the assistance of a statistician to ensure accuracy.
The responses were coded as follows:
AGE GROUP
“18-24” – 1, “25-34” – 2, “35-44” – 3, “45-54” – 4, “54<” - 5
GENDER
Male – 1, Female – 2

Research Methodology and Design
39
POPULATION GROUP
Black – 1, White – 2, Coloured – 3, Indian – 4, Asian – 5
LIKERT SCALE
Strongly agree – 1, Agree – 2, Neutral – 3, Disagree – 4, Strongly disagree – 5
There were no open-ended questions and respondents needed to complete the
previous question to be able to move on to the next, and eventually the end.
Only surveys completed right to the end were to be used in the hypothesis
testing.
4.9.1 CRONBACH’S ALPHA
The first tests were run to determine the reliability or internal consistency of the
scale (Cronbach, 1951). The Cronbach Alpha statistic can be interpreted as a
coefficient or reliability. It is a measure between 0 and 1; where 0 indicates poor
reliability and 1 indicates complete reliability.
4.9.2 HOMOGENEITY OF VARIANCE ASSUMPTION
The assumption of homogeneity of variance is that the variance within each of
the populations is equal. The assumptions were checked using Levene’s test;
which is used to check the equality of variances in different samples (Levene,
1960). This assumption is made for statistical procedures like ANOVA and t-
Research Methodology and Design
40
tests. When the p-value of Levene's test is less than the critical value (often
0.05), it indicates that it is unlikely that the differences in the sample variances
would have occurred in a random sample.
4.9.3 ANALYSIS OF VARIANCE (ANOVA)
If a numerical variable can be divided into three or more distinct groups using a
descriptive variable, the likelihood of these groups being different can be
assessed with an ANOVA. The differences in the means of the groups are
measured, and should the likelihood of any difference between these groups
occurring simply by chance be low, it will be represented by a large f statistic
with a probability less than 0.05. This is then termed statistically significant
(Saunders, Lewis and Thornhill, 2009).
Calculating the ANOVA results determines whether there were significant
differences in the respondents’ sentiments towards the five different adverts
tested; across all age group, gender and population group categories.
4.9.4 INDEPENDENT T-TEST
If a numerical variable can be divided into two distinct groups using a
descriptive variable, the likelihood of these groups being different can be
assessed with an independent t-test. The differences in the means of the two
groups is measured, and should the likelihood of any difference between these
two groups occurring simply by chance be low, it will be represented by a large

Research Methodology and Design
41
t-statistic with a probability less than 0.05. This is then termed statistically
significant (Saunders, Lewis and Thornhill, 2009).
Should results of the ANOVA tests determine any categories to have
statistically different means, they will be further analysed using the t-tests.
4.10 ASSUMPTIONS
In conducting this research, certain basic assumptions were made concerning
the methodology. These included that the respondents were fluent in the
English language and that they had a sufficient level of computer literacy to
connect to and navigate the survey.
Results
42
5 RESULTS
5.1 INTRODUCTION
This chapter presents the results of the empirical research conducted.
Descriptive statistics are initially employed to depict the data relating to the
survey and actual respondents, before the results of the hypothesis testing are
presented.
5.2 DESCRIPTIVE STATISTICS
Of the 117 surveys that respondents started completing, all 117 respondents
completed the first three questions relating to their individual details. As nothing
could be accurately inferred as to reason that 20 of the respondents didn’t
manage to complete the survey in its entirety, it was assumed that all 117
responses were valid for calculating an initial view of the total respondent
profile.
Following the initial display of results, several comparative tables will also be
shown to further expand on the data collected.

Results
43
5.2.1 AGE GROUP
The majority of respondents (57%) fell within “25-34” age group, followed by
21% in the “35-44” group. The “45-54” group was next with 10%, ending with
the “18-24” and “55<” groups at 7% and 5% respectively.
Figure 4: Age group profile of respondents
Results
44
5.2.2 GENDER
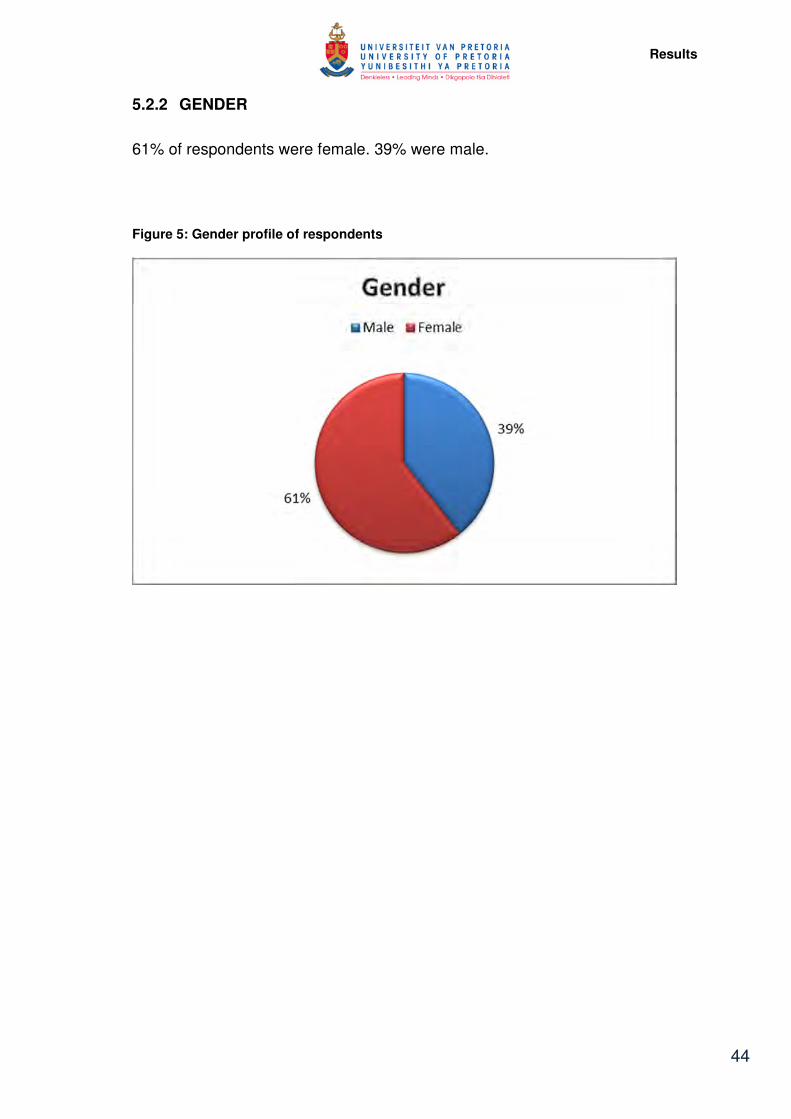
61% of respondents were female. 39% were male.
Figure 5: Gender profile of respondents
Results
45
5.2.3 POPULATION GROUP
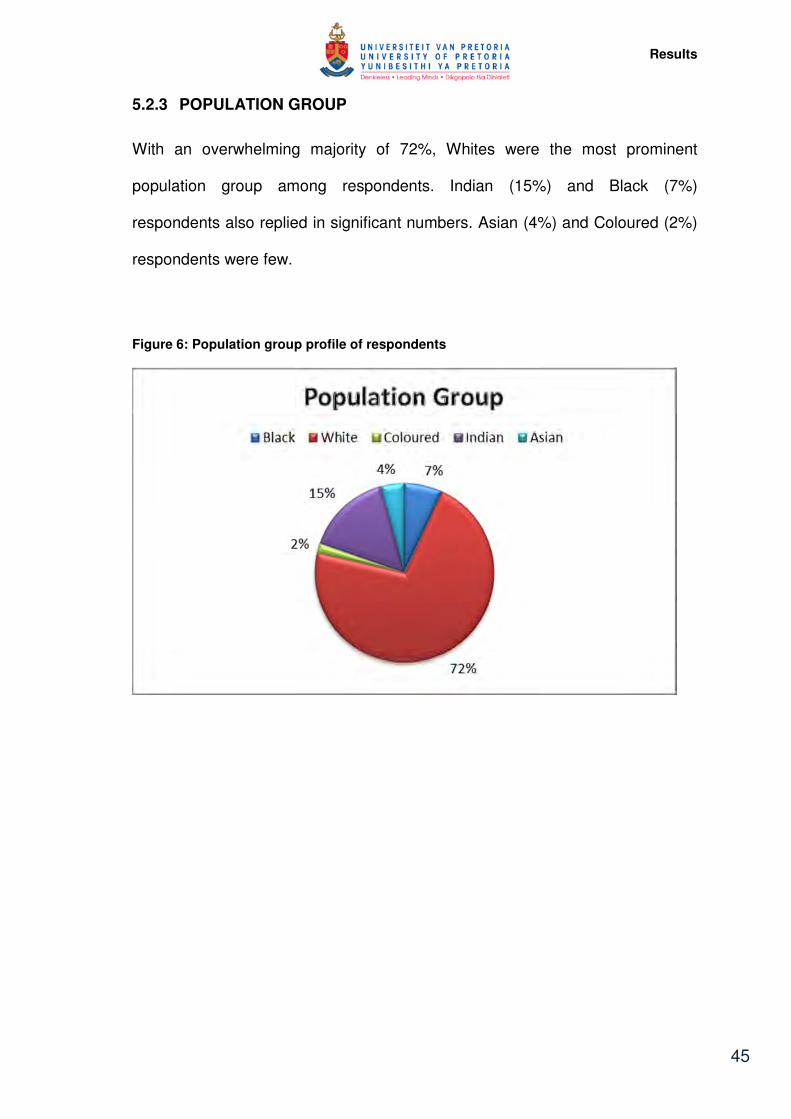
With an overwhelming majority of 72%, Whites were the most prominent
population group among respondents. Indian (15%) and Black (7%)
respondents also replied in significant numbers. Asian (4%) and Coloured (2%)
respondents were few.
Figure 6: Population group profile of respondents
Results
46
5.2.4 FEMALE RESPONDENTS BY POPULATION GROUP
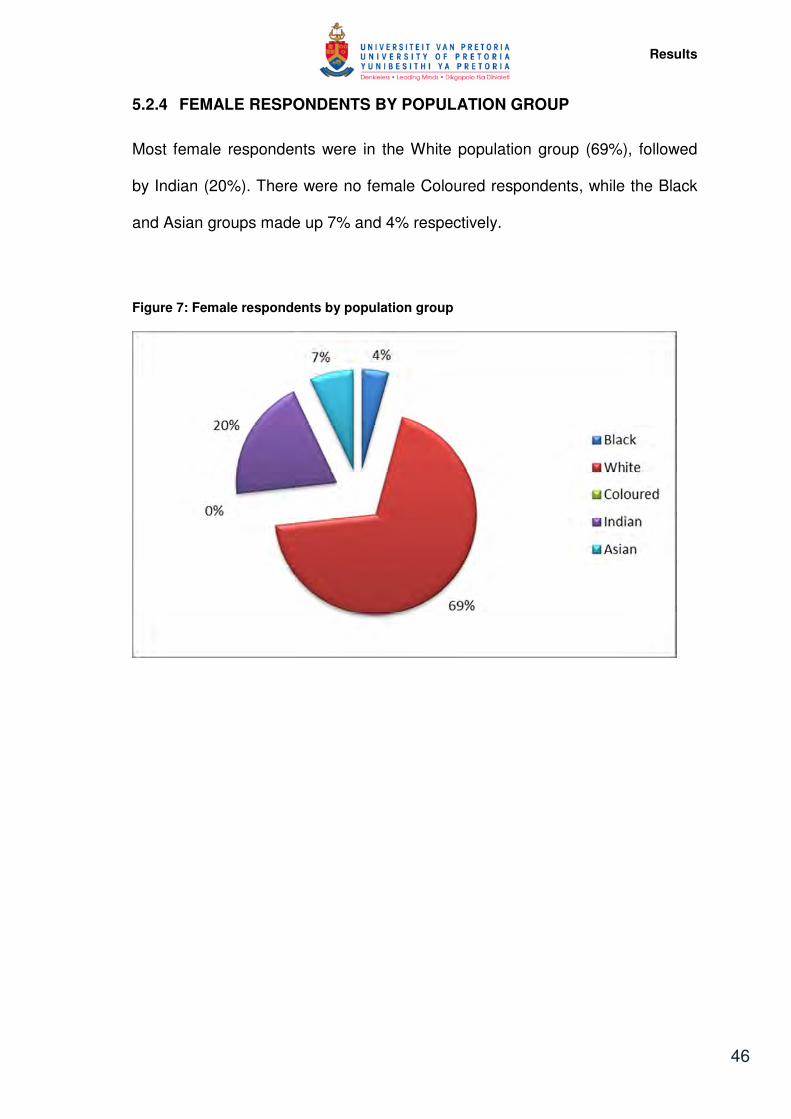
Most female respondents were in the White population group (69%), followed
by Indian (20%). There were no female Coloured respondents, while the Black
and Asian groups made up 7% and 4% respectively.
Figure 7: Female respondents by population group

Results
47
5.2.5 FEMALE RESPONDENTS BY AGE GROUP
More than half (58%) of all female respondents were in the “25-34” age group.
“35-44” accounted for 15% while “18-24” and “45-54” each added another 10%.
The remaining 7% was made up by the “55<” age group.
Figure 8: Female respondents by age group
Results
48
5.2.6 MALE RESPONDENTS BY POPULATION GROUP
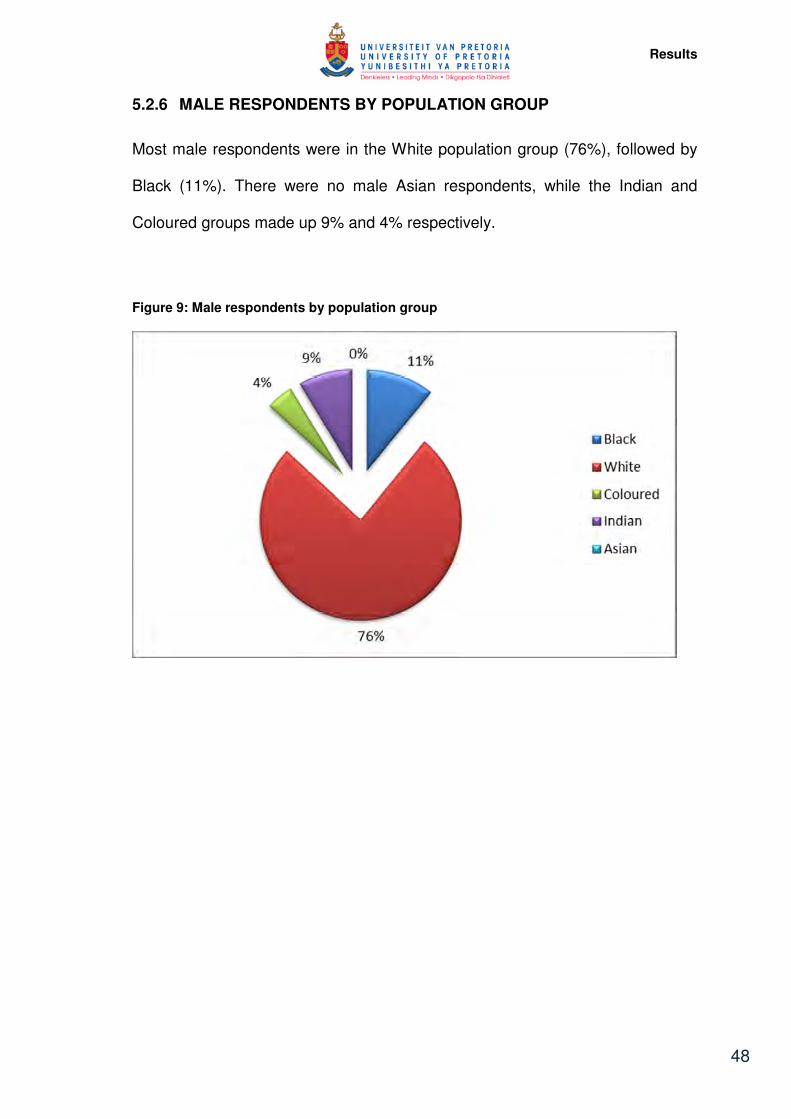
Most male respondents were in the White population group (76%), followed by
Black (11%). There were no male Asian respondents, while the Indian and
Coloured groups made up 9% and 4% respectively.
Figure 9: Male respondents by population group
Results
49
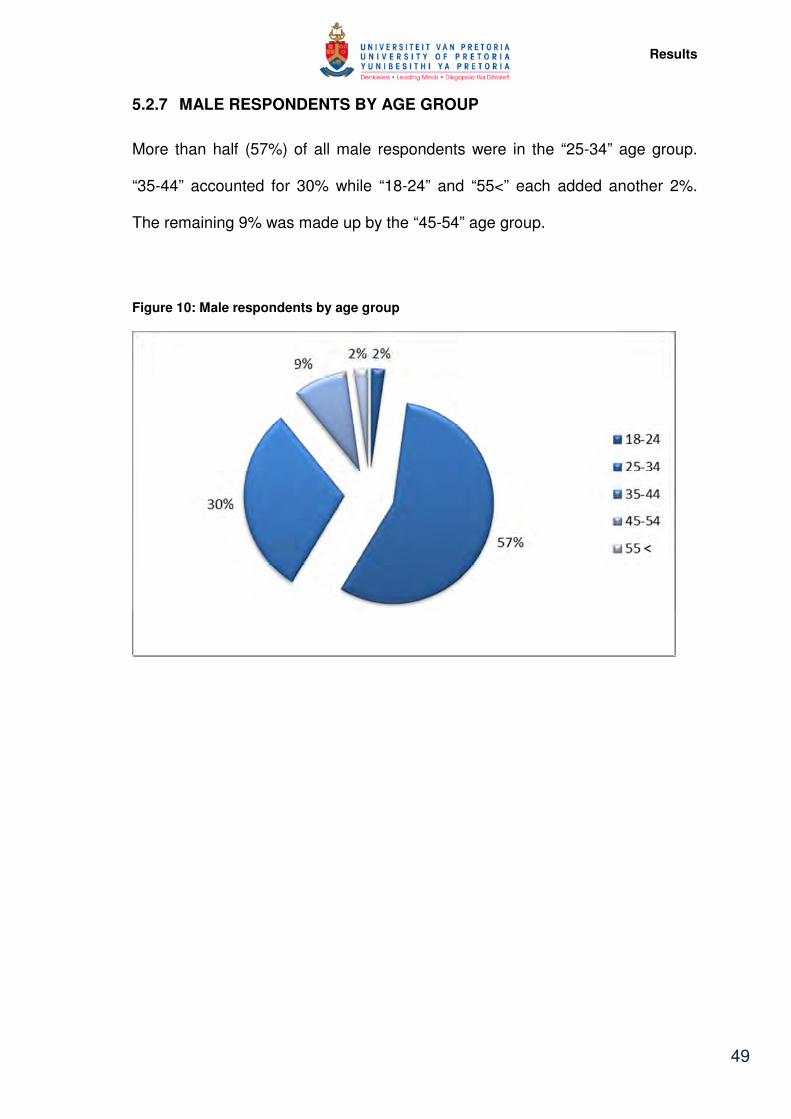
5.2.7 MALE RESPONDENTS BY AGE GROUP
More than half (57%) of all male respondents were in the “25-34” age group.
“35-44” accounted for 30% while “18-24” and “55<” each added another 2%.
The remaining 9% was made up by the “45-54” age group.
Figure 10: Male respondents by age group
Results
50
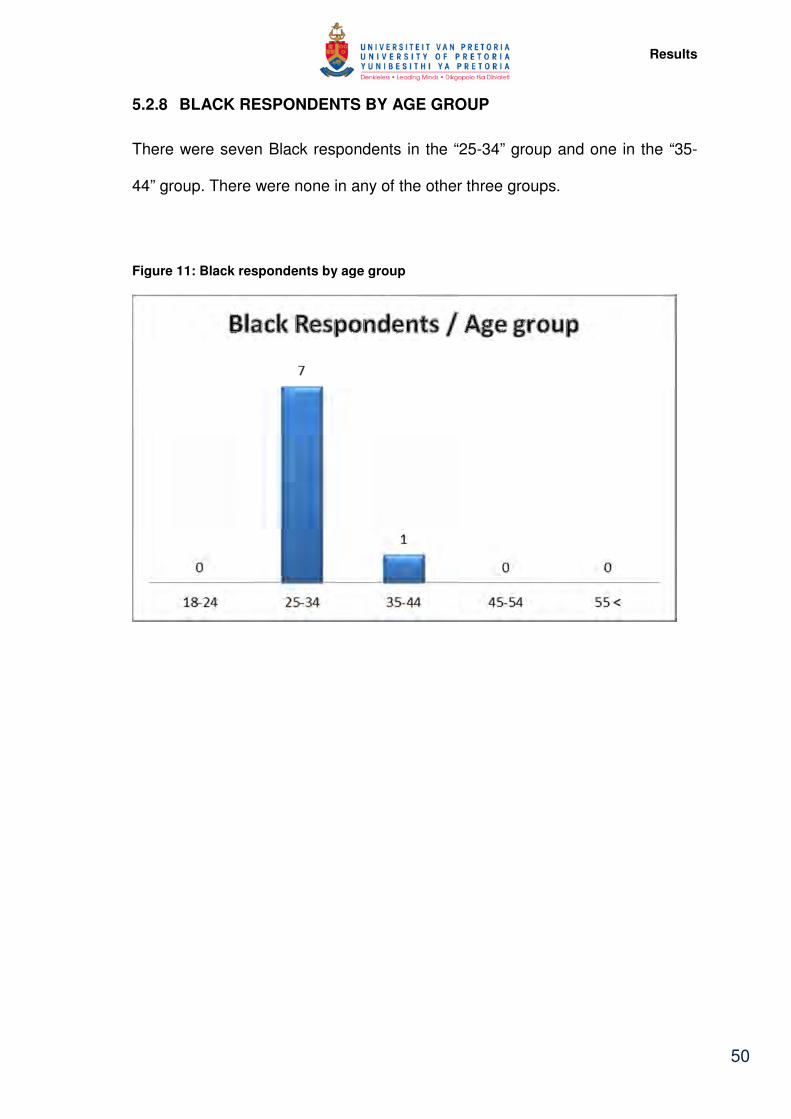
5.2.8 BLACK RESPONDENTS BY AGE GROUP
There were seven Black respondents in the “25-34” group and one in the “35-
44” group. There were none in any of the other three groups.
Figure 11: Black respondents by age group

Results
51
5.2.9 WHITE RESPONDENTS BY AGE GROUP
With 48 respondents, the “25-34” group was the largest. Followed by “35-44”
with 17, “45-54” with nine, “55<” with six, and lastly the “18-24” group with four.
Figure 12: White respondents by age group

Results
52
5.2.10 COLOURED RESPONDENTS BY AGE GROUP
Having the least respondents of all the population groups, there was only one
Coloured respondent in the “18-24” and one in the “35-44” group.
Figure 13: Coloured respondents by age group
Results
53
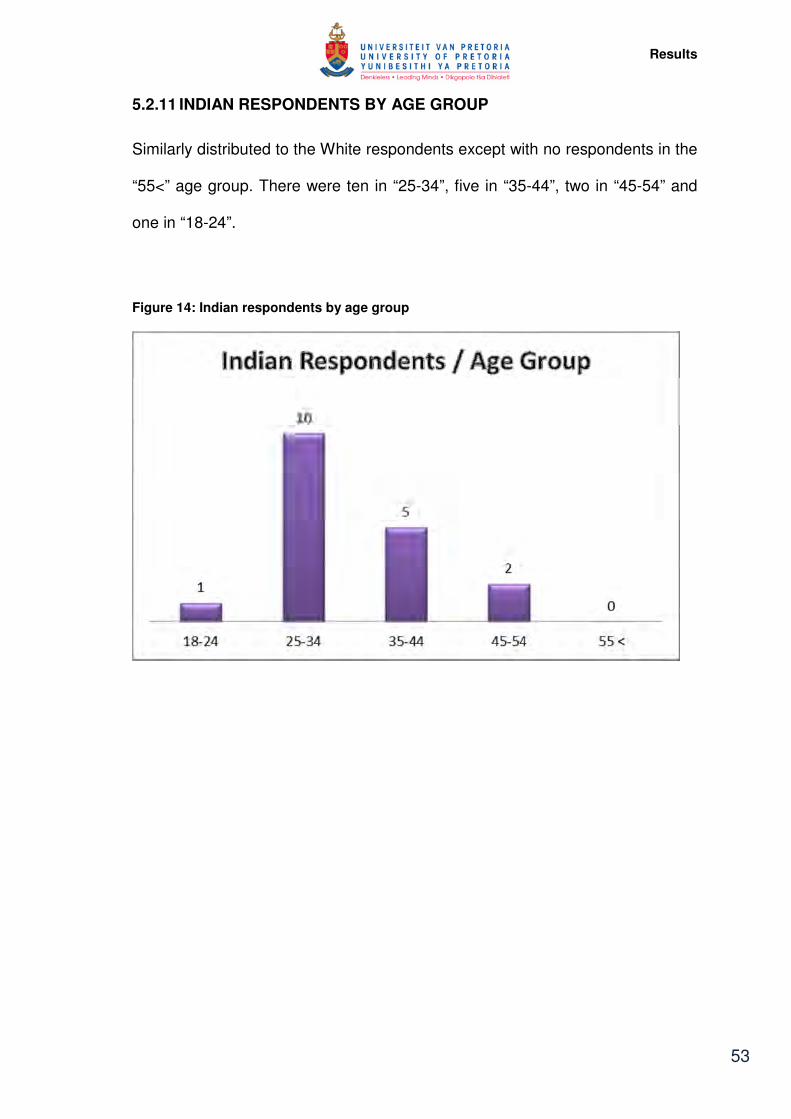
5.2.11 INDIAN RESPONDENTS BY AGE GROUP
Similarly distributed to the White respondents except with no respondents in the
“55<” age group. There were ten in “25-34”, five in “35-44”, two in “45-54” and
one in “18-24”.
Figure 14: Indian respondents by age group

Results
54
5.2.12 ASIAN RESPONDENTS BY AGE GROUP
With no respondents in the two oldest groups, there were two respondents each
in the “18-24” and “25-34” groups, and one in the “35-44” group.
Figure 15: Asian respondents by age group
Results
55
5.3 HYPOTHESIS TESTING
The final relevant sample was composed of 97 respondents. This was lower
than the initial figure of 117 respondents as 20 respondents were disregarded
as they had failed to complete the entire survey.
When the final 117 responses were analysed, it was shown that 78 of these
came from the emails sent out and 39 from Facebook. The qualifying (entirely
completed survey) number of respondents was 70 and 27 respectively; resulting
in a usable sample size of 97 respondents.

Results
56
5.3.1 RELIABILITY RESULTS
Five different ad campaigns were rated on a ten-statement, five-point likert
scale. This scale ranged from “strongly agree” to “strongly disagree”. The
statistic of relevance is the Cronbach Alpha.
Table 3: Summary of Cronbach’s Alpha Results
Advert Type Cronbach’s Alpha
Financial Services 0.96
Battery 0.97
Toy 0.97
Cake Flour 0.98
Car 0.98
The Cronbach Alpha statistic can be interpreted as a coefficient of reliability. It
is a measure between 0 and 1; where 0 indicates poor reliability and 1 indicates
complete reliability. As all of the Alphas are very close to 1, the rating scales
had proven to be very reliable.
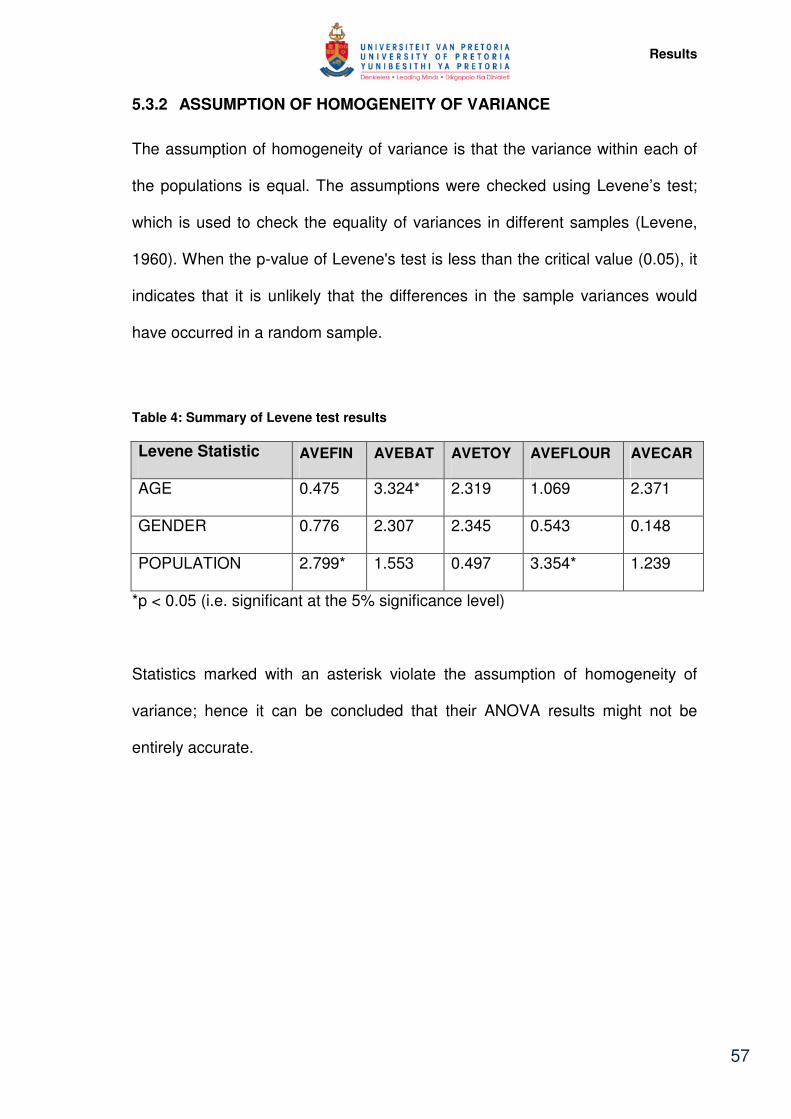
Results
57
5.3.2 ASSUMPTION OF HOMOGENEITY OF VARIANCE
The assumption of homogeneity of variance is that the variance within each of
the populations is equal. The assumptions were checked using Levene’s test;
which is used to check the equality of variances in different samples (Levene,
1960). When the p-value of Levene's test is less than the critical value (0.05), it
indicates that it is unlikely that the differences in the sample variances would
have occurred in a random sample.
Table 4: Summary of Levene test results
Levene Statistic AVEFIN AVEBAT AVETOY AVEFLOUR AVECAR
AGE 0.475 3.324* 2.319 1.069 2.371
GENDER 0.776 2.307 2.345 0.543 0.148
POPULATION 2.799* 1.553 0.497 3.354* 1.239
*p < 0.05 (i.e. significant at the 5% significance level)
Statistics marked with an asterisk violate the assumption of homogeneity of
variance; hence it can be concluded that their ANOVA results might not be
entirely accurate.
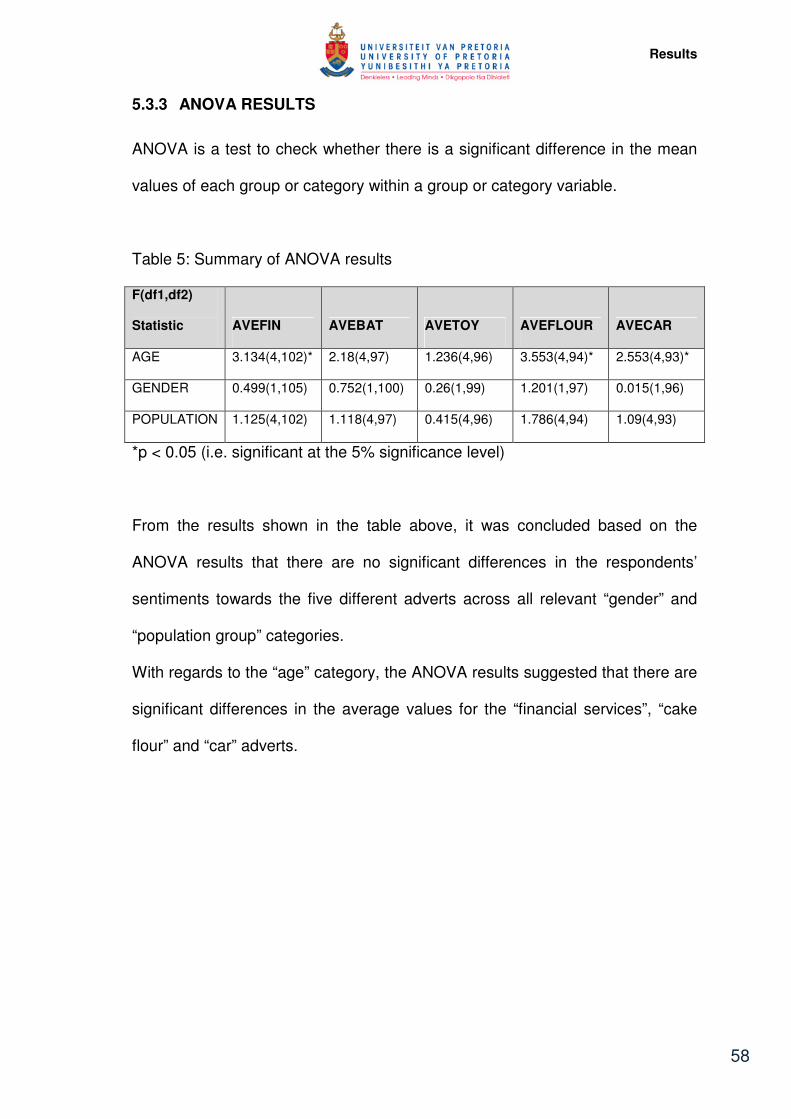
Results
58
5.3.3 ANOVA RESULTS
ANOVA is a test to check whether there is a significant difference in the mean
values of each group or category within a group or category variable.
Table 5: Summary of ANOVA results
F(df1,df2)
Statistic AVEFIN AVEBAT AVETOY AVEFLOUR AVECAR
AGE 3.134(4,102)* 2.18(4,97) 1.236(4,96) 3.553(4,94)* 2.553(4,93)*
GENDER 0.499(1,105) 0.752(1,100) 0.26(1,99) 1.201(1,97) 0.015(1,96)
POPULATION 1.125(4,102) 1.118(4,97) 0.415(4,96) 1.786(4,94) 1.09(4,93)
*p < 0.05 (i.e. significant at the 5% significance level)
From the results shown in the table above, it was concluded based on the
ANOVA results that there are no significant differences in the respondents’
sentiments towards the five different adverts across all relevant “gender” and
“population group” categories.
With regards to the “age” category, the ANOVA results suggested that there are
significant differences in the average values for the “financial services”, “cake
flour” and “car” adverts.

Results
59
5.3.4 T-TEST RESULTS
In order to comment on and identify these differences, the next step was to look
at the individual mean differences between the different categories. Note was
taken of the actual average values for each age group across the three different
adverts, in the table below.
Table 6: Summary of mean values
N Mean
Std. Deviation
Std. Error
Minimum Maximum
AVEFIN 18-24 8 2.4625 .82969 .29334 1.50 4.00
25-34 61 2.6803 .91648 .11734 1.00 5.00
35-44 25 3.2520 .98536 .19707 1.60 5.00
45-54 7 3.5714 1.04357 .39443 1.70 5.00
>54 6 3.0167 .68532 .27978 2.00 4.00
Total 107 2.8748 .96222 .09302 1.00 5.00
AVEFLOUR 18-24 6 4.3500 .50498 .20616 4.00 5.00
25-34 56 3.4714 1.01242 .13529 1.20 5.00
35-44 25 3.7200 1.04083 .20817 1.30 5.00
45-54 7 2.5857 1.03349 .39062 1.00 4.00
>54 5 2.8000 .66332 .29665 1.80 3.60
Total 99 3.4909 1.03855 .10438 1.00 5.00
AVECAR 18-24 6 4.4333 .47610 .19437 4.00 5.00
25-34 55 3.4164 1.09185 .14722 1.00 5.00
35-44 25 3.6240 1.07869 .21574 1.90 5.00
45-54 7 3.5286 .79732 .30136 2.70 5.00
>54 5 2.5200 .52631 .23537 1.90 3.00
Total 98 3.4939 1.06081 .10716 1.00 5.00
The graphs and the table that follow clearly point out where the significant
differences were observed in the means.
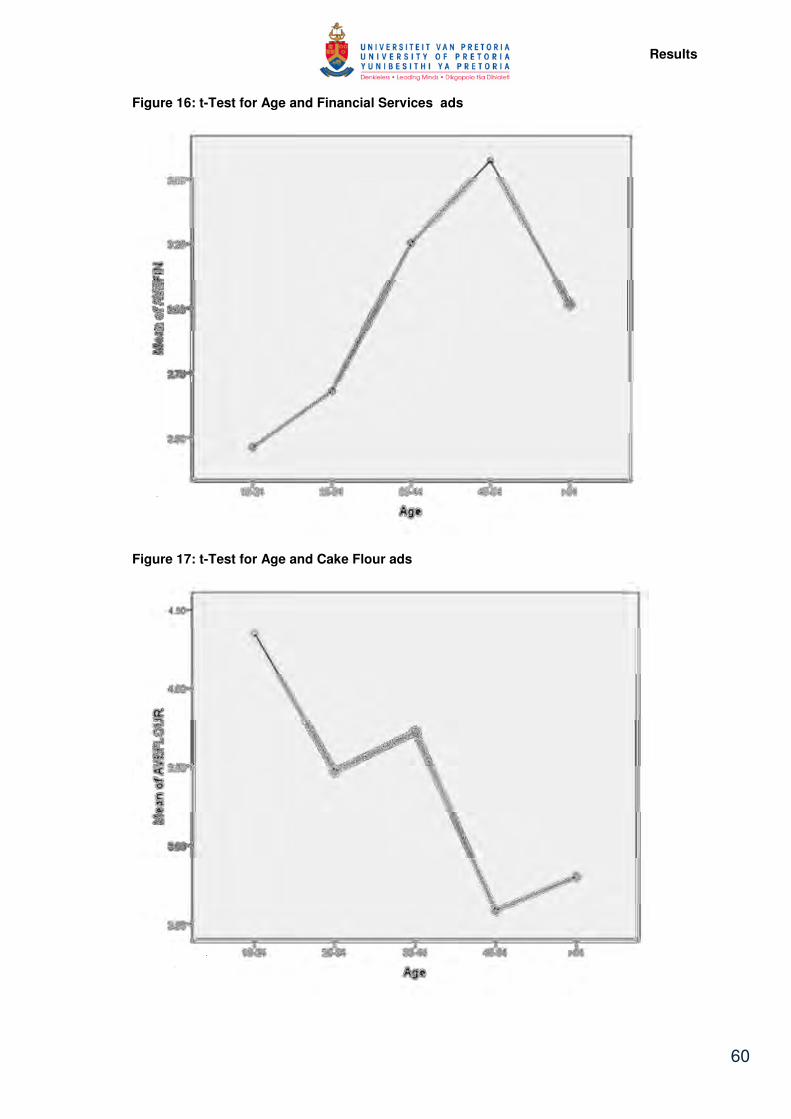
Results
60
Figure 16: t-Test for Age and Financial Services ads
Figure 17: t-Test for Age and Cake Flour ads

Results
61
Figure 18: t-Test for Age and Car ads
Table 7: Summary t-test Results
Dependent Variable Age Age
Mean Difference
Std. Error Sig.
AVEFIN 18-24 25-34 -.21783 .34807 .983
35-44 -.78950 .37601 .360
45-54 -1.10893 .47908 .260
>54 -.55417 .49992 .873
AVEFLOUR 18-24 25-34 .87857 .42455 .376
35-44 .63000 .44930 .742
45-54 1.76429* .54985 .043
>54 1.55000 .59846 .162
AVECAR 18-24 25-34 1.01697 .44215 .267
35-44 .80933 .46751 .561
45-54 .90476 .57215 .646
>54 1.91333 .62272 .059
*. The mean difference is significant at the 0.05 level.
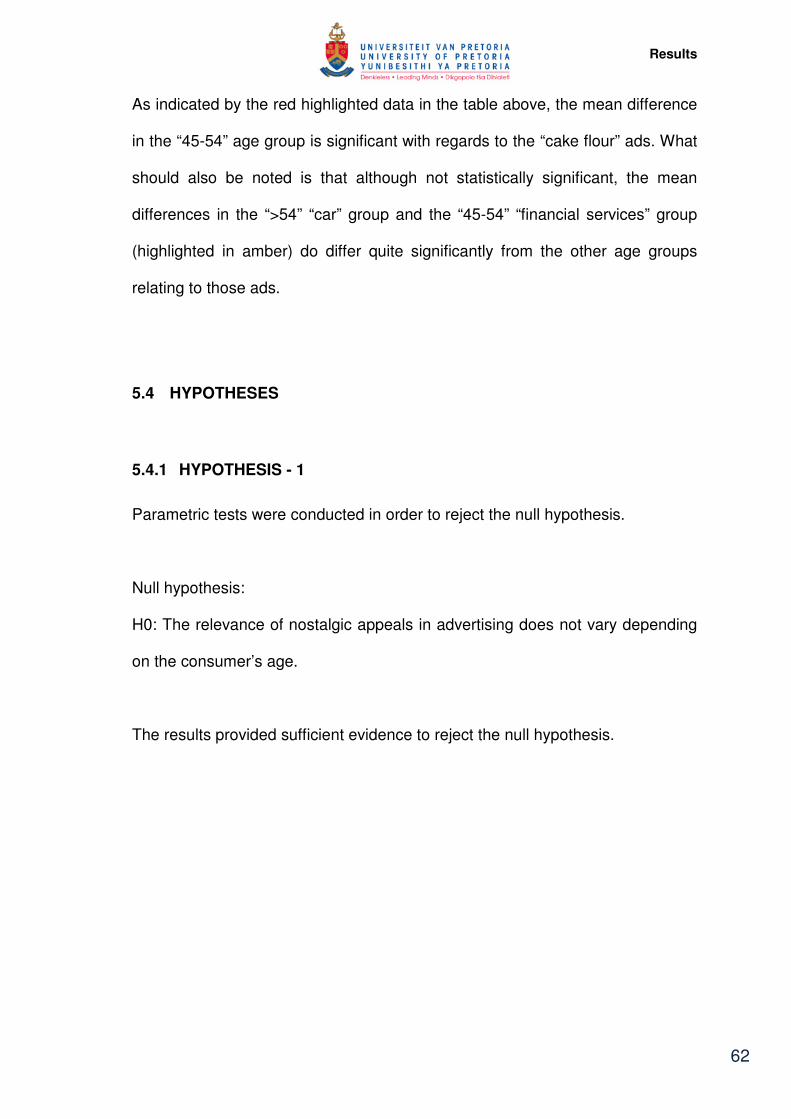
Results
62
As indicated by the red highlighted data in the table above, the mean difference
in the “45-54” age group is significant with regards to the “cake flour” ads. What
should also be noted is that although not statistically significant, the mean
differences in the “>54” “car” group and the “45-54” “financial services” group
(highlighted in amber) do differ quite significantly from the other age groups
relating to those ads.
5.4 HYPOTHESES
5.4.1 HYPOTHESIS - 1
Parametric tests were conducted in order to reject the null hypothesis.
Null hypothesis:
H0: The relevance of nostalgic appeals in advertising does not vary depending
on the consumer’s age.
The results provided sufficient evidence to reject the null hypothesis.

Results
63
5.4.2 HYPOTHESIS - 2
Parametric tests were conducted in order to reject the null hypothesis.
Null hypothesis:
H0: The relevance of nostalgic appeals in advertising does not vary depending
on the consumer’s gender.
Insufficient evidence was provided by the results to reject the null hypothesis.
5.4.3 HYPOTHESIS - 3
Parametric tests were conducted in order to reject the null hypothesis.
Null hypothesis:
H0: The relevance of nostalgic appeals in advertising does not vary depending
on the consumer’s population group.
Insufficient evidence was provided by the results to reject the null hypothesis.

Discussion of Results
64
6 DISCUSSION OF RESULTS
6.1 INTRODUCTION
The nostalgic emotional appeal used in many advertisements and discussed in
chapter two, was researched to determine whether those to whom it was
relevant could be segmented by specific demographic criteria. Snowball
sampling was used to compile the sample which eventually stood at 117
respondents. This number was however later reduced to 97 respondents (83%)
as 20 people had not completed the survey in its entirety and their responses
were thus excluded from the hypothesis testing.
The demographics (age group; gender; and population group) of the survey
were described using descriptive statistics. Thereafter, Cronbach’s Alpha was
used to test the reliability of the scale which was employed to establish whether
respondents were indeed receptive to the nostalgic appeals used in advertising.
After testing the homogeneity of the results using Leven’s test, the Hypotheses
were tested for significant differences using ANOVA and independent t-tests.
6.2 DESCRIPTIVE STATISTICS
A total of 117 responses were initially received. 78 of these originated from the
email link that was initially emailed out while 39 originated from the link placed
on the researchers Facebook page. Of the 97 responses that were fully
completed and thus eligible for inclusion in the statistical evaluation, 70 came

Discussion of Results
65
from email and 27 from Facebook. As all 117 initial respondents did complete
the first three demographic questions, all 117 responses were included in the
descriptive statistics section.
6.2.1 AGE GROUP
The majority of respondents (57%) fell within “25-34” age group, followed by
21% in the “35-44” group. Only 7% were under 25 and only 5% were over 54.
Possible reasons behind this imbalance could include the respondent bias
mentioned by Lee (1993) when referring to Snowball sampling. Especially when
the sampling process is conducted over a relatively short timeframe with a
relatively small number of respondents, a researcher is likely to compile a
relatively homogenous sample.
6.2.2 GENDER
When evaluating the gender of respondents, 61% were female and 39% were
male. Given that the South African population, regardless of age or population
group, is almost evenly divided when it comes to genders (Stats SA, 2011), this
occurrence cannot be explained. It is assumed that, as with the bias in age
group classification, this is the result of the Snowball sampling method. It is
envisaged that with a larger sample the result would be more reflective of the
national population division.

Discussion of Results
66
6.2.3 POPULATION GROUP
With an overwhelming majority of 72%, whites were the most prominent
population group among respondents. Indian (15%) and black (7%)
respondents also replied in significant numbers; however the response numbers
from the Coloured and Asian groups was negligible. Again, as with the last two
groups, it is assumed that this bias is a factor of the Snowball sampling method.
Should the sample be allowed to continue to grow it is inevitable that it will
eventually become more representative of the national population breakdown
(Stats SA, 2011).
6.2.4 GROUP COMPARISONS
The biases towards one particular segment in all the group comparisons that
were looked at in the results can all be attributed to the same homogeneity bias
inherent in the Snowball sampling method (Lee, 1993). This logic has already
been used to explain the previously mentioned unbalanced results and there is
thus no value in discussing it further.
6.3 HYPOTHESIS TESTING
Parametric tests were employed to test the three hypotheses. Only the 97 fully-
completed responses were used.

Discussion of Results
67
6.3.1 CRONBACH’S ALPHA
Following a pre-test to determine whether the researcher’s perception of a
nostalgic ad was accurate; five different South African print advertisements
were selected for use in the survey. Another five corresponding ads from the
same campaigns were then also selected to be placed in an otherwise identical
survey to the first one, in order to minimise possible individual image or theme
bias. These ads were then evaluated using the NOST (10-point evoked
nostalgia) scale developed by Pascal, Sprott and Muehling (2002). Five
different ad campaigns were rated on a ten-statement, five-point likert scale;
ranging from “strongly agree” to “strongly disagree”.
The Cronbach Alpha test determines the reliability of a scale. With results
scoring between 0.7 and 0.9 generally being regarded as acceptable levels, the
0.96 alpha scored for the survey was already above average.
The Cronbach Alpha scores for each of the ads used in this research range
from 0.96 to 0.98. Such high alphas signify exceptional reliability of the NOST
scale when measuring the nostalgic sentiments of the sample.
6.3.2 LEVENE’S TEST
The assumption of homogeneity of variance is that the variance within each of
the populations is equal. The assumptions were checked using Levene’s test;
which is used to check the equality of variances in different samples (Levene,
1960).

Discussion of Results
68
The results indicate that that “population”, with regards to the “financial
services” and “cake flour” ads; and “age”, with regards to the “battery ads” have
a p-value of less than 0.05 and thus violate the assumption of homogeneity of
variance. This indicates that it is unlikely that the differences in the sample
variances would have occurred in a random sample, and their ANOVA results
might not be entirely accurate. In other words, if the ANOVA results indicate a
significant difference in averages between two categories, there might be an un-
accounted factor causing this (for example: unequal group sizes).
6.3.3 ANOVA RESULTS
ANOVA is a test to check whether there is a significant difference in the mean
values of each group or category within a group or category variable. For
example, “gender” has 2 categories (male and female) and the ANOVA test will
establish whether the male average is significantly different from the female
average.
The ANOVA results conclude that there are no significant differences in the
respondents’ sentiments towards the five different adverts across all relevant
“gender” and “population group” categories.
However, in the “age” category, the f-statistics for the financial services, cake
flour and car ads were calculated as being significant at the 5% significance
level. This indicated that there were significant differences in the average values
Discussion of Results
69
for the “financial services”, “cake flour” and “car” adverts, and thus prompted the
need for t-testing.
6.3.4 T-TEST RESULTS
When looking at the individual mean differences between the different
categories, as shown in the table and subsequent graphs, it is clear that the
mean difference in the “45-54” age group is significant with regards to the “cake
flour” ads. What should also be noted is that, although not statistically
significant, the mean differences in the “>54” “car” group and the “45-54”
“financial services” group (highlighted in amber) do differ quite significantly from
the other age groups relating to those ads.
These results indicate in certain situations, as per Hypothesis-1, that the
relevance of nostalgic appeals in advertising does vary depending on the
consumer’s age.

Discussion of Results
70
6.4 HYPOTHESIS - 1
Parametric tests were conducted in order to reject the null hypothesis.
H1: The relevance of nostalgic appeals in advertising varies depending on the
consumer’s age.
H0: The relevance of nostalgic appeals in advertising does not vary depending
on the consumer’s age.
• According to the results of this research, there is sufficient evidence to
reject the null hypothesis.
• It can therefore be concluded that the relevance of nostalgic appeals in
advertising does vary depending on the consumer’s age.
These results are consistent with previous research (Holbrook, 2003). The
graphs (see: Figure 16, 17 & 18) indicate differences in relevance to three of the
ads, by age.
Table 7 highlights the data indicating that with regards to the “cake flour” ads,
the mean difference was most significant in the “45-54” age group. A look at the
Figure 16 however reflects a generally positive trend as age increases. This
could be linked to certain factors. It might have been inferred that this was due
to the nature of the product advertised. Cake flour is hardly an exciting product
and is least relevant to young adults of university going age. However as
consumers progress to ages where they might be involved in family life (and
any associated required baking), the relevance increases. Another inference
was that the style and imagery used in the advertisements was indicative of the
more distant past. With minimal colour used and an almost “vintage” or
“illustrated” style to them, it could be said that they appealed to the personal
nostalgia sentiments of the older respondents (Baker & Kennedy, 1994)
(Goulding, 2001) (Muehling, 2011).
Discussion of Results
71
The other two highlighted areas on Table 7 note that, although not statistically
significant, the mean differences in the “>54” “car” group and the “45-54”
“financial services” group differ quite significantly from the other age groups
when referring to the specific advertisements.
Regarding the “car” ads, relevance also generally increases as the respondents
got older. While it is unlikely that the style of the ads or nature of the product
had much to do with this, the imagery used and specific product might have.
These ads were for a budget vehicle that, after a long, successful history in
South Africa, had recently ceased production. The ads were promoting cost-
saving tips during the recession.
What was inferred here is that the recession is over. The car is no longer
produced. The youth want what is new and “cool” and these ads are no longer
relevant to them. Again, the older respondents find the ad more relevant as it
links to their personal nostalgic sentiment (Baker & Kennedy, 1994) (Goulding,
2001) (Muehling, 2011) as either a car either they or a friend once owned, or
one that they purchased for their children. The only age group to whom these
ads were relevant was “54<”
Finally, the “financial services” ads; which while depicting black-and-white
photograph images, are otherwise not styled to reflect any specific era. The
evoked sentiment is again one of personal nostalgia (Baker & Kennedy, 1994)
(Goulding, 2001) (Muehling, 2011). The copy links the images to the benefits of
perseverance and planning in making long-term investments. Yet the results
indicated the relevance of these ads decreased as the respondents’ age
increased, until the most visible mean difference is reflected in Table 7 at the
“45-54” age group; to whom the ads are least relevant.
It was inferred that this is due largely due to the nature of the product being
advertised. Long-term investing is most important and relevant to consumers
when they are young, as this is when the growth benefits are most appealing. A
long-term investment is far less relevant to a consumer in the later years of their
life. The nature of the advertised industry also points to fact that younger, less
Discussion of Results
72
experienced consumers might trust a seemingly older, more established
company to handle their financial investments rather than a new and unproven
one. The evoked impression of being “older and wiser” is another inferred
reason for holding greater relevance with younger respondents.
6.5 HYPOTHESIS - 2
Parametric tests were conducted in order to reject the null hypothesis.
H1: The relevance of nostalgic appeals in advertising varies depending on the
consumer’s gender.
H0: The relevance of nostalgic appeals in advertising does not vary depending
on the consumer’s gender.
• According to the results of this research, there is insufficient evidence to
reject the null hypothesis.
It can thus be said that insufficient evidence exists to conclude that nostalgic
appeals in advertising vary depending on the consumer’s gender. This finding is
contrary to Holbrook’s (1993) results which concluded that different levels of
receptiveness to nostalgia could indeed be observed between men and women.
6.6 HYPOTHESIS - 3
Parametric tests were conducted in order to reject the null hypothesis.
H1: The relevance of nostalgic appeals in advertising varies depending on the
consumer’s population group.

Discussion of Results
73
H0: The relevance of nostalgic appeals in advertising does not vary depending
on the consumer’s population group.
• According to the results of this research, there is insufficient evidence to
reject the null hypothesis.
It can thus be said that insufficient evidence exists to conclude that nostalgic
appeals in advertising vary depending on the consumer’s population group. No
previous record of research into the relationship between the relevance of
nostalgic appeals and the consumers’ population group were found.

Conclusion
74
7 CONCLUSION
7.1 INTRODUCTION
In Chapter 2, the terms “advertising”, “emotional appeals” and “nostalgic
appeals in advertising” were defined and discussed at length. It was concluded
that advertising be communicated through many different media, but that only
print advertisements would be surveyed in this research.
The research problem was that while South African advertisers seemed
comfortable selling the concept of nostalgic appeals in advertising to their
clients, and then using them to advertise a broad variety of products with
differing target markets, no research was available to indicate whether or not
these target markets were receptive to these adverts. The objective of this
research was to provide a clearer indication as to who in South Africa nostalgic
advertising is relevant; with reference to their age group, gender and population
group.
This paper summarised a sample of the South African population’s responses
and evaluated them to determine whether a relationship existed between the
demographic traits of respondents and the relevance of nostalgic ads to them. A
survey gathered data on their age group, gender and population group before
showing them five South African print advertisements that were deemed by pre-
testing to be nostalgic in nature. A previously published ten-statement, five-point
likert scale (Pascal, Sprott & Muehling, 2002) was then employed to judge
whether respondents were receptive to the evoked nostalgic appeals in the ads.

Conclusion
75
The results indicated that insufficient evidence existed to predict the relevance
of nostalgia in advertising by gender or population group. However, evidence
was found that suggested that the relevance of nostalgia does vary depending
on the consumers’ age.
7.2 LIMITATIONS
Several limitations were however identified in this research:
Sampling method
Snowball sampling was selected as the most appropriate method given the time
and financial limitations experienced by the researcher. However, this method if
utilised over a short time frame results in a somewhat homogenous, biased
sample. This sample cannot then be said to be representative of the population
being studied.
Size
Considering the size of the South African population and the number of
advertisements to which it is exposed on a daily basis, this report can only be
seen as an indicator; not an all-encompassing evaluation. A larger population
sample and larger number of advertisements surveyed would give more
conclusive results.
Conclusion
76
Segmentation criteria
The segmentation criteria selected (age group, gender and population group)
are also only three of many criteria that used by advertisers when determining
their target audience. Depending on the individual campaigns, certain other
criteria, or combinations of criteria might be more relevant.
Media
Selecting only print (magazine or newspaper) advertisements for use in the
survey can also be seen as a possible limitation of this study. Not all brands or
products can be appropriately advertised in print media. The results therefore
cannot be said to be all-encompassing and conclusive when referring to
advertising in general.
7.3 FUTURE RESEARCH
Many of the limitations just discussed however do provide valuable
opportunities for future research.
Bigger sample
Similar research utilising a larger, random sample might provide significantly
different results to those calculated from this research. It is assumed that if
researched, the results would be more representative of the South African
population as well as providing more conclusive links between the relevance of

Conclusion
77
nostalgic appeals in advertising and the demographic variables (age group,
gender and population group) measured.
Contributing factors
Another opportunity lies in that the ads used in this research were classified as
being representative of nostalgic advertisements. What was not classified were
the elements making up those ads; as discussed in the t-test results. There is
an indication that these individual elements might play as much of a, if not a
more significant a role in determining relevance to consumers (Kover, Goldberg
& James, 1995) (Childers and Houston, 1984); than the fact that the ads are
broadly classified as having nostalgic appeal alone.
Other demographic factors
The LSM (living standards measure) criteria utilised by the South African media
provide a multitude of demographic characteristics by which the population can
be classified; over and above age group, gender and population group.
Knowing which of these factors really appeal to which cross-sections of
consumers would undoubtedly provide additional value to an advertiser’s
offering.)
Media by appeals
In the same line of thinking, determining which media best support which
emotional appeals used in advertising would also add significant value.
Conclusion
78
Product categories
Lastly, while representing different product categories, the advertisements used
in this research cannot be said to be all-encompassing of ads in these different
categories. Conducting future research on the relevance of nostalgic appeals in
advertising for specific product categories will undoubtedly supplement the
conclusions already established.
7.4 RECOMMENDATIONS
A primary challenge of marketers is to ensure that their brands go beyond
flashy adverts or striking logos, and to ensure that they consistently create a
positive customer experience that encourages repeat purchase (SDL, 2006). In
communicating to the customer it is essential that marketers find ways to invite
the brand into the customers’ life and provide a non-threatening method of
communication to encourage repeat purchase that will result in increased
profitability (van der Lith, 2007).
Marketers need engaging marketing communications that can influence
customer attitudes and behaviours; thereby increasing sales and customer
loyalty. To achieve success, marketers should strive for deeper customer
insight (Mitchell, 2005).
Nostalgia has been proven to positively influence the relevance of advertising
and brands and to consumers (Braun-LaTour, 2007). The results of this
research further indicate that the relevance of this nostalgia might be able to be

Conclusion
79
further classified in terms of its association to consumer age groups. However,
further research on this topic is required before results can be said to be
conclusive.
Conclusion
80
8 REFERENCES
• Aaker, D & Bruzzone, D (1985). Causes of Irritation in Advertising, Journal
of Marketing, 49(2), 47–57.
• Aaker, D, Stayman, D & Hagerty, M (1986). Warmth in Advertising:
Measurement, Impact, and Sequence Effects, Journal of Consumer
Research, 12(4), 365–81.
• ACA: Association for Advertising and Communication (2004). The future of
the advertising industry. ACA Research Survey, July. Market Support
Associates.
• Ads of the World (2011). Retrieved from:
http://adsoftheworld.com/taxonomy/country/south_africa
• Baker, S & Kennedy, P (1994). Death by Nostalgia: A Diagnosis of
Context-Specific Cases. Advances in Consumer Research, 21. 169–174.
• Baumgartner, H (1992). Remembrance of Things Past: Music,
Autobiographical Memory and Emotion. Advances in Consumer Research,
19. 613–620.
• Bearden, W.O., Ingram, T.N. & LaForge, R.W (1998), Marketing:
Principles & Perspectives, 2nd edition. New York: Irwin McGraw-Hill.
• Bhat, M (2004). Service quality perceptions in banks: A comparative
analysis, Vision – The Journal of Business Perspective, 9, 1, 11-20.
• Braun-LaTour, K (2007). Beyond nostalgia: using childhood memories as
a means to emotionally connect with consumers. International Journal of
Advertising, 2007. 26(3)
• Braun-LaTour, K, LaTour, M & Zinkhan, G (2007). Using Childhood
Memories to Gain Insight into Brand Meaning. Journal of Marketing 71,
April. 45–60.
• Childers, T & Houston, M (1984). Conditions for a Picture Superiority
Effect on Consumer Memory, Journal of Consumer Research, 11(2), 643–
54.
• CIA (2011). CIA: The World Factbook, Retrieved from:
https://www.cia.gov/library/publications/the-world-factbook/geos/sf.html

Conclusion
81
• Cosgrove, J & Sheridan, P (2002). Listen Up, Sucka, the '80s Are Back,
Business Week, August 5, 16.
• Cronbach, L.J (1951). Coefficient alpha and the internal structure of tests.
Psychometrika, 16(3). 297-334
• Davis, F (1979). Yearning for yesterday, A Sociology of nostalgia. New
York: Free press.
• Ford, J & Merchant, A (2010). Nostalgia Drives Donations. Journal of
Advertising Research, December 2010. 450-459.
• Gelb, B & Zinkhan, G (1986). Humor and Advertising Effectiveness after
Repeated Exposures to a Radio Commercial, Journal of Advertising,
15(2), 15–20.
• Goulding, C (2001). Romancing the Past: Heritage Visiting and the
Nostalgic Consumer. Psychology and Marketing, 18. 565–580.
• Halbwachs, M (1992). On Collective Memory. Chicago: University of
Chicago, 46-51.
• Havlena, W.J & Holak, S.L (1991). The good old days: Observations on
nostalgia and its role in consumer behaviour, Advances in consumer
research, 18, ed. R.H. Holman, R.H & Solomon, M.R. 323–9. Provo, UT:
Association for Consumer Research.
• Henthorne, T, LaTour, M & Nataraajan, R (1993). Fear Appeals in Print
Advertising: An Analysis of Arousal and Ad Response, Journal of
Advertising, 22(2), 59-69
• Hirsch, A.R (1992). Nostalgia: A neuropsychiatric understanding.
Advances in Consumer Research, 19(1), 390-395
• Holak, S.L, Matveev, A.V, & Havlena, W.J (2008). Nostalgia in post-
socialist Russia: Exploring applications to advertising strategy. Journal of
Business Research, 61(2). 172-178.
• Holbrook, M.B & Schindler, R (2003). Nostalgic Bonding: Exploring the
Role of Nostalgia in the Consumption Experience. Journal of Consumer
Behavior, 3. 107–127.
• Holbrook, M.B & Schindler, R.M (1991). Echoes of the Dear Departed
Past: Some Work in Progress on Nostalgia, Advances in Consumer

Conclusion
82
Research, Vol. 18. Rebecca H Holman and Michael R Solomon, eds.,
Provo, UT: Association for Consumer Research, 330-333
• Holbrook, M.B & Schindler, R.M (1996). Market segmentation based on
age and attitude toward the past: concepts, methods, and findings
concerning nostalgic influences on customer tastes. Journal of Business
Research, 37, September. 27–39.
• Holbrook, M.B (1993). Nostalgia and consumption preferences: Some
emerging patterns of consumer tastes. Journal of Consumer Research,
20(2). 245-256.
• Kassarjian, H.H (1971). Personality and consumer behavior: a review.
Journal of Marketing Research, 8, November. 409–418.
• Keller, K (1993). Conceptualising, measuring and managing customer-
based brand equity. Journal of Marketing, 57(1). 1-22.
• Kover, A, Goldberg, S & James, W (1995). Creativity vs. Effectiveness?
An Integrating Classification for Advertising, Journal of Advertising
Research, 35(6), 29–40.
• Lee, R.M (1993). Doing Research on Sensitive Topic. London: Sage
• Levene, H (1960). Robust tests for equality of variances, Stanford
University Press. 278–292
• Maggs, J (2006). Time to consolidate. Financial Mail Adfocus, May, 12,
109.
• Marchegiani, C & Phau, I (2011). The value of historical nostalgia for
marketing management, Marketing Intelligence & Planning, 29, 2, 2011,
108-122.
• Meuhling, D & Sprott, D (2004). The Power of Reflection, Journal of
Advertising, Fall 2004, 33(3). 25-35.
• Meyers, O (2001), The engine’s in the front, but its heart’s in the same
place: a study of the use of nostalgia in advertising, Association for
Education in Journalism and Mass Communication Conference,
Washington, DC.
• Mitchell, A (2005). The curse of brand narcissism, Journal of Brand
Management, 13(1). 4-10.

Conclusion
83
• Moore, D, Harris, W & Chen, H (1995). Affect Intensity: An Individual
Difference Response to Advertising Appeals, The Journal of Consumer
Research, Vol. 22, 2, 154-164.
• Moriarty, S.E (1991). Creative Advertising Theory and Practice (2nd
Edition). Englewood Cliffs, New Jersey: Prentice-Hall.
• Muehling, D (2011). The relative influence of advertising-evoked personal
and historical nostalgic thoughts on consumers’ brand attitudes, Journal of
Marketing Communications, 1-16.
• Naughton, K & Vlassic, B (1998). The Nostalgia Boom, Business Week,
March 23, 58-64.
• Pascal, V, Sprott, D & Muehling, D (2002). The Influence of Evoked
Nostalgia on Consumers’ Responses to Advertising: An Exploratory Study,
Journal of Current Issues and Research in Advertising, 24(1). 39-49.
• Reisenwitz, T, Ivey, R & Cutter, B (2004). Nostalgia Advertising and the
Influence of Nostalgia Proneness. Marketing Management Journal, Fall
2004.
• Richards, J & Curran, C (2002). Oracles on “Advertising”: Searching for a
Definition, Joumal of Advertising,Volume 31, Number 2, Summer 2002.
63-77.
• Saunders, M, Lewis, P & Thornhill, T (2009). Research methods for
business students, 5th Edition. FT Prentice Hall, Pearson Education.
• SDL International (2006). Guarding the Brand: A Report from the
Economist Intelligence Unit. The Economist.
• Sedikides, C, Wildschut, T, Arndt, J & Routledge, C (2008). Nostalgia.
Past, Present & Future, Current Directions in Psychological Science, 17, 5,
304-307.
• Seth, N, Deshmukh, S & Vrat, P (2005). Service quality models: A review,
International Journal of Quality and Reliability Management, 22, 9, 913-
949.
• Severn, J, Belch, G & Belch, M (1990). The Effects of Sexual and
Nonsexual Advertising Appeals and Information Level on Cognitive
Processing and Communication Effectiveness, Journal of Advertising,
19(1), 14–22.

Conclusion
84
• Statistics South Africa (2011). Population Statistics, Retrieved from:
http://www.statssa.gov.za/timeseriesdata/pxweb2006/Dialog/varval.asp?m
a=Mid-year population estimates by population group, gender, age group
andyear&ti=Table%3A+Mid%2Dyear+population+estimates+by+populatio
n+group%2C+gender%2C+age++group+and+year%2E+&path=../Databas
e/South%20Africa/Mid-Year%20 Estimates/&lang=1
• Stern, B (1992). Historical and personal nostalgia in advertising text: The
fin de siecle effect, Journal of Advertising, 31, 4, 11–22.
• Sullivan, E (2009). Believe in Yesterday. Marketing News 45, 15. 8.
• Van der Lith, T (2007). The role of custom publishing in building customer-
based brand equity, University of Pretoria.
• Verma, S (2009). Do all advertising appeals influence consumer purchase
decision: An exploratory study, Global Business Review 2009. 10:33.
Sage.
• Weiers, R.M (2008). Introductory Business Statistics, 7th Edition. South-
Western, Cengage Learning.
• Wildschut, T, Sedikides, C, Arndt, J & Routledge, C.D. (2006). Nostalgia:
Content, triggers, functions. Journal of Personality and Social Psychology,
91, 975–993.
• Zikmund, W.G (2003). Business Research Methods. Ohio, USA:
Thompson South-Western.

Appendix
85
9 APPENDIX
9.1 SURVEY CONSENT
THANK YOU for clicking on the link and electing to participate in my MBA
research assignment on the Relevance of Nostalgia in Advertising. Answering
all the questions in the survey will supplement the information required for this
thesis.
This survey should only take around 10 minutes to complete.
In proceeding, you consent to the following:
- You are 18 years or older
- You are a citizen or resident of South Africa
- You are completing this survey voluntarily and can withdraw at any time
without penalty
- No names will be recorded and the results will in no way link back to you
If you have any concerns please contact me or my supervisor; details listed
below:
RESEARCHER:
Donovan Pieterse, MBA Student, GIBS, [email protected]
SUPERVISOR:
Nicola Kleyn, Senior Lecturer, GIBS, [email protected]
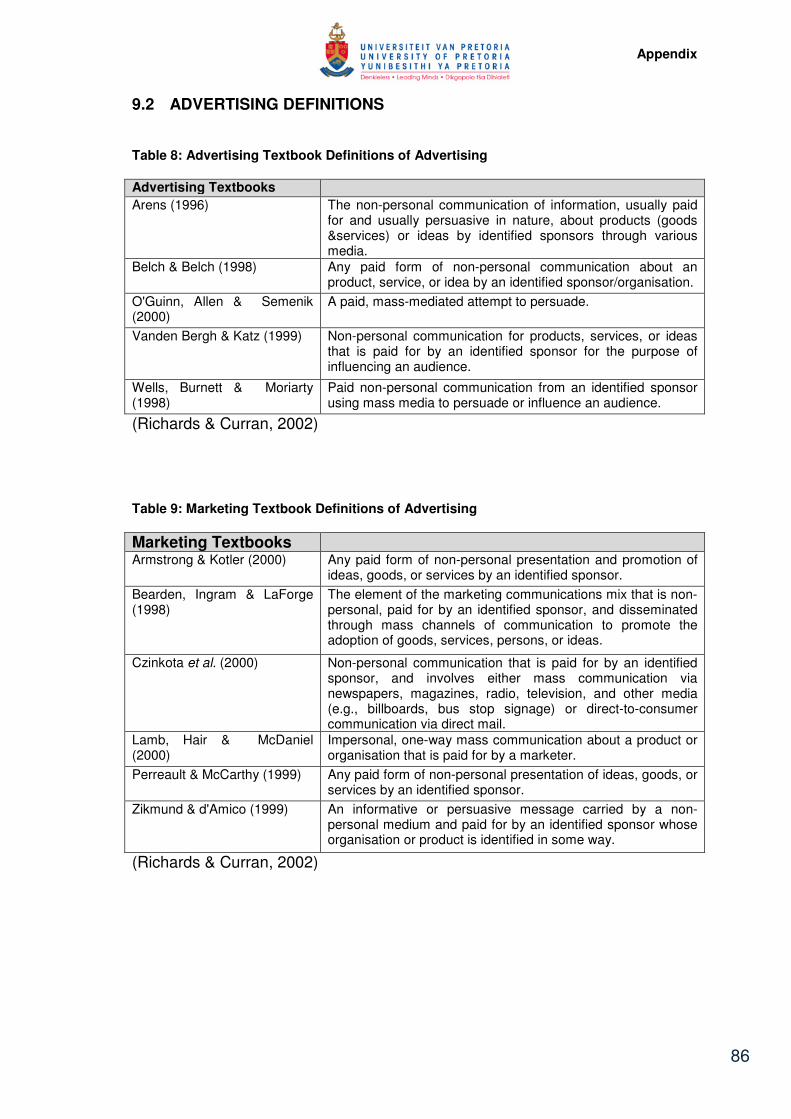
Appendix
86
9.2 ADVERTISING DEFINITIONS
Table 8: Advertising Textbook Definitions of Advertising
Advertising Textbooks
Arens (1996) The non-personal communication of information, usually paid for and usually persuasive in nature, about products (goods &services) or ideas by identified sponsors through various media.
Belch & Belch (1998) Any paid form of non-personal communication about an product, service, or idea by an identified sponsor/organisation.
O'Guinn, Allen & Semenik (2000)
A paid, mass-mediated attempt to persuade.
Vanden Bergh & Katz (1999) Non-personal communication for products, services, or ideas that is paid for by an identified sponsor for the purpose of influencing an audience.
Wells, Burnett & Moriarty (1998)
Paid non-personal communication from an identified sponsor using mass media to persuade or influence an audience.
(Richards & Curran, 2002)
Table 9: Marketing Textbook Definitions of Advertising
Marketing Textbooks Armstrong & Kotler (2000) Any paid form of non-personal presentation and promotion of
ideas, goods, or services by an identified sponsor.
Bearden, Ingram & LaForge (1998)
The element of the marketing communications mix that is non-personal, paid for by an identified sponsor, and disseminated through mass channels of communication to promote the adoption of goods, services, persons, or ideas.
Czinkota et al. (2000) Non-personal communication that is paid for by an identified sponsor, and involves either mass communication via newspapers, magazines, radio, television, and other media (e.g., billboards, bus stop signage) or direct-to-consumer communication via direct mail.
Lamb, Hair & McDaniel (2000)
Impersonal, one-way mass communication about a product or organisation that is paid for by a marketer.
Perreault & McCarthy (1999) Any paid form of non-personal presentation of ideas, goods, or services by an identified sponsor.
Zikmund & d'Amico (1999) An informative or persuasive message carried by a non-personal medium and paid for by an identified sponsor whose organisation or product is identified in some way.
(Richards & Curran, 2002)
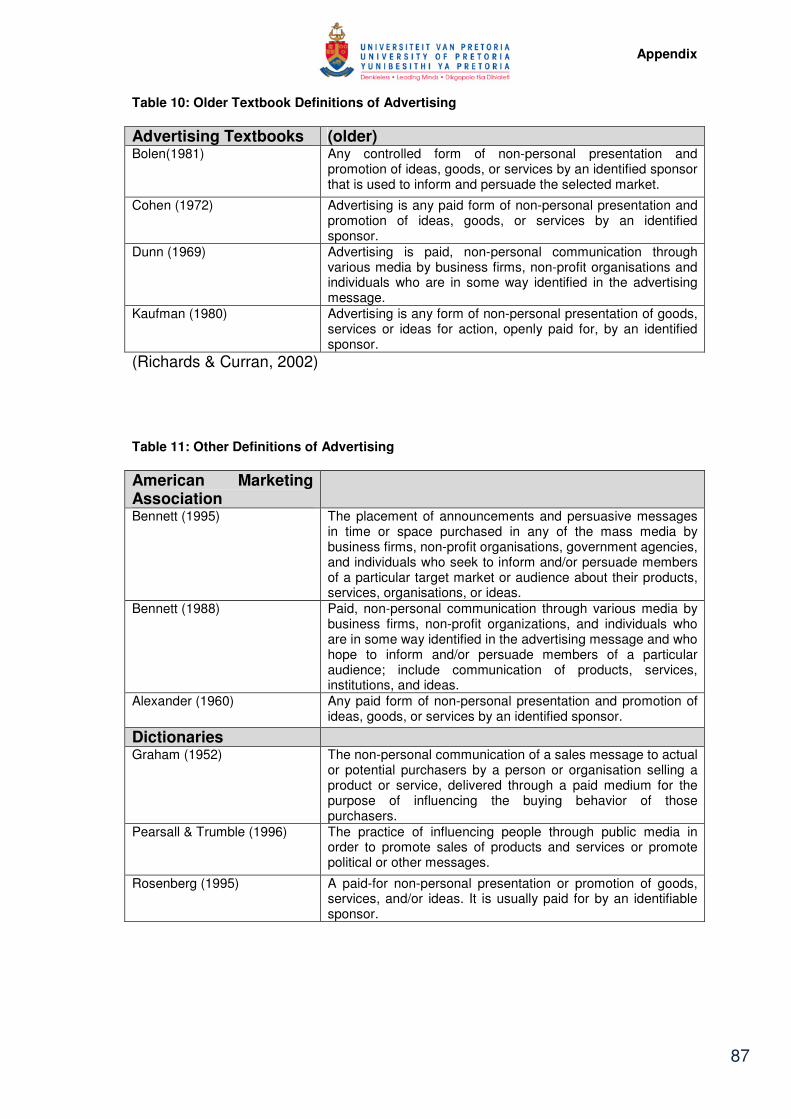
Appendix
87
Table 10: Older Textbook Definitions of Advertising
Advertising Textbooks (older) Bolen(1981) Any controlled form of non-personal presentation and
promotion of ideas, goods, or services by an identified sponsor that is used to inform and persuade the selected market.
Cohen (1972) Advertising is any paid form of non-personal presentation and promotion of ideas, goods, or services by an identified sponsor.
Dunn (1969) Advertising is paid, non-personal communication through various media by business firms, non-profit organisations and individuals who are in some way identified in the advertising message.
Kaufman (1980) Advertising is any form of non-personal presentation of goods, services or ideas for action, openly paid for, by an identified sponsor.
(Richards & Curran, 2002)
Table 11: Other Definitions of Advertising
American Marketing Association
Bennett (1995) The placement of announcements and persuasive messages in time or space purchased in any of the mass media by business firms, non-profit organisations, government agencies, and individuals who seek to inform and/or persuade members of a particular target market or audience about their products, services, organisations, or ideas.
Bennett (1988) Paid, non-personal communication through various media by business firms, non-profit organizations, and individuals who are in some way identified in the advertising message and who hope to inform and/or persuade members of a particular audience; include communication of products, services, institutions, and ideas.
Alexander (1960) Any paid form of non-personal presentation and promotion of ideas, goods, or services by an identified sponsor.
Dictionaries Graham (1952) The non-personal communication of a sales message to actual
or potential purchasers by a person or organisation selling a product or service, delivered through a paid medium for the purpose of influencing the buying behavior of those purchasers.
Pearsall & Trumble (1996) The practice of influencing people through public media in order to promote sales of products and services or promote political or other messages.
Rosenberg (1995) A paid-for non-personal presentation or promotion of goods, services, and/or ideas. It is usually paid for by an identifiable sponsor.
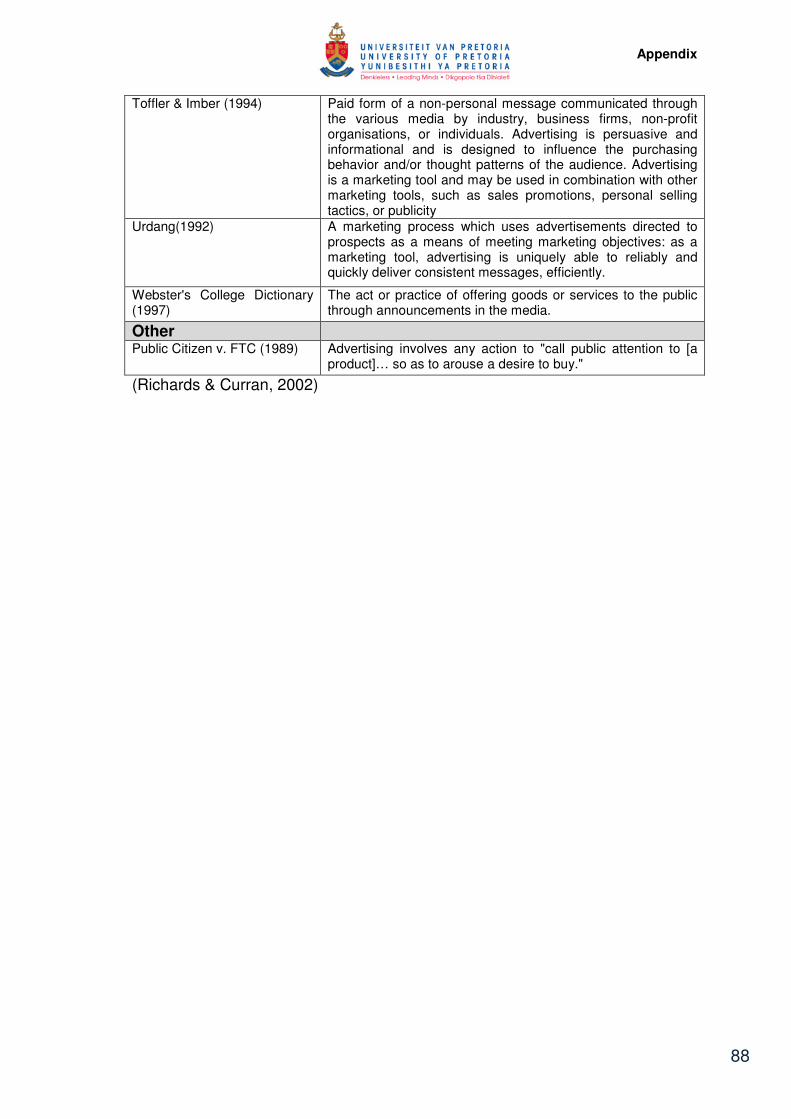
Appendix
88
Toffler & Imber (1994) Paid form of a non-personal message communicated through the various media by industry, business firms, non-profit organisations, or individuals. Advertising is persuasive and informational and is designed to influence the purchasing behavior and/or thought patterns of the audience. Advertising is a marketing tool and may be used in combination with other marketing tools, such as sales promotions, personal selling tactics, or publicity
Urdang(1992) A marketing process which uses advertisements directed to prospects as a means of meeting marketing objectives: as a marketing tool, advertising is uniquely able to reliably and quickly deliver consistent messages, efficiently.
Webster's College Dictionary (1997)
The act or practice of offering goods or services to the public through announcements in the media.
Other Public Citizen v. FTC (1989) Advertising involves any action to "call public attention to [a
product]… so as to arouse a desire to buy."
(Richards & Curran, 2002)

Appendix
89
9.3 SURVEY ADVERTISEMENTS
Figure 19: Financial Services Ads Used in Survey
(Ads of the World, 2011)
Figure 20: Battery Ads Used in Survey
(Ads of the World, 2011)
Figure 21: Toy Ads Used in Survey
(Ads of the World, 2011)

Appendix
90
Figure 22: Cake Flour Ads Used in Survey
(Ads of the World, 2011)
Figure 23: Car Ads Used in Survey
(Ads of the World, 2011)