Embed Size (px)
Citation preview

Pietro Modiano - Deputy CEO, Head of Wholesale Banking Division
European Road Show
2nd-4th April 2002
UNICREDITO ITALIANOWholesale Banking Division
Dario Frigerio - CEO, Pioneer Global AM

2
Agenda
UCI’s Wholesale Banking Division - P. Modiano
Investment Banking: UBM
Overview & Business Model
The Risk/Return Profile
The Business Lines
Outlook 2002-2004
Pioneer Global Asset Management
Overview & 2002-2004 strategy
Operating Divisions
Conclusion

3
Italian Banking
Wholesale Banking
New Europe Banking
WHOLESALE BANKING IN UCI’S ORGANISATIONAL CHART

4
Italian & New Europe Banking
Indirect UBM + TLUBM + TL Pioneer
2001 REVENUE CONTRIBUTION*
A POWERFUL CONTRIBUTION TO THE GROUP’S DIVERSIFICATION
*Net of Corporate Centre negative contribution
GEOGRAPHIC DIVERSIFICATION
30% of Pioneer’s revenues generated out of Italy
REVENUE DIVERSIFICATION
5.8%2.0% 4.7%
87.5%

5
Agenda
UCI’s Wholesale Banking Division
Investment Banking: UBM
Overview & Business Model
The Risk/Return Profile
The Business Lines
Outlook 2002-2004
Pioneer Global Asset Management
Overview & 2002-2004 strategy
Operating Divisions
Conclusion

6
THE CONTEXT
UNSATISFIED DEMAND IN ITALY OF INVESTMENT BANKING PRODUCTS & SERVICES
AS A CONSEQUENCE OF:
Global players targeting only large corporate customers & big deals
Local players unprepared and in a phase of transition
UBM FILLS THE GAP...

7SNOWBALL EFFECT
Successful recruitment
Immediate self-financing
An attractive projectStart-upStable managementUniCredito brand & customer baseGood strategy
Good priority selectionFirst corporate and retail derivatives ... ...then corporate finance
…leveraging on:
THE CONTEXT

8
THE CHALLENGE
The best Italian engineering and manufacturing center of high value added financial products (primary capital markets, derivatives, corporate finance)
The best market provider for the Group’s network
The most dynamic and high quality merchant bank for Italian large & mid-corporate customers
BEING RECOGNISED AS:

9
OUR ANSWER:UBM BUSINESS MODEL
Global quality in terms of:
Domestic focus
Flexible and dynamic approach to business, organised by segments:
product innovation (SPIN, Corporate derivatives, Kilovar®)
time to market risk management
mid corporate institutional
large corporate
retail

10
UBM IDENTITY CARD
CONCEIVED IN 1997 BORN AS CREDITO ITALIANO DIVISION 1998 BORN AS A BANK 2000 UBM
2001 TLab FY 01 N. OF EMPLOYEES 566 FY 01 REVENUES 601.3 (mln
Euro) FY 01 ROE 55% FY 01 C/I Ratio 35%
INVESTMENT BANKING
SALES & TRADING
UCI’s investment bank turning out:
Complex financial instruments marketed to corporate and institutional customers
Branded derivatives and services (such as TLX) for the retail market through TradingLab
3 BUSINESS LINES 1 SUBSIDIARY (100%)

11
KEY HIGHLIGHTS
1998 1999 2000 2001
278.5391.2
444.0
601.3
165.5
37%35%
Operating Income
Total Revenues
Operating Costs**
Cost Income ratio
+40.5%
+35%
210.1+27%
1998 1999 2000 2001
1998 1999 2000 2001
1998 1999 2000* 2001
67%
55%
ROE
2000 2001***
*** Euro 156 mln Capital increase in 2001
322.7
132.1
101.363.8
68.3
231.4
31%
48%
** Estimates for 1998 & 1999
* First year of full operation
(Euro mln)

12
2000 % ch.2001
HIGH GROWING REVENUES, COSTS UNDER CONTROL
C/I Ratio at excellent level (35%), despite significant investments and increased headcount (566, +181 vs. 2000)
Tot. Staff Costs: +48%. Cost per employee: +1%
High growing, recurring, non-cyclical and stress-proof Trading Profits generated by:
CorporateLab TradingLab Institutional deriv. Securities
business
By
natu
reB
yb
usin
ess lin
e
Net Interest margin
Trading profits
Total revenues
Net Commissions
35.0
357.0
52.0
n.s.
+47
+44
0.4
525.8
75.1
444.0 +35601.3
Staff costs
Operating income
Net provisions & other costs
Tax expenses
Other costs
-62.3
278.5
-16.7
155.8
-106.0
-103.2
+48
+40
+22
+39
+46
+14
-92.1
391.2
-20.3
216.6
-154.3
-118.0
Net income
Sales & Trading (incl.Institut.Deriv.)
Investment & Corporate Banking
196.9
114.9
38.5
+1
+14
+34
198.7
130.7
51.4
CorporateLab (Corporate Derivatives) 93.7 +135220.5
TradingLab (Retail Derivatives)
(Euro mln)

13
LEADING INVESTMENT BANK IN ITALY BY REVENUES AND NET INCOME
(*) Year end figures as at June, 30th 2001(**) Excluding IMIWeb Bank
2001 REVENUES(Euro mln)
601.3
UBM+TLAB Mediobanca
513.3 (*)
Banca IMI
198 (**)
Interbanca
305
UBM 403
TL198
2001 NET INCOME(Euro mln)
216.6
151.2 (*)
31 (**)
116
UBM+TLAB Mediobanca Banca IMIInterbanca

14
Agenda
UCI’s Wholesale Banking Division
Investment Banking: UBM
Overview & Business Model
The Risk/Return Profile
The Business Lines
Outlook 2002-2004
Pioneer Global Asset Management
Overview & 2002-2004 strategy
Operating Divisions
Conclusion

15(1) Risk Adjusted P&L = Average Daily P&L/Standard Deviation of Daily P&L
UBM AND TRADINGLAB: A TRACK RECORD OF SOLIDITY AND STRONG GROWTH
Solid Economic Model Not only the 35% growth of
Average daily Trading Net Revenues achieved in 2001 is confirmed in the first months of 2002...
…but also the Risk Adjusted P&L shows a similar growing pattern rising from Euro 1.1 mln in 2000 to Euro 1.3 mln in 2001 and to Euro 1.8 mln in 2002
The shift to the right of the distribution curves of the daily P&Ls measures the growth of UBM
The asymmetry toward the right of the distribution of P&Ls shows the prevalence of positive results
2001
1.512.04
2000
+35%
Euro mln
Average daily Trading Net Revenues
and Risk Adj P&L(1)
Jan-Feb 2002
3.86+89%
UBM + TL Daily P&L distribution
0%
5%
10%
15%
20%
25%
-4.00
-3.20
-2.40
-1.60
-0.80
0.00
0.80
1.60
2.40
3.20
4.00
4.80
5.60
6.40
7.20
8.00
Daily P&L
Fre
qu
ency
1998 1999 2000 2001
UBM + TL Daily P&L distribution
0%
5%
10%
15%
20%
25%
-4.00
-3.20
-2.40
-1.60
-0.80
0.00
0.80
1.60
2.40
3.20
4.00
4.80
5.60
6.40
7.20
8.00
Daily P&L
Fre
qu
ency
1998 1999 2000 2001
1.11.3
1.8

16
Limited impact of bad market conditions: non-correlation between revenue sources (corporate derivatives vs. retail derivatives)
LOW CORRELATION WITH MARKET TRENDS AND ...
… ABSENCE OF OVERSHOOTING IN SITUATIONS OF EXTREME VOLATILITY
Extreme market movements do not affect P&L
Extreme movements
-5
-3
-1
1
3
5
7
-8% -6% -4% -2% 0% 2% 4% 6% 8%
MIB30 - Returns
Dai
ly P
&L
-5
-3
-1
1
3
5
7
-8% -6% -4% -2% 0% 2% 4% 6% 8%
MIB30 - Returns
Dai
ly P
&L
Correlation between revenues sources and market
-0.5
0.0
0.5
1.0
1.5
2.0
2.5
3.0
3.5
4.0
4.5
weeks
Dai
ly a
vg P
&L
on w
eekl
y ba
sis
-
10,000
20,000
30,000
40,000
50,000
60,000
Dai
ly M
IB30
avg
val
ue o
n w
eekl
y ba
sis
Logarithmic interpolated curves
Mib30 Index Corporate Derivatives revenues Retail Derivatives revenues

17
2001 Average daily VAR(1)
4.3% down vs 2000 (Euro 4.4 mln vs Euro 4.6 mln)
11 Trading days with negative P&L before September 11th; 16 after September 11th; no negative daily P&Ls in 2002 up to end of February
No negative outliner
RESILIENCE TO MARKET STRESS PROVED BY STABILITY OFPOSITIVE DAILY P&Ls FROM TRADING ACTIVITIES
UBM+TL Daily VAR(1) and P&L (Jan. 2001 - Feb. 2002)
Euro mln
UB
M+
TL D
aily V
AR
an
d P
&L
Daily P&L VaR
(1)Figure relates to UBM and TL combined; calculation made with a 98-99% asymmetric double tail confidence interval. P&L net of accounting adjustments as of 31.12.2001
More and more efficient use of VaR Channel: Avg Daily P&L / Avg Daily VaR Ratio from 17% in 1999 to 23% in 2001
Avg Daily P&L / Avg Daily VaR
21%
1999 2000 2001
23%
17%
-8.0
-6.0
-4.0
-2.0
0.0
2.0
4.0
6.0
8.0
-8.0
-6.0
-4.0
-2.0
0.0
2.0
4.0
6.0
8.0
P&L without end of year devaluations

18
EXCELLENT QUALITY IN PROCESS CONTROL...
Focus on the role of either internal or external players of the process
Focus on key control activities supported by detailed technical documentation
Focus on correlation between business process, support process, control and administrative process
… AS WELL AS IN RISK CONTROLS (1)
Distinctive skills High-profile team
Proprietary product development
In house development of sophisticated risk-management instruments and value-added products
Risk Management tools Proprietary pricing models Proprietary VaR engine On line real-time calculation
(1) See Annex for a flowchart example
Low volatility of trading profits Low cyclical variance
Sustainability

19
Agenda
UCI’s Wholesale Banking Division
Investment Banking: UBM
Overview & Business Model
The Risk/Return Profile
The Business Lines
Outlook 2002-2004
Pioneer Global Asset Management
Overview & 2002-2004 strategy
Operating Divisions
Conclusion
20
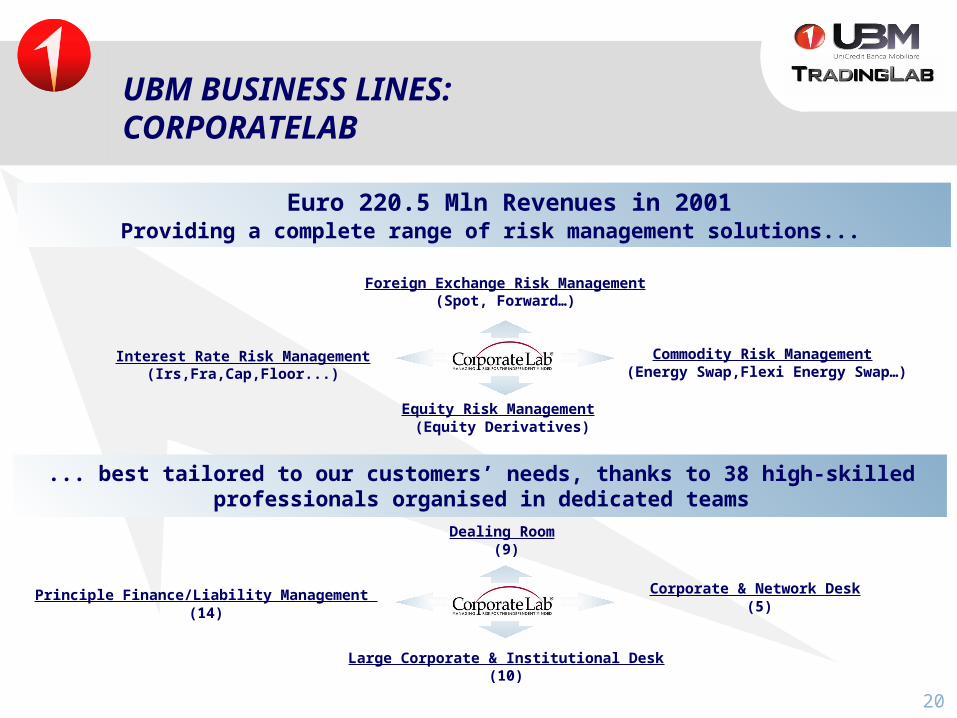
UBM BUSINESS LINES: CORPORATELAB
Providing a complete range of risk management solutions...
Equity Risk Management (Equity Derivatives)
Foreign Exchange Risk Management (Spot, Forward…)
Commodity Risk Management (Energy Swap,Flexi Energy Swap…)
Interest Rate Risk Management (Irs,Fra,Cap,Floor...)
... best tailored to our customers’ needs, thanks to 38 high-skilled professionals organised in dedicated teams
Large Corporate & Institutional Desk (10)
Principle Finance/Liability Management (14)
Corporate & Network Desk (5)
Dealing Room (9)
Euro 220.5 Mln Revenues in 2001

21
Innovation, pricing, sale and management of risk related to derivatives products for corporate customers
Italian leader in liability management for middle-market companies and public sector entities
More than 4,000 repeat customers served through UCI network
More than 250 key customers directly managed
CORPORATELAB: THE REVENUE STREAM
(*) Management accounts for 1998 and 1999
NET REVENUES (*)
(Euro mln)
1998
35.2
50.4
93.7
1999 2000
CAGR + 84%
220.5
2001
350-400
2004

22
UCI has relationships with more than 80,000 corporate customers in the Italian market, representing more than 50% of the whole system financing requirements. Customers will rise up to 92,000 in 2004 thanks to the new Corporate Bank (S3 Project)
The upside potential for CorporateLab is represented by more than 35,000 companies with revenues higher than Euro 5 mln
2004 target is to reach 10% of total UCI’s corporate customers, moving from 4,000 to more than 9,200
CORPORATELAB: UPSIDE POTENTIAL
2001
4,000
80,000
9,200
92,000
2004
CLab UCI CLab UCI
Corporate Customers +15%
+130%
~35,000S>5 Euro
mln
~45,000S<5 Euro
mln
~40,000S>5 Euro
mln
~52,000S<5 Euro
mln
~2,600S>5 Euro
mln~1,400
S<5 Euro mln
~2,800S<5 Euro
mln
~6,400S>5 Euro
mln
The new Corporate Bank will determine an increased focus on relationships with selected growth of customers’ portfolio and a rise in specialization and sales force training
New product development (e.g. QES)
Development of the same distribution model in New Europe

23
CORPORATELAB: BUSINESS DIVERSIFICATION
Leader in Asset & Liability Management for domestic Public Sector Entities and Institutions
110 mandates
131 deals
More than Euro2 bn notional
NEW PRODUCTS... ... & NEW MARKETS
Quality Energy Solutions: the first Italian reality in Energy Risk Management
Risk Management
Hedging
Consulting
Oil
Natural Gas
Electric Power

24
INVESTMENT & CORPORATE BANKING: THE MODEL
INTEGRATION OF LENDING ACTIVITY AND CORPORATE FINANCE: A UNIQUE MODEL IN ITALY
(A small JP Morgan-Chase)
Corporate Banking
Corporate FinanceEquity Capital Market
Structured Finance
Merger & Acquisitions
Corporate Lending
Fixed Income Origination & Syndication
Investment Banking
Relationship Management Euro 51.4 mln
Revenues in 2001
57 Professionals, of which 30 hired in 2001

25
2H01: UBM assumed the governance of the relationships with UCI’s Large Corporate customers (Revenues exceeding Euro 250 mln)
Direct Structured Finance activity
Transactional services and loans through UCI’s network
Euro 19.4 mln revenues, mainly from Syndication Financing (leading role in the most significant deals in Italy)
UCI’s network profitability up to 28%, with stable amount of outstanding loans
Strategic goals: leveraging on UBM’s capabilities and customer understanding to reduce plain vanilla loans of the whole UCI Group and to increase Corporate finance, Leverage finance and M&A Activities
INVESTMENT & CORPORATE BANKING: FOCUS ON LARGE CORPORATE

26
EQUITY
Fourth-ranking among Italian intermediaries in domestic equity capital market
Leadership in STAR segment (small-to mid-cap companies on MTA)
FIXED INCOME
First position in both Eurobond and all currency bookrunner rankings
Top ranking specialist in the Italian Government Bond market and specialist in French Treasury Bonds
4.5% mkt share in MTS and 3.6% mkt share in Euro-MTS
RANKING FIRST IN FIXED INCOME AMONG ITALIAN PEERS, TOP POSITION IN THE EQUITY SEGMENT
Giacomelli
€37 mlnIPO2001
Joint Global Coordinator&
Sponsor
BPCI
€365 mlnSecondary Offering
2001Lead Manager
De Longhi
€128 mlnIPO2001
Joint Global Coordinator&
Sponsor
due 2021
Joint Bookrunner
EUR 215,772,000
5.3% NotesFloating Rate Notes
11% Notes
Joint Bookrunner
PLZ 100,000,000
due 2002 due 2005
Joint Bookrunner
EUR 1,500,000,000
Floating Rate Notes Callable
EUR 500,000,000
6,80% Notes
due 2008
Joint Bookrunner
EUR 300,000,000
8.364% Notes Subordinated Tier I
Perpetual
Joint Bookrunner
BANCA POPOLARE DIBERGAMO
CREDITO VARESINO
C
Joint Bookrunner
EUR 1,000,000,000
Subordinated LT II
due 2011 6% Notes
Floating Rate Notes NC5

27
UBM BUSINESS LINES: SALES & TRADING
Euro 130.7 mln Revenues in 2001Generated minimising proprietary trading by 147 professionals organised
in a traditional market-oriented structure
Government Bonds
Debt Syndication
Spread products
Repo Desk
Emerging Markets
Forex & Treasury
Research
Derivatives &
Structured products
Fixed Income
Sales/Trading
Old style options
Institutional sales
Stock lending
Foreign Markets
Research
Equity
Derivatives &
Structured products
Prime Brokerage

28
UBM BUSINESS LINES: TRADINGLAB - THE SUBSIDIARY FOR RETAIL DERIVATIVES
Euro 198.7 mln Revenues in 2001
Covere
d
Warr
an
ts
Ben
ch
mark
s
Revers
e
Con
vert
ible
s
Eq
uit
y-L
inked
B
on
ds
Oth
er
Instr
um
en
ts
TLXKILOVAR®
TRADINGLAB.COMCUSTOMER SERVICE & TRADINGLAB & MY MONEY
engineering, producing and distributing innovative financial products and services dedicated to
131 professionals
Retail Customers

29
Italian leader in Covered Warrants, with 50% mkt share and 1,924 listed instruments as at the end of 2001
880 Covered Warrants listed on Stuggart Exchange
More than Euro 4.5 bn Derivative-linked bond issues
1,558 financial instruments listed on TLX® with a daily trading volume up to Euro 22 mln and 1,900 transactions
TRADINGLAB: THE BUSINESS TREND
… DEVELOPMENT OF A NEW DISTRIBUTION MODEL: TRADINGLAB NETWORK
From a domestic to an European player (focus on countries with similar market features: Germany, France, UK, Benelux, Spain)
Low cost of expansion: centralised and automatic operations (Milan); mainly advertising costs
Opening of TLX® shareholders’ capital to a network of partner banks
47% of 2004 total revenues from non-captive distribution channels
Selling structured products & equity linked notes in the USA through TradingLab USA Inc. (15% of 2004 total revenues)
STABLE MARKET SHARE DESPITE STRONGER
COMPETITION ...
30
Agenda
UCI’s Wholesale Banking Division
Investment Banking: UBM
Overview & Business Model
The Risk/Return Profile
The Business Lines
Outlook 2002-2004
Pioneer Global Asset Management
Overview & 2002-2004 strategy
Operating Divisions
Conclusion

31
2001-2004 % ch. by business lines
•CORPORATELAB +82%
•INVEST.& CORP.BK. +164%
•SALES & TRADING +76%
•TRADINGLAB +68%
OUTLOOK 2002-2004
2001 2002 2004Total revenues
+26%
601 738
1173
+23%
C/I Ratio
+28%
EBITDA
2001 2002 2004
412495
805
2001 2002 2004
35% 36% 35%
RARORAC
+28%
2001 2002 2004
194
231
378
2001 2002 2004
66% 59% 64%
EVA
+20% +19%
(Euro mln)
02-04CAGR
01-02y/y % ch.

32
Agenda
UCI’s Wholesale Banking Division
Investment Banking: UBM
Overview & Business Model
The Risk/Return Profile
The Business Lines
Outlook 2002-2004
Pioneer Global Asset Management - D. Frigerio
Overview & 2002-2004 strategy
Operating Divisions
Conclusion
33
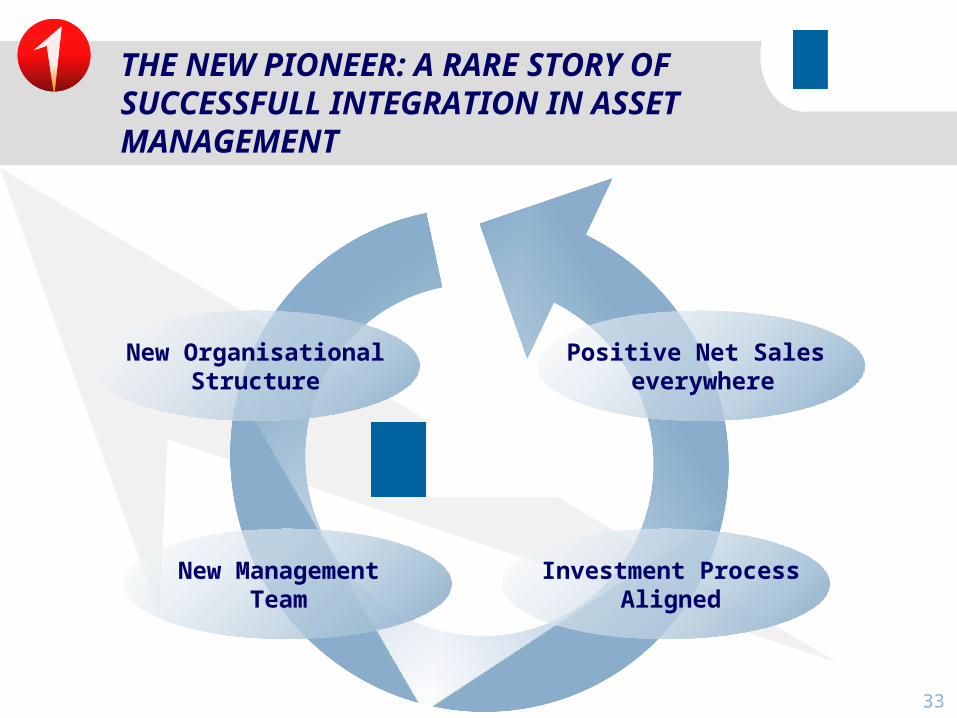
New ManagementTeam
Investment ProcessAligned
Positive Net Sales everywhere
THE NEW PIONEER: A RARE STORY OF SUCCESSFULL INTEGRATION IN ASSET MANAGEMENT
New Organisational Structure

34
Operations
Pioneer Global AssetManagement
NEW ORGANISATIONAL STRUCTURE ...
InvestmentsDistribution
Audit
Risk Management
Global Finance
Strategic PlanningCompliance
New Europe
Italy US Intl. Boston
Milan Dublin
Singapore
181 9766
Total number of employees: 1,677(as at 28 February 2002)
56 470 26668 22353 9
17 137
34
Holding Company
New Europe
Italy US Intl.

35
PIONEER GLOBAL ASSET MANAGEMENT
PIONEER USA
PIONEER INTERNATIONAL
... AND NEW TOP QUALITY MANAGEMENT WITH PREVIOUSSUCCESS STORIES
Robert DeNormandie
Daniel T. Geraci
William F. O’Grady
Richard Sardelli
Osbert M. Hood
Steven Graziano
Matteo Perruccio
Avril Ellis
Dominik Kremer
Steve Philips
Edmund Lacis
CFO
President and CEO
Head of Sales
Head of Marketing
COO
Head of Business Development
Head of International Sales and Distribution
Head of Marketing
General manager Germany, Austria, Switzerland
Head of Americas Sales and Distribution
Head of Sales and Distribution Asia
PWC
Fidelity Investments
Fidelity Investments
Fidelity Investments
John Hancock
Pioneer
American Express
Norwich Union and Henderson
Fidelity Investments
EDF Man Invest.
Janus
From
From
From

36
A FULLY INTEGRATED, RESEARCH BASED, GLOBAL INVESTMENT PROCESS ...
BUY DISCIPLINES Define Investment
case What is discounted? Stock, sector,
country weight
Active Portfolio
Management
SELL DISCIPLINES Target price reached Story changes Sector view/macro
environment changes
Better opportunities
Style Focussed
Stock Screening
Bond Valuations
Asset Allocation Model- Sector Allocation
Style Neutral
QUANTITATIVE RESEARCH
FUNDAMENTALRESEARCH
Strategy, ability to implement
Competitive positioning Mgmt assessment Financial strength, Cash generation
Valuation multiples
GROWTH/VALUE
GEOGRAPHIC
LARGE, MID & SMALL CAP
SEPARATE/WRAPSACCOUNTS
INSTITUTIONAL PORTFOLIO
RISK CONTROL
Process and Product
STRUCTURED

37
US High Yield Fund ranking 1st in one year and 3 year rankings
Strategic Income top decile over 2 years
... RESULTING IN TOPPERFORMING FLAGSHIP FUNDS IN KEY SEGMENTS
US Equities
Pioneer Fund outperformed the S&P over each 10 year period since
1928 and is top decile over the last 5 years
Equity Income is top quartile over the last 5 years
Small Cap Value is top quartile over the last 3 years (inception)
European Equities
All 5 Luxembourg Funds are between first decile and first quartile in
the Micropal ranking since their inception (March ’98 / July ’00)
Credit Funds

38
International
Italy (1)
of which Institutional
New Europe
USA 21,742
81,290
1,044
2,683
Dec. ’01 AuM
+2,863
+596
+408
+1,376
2001Net salesKey figures (Euro mln)
(1) Excluding Proprietary Funds (2) Including Proprietary Funds(3) As at 15.3.2002
2001: POSITIVE NET SALES IN ALL BUSINESS AREAS
TOTAL +5,243
Increasing “Non Captive” share on total AuMs (1)
111,037TOTAL (2)
106,759
Mar. ’02 AuM (3)
Mar. ’02Net sales
81,337
+1,048 5,733
23,006
+576
+65
108,854
113,222
+121
+833
5,915
3,408
1,103
-188
+1,286
Acceleration of positive trend in 2002
Non Captive/Total AuM - Assets Breakdown
25,31%
29,22%30,71%
20%
22%
24%
26%
28%
30%
32%
Year 2000 Year 2001 15 March 2002

39
Total Revenues
2001
Operating costs
Gross operating income
Net Profit(ante minorities)
483.9
378.4
105.6
69.4
(Euro mln)
+3.9% Vs. 2000 pro-forma(1) thanks to successful turnaround of inflows and focus on high margin products (i.e. Capital Guaranteed)
Costs impacted by non recurring restructuring charges, interest expenses(2) and advertising campaigns to relaunch Pioneer brand Gross operating income affected by impact of turnaround costs
Net Profit also affected by increased reserves and very conservative approach to tax provisions(1) Pro-forma based on UCI estimates (not accounting figures) including Pioneer USA results (for the whole 2000) in 2000 Pioneer
Group’s income statement
GOOD INCREASE IN REVENUES (ON A PRO-FORMA BASIS);C/I RATIO AFFECTED BY COSTS OF TURNAROUND
Trend Vs. 2000
Percentage changes over 2000 reported figures are not meaningful because of differences in consolidation perimeter
(2) Interest expenses related to financing of goodwill(3) Gross Operating Income (Euro 105.6 mln) + Interest Expenses (Euro 23.4 mln) + Extraordinary Staff Costs (Euro 4 mln) +
Other Extraordinary Restructuring Costs (Euro 6.4 mln)
Managerial EBIT (3)
139.4 (Ex interest expenses and restructuring costs linked to the acquisition)

40
2002-2004 STRATEGY: FROM A MUTUAL FUND TO A 360° ASSET MANAGER ...
Pioneer has expertise in all these areas and a unique range of funds with a good track record
Pioneer is poised to become a leader in these segments by 2004
High growth/High margin segments
Retirement products and Unit-linked
insurance policies
Third party distribution platformsFocus on affluent and HNW
Separate Accounts including guaranteed wraps
Alternative Products
Other innovative vehicles with mutual funds as
underlying instruments

41
… LEVERAGING ON 5 KEY COMPETITIVE ADVANTAGES
Integrated, global and “institutionalised” investment process
Ensures flexibility and economies of scope for our third party strategy
Leader in packaging and delivering innovative products
A wide product range can be readily combined to deliver sophisticated “ad hoc” solutions in terms of risk control and personalised asset allocation
Comparative advantages with Global Distributors
Only few providers will become global players in this segment; Pioneer is well positioned to enter the group
Great Global Brand adapted to local needs
Global but also flexible enough to adapt quickly to evolving market conditions
Development of Alternative Investments capabilities
Coverage of low volatility segment and synergies in structured products

42
2002-2004 STRATEGY FOCUSED ON RETURN ON ASSETS
Revenues (1)
581
958
+63%
Managerial EBIT 2002 2004
170
449
Managerial C/I Ratio
71%
53%
118
172
Average AuM
49.2
55.8
Revenues on Av. AuM, bp(1) Revenues from pure Asset Management
Managerial EBIT on Av. AuM, bp
2002 2004
14.4
26.1
139
2001
519
73%
2002 2004 2001
2002 2004 2001
111
46.7
2002 2004 2001
2002 2004 2001
Growth drivers: 3% annual Mkt
performance Net sales
02-04CAGR
01-02y/y % ch.
+22%
+28%
+12%
+20%
+6%

43
Agenda
UCI’s Wholesale Banking Division
Investment Banking: UBM
Overview & Business Model
The Risk/Return Profile
The Business Lines
Outlook 2002-2004
Pioneer Global Asset Management
Overview & 2002-2004 strategy
Operating Divisions
Conclusion

44
ITALY: TOP PERFORMER FOR NET SALES IN 2001; PENSION PRODUCTS THE KEY DRIVER OF FUTURE GROWTH
2001 RESULTS
Confirmed leadership in the Institutional segment (Euro 1,048 mln net sales)
Product innovation and time to market the key drivers of 2001 total net sales (Euro 2.863 mln, ex proprietary funds); Capital Guaranteed Products generating Euro 7.46 bn net sales
2002-2004 STRATEGY
Strong involvement in UCI’s S3 project, in order to increase share of wallet of private and affluent customers
New generation of HNW segregated accounts, with a “hedge fund” component - Target: Euro 14 bn AuM and Euro 7 bn net sales by 2004
Launch of Pension Products: Euro 20-25 bn additional AuM by 2004 with an average return of 45-50 bp
Growing presence in “third party platforms” and Institutional segment

45
USA: TURNAROUND IN SALES IN THE FIRST YEAR AFTER ACQUISITION; 2004 TARGETS TO BE REACHED THROUGH A WIDER PRODUCT RANGE AND ENHANCED DISTRIBUTION CAPABILITIES
2002-2004 STRATEGY
Double the number of advisors/ distributors (from 35,000 to 70,000), increasing their productivity by 30%
Sales force reorganisation; development of sales capabilities in Separate Accounts, Alternative Investments, Structured and Retirement products (i.e. Uni-K and 529 plans)
Best performance in Pioneer US’ history for gross and net sales in 2001, despite bad market conditions; excellent trend in 2002 YTD
6291,000
506
1,189
-251
-1,740
1,231
-2,000
-1,000
0
1,000
2,000
1995 1996 1997 1998 1999 2000 2001
PIONEER US - Net Domestic SalesUSD mln
729
2002 (1)
(1) Year-to-date as at 15.3.2002
2001 RESULTS
1,3612,166 2,287
3,430 3,2832,751
3,838
1,000
2,000
3,000
4,000
5,000
1995 1996 1997 1998 1999 2000 2001
PIONEER US - Gross Domestic Sales
0
USD mln
1,330
2002 (1)

46
INTERNATIONAL: 2002 YTD NET SALES ALREADY IN LINE WITH FY2001;NEW THIRD PARTY DISTRIBUTION CHANNELS AND ALTERNATIVE PRODUCTS TO DRIVE GROWTH
-414
596
-1,000
-500
0
500
1,000
2000 2001
PIONEER INTERNATIONAL - Net Sales
Euro mln
576
2002 (1)
New third party distributors, new agreements with Open Platforms and re-branding resulted in a strong net sales turnaround
2001 RESULTS
(1) Year-to-date as at 15.3.2002
2002-2004 STRATEGY New and deeper relations with third
party distributors to boost sales of traditional or alternative funds
Global distribution agreements with at least 7 major global distributors (vs. 3 at end 2001); maximising Pioneer brand awareness for regional HNW/affluent segments open platforms
Leadership in Alternative Investment products with low volatility spectrum

47
NEW EUROPE: LEVERAGING ON EU CONVERGENCE AND UCI’S WIDEAND STRONG NETWORK IN THE REGION
2002-2004 STRATEGY Capitalisation on EU convergence based
on Italian experience
Consolidation of Pioneer’s leadership in the region through close co-operation with UCI’s network
Development in the Pension Product segment
Excellent results in net sales, mainly due to Bank Pekao distribution in Poland
-0.11
45
-100
0
400
1Q01 2Q01
PIONEER NEW EUROPE - Net Sales
Euro mln
367
2002 (1)
300
200
100
3Q01 4Q01
-4.4
65
Tot. 2001: 408 mln
2001 RESULTS
Market leadership in Poland (23.4% mkt. Share(2)) and Czech Republic (6.7% mkt. share(2))
(1) Year-to-date as at 15.3.2002 (2) Mkt. Shares as at 28.2.2002

48
Agenda
UCI’s Wholesale Banking Division
Investment Banking: UBM
Overview & Business Model
The Risk/Return Profile
The Business Lines
Outlook 2002-2004
Pioneer Global Asset Management
Overview & 2002-2004 strategy
Operating Divisions
Conclusion

49
Pioneer has built a factory that is able to address all the risk/return segments:
Expertise and track record are well established in the Bottom-Up Equity segment
The objective is to develop leadership in low volatility Hedge Funds
Guaranteed and Structured products posted out excellent commercial results in Italy
Global Asset Management excellence and sales expertise are the basis for cross-fertilisation
PIONEER VALUE ADDED STRATEGY: SOPHISTICATED PRODUCTS AND CROSS-FERTILISATION OF SALES EXPERTISE
Guaranteed
Products
Credit
Low Volatility Hedge Funds
Bottom Up Equity
Retu
rn
Risk
ENHANCING RESULTS AND REDUCING EXPOSURE TO FINANCIAL CYCLE
THE MISSION:

50
Annexes

51
UBM & TRADINGLAB BEFOREAND AFTER SEPTEMBER, 11th
VaR vs P&L UBM + TL (Sep-Nov 2001)
-8.0
-6.0
-4.0
-2.0
0.0
2.0
4.0
6.0
8.0
03-s
et-0
1
05-s
et-0
1
07-s
et-0
1
11-s
et-0
1
13-s
et-0
1
17-s
et-0
1
19-s
et-0
1
21-s
et-0
1
25-s
et-0
1
27-s
et-0
1
01-o
tt-0
1
03-o
tt-0
1
05-o
tt-0
1
09-o
tt-0
1
11-o
tt-0
1
15-o
tt-0
1
17-o
tt-0
1
19-o
tt-0
1
23-o
tt-0
1
25-o
tt-0
1
29-o
tt-0
1
31-o
tt-0
1
02-n
ov-0
1
06-n
ov-0
1
08-n
ov-0
1
12-n
ov-0
1
Date
VaR
, P
&L
(m
ln €
)
DAILY P&L
VAR
Positive P&L Trend
Decreasing VaR Trend
EUR 2.5m loss on Sep 11th
VaR increase followed by position cutting

52
AN EXAMPLE OF PROCESS AND RISK CONTROL
Mercato OITSistema di Front
OfficeBroker di
EsecuzioneTrader
1Valuta la convenienza
dell'operazione data la propriaesposizione al rischio di mercato
2Trasmette l'ordine albroker via telefono
2Trasmette l'ordine al
broker tramitel'applicativo XTAS/
JPX/GL3
Immette l'ordinesul mercato
4Eseguel'ordine
5Comunica telefonicamente altrader l'eseguito/ attraverso
JPX/GL fornisce a videol'evidenza del'eseguito
5L'applicativo XTAS fornisce avideo l'evidenza dell'eseguito
e trasmette in automatico i datia WSS con un batch periodico
(ogni 15 minuti)
7Summit e WSS
trasmettono i dati dei dealeseguiti e modificati in
giornata a Rolfe & Nolanin batch notturno
trade date +1
trade date
xor
ProcessoGestione
Anagraficheprodotti/ctp
ProcessoHelp Desk
ProcessoAutorizzazione
e controlloBroker
ProcessoControlloRischio dimercato
ProcessoRivalutazioneposizioni a fini
gestionali e det.del P/L in WSS
Presidiano il correttocompleto
trasferimento dei dealtra applicativo XTAS e
Wall Street
6Verifica l'eseguito e lo
carica manualmente suSummit/Wall Street
verificando la correttaregistrazione
xor
ProcessoRivalutazioneposizioni a fini
gestionali e det.del P/L in Summit
a
a
WSS viene alimentato ogni15 minuti con il file messo adisposizione Barclays R&N(broker di regolamento)
La verifica vieneeffettuata per confrontotra WSS e un file Excelcon i deal estratti daXTAS
Listed Derivatives Trading on Foreign Markets flow (example)
Control activity and detailed
documentation
Correlated process