Embed Size (px)
Citation preview
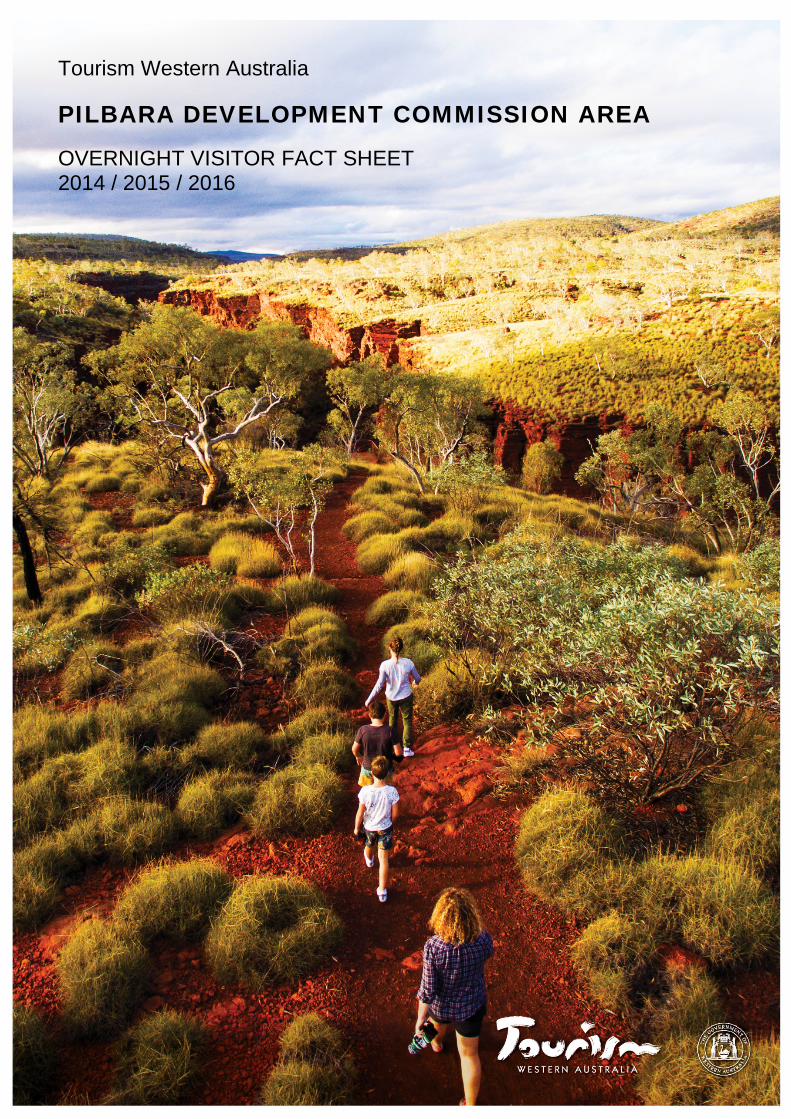
Tourism Western Australia
PILBARA DEVELOPMENT COMMISSION AREA
OVERNIGHT VISITOR FACT SHEET 2014 / 2015 / 2016
Pilbara Development Commission Area - Three Year Average - YE Dec 2014/15/16 Tourism Western Australia
Unless otherwise stated, all data is sourced from Tourism Research Australia’s National and International Visitor Surveys.
The estimates of visitor number and nights in this fact sheet are based on information obtained from Tourism Research Australia’s National and International Visitor Surveys (NVS and IVS respectively) - a sample of visitors coming to or travelling within Western Australia. As with all surveys, the estimates are subject to sampling variability. This means the survey results may vary from the results that would have been produced if all visitors had been interviewed in a census. Interstate estimates are based on smaller sample sizes than either the intrastate or international measures, and can fluctuate significantly. To increase the sample size and hence improve the reliability of the data, estimates in this document are based on an average of the past three calendar years (2014, 2015 and 2016). It is recommended by Tourism WA that the visitation statistics in this fact sheet are used in conjunction with other information sources that you have access to. This might include population statistics from the Australian Bureau of Statistics, feedback from local operators, information from local Visitor Centres, data from local councils etc. PLEASE NOTE: In January 2014, the NVS methodology was improved to bring the survey sample more in line with the Australian population. Consequently, domestic estimates for 2014 onwards are not comparable to estimates for 2013 and prior. More information on the change to the NVS methodology is available here on the Tourism WA corporate website. In September 2016, TRA confirmed there was a methodology issue with the NVS impacting the domestic estimates for all States and Territories. TRA have now corrected the issue and all domestic estimates from the commencement of the dual frame data collection (2014 to 2016) have been back cast and reissued. Revisions have been made for all States and Territories and across all purposes of travel, although WA was one of the most impacted States. 2014 and 2015 estimates have seen the most significant revisions; only minor revisions were required for the 2016 estimates as they were not as impacted by the methodology issue. By correcting this methodology issue the revised estimates, and estimates produced by the NVS moving forward, more accurately reflect the Australian population and domestic travel across the country.
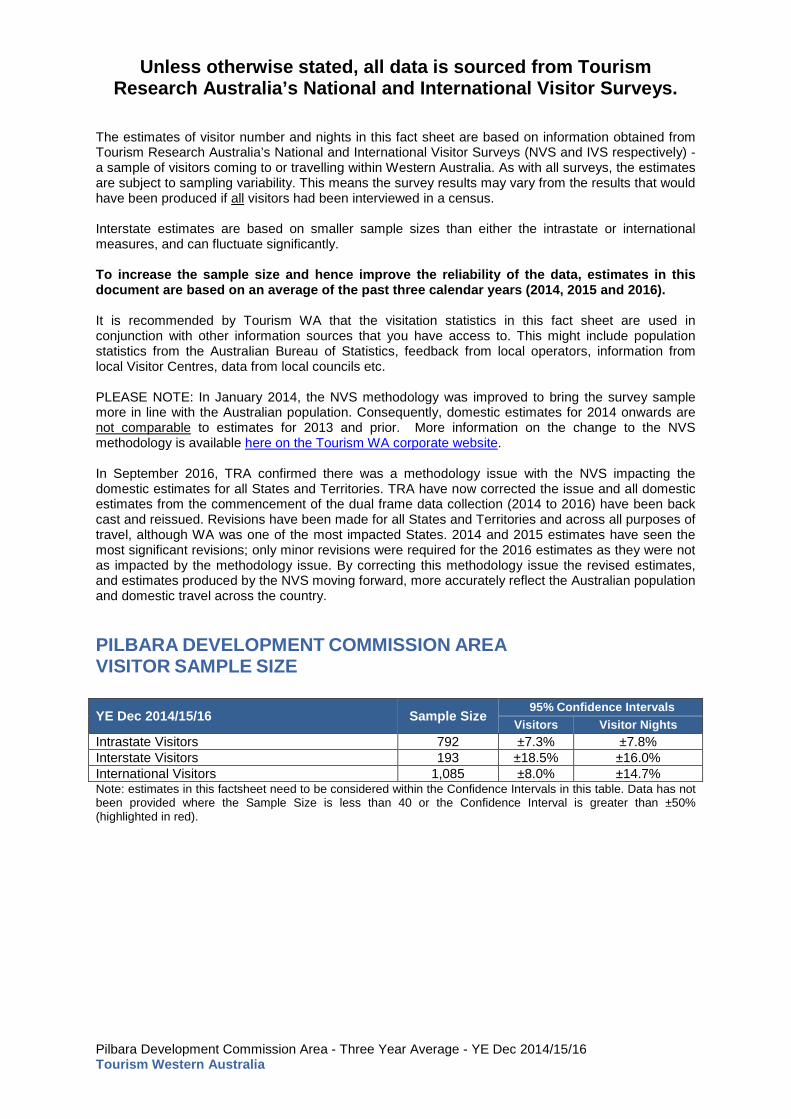
PILBARA DEVELOPMENT COMMISSION AREA VISITOR SAMPLE SIZE YE Dec 2014/15/16 Sample Size 95% Confidence Intervals
Visitors Visitor Nights Intrastate Visitors 792 ±7.3% ±7.8% Interstate Visitors 193 ±18.5% ±16.0% International Visitors 1,085 ±8.0% ±14.7% Note: estimates in this factsheet need to be considered within the Confidence Intervals in this table. Data has not been provided where the Sample Size is less than 40 or the Confidence Interval is greater than ±50% (highlighted in red).
Pilbara Development Commission Area - Three Year Average - YE Dec 2014/15/16 Tourism Western Australia
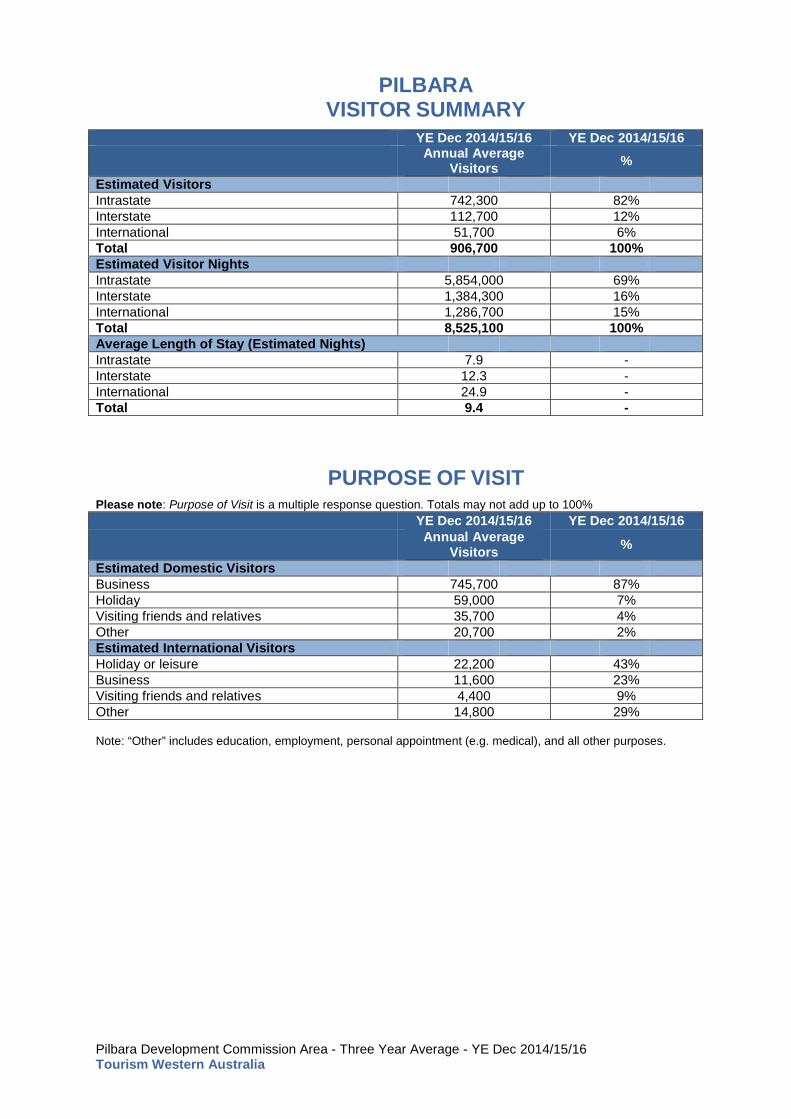
PILBARA
VISITOR SUMMARY YE Dec 2014/15/16 YE Dec 2014/15/16 Annual Average
Visitors % Estimated Visitors Intrastate 742,300 82% Interstate 112,700 12% International 51,700 6% Total 906,700 100% Estimated Visitor Nights Intrastate 5,854,000 69% Interstate 1,384,300 16% International 1,286,700 15% Total 8,525,100 100% Average Length of Stay (Estimated Nights) Intrastate 7.9 - Interstate 12.3 - International 24.9 - Total 9.4 -
PURPOSE OF VISIT
Please note: Purpose of Visit is a multiple response question. Totals may not add up to 100% YE Dec 2014/15/16 YE Dec 2014/15/16
Annual Average Visitors %
Estimated Domestic Visitors Business 745,700 87% Holiday 59,000 7% Visiting friends and relatives 35,700 4% Other 20,700 2% Estimated International Visitors Holiday or leisure 22,200 43% Business 11,600 23% Visiting friends and relatives 4,400 9% Other 14,800 29% Note: “Other” includes education, employment, personal appointment (e.g. medical), and all other purposes.
Pilbara Development Commission Area - Three Year Average - YE Dec 2014/15/16 Tourism Western Australia
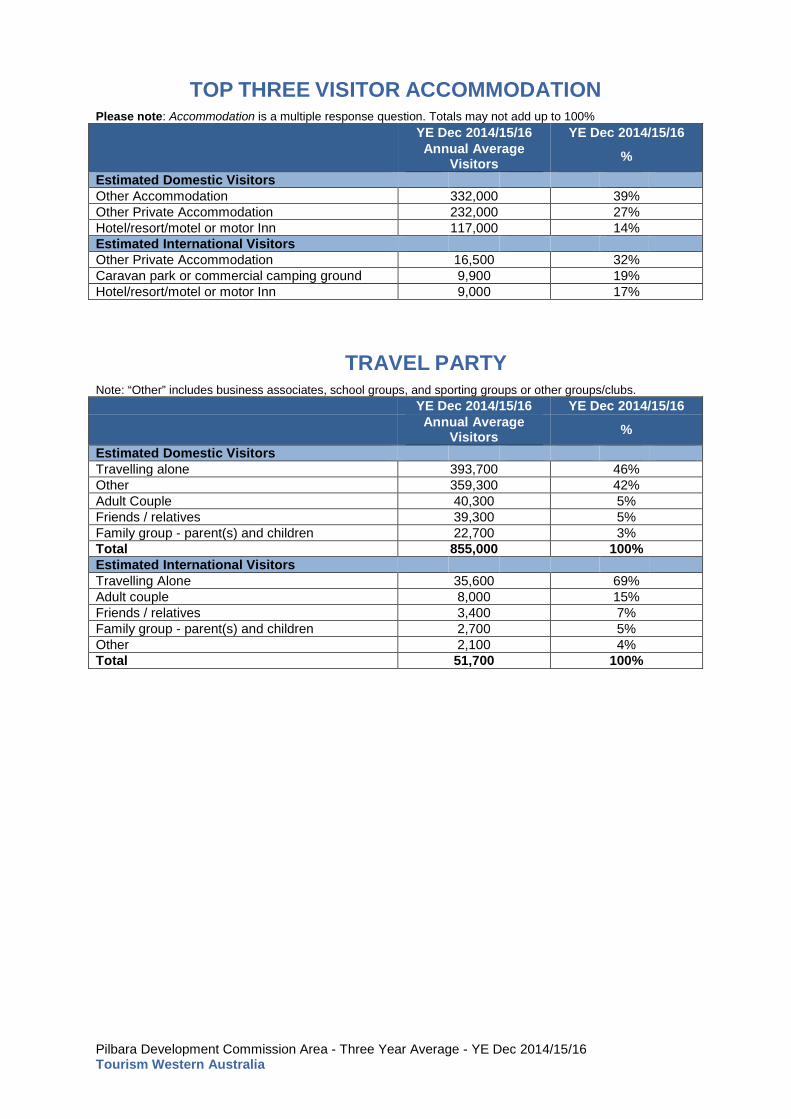
TOP THREE VISITOR ACCOMMODATION
Please note: Accommodation is a multiple response question. Totals may not add up to 100% YE Dec 2014/15/16 YE Dec 2014/15/16
Annual Average Visitors %
Estimated Domestic Visitors Other Accommodation 332,000 39% Other Private Accommodation 232,000 27% Hotel/resort/motel or motor Inn 117,000 14% Estimated International Visitors Other Private Accommodation 16,500 32% Caravan park or commercial camping ground 9,900 19% Hotel/resort/motel or motor Inn 9,000 17%
TRAVEL PARTY Note: “Other” includes business associates, school groups, and sporting groups or other groups/clubs. YE Dec 2014/15/16 YE Dec 2014/15/16
Annual Average Visitors %
Estimated Domestic Visitors Travelling alone 393,700 46% Other 359,300 42% Adult Couple 40,300 5% Friends / relatives 39,300 5% Family group - parent(s) and children 22,700 3% Total 855,000 100% Estimated International Visitors Travelling Alone 35,600 69% Adult couple 8,000 15% Friends / relatives 3,400 7% Family group - parent(s) and children 2,700 5% Other 2,100 4% Total 51,700 100%
Pilbara Development Commission Area - Three Year Average - YE Dec 2014/15/16 Tourism Western Australia
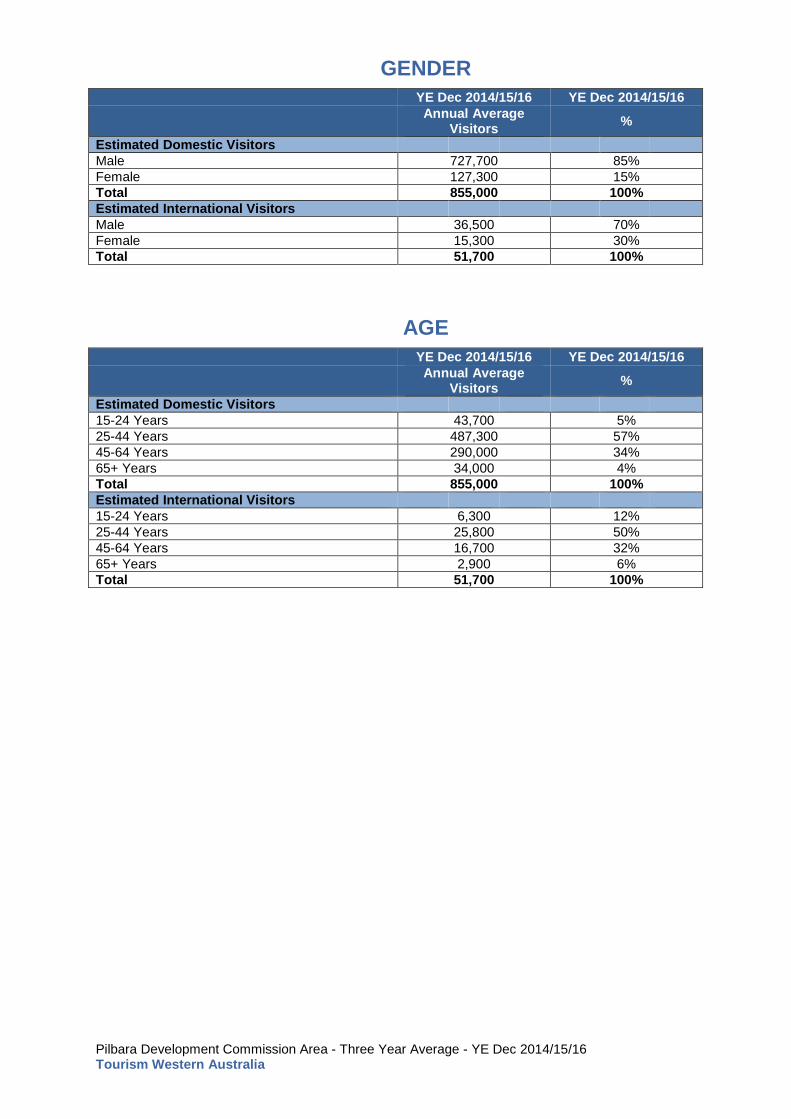
GENDER YE Dec 2014/15/16 YE Dec 2014/15/16
Annual Average Visitors %
Estimated Domestic Visitors Male 727,700 85% Female 127,300 15% Total 855,000 100% Estimated International Visitors Male 36,500 70% Female 15,300 30% Total 51,700 100%
AGE YE Dec 2014/15/16 YE Dec 2014/15/16
Annual Average Visitors %
Estimated Domestic Visitors 15-24 Years 43,700 5% 25-44 Years 487,300 57% 45-64 Years 290,000 34% 65+ Years 34,000 4% Total 855,000 100% Estimated International Visitors 15-24 Years 6,300 12% 25-44 Years 25,800 50% 45-64 Years 16,700 32% 65+ Years 2,900 6% Total 51,700 100%
Pilbara Development Commission Area - Three Year Average - YE Dec 2014/15/16 Tourism Western Australia
The Pilbara Development Commission Area includes the following ABS Level 2 Statistical Areas (SA2s):
• Ashburton (WA) • East Pilbara • Karratha • Newman • Port Hedland • Roebourne • South Hedland
See the ABS website for a map of Western Australia by SA2s. FACT SHEET SOURCES
• Tourism Research Australia - National Visitor Survey o Overnight Domestic Visitors Definition: Australian residents aged 15 years
and over who spent at least one night away from home
• Tourism Research Australia - International Visitor Survey o Overnight International Visitors Definition: International visitors aged 15 years
and over who spent at least one night in the region