Embed Size (px)
Citation preview
Pillar 3 Disclosure Report
Quarter ended March 2021
Maybank Singapore Limited
Incorporated in Singapore
Company Registration Number: 201804195C
TABLE OF CONTENTS
1 INTRODUCTION .................................................................................................... 1
2 CAPITAL ADEQUACY ............................................................................................. 2
2.1 Key Metrics ................................................................................................... 3
3 LEVERAGE RATIO ................................................................................................. 5
3.1 Leverage Ratio ............................................................................................... 5
3.2 Leverage Ratio Common Disclosure Template ......................................................... 5
4 OVERVIEW OF RISK-WEIGHTED ASSETS (“RWA”) ........................................................... 7
5 CREDIT RISK ....................................................................................................... 9
5.1 IRBA – RWA Flow Statement for Credit Risk Exposures ................................................ 9
6 ABBREVIATIONS .................................................................................................. 10
1
1 INTRODUCTION
The Monetary Authority of Singapore (“MAS”) has designated Maybank Singapore Limited (“MSL”) as a
Domestic Systemically Important Bank (“D-SIB”) in Singapore since 2015. As such, MSL is subject to the
reporting of MAS Notice 637 “Risk Based Capital Adequacy Requirements for Banks Incorporated in
Singapore” (“MAS Notice 637”). The following disclosures are made pursuant to MAS Notice 637.
MSL recognises the importance of MAS Notice 637 in promoting market discipline by requiring disclosures
of key information relating to regulatory capital and risk exposures on a consistent and comparable basis
that will enable stakeholders to better understand and assess a reporting bank’s business and risk profile
vis-à-vis other banks.
For the purpose of calculating its risk-weighted assets, MSL applies the Internal Ratings-Based Approach
(“IRBA”) and Standardised Approach (“SA”) to relevant credit exposures to ascertain its credit risk-
weighted assets. For market risk and operational risk, MSL applies the SA and Basic Indicator Approach
to compute the market risk-weighted assets and operational risk-weighted assets respectively.
The numbers in this document are presented in Singapore dollars and rounded to the nearest million,
unless otherwise stated.
2
2 CAPITAL ADEQUACY
MSL’s approach to capital management is driven by its strategic objectives and takes into account all
relevant regulatory, economic and commercial environments in which MSL and the Maybank Group
operate. MSL regards having a strong capital position as essential to the bank’s business strategy and
competitive position. As such, implications on the bank’s capital position are taken into account by the
Board and senior management prior to implementing any major business decision in order to preserve
the bank’s overall capital strength.
The quality and composition of capital are key factors in the Board and senior management’s evaluation
of the bank’s capital adequacy position. MSL places strong emphasis on the quality of its capital and
accordingly holds a higher amount of its capital in the form of common equity which is permanent and
has the highest loss absorption capability on a going concern basis.
The Board maintains oversight of the regulatory capital of MSL in line with regulatory requirements under
the MAS Notice 637 and expectations of various stakeholders such as regulators. To date, MSL has
complied with all externally-imposed regulatory capital requirements throughout the financial period.
3
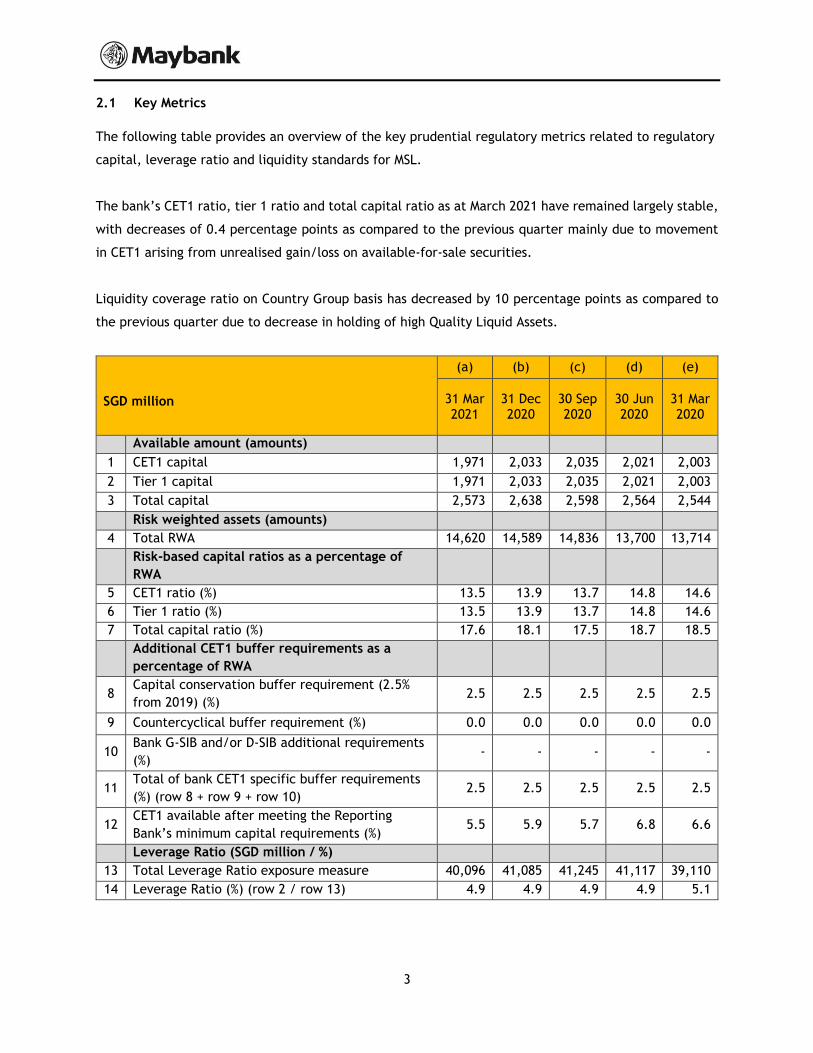
2.1 Key Metrics
The following table provides an overview of the key prudential regulatory metrics related to regulatory
capital, leverage ratio and liquidity standards for MSL.
The bank’s CET1 ratio, tier 1 ratio and total capital ratio as at March 2021 have remained largely stable,
with decreases of 0.4 percentage points as compared to the previous quarter mainly due to movement
in CET1 arising from unrealised gain/loss on available-for-sale securities.
Liquidity coverage ratio on Country Group basis has decreased by 10 percentage points as compared to
the previous quarter due to decrease in holding of high Quality Liquid Assets.
SGD million
(a) (b) (c) (d) (e)
31 Mar 2021
31 Dec 2020
30 Sep 2020
30 Jun 2020
31 Mar 2020
Available amount (amounts)
1 CET1 capital 1,971 2,033 2,035 2,021 2,003
2 Tier 1 capital 1,971 2,033 2,035 2,021 2,003
3 Total capital 2,573 2,638 2,598 2,564 2,544
Risk weighted assets (amounts)
4 Total RWA 14,620 14,589 14,836 13,700 13,714
Risk-based capital ratios as a percentage of
RWA
5 CET1 ratio (%) 13.5 13.9 13.7 14.8 14.6
6 Tier 1 ratio (%) 13.5 13.9 13.7 14.8 14.6
7 Total capital ratio (%) 17.6 18.1 17.5 18.7 18.5
Additional CET1 buffer requirements as a
percentage of RWA
8 Capital conservation buffer requirement (2.5%
from 2019) (%) 2.5 2.5 2.5 2.5 2.5
9 Countercyclical buffer requirement (%) 0.0 0.0 0.0 0.0 0.0
10 Bank G-SIB and/or D-SIB additional requirements
(%) - - - - -
11 Total of bank CET1 specific buffer requirements
(%) (row 8 + row 9 + row 10) 2.5 2.5 2.5 2.5 2.5
12 CET1 available after meeting the Reporting
Bank’s minimum capital requirements (%) 5.5 5.9 5.7 6.8 6.6
Leverage Ratio (SGD million / %)
13 Total Leverage Ratio exposure measure 40,096 41,085 41,245 41,117 39,110
14 Leverage Ratio (%) (row 2 / row 13) 4.9 4.9 4.9 4.9 5.1
4
SGD million
(a) (b) (c) (d) (e)
31 Mar 2021
31 Dec 2020
30 Sep 2020
30 Jun 2020
31 Mar 2020
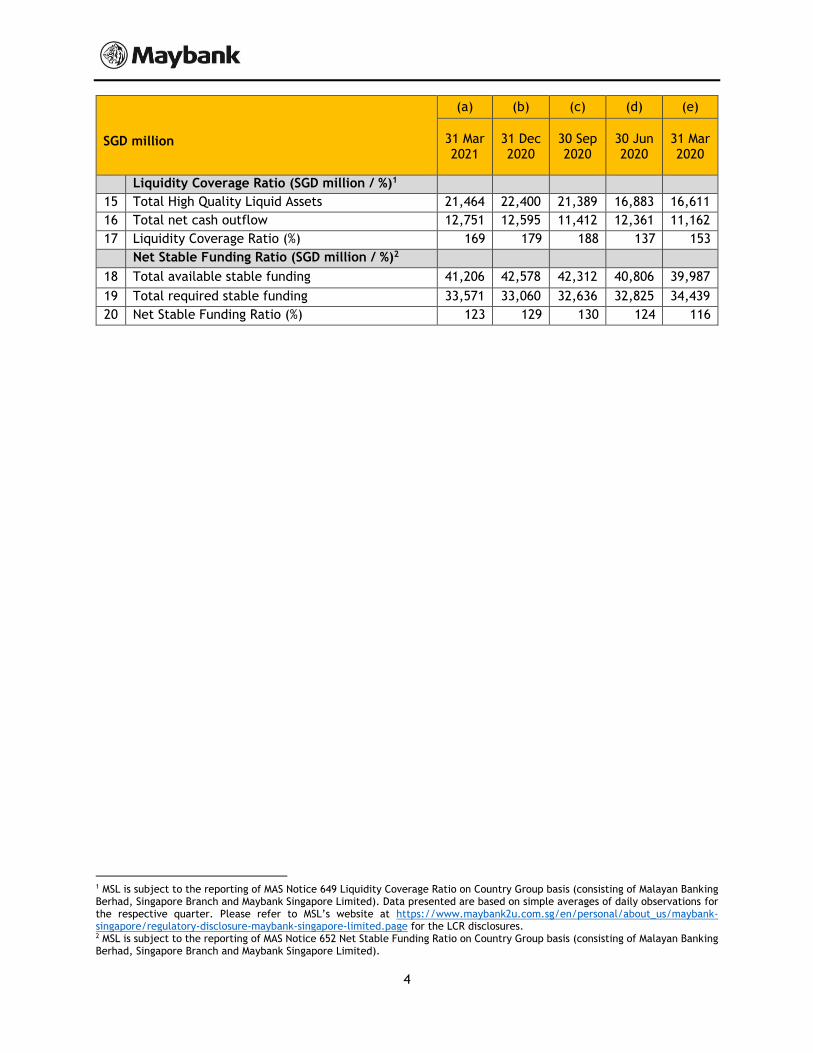
Liquidity Coverage Ratio (SGD million / %)1
15 Total High Quality Liquid Assets 21,464 22,400 21,389 16,883 16,611
16 Total net cash outflow 12,751 12,595 11,412 12,361 11,162
17 Liquidity Coverage Ratio (%) 169 179 188 137 153
Net Stable Funding Ratio (SGD million / %)2
18 Total available stable funding 41,206 42,578 42,312 40,806 39,987
19 Total required stable funding 33,571 33,060 32,636 32,825 34,439
20 Net Stable Funding Ratio (%) 123 129 130 124 116
1 MSL is subject to the reporting of MAS Notice 649 Liquidity Coverage Ratio on Country Group basis (consisting of Malayan Banking Berhad, Singapore Branch and Maybank Singapore Limited). Data presented are based on simple averages of daily observations for the respective quarter. Please refer to MSL’s website at https://www.maybank2u.com.sg/en/personal/about_us/maybank-singapore/regulatory-disclosure-maybank-singapore-limited.page for the LCR disclosures. 2 MSL is subject to the reporting of MAS Notice 652 Net Stable Funding Ratio on Country Group basis (consisting of Malayan Banking Berhad, Singapore Branch and Maybank Singapore Limited).
5
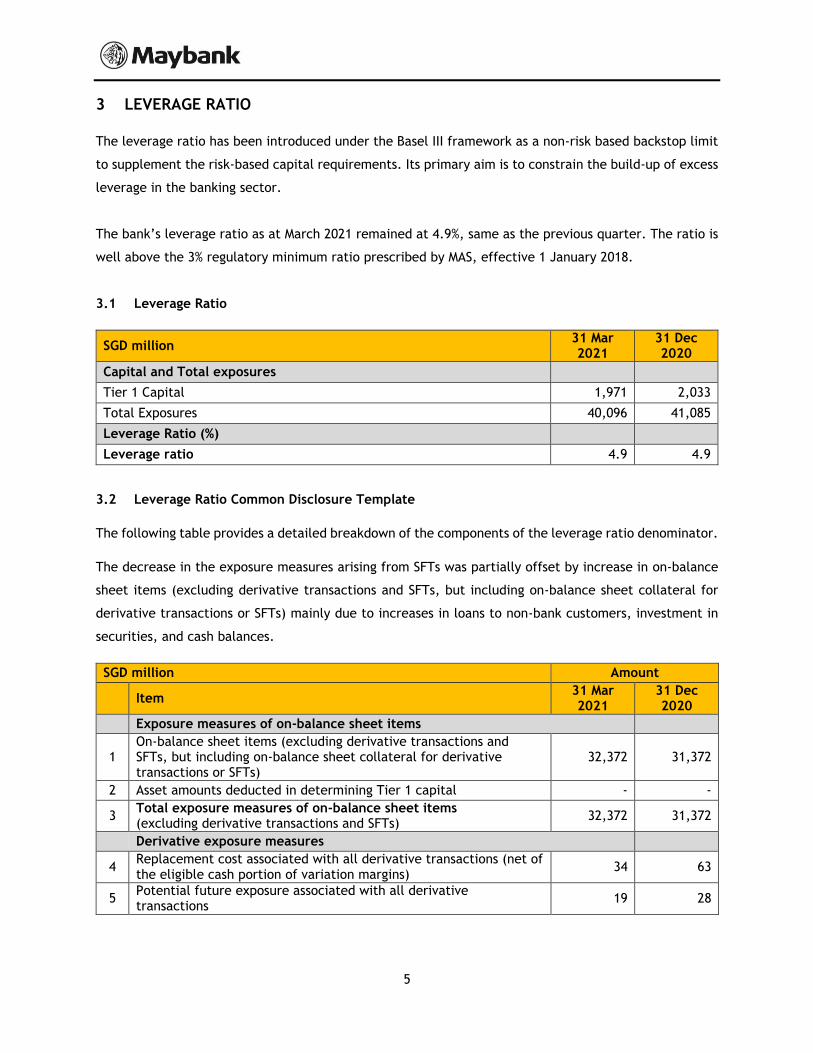
3 LEVERAGE RATIO
The leverage ratio has been introduced under the Basel III framework as a non-risk based backstop limit
to supplement the risk-based capital requirements. Its primary aim is to constrain the build-up of excess
leverage in the banking sector.
The bank’s leverage ratio as at March 2021 remained at 4.9%, same as the previous quarter. The ratio is
well above the 3% regulatory minimum ratio prescribed by MAS, effective 1 January 2018.
3.1 Leverage Ratio
SGD million 31 Mar 2021
31 Dec 2020
Capital and Total exposures
Tier 1 Capital 1,971 2,033
Total Exposures 40,096 41,085
Leverage Ratio (%)
Leverage ratio 4.9 4.9
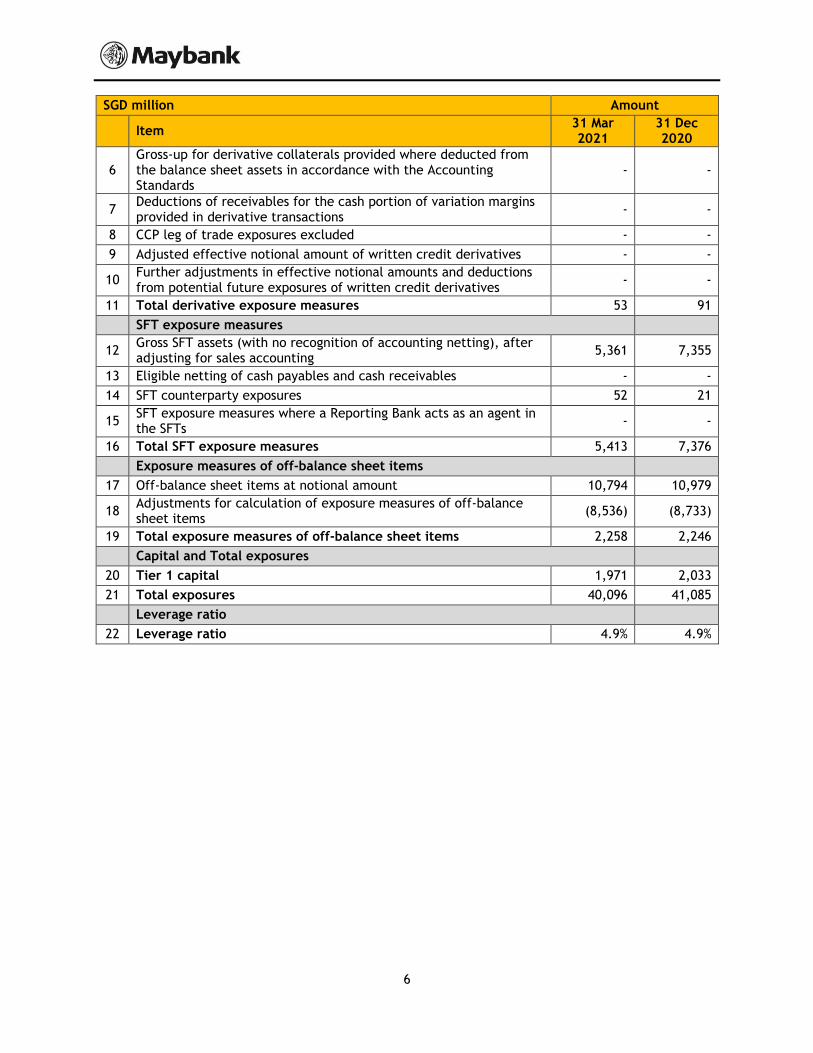
3.2 Leverage Ratio Common Disclosure Template
The following table provides a detailed breakdown of the components of the leverage ratio denominator.
The decrease in the exposure measures arising from SFTs was partially offset by increase in on-balance
sheet items (excluding derivative transactions and SFTs, but including on-balance sheet collateral for
derivative transactions or SFTs) mainly due to increases in loans to non-bank customers, investment in
securities, and cash balances.
SGD million Amount
Item 31 Mar 2021
31 Dec 2020
Exposure measures of on-balance sheet items
1 On-balance sheet items (excluding derivative transactions and SFTs, but including on-balance sheet collateral for derivative transactions or SFTs)
32,372 31,372
2 Asset amounts deducted in determining Tier 1 capital - -
3 Total exposure measures of on-balance sheet items (excluding derivative transactions and SFTs)
32,372 31,372
Derivative exposure measures
4 Replacement cost associated with all derivative transactions (net of the eligible cash portion of variation margins)
34 63
5 Potential future exposure associated with all derivative transactions
19 28
6
SGD million Amount
Item 31 Mar 2021
31 Dec 2020
6 Gross-up for derivative collaterals provided where deducted from the balance sheet assets in accordance with the Accounting Standards
- -
7 Deductions of receivables for the cash portion of variation margins provided in derivative transactions
- -
8 CCP leg of trade exposures excluded - -
9 Adjusted effective notional amount of written credit derivatives - -
10 Further adjustments in effective notional amounts and deductions from potential future exposures of written credit derivatives
- -
11 Total derivative exposure measures 53 91 SFT exposure measures
12 Gross SFT assets (with no recognition of accounting netting), after adjusting for sales accounting
5,361 7,355
13 Eligible netting of cash payables and cash receivables - -
14 SFT counterparty exposures 52 21
15 SFT exposure measures where a Reporting Bank acts as an agent in the SFTs
- -
16 Total SFT exposure measures 5,413 7,376 Exposure measures of off-balance sheet items
17 Off-balance sheet items at notional amount 10,794 10,979
18 Adjustments for calculation of exposure measures of off-balance sheet items
(8,536) (8,733)
19 Total exposure measures of off-balance sheet items 2,258 2,246 Capital and Total exposures
20 Tier 1 capital 1,971 2,033
21 Total exposures 40,096 41,085 Leverage ratio
22 Leverage ratio 4.9% 4.9%
7
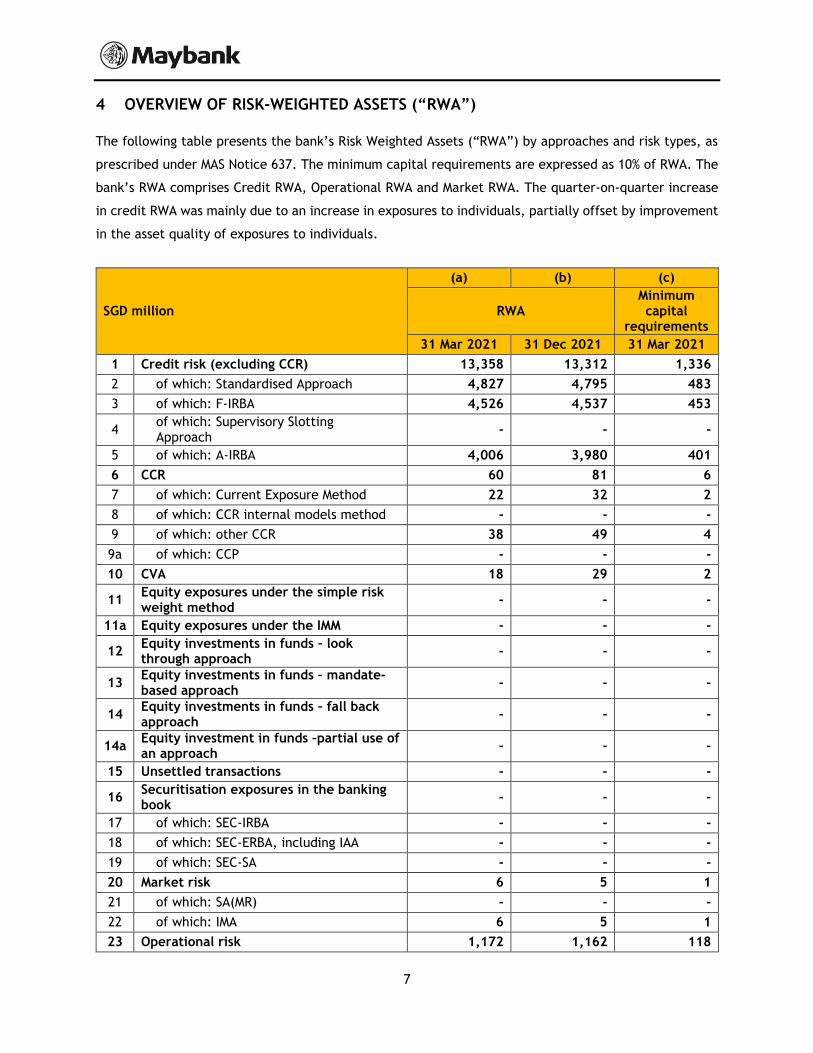
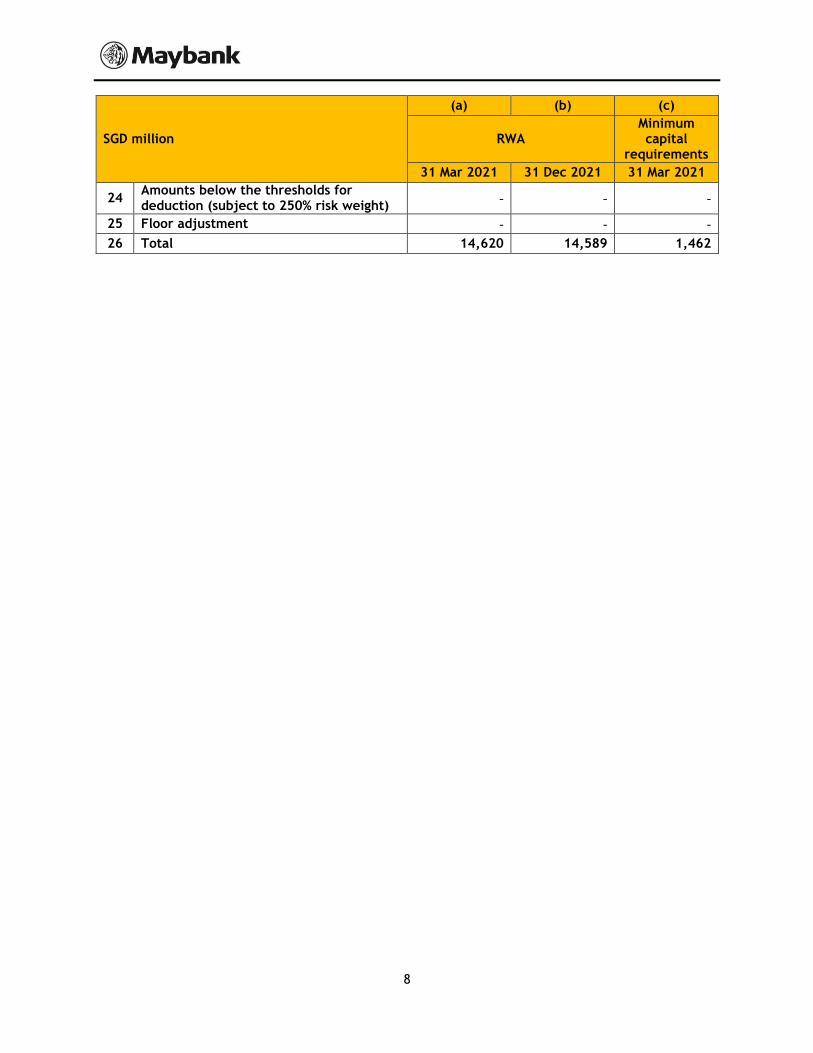
4 OVERVIEW OF RISK-WEIGHTED ASSETS (“RWA”)
The following table presents the bank’s Risk Weighted Assets (“RWA”) by approaches and risk types, as
prescribed under MAS Notice 637. The minimum capital requirements are expressed as 10% of RWA. The
bank’s RWA comprises Credit RWA, Operational RWA and Market RWA. The quarter-on-quarter increase
in credit RWA was mainly due to an increase in exposures to individuals, partially offset by improvement
in the asset quality of exposures to individuals.
SGD million
(a) (b) (c)
RWA Minimum capital
requirements
31 Mar 2021 31 Dec 2021 31 Mar 2021
1 Credit risk (excluding CCR) 13,358 13,312 1,336
2 of which: Standardised Approach 4,827 4,795 483
3 of which: F-IRBA 4,526 4,537 453
4 of which: Supervisory Slotting Approach
- - -
5 of which: A-IRBA 4,006 3,980 401
6 CCR 60 81 6
7 of which: Current Exposure Method 22 32 2
8 of which: CCR internal models method - - -
9 of which: other CCR 38 49 4
9a of which: CCP - - -
10 CVA 18 29 2
11 Equity exposures under the simple risk weight method
- - -
11a Equity exposures under the IMM - - -
12 Equity investments in funds – look through approach
- - -
13 Equity investments in funds – mandate-based approach
- - -
14 Equity investments in funds – fall back approach
- - -
14a Equity investment in funds –partial use of an approach
- - -
15 Unsettled transactions - - -
16 Securitisation exposures in the banking book
- - -
17 of which: SEC-IRBA - - -
18 of which: SEC-ERBA, including IAA - - -
19 of which: SEC-SA - - -
20 Market risk 6 5 1
21 of which: SA(MR) - - -
22 of which: IMA 6 5 1
23 Operational risk 1,172 1,162 118
8
SGD million
(a) (b) (c)
RWA Minimum capital
requirements
31 Mar 2021 31 Dec 2021 31 Mar 2021
24 Amounts below the thresholds for deduction (subject to 250% risk weight)
- - -
25 Floor adjustment - - -
26 Total 14,620 14,589 1,462
9
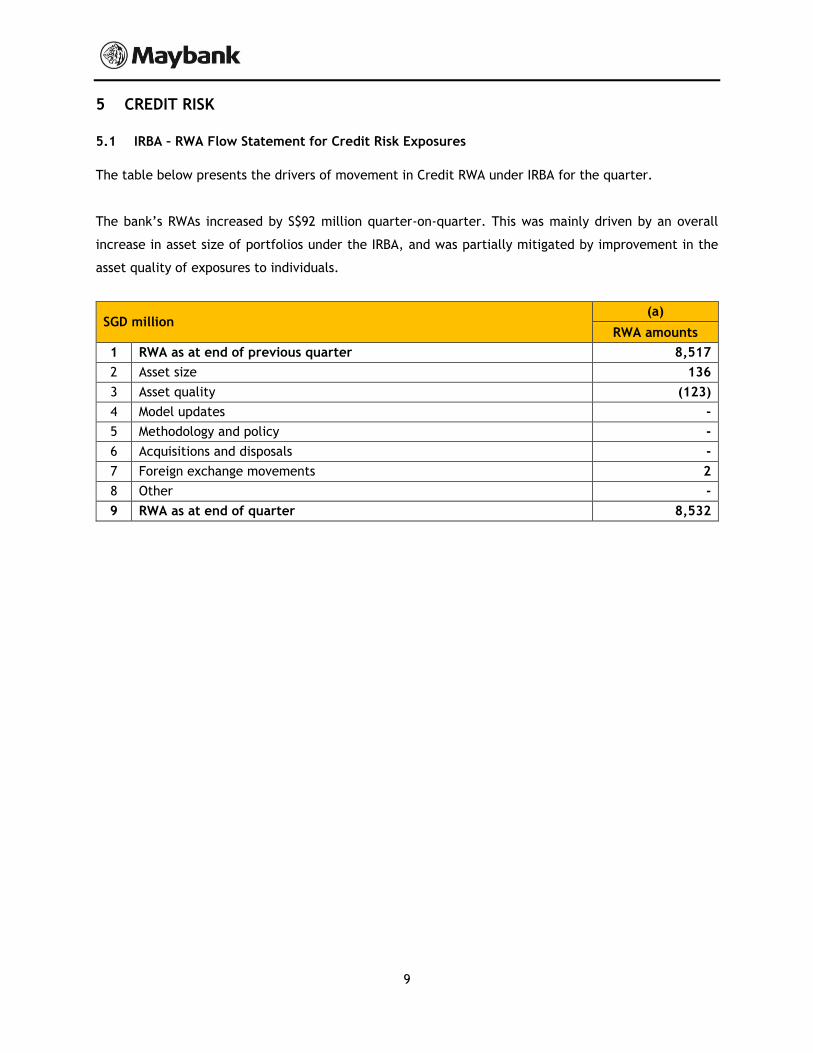
5 CREDIT RISK
5.1 IRBA – RWA Flow Statement for Credit Risk Exposures
The table below presents the drivers of movement in Credit RWA under IRBA for the quarter.
The bank’s RWAs increased by S$92 million quarter-on-quarter. This was mainly driven by an overall
increase in asset size of portfolios under the IRBA, and was partially mitigated by improvement in the
asset quality of exposures to individuals.
SGD million (a)
RWA amounts
1 RWA as at end of previous quarter 8,517
2 Asset size 136
3 Asset quality (123)
4 Model updates -
5 Methodology and policy -
6 Acquisitions and disposals -
7 Foreign exchange movements 2
8 Other -
9 RWA as at end of quarter 8,532
10
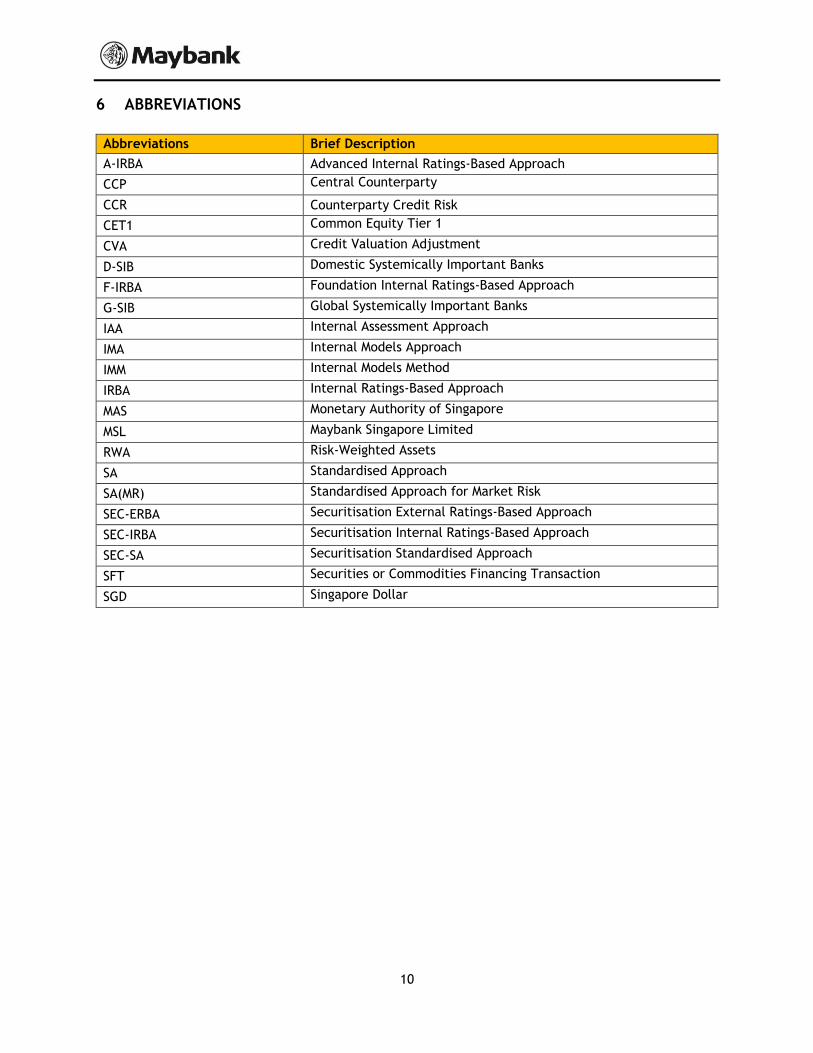
6 ABBREVIATIONS
Abbreviations Brief Description
A-IRBA Advanced Internal Ratings-Based Approach
CCP Central Counterparty
CCR Counterparty Credit Risk
CET1 Common Equity Tier 1
CVA Credit Valuation Adjustment
D-SIB Domestic Systemically Important Banks
F-IRBA Foundation Internal Ratings-Based Approach
G-SIB Global Systemically Important Banks
IAA Internal Assessment Approach
IMA Internal Models Approach
IMM Internal Models Method
IRBA Internal Ratings-Based Approach
MAS Monetary Authority of Singapore
MSL Maybank Singapore Limited
RWA Risk-Weighted Assets
SA Standardised Approach
SA(MR) Standardised Approach for Market Risk
SEC-ERBA Securitisation External Ratings-Based Approach
SEC-IRBA Securitisation Internal Ratings-Based Approach
SEC-SA Securitisation Standardised Approach
SFT Securities or Commodities Financing Transaction
SGD Singapore Dollar