Embed Size (px)
Citation preview

CYB Investments Limited (formerly known as National Australia
Group Europe Limited)
Pillar 3 Disclosures
30 September 2015

CYB Investments Limited
(formerly known as National Australia Group Europe Limited)
Pillar 3 Disclosures
30 September 2015
Contents
1. Overview 3
2. Risk Management 6
3. Capital Resources 19
4. Capital Requirements 25
5. Credit Risk 27
6. Operational Risk 39
7. Securitisation 41
8. Asset Encumbrance 44
9. Counterparty Credit Risk 47
10. Market and Interest Rate Risk 49
11. Remuneration 51
Appendix 1: Disclosures for Clydesdale Bank PLC 57
Appendix 2: Main Features of Regulatory Capital Instruments 62
Tables 65
Glossary 66
2

1. Overview
1.1 Background
This document presents the first consolidated Pillar 3 disclosures of CYB Investments Limited and its controlled entities (“the Group”) as at 30 September 2015. The Group’s ultimate parent company, National Australia Bank Limited (“NAB”), announced its intention on 7 May 2015 to pursue a demerger and initial public offering (“IPO”) of the Group from NAB. As part of preparation for the transaction, the Company changed its name from National Australia Group Europe Limited to CYB Investments Limited on 29 October 2015. The disclosures have been prepared in accordance with the Capital Requirements Regulation (“CRR”) and Capital Requirements Directive (together referred to as CRD IV). CRD IV is designed to implement the Basel III reforms of the Basel Committee on Banking Supervision (“BCBS”) and came into force within the European Union (“EU”) on 1 January 2014. Pillar 3 disclosure requirements apply to banks and building societies and aim to promote market discipline through the disclosure of key information about risk exposures and risk management processes. Since the introduction of Pillar 3 requirements in 2008 under Basel II, the Group has met the disclosure requirements through inclusion within the NAB consolidated Pillar 3 disclosures. This was on the basis that equivalent disclosures were made by a parent undertaking which met CRR Article 13 (3) ‘Application of disclosure requirements on a consolidated basis’ and previous Prudential Regulation Authority (“PRA”) (formerly the Financial Services Authority (“FSA”) requirements. For 2015 the Group, in addition to publishing its own Pillar 3 disclosures, continues to be included in the consolidated NAB Pillar 3 report. The Group Pillar 3 disclosures are published on the Group’s website (https://secure.cbonline.co.uk/debtinvestors/clydesdale-bank-update/). The NAB 2015 Pillar 3 report can be found at http://www.nab.com.au/about-us/shareholder-centre/regulatory-disclosures.
1.2 Basis of preparation and frequency of disclosures
This document sets out the 2015 Pillar 3 disclosures for the Group, comprising CYB Investments Limited (“the Company”) and its controlled entities, including Clydesdale Bank PLC (“the Bank”) in accordance with the rules laid out in the CRR (Part 8). The disclosures may differ from similar information in the annual report & consolidated financial statements for the year ended 30 September 2015, which are prepared in accordance with International Financial Reporting Standards. The information in these disclosures is prepared in accordance with regulatory requirements and may therefore not be directly comparable with that information. The Group uses the Standardised Approach for credit risk, operational risk, market risk and credit valuation adjustment. This approach uses standard risk weighting percentages prescribed within the CRR and PRA implementing rules. The disclosures in this document are based on these approaches. Throughout the document, unless otherwise specified, credit risk exposures are defined as the aggregate of drawn (on balance sheet) balances, undrawn (off balance sheet) commitments and contingent liabilities prior to the application of credit risk mitigation and prior to the application of credit conversion factors. Unless otherwise stated, all figures are as at 30 September 2015, the Group’s financial year end, with comparative figures for 30 September 2014 where relevant. These disclosures will be published annually, and concurrently with the annual report & consolidated financial statements in accordance with regulatory guidelines. The Group will publish specific information more frequently where it is required under the European Banking Authority (“EBA”) guidelines.
3

1.3 Scope of disclosures
The Pillar 3 disclosures in this document relate to the Group, with the exception of Appendix 1 which contains the disclosures required for the Bank (PRA firm reference number 121873), the Group’s principal subsidiary. There is a requirement to calculate and maintain regulatory capital ratios on both a Group basis and on an Individual Consolidated (or Solo) basis for the Bank. There are no differences between the bases of consolidation of the Group for accounting and prudential purposes. All of the Group’s subsidiary undertakings are included in the data provided in the Pillar 3 disclosures. Full details of the Group’s subsidiaries are provided in note 46 of the annual report & consolidated financial statements for the year ended 30 September 2015 (https://secure.cbonline.co.uk/debtinvestors/clydesdale-bank-update/). The subsidiaries included on the Individual Consolidation basis are:
• Yorkshire Bank Home Loans Limited; • Clydesdale Bank Asset Finance Limited; • CGF No. 9 Limited; and • Clydesdale Bank Nominees Limited.
The Group‘s capital resources are presented in section 3 of this document and the Bank’s Individual Consolidated capital resources are presented in Appendix 1 to this document. The differences between the Group and the Bank are primarily due to:
• intangible assets held by entities that sit outside of the scope of the Bank’s Individual Consolidation that are included in the Group consolidation;
• reserves held by entities that sit outside of the scope of the Bank’s Individual Consolidation that are included in the Group consolidation;
• amounts included in the Bank’s results in relation to transactions with the Group’s securitisation vehicles which are eliminated on consolidation;
• the regulatory requirements governing the recognition of qualifying tier 2 capital instruments at the Group level, where issued by the Bank to entities outside the consolidated group; and
• a small impact from the risk weighted assets of these entities. As a result of these differences, the Group’s capital requirements at 30 September 2015 exceeded the Bank’s Individual Consolidated capital requirements. The following companies are securitisation vehicles established in connection with the Group’s securitisation programme. Although the share capital of these securitisation vehicles is not owned by the Group, these vehicles are included in the consolidated financial statements as they are controlled by the Group:
• Lanark Holdings Limited; • Lanark Trustees Limited; • Lanark Funding Limited; • Lanark Master Issuer PLC; • Lanark Options Limited; • Lannraig Holdings Limited; • Lannraig Funding Limited; • Lannraig Master Issuer PLC; and • Lannraig Trustees Limited.
There are no current or foreseen material practical or legal impediments to the transfer of capital resources or the repayment of liabilities between consolidated entities within the Group, with the exception of assets and liabilities of the Group’s securitisation vehicles which are not immediately available to other members of the Group.
4

1.4 Review and Challenge
These disclosures have been subject to internal verification and are reviewed by the Group’s Board Audit Committee on behalf of the Board. The disclosures have not been, and are not required to be, subject to independent external audit and do not constitute any part of the Group’s annual report & consolidated financial statements.
1.5 Summary of key capital ratios
Capital ratios are a measurement of a company’s financial strength and reflect the level of protection it holds against any unexpected losses. The key capital ratios under CRD IV for the Group are presented below. Prior year comparatives are also presented on a CRD IV basis. Table 1: Key ratios 2015 2014 Common Equity Tier 1 (“CET1”) ratio 13.2% 9.4% Tier 1 capital ratio 15.7% 11.0% Total capital ratio 18.9% 17.7% Leverage Ratio 7.1% 5.2% £m £m Risk Weighted Assets (£m) 18,227 18,645 Total Assets (£m) 38,705 37,392
Further details on the Group’s capital ratios, risk weighted assets and leverage ratio are presented in section 3 of this document. Required disclosures for the Bank are presented in Appendix 1.
1.5.1 Key matters arising during the year The following significant events, which had an impact on the Group’s capital and risk management, took place during the year ended 30 September 2015: Announcement of intention to demerge the Group from NAB NAB announced its intention to pursue a public market option of a demerger of approximately 75% of CYB Investments Limited and its subsidiaries to NAB shareholders and a sale of the balance by way of IPO (approximately 25%) to institutional investors. A detailed timetable was announced on 28 October 2015. Issue of additional capital The Group’s Common Equity Tier 1 (“CET 1”) ratio increased from 9.4% in September 2014 to 13.2% in September 2015. In December 2014, a capital restructure was completed to strengthen the Group’s capital base and ensure that the PRA’s prudential capital requirements continue to be met. As part of this restructure, the Group repaid £650m of Tier 2 capital in the form of subordinated loan debt and issued £350m of ordinary shares and £150m of CRD IV compliant Additional Tier 1 (“AT1”) perpetual capital notes to NAB Group. Between June and September 2015, the Group issued 2 ordinary shares at their nominal value of £0.10 per share and a premium of £670m as part of the preparation for the demerger and IPO. These actions led to a strengthening of the CET1 ratio. Further capital benefits from balance sheet optimisation resulted in a reduction in credit risk-weighted assets. These actions were partially offset by the impact of conduct charges incurred in the year.
5

2. Risk Management
Effective management of risk is a key capability for a successful financial services provider and is fundamental to the Group’s strategy. The Group identifies and manages risk as part of a risk management framework, which is the totality of systems, structures, policies, processes and people that identify, measure, evaluate, monitor, report and control or mitigate all internal and external sources of material risk (the "risk management framework"). The Group's risk management framework is intended to help to:
• identify, analyse and understand each of the material risks at all levels of the Group; • ensure that appropriate strategies, policies, effective controls and other mitigants are in place and operate
effectively; • provide reliable and meaningful risk information (i.e. reporting) to decision-makers; • ensure that there is adequate oversight of the risk profile and risk management framework; and • facilitate a proactive risk culture.
2.1 Risk control and management
2.1.1 Risk management framework The Group manages risk with a "three lines of defence" framework. The three lines of defence are the business units themselves, the risk function, and the internal audit team. The Group's approach to risk management is based on an overriding principle that a risk management capability must be embedded within business units to be effective. This overriding principle embodies the following concepts:
• commercial decisions should be made on the basis of proactive consideration of risk and the impact on customers;
• business managers should use the risk management framework, which assists in the balancing of risks and rewards;
• employees are responsible for risk management in their day-to-day activities; and • risk appetite is clearly defined and communicated to support decision making.
Chart 1: Risk management framework
Annual strategic planning and process, including risk appetite
Policies and standards
Identification,
assessment and management of
risk
Risk measurement
and modelling
Risk reporting
Risk events
Monitoring, oversight and independent assurance
People and risk governance
Within this context, control is exercised through a clearly defined delegation of authority, with communication and escalation channels throughout the organisation.
6

The first line of defence comprises the business units managing the risks associated with their activities. Each business line is responsible for:
• establishing risk settings, including establishing their risk framework and determining the risk parameters, triggers and thresholds based on understanding of the business objectives and the risk profile, and establishing a risk appetite to direct the future environment;
• identifying, measuring, assessing and controlling risks through the day-to-day activities of the business; • managing risks within the frameworks set by the second line of defence; and • establishing and maintaining a suite of procedures that guide the operations of the business in accordance
with the risk framework and Board-approved risk appetite.
The second line of defence encompasses dedicated risk functions who are responsible for ensuring that the risk and control environment is actively and appropriately managed through the provision of risk insight, appetite and oversight. The second line of defence:
• designs and overseas the risk management framework; • challenges, validates and endorses the risk settings; • develops and maintains policies, tools and processes for risk management; • oversees, monitors and challenges the first line of defence on risk-related activities; • defines minimum standards and oversees related consequence management undertaken by the first line of
defence; and • provides insight into the appropriateness of the portfolio of risks.
The third line of defence is the internal audit team, which provides independent assurance and reporting on the effectiveness of the risk management framework and internal control environment. The third line of defence is responsible for:
• preparing and updating the scope of the annual Internal Audit Plan presented to the Board Audit Committee (“BAC”), with regular quarterly updates provided;
• preparing periodic Internal Audit reports on the effectiveness of the risk management and internal control environment including annual internal attestations of compliance with regulatory requirements (where necessary), and other relevant matters;
• reporting to the BAC on the adequacy and effectiveness of the Group’s risk management framework; and • meeting privately, on at least an annual basis, with the BAC without management present.
2.1.2 Risk culture Establishing and maintaining an appropriate risk culture within the Group is a key objective. Culture is shaped by many aspects including tangible components such as: the Group's code of conduct; operating principles; policies; standards; the risk management framework; and an approved articulation of risk appetite that aligns to, and supports, the strategic objectives of the Group. The Group strives to instil a culture that supports compliance with all relevant laws, codes and policies and fulfils customer needs. Important aspects of that culture are the establishment of effective risk governance, a sound risk appetite framework, clearly defined enterprise behaviour and compensation practices that promote appropriate risk taking behaviour and provide fair treatment for Customers. Initiatives that support an appropriate risk culture include: the performance management framework, which incorporates an assessment of factors including risk management, behaviour and a transparent compliance gateway rating; training; and escalation procedures (both through the management hierarchy and anonymously through the Group's whistle-blower facility) allowing staff to raise concerns; messaging from the Chief Executive Officer (“CEO”) and members of the Clydesdale and Yorkshire Bank Leadership Team (“Leadership Team”), which has been delegated authority by the CEO. Another key supporting element of risk culture is the Group’s Conduct Framework that includes a product governance model, a fairness model underpinned by fairness standards, conduct education and awareness for staff and the provision of relevant management information to executive level and Board. The Board and senior management are responsible for providing a clear view of risk culture through their actions and words, and proactively address any identified areas of weakness or concern. They must ensure:
7

• all employees understand and adhere to the core components of the risk management framework; and • failures in risk culture, either internal or external, are reviewed at all levels of the organisation and are seen
as an opportunity to strengthen our risk culture and make it more robust.
Underpinning the risk management framework, and at the heart of the Group's risk culture, is the concept of personal accountability for risk management at source. This is enabled through a risk management accountability model (which articulates specific accountabilities for core elements of risk management) and a formal delegation framework through which staff are able to make risk-based decisions.
2.1.3 Strategic planning and risk appetite ‘Risk Appetite’ is defined as the level and types of risk the Group is willing to assume within the boundaries of its risk capacity to achieve its strategic objectives. The Board formally approve the Group's Risk Appetite Statement (“RAS”), as part of the strategic planning process. Tolerances for appropriate levels of risk for each category, as well as the other risks to which the Group is exposed, are set regularly through the RAS process. More broadly, the RAS articulates and helps communicate risk appetite, incorporating the broad direction of risk taking activity; physical capital available; limits on capital use; and quantitative and qualitative measures put in place to restrict or moderate risk taking activities. An understanding of risk appetite, and its overarching tone, provides direction to the level of risk the Group is prepared to take which is ultimately reflected in changes to the Group’s risk profile. As such it operates as a defence against excessive risk taking beyond the Board approved appetite thresholds and supports the delivery of the Group's strategic initiatives. To further embed Risk Appetite 'top down’ through the organisation, individual business units have supporting Risk Setting Statements (“RSS”) and Key Risk Indicators. RSSs are supplementary measures which are Business Unit specific and are linked to RAS settings, support the Group's strategy and drive management decisions. Monthly reporting to Asset & Liability Committee (“ALCO”), Risk Committee, and the Board includes details of performance against relevant RAS and RSS settings (breaches and trends). Key capital ratios are summarised within section 1.5.
2.2 Principal Risks
The Group identifies the following material risk categories as those to which it has the most significant actual or potential exposure: credit risk, operational risk, conduct risk, regulatory risk, compliance risk, balance sheet and liquidity risk, market risk, defined benefit pension risk and strategic risk.
2.2.1 Credit risk Definition Credit risk is the potential that a customer or counterparty will fail to meet its obligations to the Group in accordance with agreed terms and arises from both the Group's lending activities and treasury operations, including hedging activities. Principal risks Credit risk manifests itself in the financial instruments/products that the Group offers, and those in which the Group invests (including, among others, loans, guarantees, letters of credit, acceptances, inter-bank transactions, foreign exchange transactions, swaps and bonds). Credit risk can be found both on and off-balance sheet, with the majority being on-balance sheet exposure. Credit risk arises in relation to the processes by which the Group assesses the credit quality of customers, which requires subjective judgments, including forecasts of how changing macro-economic factors may affect customers' ability to repay loans. The overall credit profile of the Group's borrowers may be adversely affected by a range of factors, including increased unemployment, lowered asset values (particularly in the property market), lowered
8
consumer spending, increased customer indebtedness, increased insolvency levels, reduced business profits, increased interest rates and/or higher default rates.
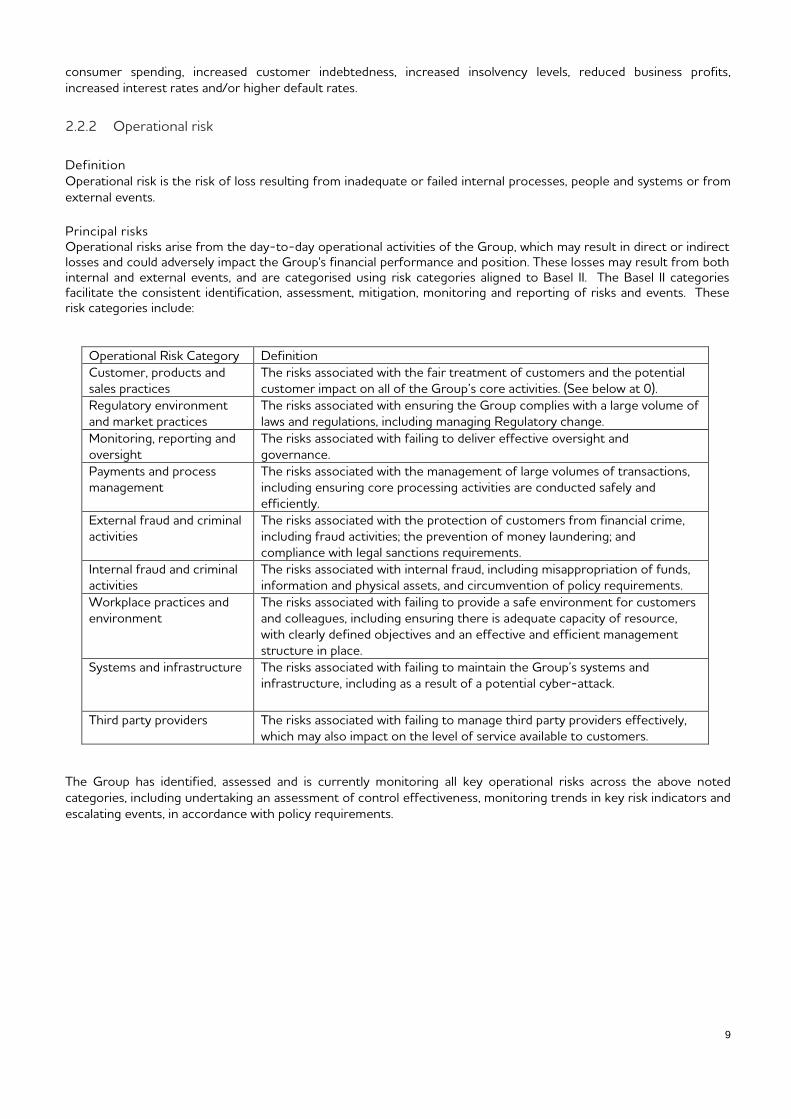
2.2.2 Operational risk Definition Operational risk is the risk of loss resulting from inadequate or failed internal processes, people and systems or from external events. Principal risks Operational risks arise from the day-to-day operational activities of the Group, which may result in direct or indirect losses and could adversely impact the Group's financial performance and position. These losses may result from both internal and external events, and are categorised using risk categories aligned to Basel II. The Basel II categories facilitate the consistent identification, assessment, mitigation, monitoring and reporting of risks and events. These risk categories include:
Operational Risk Category Definition Customer, products and sales practices
The risks associated with the fair treatment of customers and the potential customer impact on all of the Group’s core activities. (See below at 0).
Regulatory environment and market practices
The risks associated with ensuring the Group complies with a large volume of laws and regulations, including managing Regulatory change.
Monitoring, reporting and oversight
The risks associated with failing to deliver effective oversight and governance.
Payments and process management
The risks associated with the management of large volumes of transactions, including ensuring core processing activities are conducted safely and efficiently.
External fraud and criminal activities
The risks associated with the protection of customers from financial crime, including fraud activities; the prevention of money laundering; and compliance with legal sanctions requirements.
Internal fraud and criminal activities
The risks associated with internal fraud, including misappropriation of funds, information and physical assets, and circumvention of policy requirements.
Workplace practices and environment
The risks associated with failing to provide a safe environment for customers and colleagues, including ensuring there is adequate capacity of resource, with clearly defined objectives and an effective and efficient management structure in place.
Systems and infrastructure The risks associated with failing to maintain the Group’s systems and infrastructure, including as a result of a potential cyber-attack.
Third party providers The risks associated with failing to manage third party providers effectively, which may also impact on the level of service available to customers.
The Group has identified, assessed and is currently monitoring all key operational risks across the above noted categories, including undertaking an assessment of control effectiveness, monitoring trends in key risk indicators and escalating events, in accordance with policy requirements.
9

Conduct risk
Definition This is the risk that the Group’s operating model, culture or actions result in unfair outcomes for customers. Principal risks Conduct risk is managed on a day-to-day basis and is a principal focus of the Board, senior management and regulators, and the Group seeks to ensure customers are treated fairly, products are designed and sold to meet their needs, customer expectations are met and complaints are dealt with effectively and fairly. The Group is exposed to many forms of conduct risk, which may arise in a number of ways. In particular:
• The Group’s current or past business may be determined by its regulators, including the Financial Conduct Authority (“FCA”), the PRA, the Payment Systems Regulator, HM Treasury, the Financial Ombudsman Service (“FOS”), the Competition & Markets Authority or the courts, as not being conducted in accordance with applicable local or, potentially, overseas laws or regulations, or, in the case of the FOS, with what is fair and reasonable in the Ombudsman's opinion. If the Group fails to comply with any relevant regulations, there is a risk of an adverse impact on its business and reputation due to sanctions, fines or other actions imposed by the regulatory authorities. In particular, regulatory and/or other developments in respect of Payment Protection Insurance (“PPI”) and interest rate hedging products have had, and are likely to continue to have, a material impact on the Group’s business;
• The Group may be subject to further allegations of mis-selling of financial products, including as a result of having sales practices and/or reward structures in place that are determined to have been inappropriate, which may result in disciplinary action (including significant fines) or requirements to amend sales processes, withdraw products or provide restitution to affected customers, any or all of which could result in significant costs, which may require provisions to be recorded in the Group’s financial statements and could adversely impact future revenues from affected products; and
• The Group may be liable for damages to third parties harmed by the manner in which the Group has conducted one or more aspects of its business.
As part of the planned demerger, it is proposed that NAB and the Group will enter into the conduct indemnity deed under which NAB will agree, subject to certain limitations, to provide the Group with an indemnity in respect of certain historic conduct liabilities up to the capped indemnity amount. Further detail on the conduct indemnity deed and capped indemnity amount is available in the Report of the Directors within the annual report & consolidated financial statements for the year ended 30 September 2015.
2.2.3 Regulatory risk Definition Regulatory risk consists of regulatory strategy and change risk and regulatory relationship risk. Regulatory strategy and change risk is the risk of failing to identify and monitor changes in the regulatory environment and of failing to take opportunities to help shape the development of emerging legislative frameworks and/or to effectively implement the required changes. Regulatory relationship risk is the risk of damaging the Group's relationship with regulators through non-compliance with regulatory requirements, not keeping regulators informed of relevant issues impacting (or which may potentially impact) the Group, and not meeting the information requests and review findings of regulators, by providing incorrect or inadequate information, not meeting regulatory deadlines or obstructing the regulator from fulfilling its role. Principal risks The Group is exposed to various forms of regulatory risk in its operations, including:
• that certain aspects of its business may be determined by the relevant legal or regulatory authorities or the courts not to have been conducted in compliance with applicable law or regulation or the terms of relevant licences, permissions or supervisory requirements;
• risks relating to conduct related liabilities, including the possibility of mis-selling financial products or mishandling complaints related to the sale of such products by or attributed to the Group's employees,
10

resulting in disciplinary action or requirements to amend sales processes, withdraw products or provide restitution to affected customers;
• the possibility that products are improperly designed and/or do not operate as expected or designed not in compliance with applicable law, regulation or supervisory requirements leading to their withdrawal and resulting in disciplinary action or requirements to provide restitution to affected customers and a need to re-design such products;
• the high level of scrutiny of the treatment of customers by financial institutions from regulatory bodies, the press and politicians;
• liability for damages to third parties harmed by the conduct of its business; • the risk of regulatory proceedings and private litigation, arising out of regulatory investigations, enforcement
actions or otherwise; and • non-compliance with regulatory and statutory reporting requirements.
2.2.4 Compliance risk Definition Compliance risk is the risk of failing to understand and comply with relevant laws, regulations, licence conditions, supervisory requirements, self-regulatory industry codes of conduct and voluntary initiatives, as well as internal policies, standards, procedures and frameworks. Compliance risk incorporates financial crime risk, which includes risks relating to money laundering, terrorism financing, bribery and corruption and sanctions and embargoes. Principal risks Compliance risk is inherent in doing business in the financial industry, and may arise from:
• failure to design and implement and comply with operational arrangements, systems and controls that achieve legal and regulatory compliance;
• failure to design and operate and follow systems and controls to maintain compliance with prudential requirements;
• financial markets activity that is inappropriate and/or does not comply with regulatory requirements; and • failure to establish and maintain effective systems and controls to prevent the risk that the Group might be
used to further financial crime, including money laundering, counter-terrorism financing, sanctions, and bribery and corruption.
2.2.5 Balance sheet and liquidity risk Definition Balance sheet and liquidity risk is the risk that the Group is unable to meet its current and future financial obligations as they fall due at acceptable cost. These obligations include the repayment of deposits on demand or at their contractual maturity dates, the repayment of borrowings and loan capital as they mature, the payment of operating expenses and tax, the payment of dividends and the ability to fund new and existing loan commitments. Principal risks The Group faces balance sheet and liquidity risk in its ability to meet intra-day collateral requirements in relation to clearing and settlement obligations, its ability to meet its refinancing requirements for a predefined period (including the potential impact of undrawn commitments) and the liquidity risk profile of its balance sheet to accommodate the Group's strategic plan and associated risk appetite. The Group faces the risk that its funding needs may increase and that its funding structure may not continue to be efficient, giving rise, in both cases, to a requirement to raise other forms of funding (e.g. wholesale).
2.2.6 Market risk Definition Market risk is the risk associated with adverse changes in the fair value of positions held by the Group as a result of movement in market factors such as interest rates, foreign exchange rates, volatility and credit spreads. Structural interest rate risk Definition
11

Structural interest rate risk comprises the sensitivity of the Group's current and future net interest income to movements in market interest rates. Principal risks In the Group's activities, the main market risk arises from interest rate levels and the related volatility and basis risk. There are three major contributors to interest rate risk:
• the investment of non-interest-bearing deposits and equity into interest-bearing assets; • the mismatch between repricing dates of interest-bearing assets and liabilities ("mismatch risk"); and • the inability of the pricing 'basis' for asset and liability products to be replicated in the financial markets
("basis risk").
In the retail banking business, interest rate risk arises from the different re-pricing characteristics of assets and liabilities. Interest rates affect the cost and availability of the Group's sources of funding, product margins and, in turn, net interest margin and revenue. Interest rates also affect net interest income, impairment levels and customer affordability. The interest rate levels of interest rate swaps also affect the returns achieved on certain investments. Foreign exchange risk Definition Foreign exchange risk exposures arise as a result of future cash flows being converted to pounds sterling (“GBP”) at a rate different to that prevailing at the time of the original transaction. Principal risks The Group's primary foreign exchange exposure arises from the Group's business conducted outside of the UK and its transactions with customers, banks and other counterparties in different currencies, most frequently the Euro and the US dollar, and its business may be affected by a change in currency exchange rates or change in the reserve status of these currencies. The Group prepares and presents its financial statements in GBP, and therefore any fluctuations in GBP as compared to other currencies, in particular the Euro and US dollar, might affect the carrying value of non-GBP denominated assets and liabilities and the reported profit (or loss) incurred on non-GBP denominated transactions.
2.2.7 Defined benefit pension risk Definition Defined benefit pension risk is the risk that, at any point in time, the available assets to meet pension liabilities are at a value below current and future scheme obligations. Principal risks The Group has funding obligations for its defined benefit occupational pension schemes. Defined benefit pension risk arises from the risk that the returns from the schemes' assets, together with ongoing employer and member contributions, will be insufficient to cover the projected obligations of the scheme over time. The return on assets varies with movements in equity prices, interest rates, property prices and the value of other assets. The projection of the schemes' obligations includes estimates of mortality, inflation and future salary rises, and discount factors; the actual outturn of which may differ from the estimates. The schemes are also exposed to possible changes in pension legislation.
2.2.8 Strategic risk Definition Strategic risk is the risk of significant loss or damage arising from business decisions that impact the long-term interests of the Group's stakeholders or from an inability to adapt to external developments. Principal risks Strategic risk can arise if the Group designs and/or implements an inappropriate strategic plan, designs an appropriate plan but fails to implement it and/or implements the strategic plan as intended however external circumstances change (e.g. CMA review on competition, regulatory impositions, competitor actions) and anticipated growth outcomes are not achieved.
12

The risk of the Group failing to execute its strategy and generating an unsustainable business model is contemplated as part of the Board's Risk Profile. The Group understands that this could be due to the Group's inability to respond to cultural, structural and regulatory changes that need to be made; failure to establish and execute a compelling digital strategy and platform and/or increase organisational capability (through investment); an inappropriate governance framework or it not operating as designed; inadequate product, portfolio or pricing decisions; and/or being an inefficient, high cost, uninspiring and/or uncompetitive provider of product and service.
2.3 Risk Governance
The Group’s risk governance structure strengthens risk evaluation and management, while also positioning the Group to manage the changing regulatory environment in an efficient and effective manner. The oversight of the risk governance structure is facilitated by the Board which approves the Board’s Risk Committee’s overall governance, risk and control frameworks and risk appetite. This risk and control framework was comprehensively reviewed following the FSA's (now the FCA's) skilled persons review in 2012-2013 and is continually reviewed for new risks and developments. Additional oversight of risk appetite is provided by the Board's Risk Committee. The table below details the Group's board and management risk reporting structure for the year and as at 30 September 2015.
Chart 2: Governance Committee Framework
13

2.4 The Board and Governance
The number of directorships held by Executive and Non-Executive Directors who served on the Board of the Company during the year are shown below1. In line with the relevant rules2, directorships in organisations which don’t pursue predominantly commercial objectives have been excluded. In addition, where a Director has a number of directorships within one group these are counted as a single directorship.
Table 2: Directorships Held
Name Directorships Held
James Pettigrew3 5 David Duffy 1 Debbie Crosbie 2 Ian Smith 2 Richard Gregory 2 David Allvey 3 Adrian Grace 2 David Browne 2 Barbara Ridpath 1 Teresa Robson-Capps 3 Alex Shapland 3 Richard Sawers 4
Board Diversity
In the normal course the Board's Governance & Nomination Committee leads the process for the appointment of Directors and makes appointment recommendations to the Board based on merit, against objective criteria (set out in a role profile agreed by the Committee) and with due regard to the benefits of diversity on the Board. Once the selection process is completed, the Governance & Nomination Committee meets to agree to recommend the appointment of the prospective Director to the Board. The Board resolves to approve the appointment in accordance with the company’s articles. The Group plays an important role in the lives of many different people from diverse backgrounds. Customers are from all walks of life and the Group strives to give them high quality customer service every day, from a workforce that represents the communities in which we live and work. Recognising ‘diversity of thought’ and valuing differences amongst the Group’s employees is a key way to achieve this. The Group is therefore committed to sustaining an inclusive culture that allows every employee to reach their full potential at the various stages of their lives and careers. This commitment to attract, develop and retain talented people from all life stages and from diverse backgrounds (including gender diversity) also applies to the Board. The Board currently includes three female members, 23% of its total composition. Board Committees Board oversight of risk management and financial control is facilitated by the Board Risk and Audit Committees. The Board approves the Group’s overall governance, risk and control frameworks and risk appetite. Refer to the Group’s Corporate Governance statement on the Group’s website (www.cbonline.co.uk) for further information on Board committees. The Board Risk Committee is responsible for providing oversight and advice to the Board in relation to current and potential future risk exposures of the Group and future risk strategy, reviewing and approving various formal reporting requirements, promoting a risk awareness culture within the Group and ensuring that the Group's strategy,
1 On 22 October 2015 David Bennett was appointed to the Board. 2 PRA Rulebook 'General Organisational Requirements' 5.5 (having regard to General Organisational Requirements 5.6) and Senior Management Arrangements, Systems and Controls (SYSC) 4.3A.6R (having regard to SYSC 4.3A.7R.). 3 During the year the Prudential Regulation Authority and the Financial Conduct Authority jointly approved a modification of General Organisation Requirements 5.5 and SYSC 4.3A.6R in relation to Mr Pettigrew’s directorship portfolio, effective until 1 July 2016. The modification is published on the Financial Services Register.
14
principles, policies and resources are aligned to its risk appetite, as well as to regulatory and industry best practices. The Board Risk Committee's reporting obligations are set out in the Board Risk Committee Charter and include the requirement for the Committee, through the Committee Chairman or his nominee, to report to the Board, at the earliest possible Board meeting after each Committee meeting, any matters that should be brought to the attention of the Board including:
• any recommendations requiring Board approval and/or action such as the RAS, the Board’s Risk Profile orrisk-related limits and policies; and
• any other issues on which the Board has requested the Committee’s opinion or the Committee believesshould be brought to the attention of the Board, including any recommendations requiring approval oraction.
During FY2015 the Board Risk Committee met eight times in the period which includes five business as usual meetings of the committee, two joint meetings with the BAC and one joint meeting with the NAB Principal Board Risk Committee.
The BAC assists the Board in discharging its responsibilities with regard to financial reporting, external and internal audits and controls, including reviewing the Group's annual report & consolidated financial statements, reviewing and monitoring the extent of the non-audit work undertaken by external auditors, advising on the appointment of external auditors and reviewing the effectiveness of the Group's internal audit activities, internal controls and risk management systems. It focuses in particular on compliance with accounting policies and ensuring that an effective system of internal financial control is maintained. The ultimate responsibility for reviewing and approving the annual report & consolidated financial statements and the half-yearly reports remains with the Board.
A Board level Remuneration Committee was set up in 2015, which assists the Board in determining its responsibilities in relation to remuneration, including making recommendations to the Board on the application of Group policy for executive remuneration, determining the individual remuneration and benefits package of each of the executive directors, including pension rights and any compensation payments and determining the remuneration arrangements of senior management below Board level.
Risk Disclosure Statement As at 30 September 2015, the Board is satisfied that the risk management arrangements for providing assurance and risk management systems in place are adequate and appropriate for the Group’s risk profile and strategy.
Governance Committees On the 8 October 2015 the CEO announced that the ‘Executive Committee’ would be renamed ‘Clydesdale and Yorkshire Bank Leadership Team’, the wider committee structure is also subject to review and change, the outcomes of which, will be reported in future periods.
The table below details the Group’s Management Governance and Management Assurance Committees and their risk focus during the year to 30 September 2015. The following Executive Governance Committees have been established under the authority of the CEO.
15
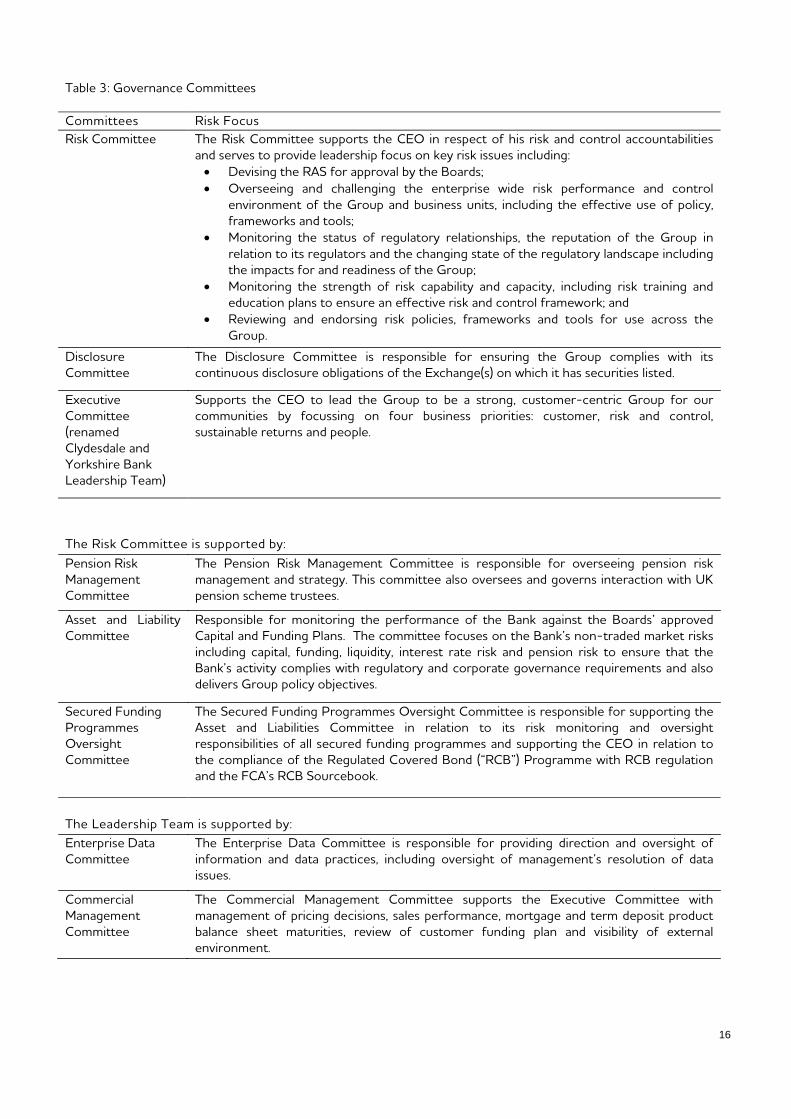
Table 3: Governance Committees Committees Risk Focus Risk Committee The Risk Committee supports the CEO in respect of his risk and control accountabilities
and serves to provide leadership focus on key risk issues including: • Devising the RAS for approval by the Boards; • Overseeing and challenging the enterprise wide risk performance and control
environment of the Group and business units, including the effective use of policy, frameworks and tools;
• Monitoring the status of regulatory relationships, the reputation of the Group in relation to its regulators and the changing state of the regulatory landscape including the impacts for and readiness of the Group;
• Monitoring the strength of risk capability and capacity, including risk training and education plans to ensure an effective risk and control framework; and
• Reviewing and endorsing risk policies, frameworks and tools for use across the Group.
Disclosure Committee
The Disclosure Committee is responsible for ensuring the Group complies with its continuous disclosure obligations of the Exchange(s) on which it has securities listed.
Executive Committee (renamed Clydesdale and Yorkshire Bank Leadership Team)
Supports the CEO to lead the Group to be a strong, customer-centric Group for our communities by focussing on four business priorities: customer, risk and control, sustainable returns and people.
The Risk Committee is supported by: Pension Risk Management Committee
The Pension Risk Management Committee is responsible for overseeing pension risk management and strategy. This committee also oversees and governs interaction with UK pension scheme trustees.
Asset and Liability Committee
Responsible for monitoring the performance of the Bank against the Boards’ approved Capital and Funding Plans. The committee focuses on the Bank’s non-traded market risks including capital, funding, liquidity, interest rate risk and pension risk to ensure that the Bank’s activity complies with regulatory and corporate governance requirements and also delivers Group policy objectives.
Secured Funding Programmes Oversight Committee
The Secured Funding Programmes Oversight Committee is responsible for supporting the Asset and Liabilities Committee in relation to its risk monitoring and oversight responsibilities of all secured funding programmes and supporting the CEO in relation to the compliance of the Regulated Covered Bond (“RCB”) Programme with RCB regulation and the FCA’s RCB Sourcebook.
The Leadership Team is supported by: Enterprise Data Committee
The Enterprise Data Committee is responsible for providing direction and oversight of information and data practices, including oversight of management’s resolution of data issues.
Commercial Management Committee
The Commercial Management Committee supports the Executive Committee with management of pricing decisions, sales performance, mortgage and term deposit product balance sheet maturities, review of customer funding plan and visibility of external environment.
16
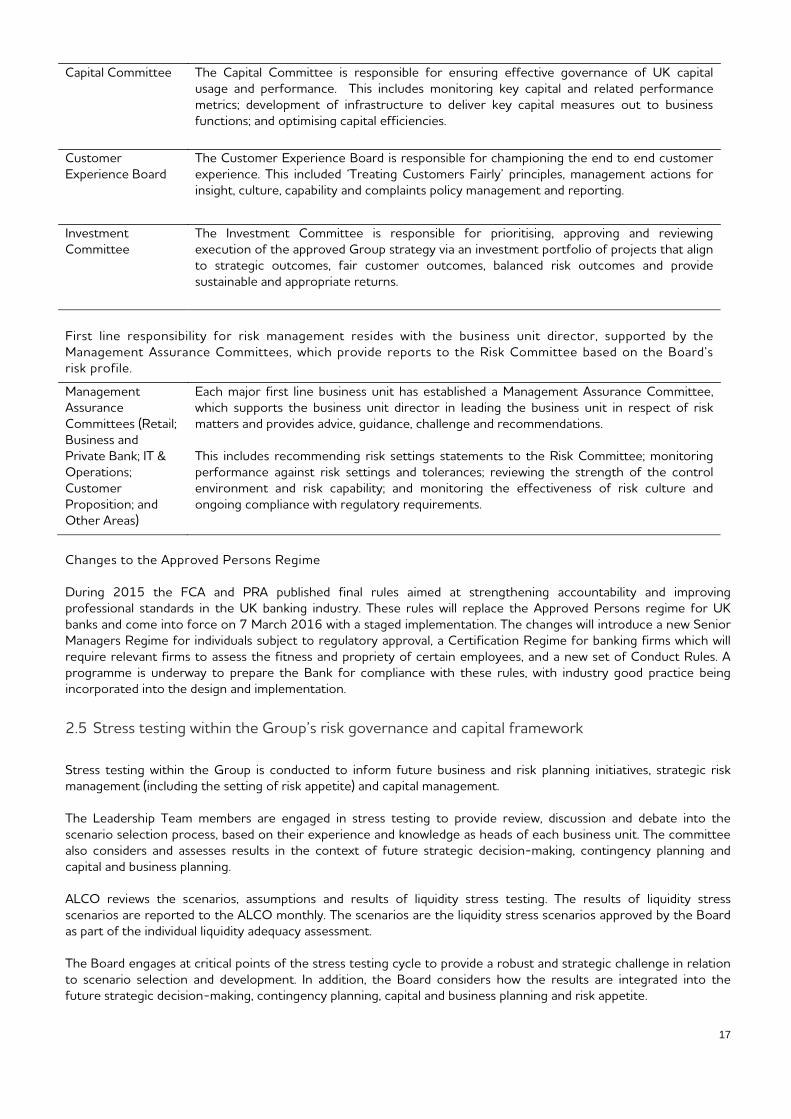
Capital Committee The Capital Committee is responsible for ensuring effective governance of UK capital usage and performance. This includes monitoring key capital and related performance metrics; development of infrastructure to deliver key capital measures out to business functions; and optimising capital efficiencies.
Customer Experience Board
The Customer Experience Board is responsible for championing the end to end customer experience. This included ‘Treating Customers Fairly’ principles, management actions for insight, culture, capability and complaints policy management and reporting.
Investment Committee
The Investment Committee is responsible for prioritising, approving and reviewing execution of the approved Group strategy via an investment portfolio of projects that align to strategic outcomes, fair customer outcomes, balanced risk outcomes and provide sustainable and appropriate returns.
First line responsibility for risk management resides with the business unit director, supported by the Management Assurance Committees, which provide reports to the Risk Committee based on the Board’s risk profile.
Management Assurance Committees (Retail; Business and Private Bank; IT & Operations; Customer Proposition; and Other Areas)
Each major first line business unit has established a Management Assurance Committee, which supports the business unit director in leading the business unit in respect of risk matters and provides advice, guidance, challenge and recommendations.
This includes recommending risk settings statements to the Risk Committee; monitoring performance against risk settings and tolerances; reviewing the strength of the control environment and risk capability; and monitoring the effectiveness of risk culture and ongoing compliance with regulatory requirements.
Changes to the Approved Persons Regime
During 2015 the FCA and PRA published final rules aimed at strengthening accountability and improving professional standards in the UK banking industry. These rules will replace the Approved Persons regime for UK banks and come into force on 7 March 2016 with a staged implementation. The changes will introduce a new Senior Managers Regime for individuals subject to regulatory approval, a Certification Regime for banking firms which will require relevant firms to assess the fitness and propriety of certain employees, and a new set of Conduct Rules. A programme is underway to prepare the Bank for compliance with these rules, with industry good practice being incorporated into the design and implementation.
2.5 Stress testing within the Group’s risk governance and capital framework
Stress testing within the Group is conducted to inform future business and risk planning initiatives, strategic risk management (including the setting of risk appetite) and capital management.
The Leadership Team members are engaged in stress testing to provide review, discussion and debate into the scenario selection process, based on their experience and knowledge as heads of each business unit. The committee also considers and assesses results in the context of future strategic decision-making, contingency planning and capital and business planning.
ALCO reviews the scenarios, assumptions and results of liquidity stress testing. The results of liquidity stress scenarios are reported to the ALCO monthly. The scenarios are the liquidity stress scenarios approved by the Board as part of the individual liquidity adequacy assessment.
The Board engages at critical points of the stress testing cycle to provide a robust and strategic challenge in relation to scenario selection and development. In addition, the Board considers how the results are integrated into the future strategic decision-making, contingency planning, capital and business planning and risk appetite.
17

Specifically, stress testing is used or considered in informing the following management decisions:
• Risk appetite and strategic business planning - As part of an annual assessment of future opportunities for,and threats to, the Group, stress testing outputs are used to inform the strategic planning process and todevelop risk posture and risk appetite settings.
• Capital planning (“ICAAP”) - Stress testing informs the assessment and quantification of risk exposures in thecourse of calculating capital requirements as part of the ICAAP process.
• Liquidity management (“ILAAP”) - Scenarios provide insight into potential vulnerabilities in the Group’sfunding strategies. Regular stress tests are undertaken to understand and monitor exposure to liquidity riskwith their regularity being aligned to the nature of, and exposure to, the risk type.
• Recovery plan (“RP”) - the RP (including the Contingency Funding Plan) helps inform both stress testing andreverse stress testing scenario development. Reverse stress testing explores circumstances, or a set ofcircumstances, that render the Group's business model unviable, moving the Group into a resolution by theauthorities. As a result, these stresses are recognised as a required risk management tool in the form of anearly warning indicator of potential stress events.
18
3. Capital Resources
3.1 Own Funds
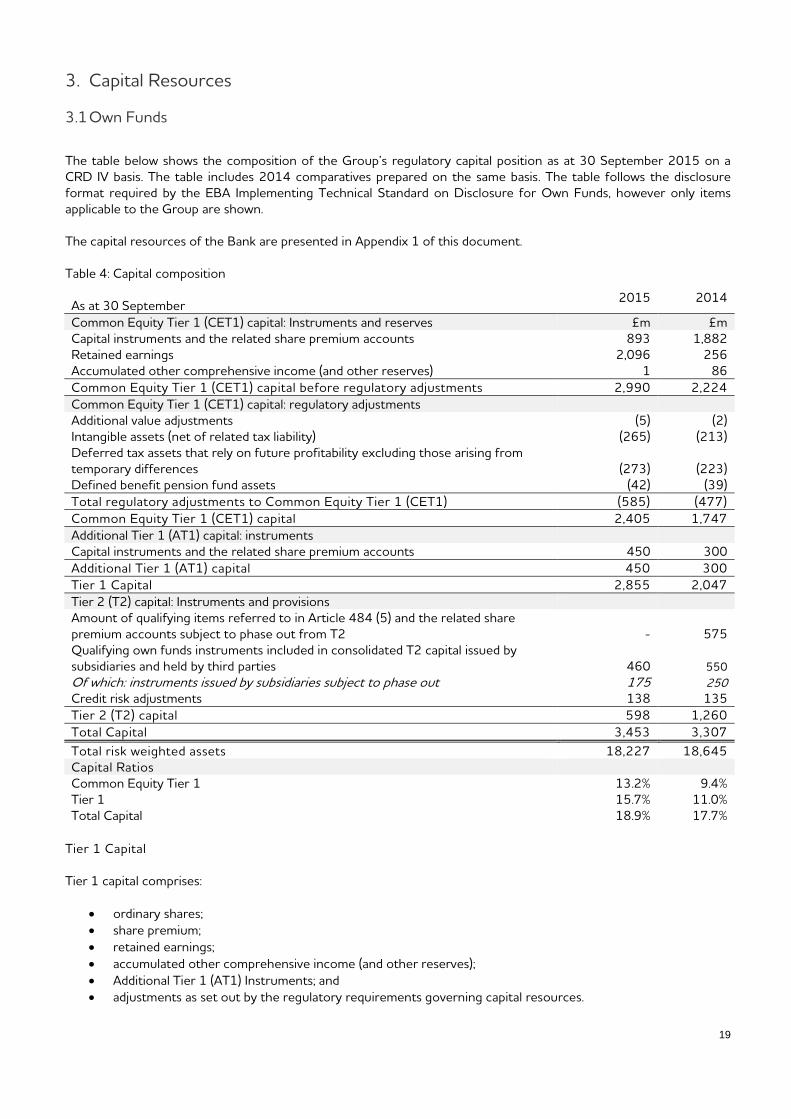
The table below shows the composition of the Group’s regulatory capital position as at 30 September 2015 on a CRD IV basis. The table includes 2014 comparatives prepared on the same basis. The table follows the disclosure format required by the EBA Implementing Technical Standard on Disclosure for Own Funds, however only items applicable to the Group are shown.
The capital resources of the Bank are presented in Appendix 1 of this document.
Table 4: Capital composition
As at 30 September 2015 2014
Common Equity Tier 1 (CET1) capital: Instruments and reserves £m £m Capital instruments and the related share premium accounts 893 1,882 Retained earnings 2,096 256 Accumulated other comprehensive income (and other reserves) 1 86 Common Equity Tier 1 (CET1) capital before regulatory adjustments 2,990 2,224 Common Equity Tier 1 (CET1) capital: regulatory adjustments Additional value adjustments (5) (2) Intangible assets (net of related tax liability) (265) (213) Deferred tax assets that rely on future profitability excluding those arising from temporary differences (273) (223) Defined benefit pension fund assets (42) (39) Total regulatory adjustments to Common Equity Tier 1 (CET1) (585) (477) Common Equity Tier 1 (CET1) capital 2,405 1,747 Additional Tier 1 (AT1) capital: instruments Capital instruments and the related share premium accounts 450 300 Additional Tier 1 (AT1) capital 450 300 Tier 1 Capital 2,855 2,047 Tier 2 (T2) capital: Instruments and provisions Amount of qualifying items referred to in Article 484 (5) and the related share premium accounts subject to phase out from T2 - 575 Qualifying own funds instruments included in consolidated T2 capital issued by subsidiaries and held by third parties 460 550 Of which: instruments issued by subsidiaries subject to phase out 175 250 Credit risk adjustments 138 135 Tier 2 (T2) capital 598 1,260 Total Capital 3,453 3,307 Total risk weighted assets 18,227 18,645 Capital Ratios Common Equity Tier 1 13.2% 9.4% Tier 1 15.7% 11.0% Total Capital 18.9% 17.7%
Tier 1 Capital
Tier 1 capital comprises:
• ordinary shares;• share premium;• retained earnings;• accumulated other comprehensive income (and other reserves);• Additional Tier 1 (AT1) Instruments; and• adjustments as set out by the regulatory requirements governing capital resources.
19
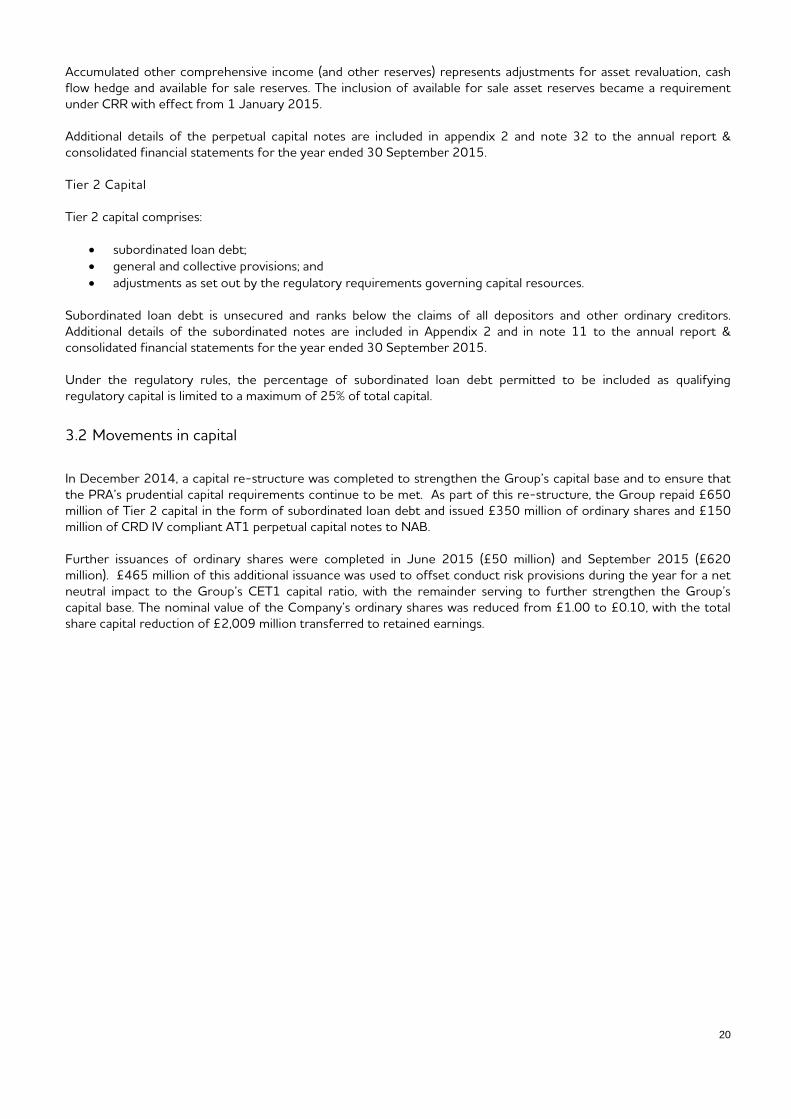
Accumulated other comprehensive income (and other reserves) represents adjustments for asset revaluation, cash flow hedge and available for sale reserves. The inclusion of available for sale asset reserves became a requirement under CRR with effect from 1 January 2015. Additional details of the perpetual capital notes are included in appendix 2 and note 32 to the annual report & consolidated financial statements for the year ended 30 September 2015. Tier 2 Capital Tier 2 capital comprises:
• subordinated loan debt; • general and collective provisions; and • adjustments as set out by the regulatory requirements governing capital resources.
Subordinated loan debt is unsecured and ranks below the claims of all depositors and other ordinary creditors. Additional details of the subordinated notes are included in Appendix 2 and in note 11 to the annual report & consolidated financial statements for the year ended 30 September 2015. Under the regulatory rules, the percentage of subordinated loan debt permitted to be included as qualifying regulatory capital is limited to a maximum of 25% of total capital.
3.2 Movements in capital
In December 2014, a capital re-structure was completed to strengthen the Group’s capital base and to ensure that the PRA’s prudential capital requirements continue to be met. As part of this re-structure, the Group repaid £650 million of Tier 2 capital in the form of subordinated loan debt and issued £350 million of ordinary shares and £150 million of CRD IV compliant AT1 perpetual capital notes to NAB. Further issuances of ordinary shares were completed in June 2015 (£50 million) and September 2015 (£620 million). £465 million of this additional issuance was used to offset conduct risk provisions during the year for a net neutral impact to the Group’s CET1 capital ratio, with the remainder serving to further strengthen the Group’s capital base. The nominal value of the Company’s ordinary shares was reduced from £1.00 to £0.10, with the total share capital reduction of £2,009 million transferred to retained earnings.
20

Table 5: Capital flow statement 2015 2014
£m £m CET1 capital CET1 capital at 1 October 1,747 1,901 Share capital: ordinary share new issuance 350 300 Share premium 670 - Share capital: redenomination (2,009) - Retained earnings and other reserves 1,755 (193) Prudent valuation adjustment (3) 1 Intangible assets (52) 2 DTAs relying on future profitability (50) (223) Defined benefit pension fund assets (3) (39) Pension fund deficit adjustment - (2)
2,405 1,747 Tier 1 capital Tier 1 capital at 1 October 300 300 Share capital repurchased: perpetual non-cumulative preference shares - (100) Share capital repurchased : Hybrid Tier 1 Capital - (200) Share capital issued: Additional Tier 1 capital perpetual notes 150 300
450 300 Total Tier 1 capital 2,855 2,047 Tier 2 capital Tier 2 capital at 1 October 1,260 1,255 Subordinated debt repurchase (665) - Credit risk adjustments 3 (20) Asset revaluation reserve - (2) Excess Tier 2 Capital - 24 Qualifying and material holding Tier 2 deductions - 3
598 1,260
Total capital at 30 September 3,453 3,307
A number of deductions are applied in calculating regulatory capital under CRD IV. This includes deductions for: intangible assets, deferred tax assets that rely on future profitability of the bank to be realised, defined benefit pension funds assets, prudent valuation adjustments and certain investments in other financial institutions. The most significant of which are discussed further below:
• The IAS19 valuation of the Defined Benefit Pension Scheme is included in accounting reserves and thismeans that a deficit is also reflected in regulatory capital. However, if the scheme is in surplus, regulatoryrules do not permit this to contribute towards regulatory capital. At 30 September 2015, the IAS19 positionwas £52 million surplus. The deduction of £42 million represents this surplus less the associated deferredtax liabilities.
• Regulatory adjustments are also required in respect of DTAs that rely on future profitability and intangibleassets (computer software and other IT development which has been capitalised). At 30 September 2015,£273 million was deducted from CET1 capital in respect of DTAs and £265 million was deducted in respectof intangible assets.
Table 6 shows the capital position on a transitional CRD IV basis, comparing this against the end-point basis (as if CRD IV was fully in force and no transitional provisions applied). The end point CET1 and Tier 1 ratios remain at 13.2% and 15.7% (30 September 2014: 9.4% and 11%) as transitional provisions apply in full under the PRA rules the Group applies. For Tier 2 the difference is due to capital instrument grandfathering provisions which allow certain subordinated debt instruments to be eligible as capital during a transitional period on a phased basis (ending on 31 December 2021). This applies to £175m of subordinated debt instruments recognised as at 30 September 2015 (30 September 2014: £825m). In addition CRD IV brought in new requirements in relation to recognising qualifying Tier 2 capital instruments issued by a subsidiary to outside the consolidated group. The Bank has issued £300m of
21

Tier 2 capital to NAB. In applying the calculation under CRR article 87 the £300m cannot be fully recognised. Under CRD IV transitional rules, this is implemented on a phased basis (ending on 31 December 2017).
Table 6 : CRD IV end-point vs transitional comparison
Current Rules Full Impact As at 30 September 2015 2014 2015 2014
£m £m £m £m Common Equity Tier 1 (CET1) capital: Instruments and reserves Capital instruments and the related share premium accounts 893 1,882 893 1,882 Retained earnings 2,096 256 2,096 256 Accumulated other comprehensive income (and other reserves) 1 86 1 86 Common Equity Tier 1 (CET1) capital before regulatory adjustments 2,990 2,224 2,990 2,224 Common Equity Tier 1 (CET1) capital: regulatory adjustments Additional value adjustments (5) (2) (5) (2) Intangible assets (net of related tax liability) (265) (213) (265) (213) Deferred tax assets that rely on future profitability excluding those arising from temporary differences (273) (223) (273) (223) Defined benefit pension fund assets (42) (39) (42) (39) Total regulatory adjustments to Common Equity Tier 1 (CET1) (585) (477) (585) (477) Common Equity Tier 1 (CET1) capital 2,405 1,747 2,405 1,747 Additional Tier 1 (AT1) capital: instruments Capital instruments and the related share premium accounts 450 300 450 300 Additional Tier 1 (AT1) capital 450 300 450 300 Tier 1 Capital 2,855 2,047 2,855 2,047 Tier 2 (T2) capital: Instruments and provisions Amount of qualifying items referred to in Article 484 (5) and the related share premium accounts subject to phase out from T2 - 575 - - Qualifying own funds instruments included in consolidated T2 capital issued by subsidiaries and held by third parties 460 550 263 228 Of which: instruments issued by subsidiaries subject to phase out 175 250 - - Credit risk adjustments 138 135 138 135 Tier 2 (T2) capital 598 1,260 401 363 Total Capital 3,453 3,307 3,256 2,410 Total risk weighted assets 18,227 18,645 18,227 18,645 Capital Ratios Common Equity Tier 1 13.2% 9.4% 13.2% 9.4% Tier 1 15.7% 11.0% 15.7% 11.0% Total Capital 18.9% 17.7% 17.9% 12.9%
22

3.3 Reconciliation of Statutory Equity to Regulatory Capital
Table 7: Reconciliation of Statutory Equity to Regulatory Capital 2015 2014
As at 30 September £m £m Statutory Total Equity 3,443 2,538 Less pension regulatory adjustments (42) (39) Less other deductions from capital (270) (215) Less share option reserve (3) (2) Less available for sale reserve - (8) Less deferred tax assets relying on future profitability (273) (223) Less structured entities reserves - (4) Regulatory Tier 1 capital 2,855 2,047
3.4 Leverage Ratio
3.4.1 Management of excessive leverage
The risk of excessive leverage is the risk resulting from the Group’s vulnerability to leverage or contingent leverage that may require unintended corrective measures to the business plan, including distressed selling of assets which might result in losses or in valuation adjustments to the remaining assets.
The Leverage Ratio is monitored against a Board set RAS and with the responsibility of managing the ratio falling to ALCO, who monitor it on a monthly basis.
The Leverage Ratio is the ratio of Tier 1 capital to total exposure, defined as:
• capital: Tier 1 capital defined according to CRD IV on an end point basis (assuming the full impact of CRD IVrequirements on Tier 1 capital were in force with no transitional provisions).
• exposures: total on and off balance sheet exposures (subject to credit conversion factors) as defined in theDelegated Act amending CRR article 429 (Calculation of the Leverage Ratio), which includes deductionsapplied to Tier 1 capital.
Table 8: Leverage Ratio
As at 30 September 2015 2014 £m £m
Total Tier 1 capital for the leverage ratio Total Common Equity Tier 1 (CET1) capital 2,405 1,747 Additional Tier 1 (AT1) capital 450 300
Total Tier 1 2,855 2,047
Exposures for the leverage ratio Total statutory assets per the statement of financial position 38,705 37,392 Off balance sheet items 1,998 2,155 Derivative exposures adjustment 19 160 SFT exposures adjustment - 58 Other regulatory adjustments (585) (477)
Leverage ratio exposure 40,137 39,288
Leverage ratio 7.1% 5.2%
23

The Group’s leverage ratio is 7.1% which exceeds the Basel committees proposed minimum of 3%, applicable from 2018. The Group will continue to monitor closely the leverage ratio against emerging rules and minimum calibration.
Other regulatory adjustments consist of adjustments that are required under CRD IV to be deducted from Tier 1 capital. The removal of these from the exposure measure ensures consistency is maintained between the capital and exposure components of the ratio.
24

4. Capital Requirements
4.1 Capital Management
Capital is held by the Group to protect its depositors, to cover inherent risks in a normal and stressed operating environment and to support its business strategy against losses, inherent risks and stress events. In assessing the adequacy of its capital resources, the Group considers its risk appetite, the material risks to which it is exposed and the appropriate strategies required to manage those risks.
The Group manages capital in accordance with prudential rules set out under CRD IV, and relevant rules issued by the PRA and FCA. The Group is committed to maintaining a strong capital base and has complied with all capital requirements set by the regulators throughout the period.
As part of the Internal Capital Adequacy Assessment Process (“ICAAP”) the Board is required to consider the material risks to which the Group is exposed to determine whether additional capital needs to be held in respect of these risks to ensure that the Group is sufficiently well capitalised. The Group’s ICAAP supplements the Pillar 1 capital requirements (covering Credit Risk, Operational Risk, Counterparty Credit Risk and Market Risk) and is subject to a robust review, challenge and approval process by the Board before being submitted to the PRA.
The key risks assessed as part of the ICAAP include:
Risks not fully captured under Pillar 1 • credit concentration risk – credit concentration risk is the risk of the Group incurring losses as a result of
concentration of exposures to specific geographies, sectors or customers. • operational risk – the Group calculates Pillar 1 operational risk capital using the Standardised Approach.
However, an appropriate Pillar 2 add-on is determined using a more risk sensitive approach supported by modelling.
Risks not captured under Pillar 1 • interest rate risk in the banking book (“IRRBB”) – the risk from changes in Market Interest Rates that may
adversely affect the Group’s financial condition in terms of its earnings or the economic value of the balance sheet.
• Pension Risk – the risk arising from volatility in the Group’s Defined Benefit Pension Scheme.
A number of less material risks are considered, with an assessment of any capital that is required. The ICAAP also considers and assesses a wide range of other risks for which it is concluded that no additional capital is required to be held.
Stress Scenarios As part of the ICAAP, the Group’s forecast capital position is subject to stress testing to determine the impact on the Group’s position should a severe economic downturn materialise. These stress testing scenarios consider not only changes in the macroeconomic environment but also the key risks to, and vulnerabilities within, the Group’s business model. Stress testing scenarios are developed during workshops with representation from various business units including the second and third line. As part of these workshops changes in the macroeconomic and business environment are considered alongside the Group’s strategy and business model to develop scenarios which are severe, relevant and plausible.
The outputs of these stress tests are then used by the Board and PRA to determine the Capital Planning Buffer which the Group is required to maintain as mitigation against future stress scenarios.
The Capital Planning Buffer will be replaced by CRD IV buffers (Capital Conservation Buffer, and Systemic Risk Buffers) that transition in from 1 January 2016. Alongside the Countercyclical Buffer (which came in from 1 January 2015 and for UK exposures is currently set at 0%) these will provide the “floor” for Pillar 2B requirements, however the PRA will also make its own assessment and if this is higher than the combined CRD IV buffers then a PRA Buffer will apply. The PRA Buffer will be set using supervisory judgment informed by stress scenarios and other factors including leverage and systemic importance. The Bank of England (“BoE”) has published its approach to stress testing for the next three years until 2018, outlining an explicitly countercyclical approach and introducing a biennial exploratory scenario based on emerging threats to financial stability or individual banks. The framework will continue
25

to cover banks with total retail deposits greater than £50 billion (though the BoE will select the participants in the exploratory scenario based on the scenario itself.) The BoE will publish further information in due course on its approach to stress testing beyond 2018.
4.2 Minimum capital requirement
To determine minimum capital requirements under the CRD IV Framework, the Group applies the Standardised Approach to measure credit risk and the Standardised Approach for operational risk. Under the approach the Group calculates its Pillar 1 capital requirement based on 8% of total risk weighted assets (“RWAs”). The Group’s Pillar 1 capital requirements cover credit risk, operational risk, counterparty credit risk and credit valuation adjustment (“CVA”).
The table below shows the Group’s RWAs and capital requirements under Pillar 1.
Table 9: Pillar 1 Capital Requirements
As at 30 September 2015 2014 RWA Capital RWA Capital
Pillar 1 Capital Requirements £m £m £m £m Central Governments or Central Banks - - - - Regional Government or Local Authority 22 2 22 2 Public Sector Entities 3 - 3 - Multilateral Development Banks - - - - Institutions 222 18 224 18 Corporates 3,264 262 3,692 295 Retail 930 74 994 79 Secured by Mortgages on Immovable Property 10,862 869 10,552 845 Exposures in Default 427 34 611 49 Claims on Institutions and Corporates with a Short-Term Credit Assessment - - 3 - Claims in the Form of CIU 3 - 3 - Equity Exposures 16 1 12 1 Other Items 545 44 647 52 Total Credit Risk 16,294 1,304 16,763 1,341 Credit Counterparty Risk 138 11 181 14 Credit Valuation Adjustment 206 16 137 11 Operational Risk 1,589 127 1,564 125 Market Risk - - - -
18,227 1,458 18,645 1,491
The items included in the ‘Other’ exposure class that attract a capital charge include items in the course of collection, cash in hand, fixed assets and deferred tax assets that rely on future profitability.
26
5. Credit Risk
5.1 Credit risk overview
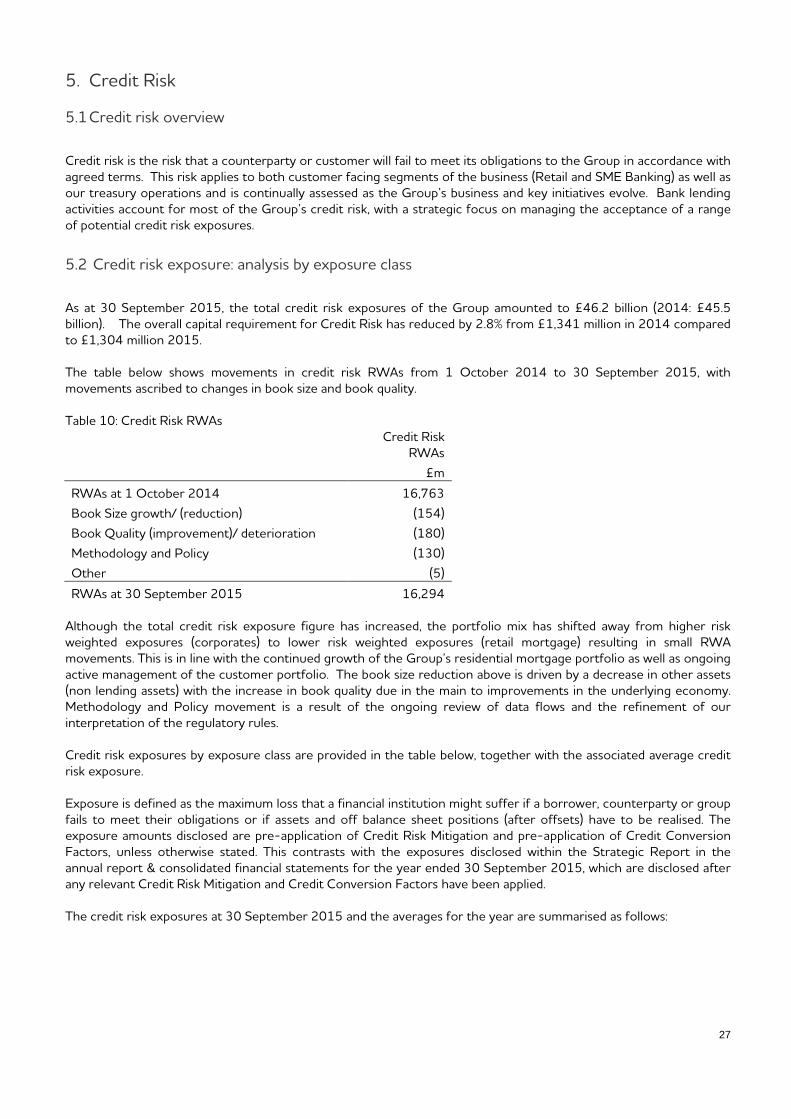
Credit risk is the risk that a counterparty or customer will fail to meet its obligations to the Group in accordance with agreed terms. This risk applies to both customer facing segments of the business (Retail and SME Banking) as well as our treasury operations and is continually assessed as the Group’s business and key initiatives evolve. Bank lending activities account for most of the Group’s credit risk, with a strategic focus on managing the acceptance of a range of potential credit risk exposures.
5.2 Credit risk exposure: analysis by exposure class
As at 30 September 2015, the total credit risk exposures of the Group amounted to £46.2 billion (2014: £45.5 billion). The overall capital requirement for Credit Risk has reduced by 2.8% from £1,341 million in 2014 compared to £1,304 million 2015.
The table below shows movements in credit risk RWAs from 1 October 2014 to 30 September 2015, with movements ascribed to changes in book size and book quality.
Table 10: Credit Risk RWAs Credit Risk
RWAs £m
RWAs at 1 October 2014 16,763 Book Size growth/ (reduction) (154) Book Quality (improvement)/ deterioration (180) Methodology and Policy (130) Other (5)
RWAs at 30 September 2015 16,294
Although the total credit risk exposure figure has increased, the portfolio mix has shifted away from higher risk weighted exposures (corporates) to lower risk weighted exposures (retail mortgage) resulting in small RWA movements. This is in line with the continued growth of the Group’s residential mortgage portfolio as well as ongoing active management of the customer portfolio. The book size reduction above is driven by a decrease in other assets (non lending assets) with the increase in book quality due in the main to improvements in the underlying economy. Methodology and Policy movement is a result of the ongoing review of data flows and the refinement of our interpretation of the regulatory rules.
Credit risk exposures by exposure class are provided in the table below, together with the associated average credit risk exposure.
Exposure is defined as the maximum loss that a financial institution might suffer if a borrower, counterparty or group fails to meet their obligations or if assets and off balance sheet positions (after offsets) have to be realised. The exposure amounts disclosed are pre-application of Credit Risk Mitigation and pre-application of Credit Conversion Factors, unless otherwise stated. This contrasts with the exposures disclosed within the Strategic Report in the annual report & consolidated financial statements for the year ended 30 September 2015, which are disclosed after any relevant Credit Risk Mitigation and Credit Conversion Factors have been applied.
The credit risk exposures at 30 September 2015 and the averages for the year are summarised as follows:
27

Table 11: Credit Risk Exposures by Exposure Class4 2015 2014
Credit Risk
Exposure
Average Credit Risk
Exposure
Credit Risk
Exposure
Average Credit
Risk Exposure
Exposure Class £m £m £m £m Central Governments or Central Banks 6,477 6,645 5,155 5,666 Regional Government or Local Authority 594 582 620 582 Public Sector Entities 16 16 16 8 Multilateral Development Banks 100 88 50 88 Institutions 841 1,136 1,795 1,034 Corporates 5,914 6,136 6,567 6,965 Retail 3,125 3,161 3,299 3,314 Secured by Mortgages on Immovable Property 26,823 26,402 25,437 24,734 Exposures in Default 367 412 511 503 Claims on Institutions and Corporates with a Short-term Credit Assessment - 5 15 19 Claims in the Form of CIU 4 4 5 5 Equity Exposure 10 9 8 6 Other Items 1,905 2,023 1,989 2,138
Total 46,176 46,619 45,467 45,062
Total exposure value for credit risk as at 30 September 2015 was 1.6% higher compared to 30 September 2014. Key drivers being the growth in retail mortgages and reshaping of the business lending portfolio, focusing principally on small and medium sized businesses (“SME”) in core regional markets. The increase in the Central Governments and Central Bank credit risk exposure class between reporting periods is due to the increased amount held in BoE Reserves and UK Government Bonds.
4 Average Credit Risk Exposure is calculated using the previous four quarters exposure per the EBA’s Common Reporting ‘Credit Risk Standardised Approach’ returns.
28

5.3 Credit risk exposure: analysis by industry
Table 12: Credit Risk Exposure by Industry The table below shows credit risk exposure by industry, including SME exposures. The regulatory SME definition is based on customers with an annual turnover not exceeding EUR 50 million. This is consistent with the SME definition in CRR article 501, which states that among the criteria listed in Commission Recommendation 2003/361/EC (concerning the definition of micro, small and medium-sized enterprises) only the annual turnover is to be taken into account. As at 30 September 2015 Exposure Type Government
and public authorities
Agriculture forestry, fishing and mining
Financial, investment and insurance
Real estate – construction
Manufacturing Personal Lending
Real estate – mortgage
Asset and lease financing
Other commercial and industrial
Non-customer assets
Total
£m £m £m £m £m £m £m £m £m £m £m
Central Governments or Central Banks 1,282 - 5,195 - - - - - - - 6,477 Regional Government or Local Authority 594 - - - - - - - - - 594 Public Sector Entities
- - - - - - - - 16 - 16 Multilateral Development Banks - - 100 - - - - - - - 100 Institutions
- - 841 - - - - - - - 841 Corporates
- 504 225 275 1,055 - - 232 3,623 - 5,914 Retail
- - - - - 3,125 - - - - 3,125 Secured by Mortgages on Immovable Property - 1,652 19 59 280 - 22,212 21 2,580 - 26,823 Exposures in Default
- 29 - 8 7 16 151 - 156 - 367 Claims on Institutions and Corporates with a Short-Term Credit Assessment - - - - - - - - - - - Claims in the Form of CIU
- - - - - - - - 4 - 4 Equity Exposures
- - - - - - - - 10 - 10 Other Items
106 - 1,519 - - - 1 - 75 204 1,905 Total Exposure
1,982 2,185 7,899 342 1,342 3,141 22,364 253 6,464 204 46,176 Of which: SME
- 1,862 77 181 807 - - 145 3,694 - 6,766
29

As at 30 September 2014 Exposure Type Government
and public authorities
Agriculture forestry, fishing and mining
Financial, investment and insurance
Real estate – construction
Manufacturing Personal Lending
Real estate – mortgage
Asset and lease financing
Other commercial and industrial
Non-customer assets
Total
£m £m £m £m £m £m £m £m £m £m £m
Central Governments or Central Banks 467 - 4,688 - - - - - - - 5,155 Regional Government or Local Authority 620 - - - - - - - - - 620 Public Sector Entities
- - - - - - - - 16 - 16 Multilateral Development Banks - - 50 - - - - - - - 50 Institutions
- - 1,795 - - - - - - - 1,795 Corporates
- 554 338 270 1,078 - - 203 4,124 - 6,567 Retail
- - - - - 3,198 - - 101 - 3,299 Secured by Mortgages on Immovable Property - 1,740 31 78 334 - 20,408 21 2,825 - 25,437 Exposures in Default
- 28 3 10 10 23 154 3 280 - 511 Claims on Institutions and Corporates with a Short-Term Credit Assessment - - 15 - - - - - - - 15 Claims in the Form of CIU
- - 5 - - - - - - - 5 Equity Exposures
- 2 - - - - - - 6 - 8 Other Items
116 - 1,531 - - - 1 - 94 247 1,989 Total Exposure
1,203 2,324 8,456 358 1,422 3,221 20,563 227 7,446 247 45,467 Of which: SME
- 2,004 95 191 830 - - 138 4,245 - 7,503
30

5.4 Credit risk exposure: analysis by residual maturity
Table 13: Credit Risk Exposure by Residual Maturity Exposure Type At 30 September 2015
<= 1 year
>1 year, <= 5 years >5 years undated Total
£m £m £m £m £m Central Governments or Central Banks 5,154 - 1,279 44 6,477 Regional Government or Local Authority 582 1 11 - 594 Public Sector Entities 16 - - - 16 Multilateral Development Banks - 100 - - 100 Institutions 173 1 - 667 841 Corporates 3,299 2,213 309 93 5,914 Retail 2,419 599 107 - 3,125 Secured by Mortgages on Immovable Property 2,657 2,702 21,464 - 26,823 Exposures in Default 109 113 145 - 367 Claims on Institutions and Corporates with a Short-Term Credit Assessment - - - - - Claims in the Form of CIU - 4 - - 4 Equity Exposures 10 - - - 10 Other Items
1,905 1,905
14,419 5,733 23,315 2,709 46,176
Exposure Type At 30 September 2014
<= 1 year >1 year,
<= 5 years >5 years undated Total
£m £m £m £m £m Central Governments or Central Banks 4,599 50 464 42 5,155 Regional Government or Local Authority 608 1 11 - 620 Public Sector Entities 16 - - - 16 Multilateral Development Banks - 50 - - 50 Institutions 947 - - 848 1,795 Corporates 3,640 2,357 415 155 6,567 Retail 2,536 645 118 - 3,299 Secured by Mortgages on Immovable Property 2,836 2,841 19,760 - 25,437 Exposures in Default 193 151 167 - 511 Claims on institutions and corporates with a short-term credit assessment - - - 15 15 Claims in the Form of CIU
5- - - 5
Equity Exposures 6 - - 2 8 Other Items - - - 1,989 1,989 Total 15,381 6,100 20,935 3,051 45,467
The maturity of exposures is shown on a contractual basis rather than the actual redemptions experienced by the Group.
31

5.5 Credit risk exposure: analysis by geography
Table 14: Credit Risk Exposure by Geography
At 30 September 2015
Exposure Type UK Other Total
£m £m £m
Central Governments or Central Banks 6,477 - 6,477 Regional Government or Local Authority 594 - 594 Public Sector Entities 16 - 16 Multilateral Development Banks - 100 100 Institutions 841 - 841 Corporates 5,913 1 5,914 Retail 3,110 15 3,125 Secured by Mortgages on Immovable Property 26,772 51 26,823 Exposures in Default 366 1 367 Claims on Institutions and Corporates with a Short-Term Credit Assessment - - -
Claims in the Form of CIU 4 - 4 Equity Exposures 10 - 10 Other Items 1,905 - 1,905
46,008 168 46,176
At 30 September 2014 Exposure Type UK Other Total
£m £m £m
Central Governments or Central Banks 5,155 - 5,155 Regional Government or Local Authority 620 - 620 Public Sector Entities 16 - 16 Multilateral Development Banks - 50 50 Institutions 1,795 - 1,795 Corporates 6,567 - 6,567 Retail 3,284 15 3,299 Secured by Mortgages on Immovable Property 25,387 50 25,437 Exposures in Default 510 1 511 Claims on institutions and corporates with a short-term credit assessment 15 - 15
Claims in the Form of CIU 5 - 5 Equity Exposures 8 - 8 Other Items 1,989 - 1,989 Total Exposure 45,351 116 45,467
Credit risk exposures outside of the UK arising on lending are not material and have been classified as ‘Other’. The geographical location is based on the physical location of the counterparty with which the Group deals. In some cases this may differ from the location of the counterparty’s ultimate parent company. Exposures arising on supranational bonds issued by multilateral development banks are held as part of the Group’s liquidity buffer. In line with guidance issued by the EBA, these have been classified to the geographical area ‘Other’ irrespective of the location of the issuer.
32

5.6 Impaired Lending and Provisions
5.6.1 Definition The following definitions are employed:
• past due but not impaired: loans and advances that are past due but are not impaired are classified as such for secured lending where the net current market value of supporting security is sufficient to cover all principal, interest and other amounts (including legal enforcement, realisation costs etc.) due on the facility. Unsecured retail lending and credit cards are written off when they reach 180 days past due and are not designated as impaired.
• impaired assets: retail mortgages with security insufficient to cover principal and arrears of interest revenue; business lending where there is sufficient doubt about the ultimate collectability of principal and interest; and off-balance sheet credit exposures where current circumstances indicate that losses may be incurred.
• impairment provisions: a provision held on balance sheet to recognise that a loan is impaired. This can be at either the individual or collective level.
• a collective impairment provision: an impairment assessment on a collective basis for homogeneous groups of loans that are not considered individually significant and to cover losses which have been incurred but have not yet been identified on loans subject to individual assessment.
• specific provision: relates to a specific loan, and represents the estimated shortfall between the carrying value of the asset and the estimated future cash flows, including the estimated realisable value of securities after meeting securities realisation costs.
5.6.2 Managing impaired exposures and impairment provisions Provisioning policy The management of impaired assets, the setting of impairment provisions and the write-off of impaired assets are included with the Group’s Credit Policy and Procedures, and are reviewed and attested to on an annual basis. The treatment of impaired assets is determined by the Risk function and the calculation of impairment provisions aligns with current accounting policy, as agreed with the Finance function. Accounting policy The Group first assesses whether objective evidence of impairment exists individually for loans and advances that are individually significant, and individually or collectively for loans and advances that are not individually significant. If the Group determines that no objective evidence of impairment exists for an individually assessed loan, whether significant or not, it includes the asset in a group of financial assets with similar credit risk characteristics and collectively assesses them for impairment. Assets that are individually assessed for impairment and for which an impairment loss is or continues to be recognised are not included in a collective assessment of impairment. The amount of impairment loss is measured as the difference between the asset's carrying amount and the present value of the estimated future cash flows discounted at the asset's original effective interest rate. The amount of the loss is recognised using an allowance account and the amount of the loss is included in the income statement. For the purposes of a collective evaluation of impairment, loans and advances are grouped on the basis of similar risk characteristics, taking into account asset type, industry, geographical location, collateral type, past-due status and other relevant factors. These characteristics are relevant to the estimation of future cash flows for groups of such assets by being indicative of the counterparty's ability to pay all amounts due according to the contractual terms of the assets being evaluated. The Group uses historical loss experience and its experienced judgement to estimate the amount of an impairment loss. This incorporates amounts calculated to overcome model deficiencies and systemic risks where appropriate and supported by historic loss experience data. The use of such judgements and reasonable estimates is considered by management to be an essential part of the process.
33
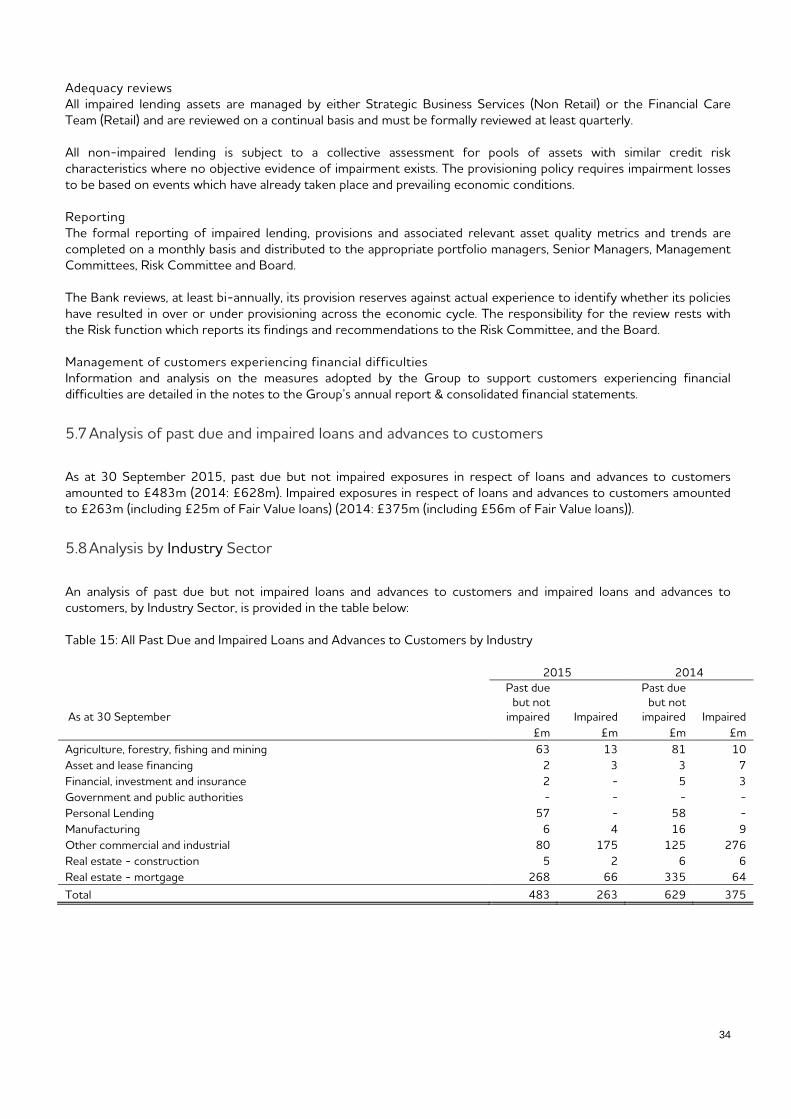
Adequacy reviews All impaired lending assets are managed by either Strategic Business Services (Non Retail) or the Financial Care Team (Retail) and are reviewed on a continual basis and must be formally reviewed at least quarterly. All non-impaired lending is subject to a collective assessment for pools of assets with similar credit risk characteristics where no objective evidence of impairment exists. The provisioning policy requires impairment losses to be based on events which have already taken place and prevailing economic conditions. Reporting The formal reporting of impaired lending, provisions and associated relevant asset quality metrics and trends are completed on a monthly basis and distributed to the appropriate portfolio managers, Senior Managers, Management Committees, Risk Committee and Board. The Bank reviews, at least bi-annually, its provision reserves against actual experience to identify whether its policies have resulted in over or under provisioning across the economic cycle. The responsibility for the review rests with the Risk function which reports its findings and recommendations to the Risk Committee, and the Board. Management of customers experiencing financial difficulties Information and analysis on the measures adopted by the Group to support customers experiencing financial difficulties are detailed in the notes to the Group’s annual report & consolidated financial statements.
5.7 Analysis of past due and impaired loans and advances to customers
As at 30 September 2015, past due but not impaired exposures in respect of loans and advances to customers amounted to £483m (2014: £628m). Impaired exposures in respect of loans and advances to customers amounted to £263m (including £25m of Fair Value loans) (2014: £375m (including £56m of Fair Value loans)).
5.8 Analysis by Industry Sector
An analysis of past due but not impaired loans and advances to customers and impaired loans and advances to customers, by Industry Sector, is provided in the table below: Table 15: All Past Due and Impaired Loans and Advances to Customers by Industry 2015 2014
As at 30 September
Past due but not
impaired Impaired
Past due but not
impaired Impaired £m £m £m £m Agriculture, forestry, fishing and mining 63 13 81 10 Asset and lease financing 2 3 3 7 Financial, investment and insurance 2 - 5 3 Government and public authorities - - - - Personal Lending 57 - 58 - Manufacturing 6 4 16 9 Other commercial and industrial 80 175 125 276 Real estate - construction 5 2 6 6 Real estate - mortgage 268 66 335 64 Total 483 263 629 375
34
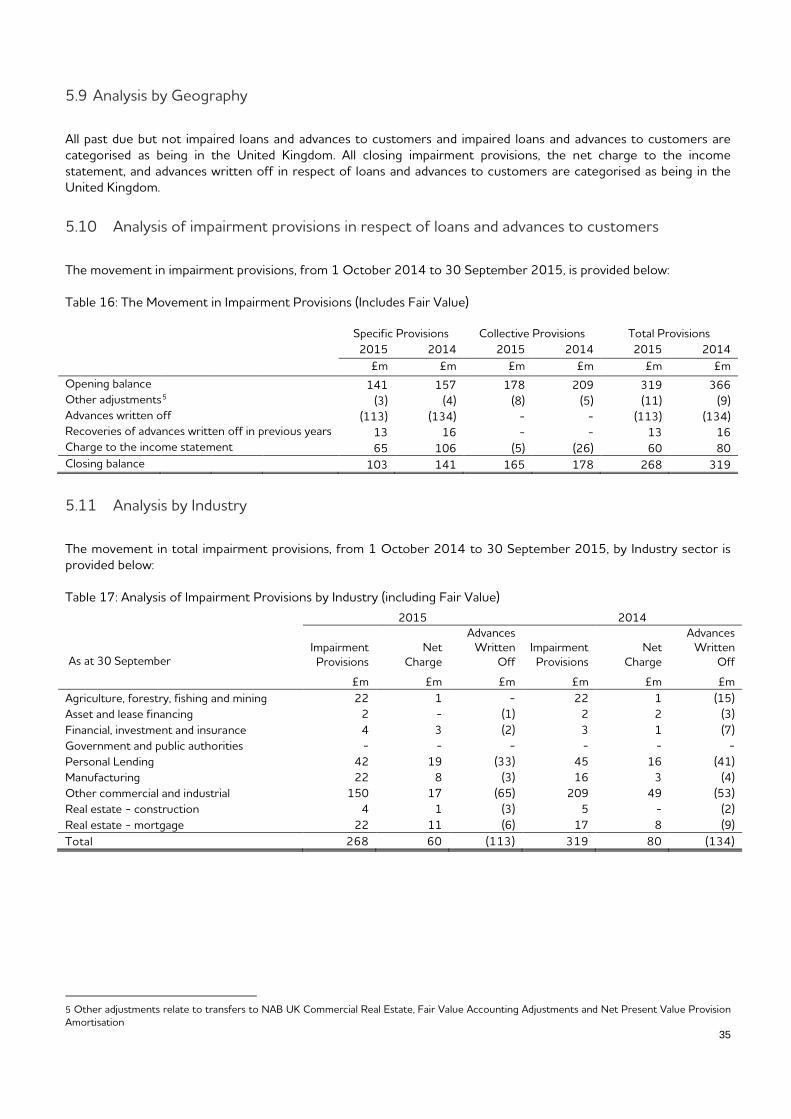
5.9 Analysis by Geography
All past due but not impaired loans and advances to customers and impaired loans and advances to customers are categorised as being in the United Kingdom. All closing impairment provisions, the net charge to the income statement, and advances written off in respect of loans and advances to customers are categorised as being in the United Kingdom.
5.10 Analysis of impairment provisions in respect of loans and advances to customers
The movement in impairment provisions, from 1 October 2014 to 30 September 2015, is provided below: Table 16: The Movement in Impairment Provisions (Includes Fair Value) Specific Provisions Collective Provisions Total Provisions 2015 2014 2015 2014 2015 2014 £m £m £m £m £m £m Opening balance 141 157 178 209 319 366 Other adjustments5 (3) (4) (8) (5) (11) (9) Advances written off (113) (134) - - (113) (134) Recoveries of advances written off in previous years 13 16 - - 13 16 Charge to the income statement 65 106 (5) (26) 60 80 Closing balance 103 141 165 178 268 319
5.11 Analysis by Industry
The movement in total impairment provisions, from 1 October 2014 to 30 September 2015, by Industry sector is provided below: Table 17: Analysis of Impairment Provisions by Industry (including Fair Value) 2015 2014
As at 30 September Impairment Provisions
Net Charge
Advances Written
Off Impairment Provisions
Net Charge
Advances Written
Off
£m £m £m £m £m £m Agriculture, forestry, fishing and mining 22 1 - 22 1 (15) Asset and lease financing 2 - (1) 2 2 (3) Financial, investment and insurance 4 3 (2) 3 1 (7) Government and public authorities - - - - - - Personal Lending 42 19 (33) 45 16 (41) Manufacturing 22 8 (3) 16 3 (4) Other commercial and industrial 150 17 (65) 209 49 (53) Real estate - construction 4 1 (3) 5 - (2) Real estate - mortgage 22 11 (6) 17 8 (9) Total 268 60 (113) 319 80 (134)
5 Other adjustments relate to transfers to NAB UK Commercial Real Estate, Fair Value Accounting Adjustments and Net Present Value Provision Amortisation
35

5.12 Use of ECAIs
The Bank makes limited use of credit assessments by external credit assessment institutions (“ECAIs”) in assigning risk weights to credit risk exposures under the Standardised Approach. This typically applies in the case of certain Central Government, Central Bank and institution exposures. Where a credit assessment is used this must be provided by an eligible ECAI from the PRA’s approved list. The appropriate risk weight to apply to the credit risk exposure is determined by assigning the exposure to the relevant credit quality step under CRR Chapter 2 (Standardised Credit Risk), based on the PRA’s mapping of credit assessments to credit quality steps. A table containing the current mappings is published on the PRA’s website. Where appropriate, the Bank makes use of credit assessments provided by Standard & Poor’s, Fitch and Moody’s. The table below shows exposure by credit quality step pre- and post-application of credit risk mitigation but before credit conversion factors. For retail exposures secured by mortgages, however, the protection effect of mortgage collateral is intrinsically part of the definition of the original exposure class and is therefore taken into account in the calculation of RWAs. Table 18: Exposure Values associated with Credit Quality Step
As at 30 September 2015 2014
Exposure Type Credit Quality
Step
Exposure Pre Mitigation
Exposure Post Mitigation
Exposure Pre Mitigation
Exposure Post Mitigation
(CQS) £m £m £m £m Central Governments or Central Banks
CQS 1 6,477 6,477 5,155 5,106
Regional Government or Local Authority Unrated 594 480 620 482
Public Sector Entities Unrated 16 16 16 16 Multilateral Development Banks CQS 1 100 100 50 50 Institutions CQS 1 98 98 312 55
CQS 2 1 1 399 4
CQS 3 34 34 224 24
CQS 4 5 5 - -
Unrated 703 703 860 860 Corporates CQS 1 7 7 - -
CQS 3 12 12 17 17
Unrated 5,895 5,774 6,550 6,393 Retail Unrated 3,125 3,125 3,299 3,299 Secured by Mortgages on Immovable Property Unrated 26,823 26,778 25,437 25,354 Exposures in Default Unrated 367 367 511 509 Claims on institutions and corporates with a short-term credit assessment
Unrated - - 15 15
Collective investments undertakings (CIU)
Unrated 4 4 5 5
Equity Exposures Unrated 10 10 8 8 Other Items Unrated 1,905 1,905 1,989 1,989 Total Exposure
46,176 45,896 45,467 44,186
The large movement in exposure pre-mitigation within institutions is due to the fact there were no repo or reverse-repo style transactions as at 30 September 2015.
36

5.13 Credit risk mitigation
The Group uses a range of approaches to mitigate credit risk. The Group has a RAS and comprehensive credit risk management policies that restrict the level of exposure to any one borrower or group of borrowers, industries and countries.
5.13.1 Collateral held as security and other credit enhancements The Group evaluates each customer's creditworthiness on a case by case basis. The amount of collateral obtained, if deemed necessary by the Group upon extension of credit, is based on management's credit evaluation of the counterparty. Collateral held varies, but may include:
• specific charges over defined assets of the counterparty; • a floating charge over all assets and undertakings of an entity, including uncalled capital and called but unpaid
capital; • specific or interlocking guarantees; and • loan agreements which include affirmative and negative covenants and in some instances guarantees of
counterparty obligations. Generally, the Group does not take possession of collateral it holds as security or call on other credit enhancements that would result in recognition of an asset on its balance sheet. It is the Group's policy to dispose of repossessed properties in an orderly fashion. The proceeds are used to reduce or repay the outstanding claim. In general, the Group does not occupy repossessed properties for its own business use. Residential mortgages Residential property is the Group's main source of collateral and means of mitigating loss in the event of default credit risk inherent in its residential mortgage portfolios. All lending activities are supported by an appropriate form of valuation using either professional valuers or automated valuation models subject to business rules and confidence levels. The loan to value ratio of our mortgage portfolio is disclosed in note 15 of the Group’s annual report & consolidated financial Statements for the year ended 30 September 2015. Commercial property Commercial property is the Group's main source of collateral on commercial lending and means of mitigating loss in the event of default credit risk inherent in its commercial portfolios. Collateral for the majority of commercial loans comprises first legal charges over freehold or long leasehold property (including formal Companies House registration where appropriate). Non-property related collateral Apart from residential and commercial property based security, the Group also takes other forms of collateral when lending and this can involve obtaining security against the underlying loan through the use of cash collateral and/or netting agreements, both of which reduce the original exposure by the amount of collateral held, subject to volatility and maturity adjustments where applicable. The Group also operates a policy of obtaining security against the underlying loan through the use of guarantees, which can be either limited or unlimited, making the guarantor liable for only a portion or all of the debt. Corporates is the largest sector for other risk mitigation techniques, with all three methods utilised dependent on the nature of the loan facility. The extent to which these will be used will be dependent on the specific circumstances of the customer.
37
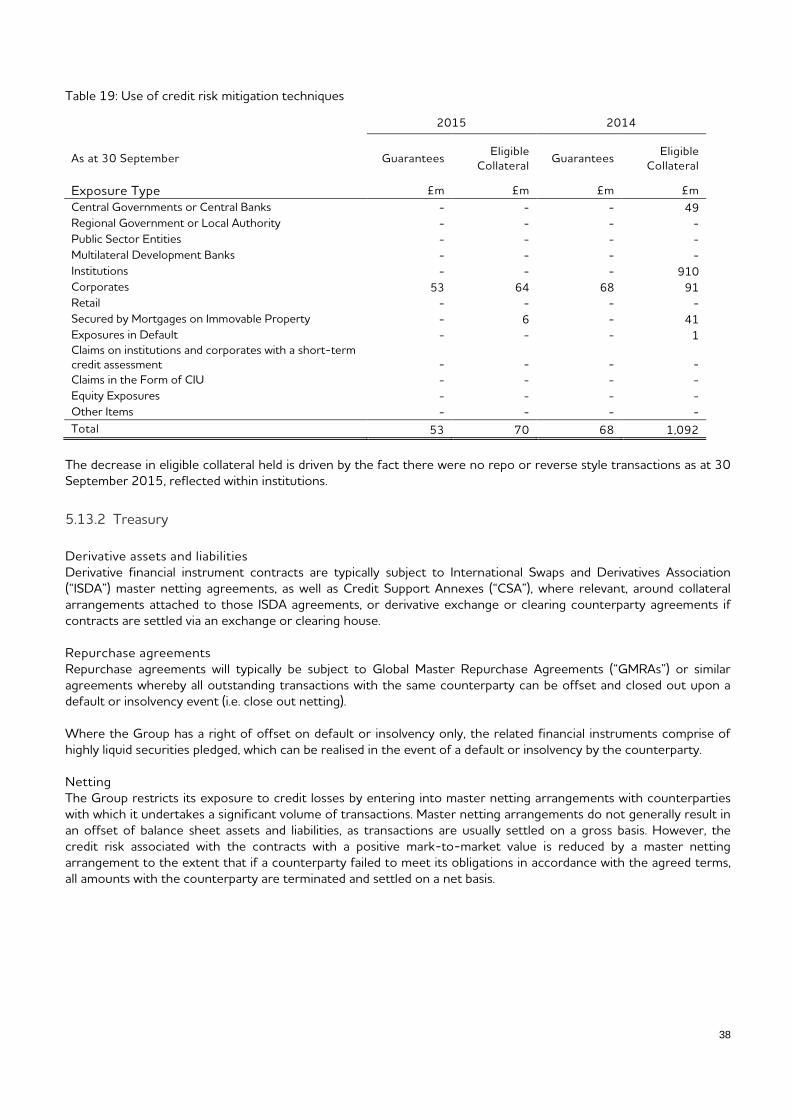
Table 19: Use of credit risk mitigation techniques
2015 2014
As at 30 September Guarantees Eligible Collateral
Guarantees Eligible Collateral
Exposure Type £m £m £m £m Central Governments or Central Banks - - - 49 Regional Government or Local Authority - - - - Public Sector Entities - - - - Multilateral Development Banks - - - - Institutions - - - 910 Corporates 53 64 68 91 Retail - - - - Secured by Mortgages on Immovable Property - 6 - 41 Exposures in Default - - - 1 Claims on institutions and corporates with a short-term credit assessment - - - - Claims in the Form of CIU - - - - Equity Exposures - - - - Other Items - - - - Total 53 70 68 1,092
The decrease in eligible collateral held is driven by the fact there were no repo or reverse style transactions as at 30 September 2015, reflected within institutions.
5.13.2 Treasury Derivative assets and liabilities Derivative financial instrument contracts are typically subject to International Swaps and Derivatives Association (“ISDA”) master netting agreements, as well as Credit Support Annexes (“CSA”), where relevant, around collateral arrangements attached to those ISDA agreements, or derivative exchange or clearing counterparty agreements if contracts are settled via an exchange or clearing house. Repurchase agreements Repurchase agreements will typically be subject to Global Master Repurchase Agreements (“GMRAs”) or similar agreements whereby all outstanding transactions with the same counterparty can be offset and closed out upon a default or insolvency event (i.e. close out netting). Where the Group has a right of offset on default or insolvency only, the related financial instruments comprise of highly liquid securities pledged, which can be realised in the event of a default or insolvency by the counterparty. Netting The Group restricts its exposure to credit losses by entering into master netting arrangements with counterparties with which it undertakes a significant volume of transactions. Master netting arrangements do not generally result in an offset of balance sheet assets and liabilities, as transactions are usually settled on a gross basis. However, the credit risk associated with the contracts with a positive mark-to-market value is reduced by a master netting arrangement to the extent that if a counterparty failed to meet its obligations in accordance with the agreed terms, all amounts with the counterparty are terminated and settled on a net basis.
38
6. Operational Risk
6.1 Introduction
Operational risks arise from the day-to-day operational activities of the Group, which may result in direct or indirect losses and could adversely impact the Group's financial performance and position. These losses may result from both internal and external events, and risks, including, but not limited to, process error or failure, inadequate process design, poor product development and maintenance, poor change management, ageing infrastructure and systems, system failure, security and physical protection, fraud, deficiencies in employees' skills and performance or human error, operational failures by third party providers (including offshored and outsourced providers), natural disasters, extreme weather events, political, security and social events and failings in the financial services industry or other idiosyncratic components of operational risk that are related to the Group's particular size, nature and complexity. Operational risk exists across the Group and is present in all business activities (including those that give rise to other risk types, such as credit risk), organisational changes such as project and business initiatives, the systems that support business activities and the way the Group's people perform these activities. Poorly designed, implemented, understood or managed processes, systems, controls and how people interact with these can result in the potential for significant operational risks to arise. These could lead to financial loss and/or negative non-financial impacts that can affect the Group's ability to meet business objectives and targets, core processes, the ability to satisfy compliance obligations and the Group's obligations to depositors, policy holders and/or customers and shareholders. Operational risk cannot be fully mitigated and requires informed choice i.e. determining the appropriate balance between accepting potential losses (within Board approved appetite) and incurring costs to better manage operational risks and improve operating efficiencies. Responsibility for the management of operational risk rests with the business managers with oversight from the risk management function, with additional guidance and functional oversight provided by policy owners and technical specialists e.g. Information Security, Supplier Management, and independent assurance activities undertaken by Internal Audit. While the day-to-day management of operational risk is focused on low value, high volume events, the Group, in common with other financial institutions, is also exposed to extreme, but plausible, operational risk events. Such risk events can have extreme impacts on the Group if and when they occur. The Group undertakes scenario analysis to gain insights into the potential impact of this type of operational risk event. The Group maintains a suite of operational risk scenarios covering the Basel II event types relevant to its business. The suite of operational risk scenarios are reviewed on a regular basis by a cross section of business stakeholders and specialist functions, considering the potential worst case impact of an extreme event, including the likelihood of the event occurring, based on the current control environment. External data is also monitored through use of industry standard data consortiums to identify any new or emerging risks, and management actions are tracked through governance committees.
6.2 Measurement
The Group calculates its operational risk capital requirements under the Standardised Approach (“TSA”). The capital requirement is calculated using the historic three year average risk weighted income method where different income streams are allocated a different risk weighting.
6.3 Operational risk RWAs and capital requirement
The capital requirement calculated under TSA at 30 September 2015 was £127 million (2014: £125 million). The capital charge is included in Table 9.
39

The table below shows movements in RWAs for operational risk from 1 October 2014 to 30 September 2015. Table 20: Operational risk RWAs Operational risk RWAs £m
As at 1 October 2014 1,564 Movement 25
As at 30 September 2015 1,589
The increase in RWAs for operational risk is due to the increase in revenue generated by the Group over the last three years compared to the three years prior to 30 September 2014.
40
7. Securitisation
7.1 Objectives and roles in relation to securitisation activity
The Group has established two master trust Residential Mortgage Backed Security (“RMBS”) securitisation programmes which provide the Group with term funding via public debt capital markets, intra group funding and potential contingent liquidity. The master trust structure facilitates the issuance of multiple series of notes which can have different rated tranches, tenor and repayment features tailored specifically to investor preference. Each series of notes is supported by the same pool of mortgage assets that can be replenished, subject to eligibility criteria, as the trust reduces in size due to prepayments. The master trust structure comprises of three Special Purpose Vehicles (“SPVs”) which legally isolates the underlying mortgage assets beyond the reach of the Group and its creditors in a bankruptcy, winding-up or receivership event. The three SPVs are:
• Trustees – The purpose of which is to acquire mortgage assets and their related security from the Seller (the Bank) from time to time as required and hold such mortgage assets and their related security on trust.
• Funding – The purpose of which is to purchase a beneficiary share in the trust property, using the proceeds of an inter-company loan from the master issuer.
• Master Issuer – The purpose of which is to issue RMBS notes which represent the mortgage backed obligations, and to lend the note proceeds to Funding under the inter-company loan arrangements.
7.2 Roles
The Group’s role in the securitisation programmes are sponsor, originator, servicer, cash manager and transaction account provider. The obligations in these roles are outlined in the transaction documents in accordance with market practice and regulatory requirements. The master trust structures are supported by fully funded reserve accounts that are sized according to rating agency requirements. The reserve accounts are funded from a subordinated loan from Clydesdale Bank PLC. The programmes have to date repaid all outstanding subordinated loans. Clydesdale Bank PLC also provides a start-up loan for each issuance. This loan provides for fees charged in relation to new issuances and is repaid in the form of revenue receipts generated by the asset pool. The Group is under no obligation to support any losses incurred by the securitisation programmes or noteholders. The principal and interest received from the mortgage assets are used to repay note principal and meet interest payments.
7.3 Associated risks
The Group has not sought to obtain regulatory capital relief from securitisation as significant risk transfer is not achieved. Capital is therefore calculated in accordance with the underlying risk weighting on the balance sheet. The principal risks within the securitised transformation are:
• credit risk: the risk that borrowers fail to meet their obligations as and when they fall due. This risk is assessed by credit rating agencies both at note issuances and on an ongoing basis. All Class A notes have a AAA credit rating from at least two of the main rating agencies (Standard & Poors, Fitch and Moody’s). The Group monitors the performance of its mortgage book and the securitisation portfolio by assessing key metrics such as arrears, loan-to-value and geographic distributions.
• prepayment risk: the risk that customers could prepay all or part of their outstanding debt before the maturity of outstanding bonds. This risk is factored into credit rating agencies cash flow and Group models and is mitigated through mortgage substitution or pool replenishment.
• basis risk: there is a fixed-floating interest rate mismatch between the mortgage pool assets and the 3 month Sterling Libor linked intercompany loan. To mitigate this risk, Funding has entered into interest rate swap agreements.
41

• foreign exchange rate risk: there is a mismatch between the GBP denominated intercompany loan between Funding and Master Issuer, and the amounts payable to non-GBP denominated noteholders. This risk is mitigated by a balance guaranteed cross currency swap. Where there are non-GBP tranches, a cross currency swap has been executed with a counterparty to mitigate foreign exchange currency risk.
• call risk: there is a risk that any series issued notes are not called on their respective call dates. • liquidity risk: there is a mismatch between the capital and interest payments on the underlying mortgage
assets and the capital and interest payments through securitisation structures to investors. The Group retains credit risks associated with the mortgage assets as these remain on-balance sheet. The risk to the programme is mitigated by the over collateralisation of mortgage assets, seller share and reserve accounts.
7.4 Issuer and retained positions
In August 2007, the Group launched the inaugural issuance from Lanark Master Trust (“Lanark”). The asset pool originally comprised of owner-occupied residential mortgage loans and a small amount of Buy to Let (“BTL”) loans. In June 2011, BTL loans were removed from the Lanark mortgage pool and replaced with owner occupied mortgage loans. To date, there have been seven issuances from Lanark. An external credit rating assessment is provided and monitored by three rating agencies: Moody’s, Fitch and Standard and Poor’s. All outstanding Class A notes are rated AAA. Credit enhancement for the securitisation structures is provided by subordinated notes representing specific reserves and excess spread. Clydesdale Bank PLC retains the unrated Lanark Class Z variable funding notes (“Z VFN”). The Z VFN operates in the same manner as a Z Note, however there is a flexible feature in that these notes can be partially amortised. In September 2011, the Group established Lannraig Master Trust (“Lannraig”). The asset pool is exclusively made up of BTL mortgage loans. There have been two issuances since the debut issuance. External credit rating assessments are provided by Moody’s and Fitch. The Class A notes are retained by Clydesdale Bank PLC and NAB. Clydesdale Bank PLC retains two unrated Lannraig Class Z notes. Table 21: Outstanding notes At 30 September 2015, outstanding notes are: Issuer Class A Notes Class Z Notes Total retained position Lanark Master Issuer plc £3,031m £380m £380m Lannraig Master Issuer plc £1,228m £214m £1,060m Table 22: On balance sheet securitised exposures As at 30 September 2015, on balance sheet securitised exposures are:- Issuer Mortgage Asset pool Impaired and 90 days Past Due Lanark Trustee Ltd £4,275m £23m Lannraig Trustee Ltd £1,648m £8m The SPVs are fully consolidated in the Group’s annual report & consolidated financial statements. The Group does not have any synthetic securitisations outstanding or any re-securitisations.
42

7.5 Securitisation accounting policies
Clydesdale Bank PLC has sold mortgages to the securitisation vehicles. However, these mortgages continue to be recognised on the Group’s balance sheet. The mortgages do not qualify for de-recognition from the balance sheet because the Group remains exposed to the risks and rewards of ownership on an ongoing basis. It is exposed primarily to the credit risk, liquidity risk and interest rate risk of the mortgages. The Group is also exposed to the residual rewards of the mortgages as a result of its ability to benefit from the future performance of the mortgages through the receipt of deferred consideration.
43

8. Asset Encumbrance
8.1 Overview
The term encumbrance is used to denote those assets on a bank’s balance sheet which have been pledged as security, collateral or legally ‘ring-fenced’ in some other way which prevents the firm from being able to transfer, pledge, sell or otherwise use/dispose of these assets. These disclosures are based on the EBA guidelines on disclosure of encumbered and unencumbered assets, and on the PRA’s Supervisory Statement 11/14.
8.2 Debt securities
Sale and Repurchase (“Repo”) transactions are used, in the ordinary course of business, to manage short-term cash flow requirements and mismatches. A Repo transaction involves the pledge of marketable securities as security in exchange for receiving a short-term money market deposit. During the period of the Repo, the securities pledged become encumbered. The Group has entered into a number of Repo agreements with both NAB and other market counterparties. These arrangements are covered by GMRAs. The Bank is a direct participant in a number of payment and clearing systems, all of which require collateral to be posted to support its obligations. Where the collateral requirements are met with marketable securities, the securities pledged become encumbered.
8.3 Loans and advances
The Group’s wholesale term funding requirements are currently met via issuance from the SPVs. These structured issuances result in a portion of the Bank’s mortgage assets becoming encumbered. The Group has three Structured Funding Programmes: two securitisation Master Trust structures as outlined in Section 7 and one Regulated Covered Bond programme (“Clydesdale Covered Bonds No. 2 LLP”), also backed by retail mortgages.
Over-collateralisation levels are embedded in each programme to meet the minimum levels as specified by the programme documents and as agreed with the ratings agencies and regulators to mitigate certain legal risks, such as set-off rights. The SPVs also hold cash balances in segregated Guaranteed Investment Certificate (“GIC”) bank accounts. The use of these balances is restricted to the repayment of debt securities issued by the SPVs and other legal obligations associated with these structures. These balances are, therefore, considered by the Group to be encumbered. Items also included within ‘loans and advances’ are note cover, the Cash Ratio Deposit (“CRD”) with the BoE and cash margin collateral supporting Repo transactions. Note cover and cash ratio deposit Under Part 6 of The Banking Act 2009, banks in Scotland and Northern Ireland which issue bank notes are required to hold backing assets for their notes at all times and banks may use a combination of BoE notes, UK coin and funds in an interest-bearing bank account at the BoE. As a result of this permanent requirement for note-issuing banks to provide 100% ‘cover’ for the value of their bank notes in circulation at all times, note cover requirements are considered to be encumbered assets. If note issuance increases then additional cash/balances are required to be placed with the BoE. However, as this process creates equal and offsetting liabilities for the assets encumbered there is no material risk to depositors or the Group. CRDs are non-interest bearing deposits lodged with the BoE by eligible institutions (i.e. banks and building societies), who have reported average eligible liabilities of over £600 million over a calculation period. The level of each
44
institution's CRD is currently calculated twice-yearly (currently in May and November) at 0.18% of average eligible liabilities, over the previous six end-calendar months, in excess of £600m. The purpose of the CRD scheme is to support the running costs of the BoE and, due to the permanent nature of the CRD, the requirement is considered to be an encumbered asset. Cash margin collateral supporting Repo transactions As noted above, a repo transaction involves the pledge of marketable securities as security in exchange for receiving a short-term money market deposit. During the period of the repo, the market value of the securities pledged fluctuates whilst the value of the underlying cash deposit remains fixed. To account for the fluctuations in the market value of the securities, additional cash (‘margin’) is passed between the parties. Where the Group has paid out additional cash margin, this is treated as encumbered by the Group.
8.4 Other assets Other encumbered assets include cash collateral supporting UK payment systems, cash held at the Dutch Central Bank supporting EU payment systems and cash collateral supporting derivative transactions. The Bank is a direct participant in a number of UK payment and clearing systems, all of which require collateral to be posted to support the bank’s obligations. Where the collateral requirements are met with cash, the value of the cash pledged becomes encumbered. Target2 (“Trans-European Automated Real-time Gross Settlement Express Transfer”) is a real time automated payment system for sending and receiving Euro Payments within the EU between Member Banks. The Bank is a direct member of Target2 and the Dutch Central Bank operates the settlement process on behalf of the Bank on a pre-funded basis. This is facilitated via an account held with the Dutch Central Bank which is funded as and when required to meet payments. The balance of this account is, therefore, treated as encumbered by the Group. The Group has entered into a number of derivative netting agreements with both NAB and other market counterparties. The existence of these netting agreements enables the Group to net all derivative exposures covered by the agreement by substituting the current replacement cost with the net replacement cost (i.e. netting the positive mark-to-market values against the negative mark-to-market values). The net replacement cost position is then fully cash collateralised on a daily basis. Where the Group has paid out cash collateral, this is treated as encumbered. These arrangements are covered by an ISDA agreement.
8.5 Encumbered assets
The amounts disclosed in the Table 23 and Table 24 below are median values for the financial year 2015 calculated using quarterly data. Table 23 shows the carrying and, where included in the regulatory templates, the fair value of encumbered and unencumbered assets by asset category. Table 24 shows the carrying value of encumbered assets and associated liabilities by sources of encumbrance. The disclosures are in accordance with PRA/EBA regulatory reporting requirements and as such differ from the disclosures contained in the annual report & consolidated financial statements as at 30 September 2015.
45

Table 23: Fair Value of Encumbered Assets (Template A)
Carrying amount of
encumbered assets
Fair value of encumbered
assets
Carrying amount of
unencumbered assets
Fair value of unencumbered
assets
£m £m £m £m
Assets of the reporting institutions 10,230 28,364 Equity instruments - - 6 6 Debt securities 388 388 932 932 Other assets 371 997
Table 24: Encumbered Assets/ Collateral Received & Associated Liabilities (Template C)
Matching liabilities, contingent
liabilities or securities lent
Assets, collateral received and own
debt securities issued other than covered
bonds and ABSs encumbered
£m £m Carrying amount of selected financial liabilities
4,905
7,830
The Group has elected to apply the waiver available under PRA Supervisory Statement 11/14 regarding disclosure of details of collateral received (Template B).
46
9. Counterparty Credit Risk
9.1 Definition
As a result of hedging market risk with other financial counterparties and placing surplus liquidity with appropriate counterparties (including the Bank of England), the Group has credit exposures to counterparties. Counterparty Credit Risk (“CCR”) is the risk that a counterparty to a transaction may default before the final settlement of the transaction’s cash flows. This section describes the Group’s approach to managing CCR concerning financial instruments, including derivatives and repurchase agreements.
9.2 Internal capital and credit limits
Counterparty credit limits for derivatives are approved and assigned by an appropriately authorised Delegated Commitment Authority (“DCA”). Limits are based on the credit quality of the counterparty and the appetite for the projected maximum potential future exposure of anticipated derivative transactions. They also reflect the nature of the relevant documentation. Credit exposures for each transaction are measured as the current mark-to-market value and the potential credit exposure which is an estimate of the future replacement cost. Limit excesses, whether they are active or passive, are subject to formal approval by a DCA.
9.3 Securing collateral and establishing credit reserves
The risk that counterparties could default is mitigated by offsetting the amounts due to the same counterparties (i.e. netting) and by cash collateral deposited by counterparties (i.e. collateralisation). Collateralisation reduces the credit exposure recorded against market transactions. Counterparty credit exposures may be collateralised by an approved list of eligible collateral via market standard master agreements (such as CSAs to ISDA Master Agreements and GMRAs). Counterparty credit risk policy governs types of acceptable collateral and that collateral which may be subject to haircuts depending on asset type, in line with industry norms. Systems support daily marking-to-market of net exposures and margin requirements, marking-to-market of collateral value and reconciliation of collateral receipt and holdings against collateral due.
9.4 Wrong way risk
Wrong way risk occurs when exposure to a counterparty is adversely correlated with the credit quality of that counterparty. The Group manages these risks through the effective implementation of a number of risk policies, including, but not limited to: single large exposure policy; credit concentration risk policies; aggregation policy; collateralisation policy; and various product restrictions.
9.5 Downgrade impact
The Group calculates, as part of its regular reporting, the amount of any additional collateral that would have to be posted in the event of a downgrade in its external rating. For transactions that would be affected by a downgrade clause, planning for, and the impact of, the event for the Group is managed by the Group’s Treasury department.
9.6 Exposures
Counterparty credit risk exposures are first measured using the mark-to-market method and subsequently risk-weighted under the Standardised Approach. The Group calculates a CVA on external derivative transactions with financial counterparties.
47

9.7 Counterparty credit risk exposures
An analysis by measurement approach, by exposure class, by risk weight approach and by contract type is presented in the table below: Table 25: Counterparty credit risk exposure As at 30 September 2015 2014 Exposure RWA Exposure RWA Mark to Market Approach: £'m £m £m £m Interest Rate Contracts 235 87 376 127 Foreign Exchange Contracts 38 22 73 43 Commodities Contracts 31 29 16 11 Securities Financing Transactions - - - - 304 138 465 181
9.8 Net derivatives credit exposure
Details of the net derivatives credit exposure are set out below: Table 26: Net derivatives credit exposure
As at 30 September 2015 2014
£m £m
Gross positive fair value of contracts 285 220
Potential Future Credit Exposure 446 380
Netting Benefits (671) (452)
Net Current Credit Exposures 60 148
Collateral Pledged 244 317
Net Derivative Credit Exposure 304 465
48
10. Market and Interest Rate Risk
10.1 Market risk
Market risk is the risk associated with adverse changes in the fair value of positions held by the Group as a result of movement in market factors such as interest rates, foreign exchange rates, volatility and credit spreads. Interest Rate Risks arise through the provision of banking products and services to the Group’s customers. The Group also offers a range of treasury risk management products to their customers, which include interest rate risk and foreign exchange risk products, to assist customers’ with their management of risks. The Group does not operate a trading book. Market risk associated with treasury risk management products offered by the Group is hedged on a like-for-like basis so that, other than immaterial positions, market risk positions are not held on the balance sheet of the Group.
10.2 Interest rate risk in the banking book
IRRBB arises from changes in interest rates that adversely impact the Group’s financial condition in terms of earnings (net interest income) or economic value of the balance sheet. This includes:
• repricing risk, arising from changes to the overall level of interest rates and inherent mismatches in the repricing term of the banking book items;
• yield curve risk, arising from a change in the relative level of interest rates for different tenors and changes in the slope or shape of the yield curve;
• basis risk, arising from differences between the actual and expected interest margins on banking book items over the implied cost of funds of those items; and
• optionality risk, arising from the existence of stand-alone or embedded options in banking book items, to the extent that the potential for losses is not included in the above risk types.
10.2.1 Management The Group has a risk appetite for interest rate risk which is supported by a framework of limits. The Group’s Treasury function is responsible for managing the interest rate risk profile of the balance sheet in line with the approved risk appetite. This includes development and execution of interest rate risk management strategies. The Group has a Funds Transfer Pricing (“FTP”) mechanism in place to transfer interest rate risk out of originating business units and into the Treasury function for the management of interest rate risk. The Balance Sheet and Liquidity Risk Oversight team is responsible for IRRBB monitoring and oversight and is independent of Treasury. It maintains a risk framework for IRRBB covering the responsibility for the management of IRRBB measurement of exposures, compliance monitoring and reporting. Key metrics are reported on a monthly basis to ALCO and to the Board. Model parameters and assumptions are reviewed and updated on at least an annual basis. Material changes require the approval of ALCO.
10.2.2 Measurement Interest rate risk is measured, managed and monitored under the risk management framework using both the market valuation and the earnings based approaches. Risk measurement techniques include: Value-at-risk (“VaR”), Earnings-at-Risk (“EaR”), interest rate risk stress testing, repricing analysis, cash flow analysis and scenario analysis.
49

The principal metrics used to measure and monitor IRRBB are as follows: Measurement Definition VaR
The potential loss in economic value implied by the static balance sheet that arises from changes to the current yield curve based upon historical observations for a given holding period and confidence level.
EaR The potential loss in earnings implied by the static balance sheet over a 12 month forecast period, that arises from changes in the current yield curve based on historical observations for a given holding period and confidence level.
Market Value The present value of all known future cash flows implied by the static balance sheet on both a spot and historically cumulative basis.
Embedded Value The economic gain or loss implied by the static balance sheet which equates to the market value less the book value, less accrued interest.
Economic Value Sensitivity (“EVS”)
The potential impact of parallel and non-parallel changes in interest rates on the present value of all known future cash flows implied by the static balance sheet.
Net Interest Income Sensitivity (“NIIS”)
The potential impact of parallel and non-parallel changes in interest rates on the earnings over a 12-month forecast period implied by the static balance sheet.
VaR and EaR are measured with a three-month holding period and 99% confidence level for internal reporting purposes. Table 27: Interest Rate Risk in the Banking Book This table provides the increase or decrease in economic value for upward and downward rate shocks. As at 30 September 2015 2014 200bp
parallel increase
£m
200bp parallel
decrease £m
200bp parallel
increase £m
200bp parallel
decrease £m
Change in economic value 36 (35) 11 (9) Note: Assuming that rates are floored at zero, the impact of the downward rate shock as at 30 September 2015 is (£28) million.
50

11. Remuneration
This section relates to employees identified as a Material Risk Takers (“MRTs”), for the financial year ended 30 September 2015. MRTs Roles
Senior Management Includes the Clydesdale and Yorkshire Bank Leadership team and senior management in the Group. Additionally this may include members of the NAB Group Executive Committee with specific responsibilities in relation to the Group.
Other MRTs Includes non-executive directors of the Group’s boards, employees performing Significant Influence Functions, employees who have responsibility and accountability for activities that could have a material impact on the Bank business’ risk profile, and employees in independent risk management, compliance or internal audit function roles. Additionally this includes non-executive directors of the NAB Board with specific responsibilities in relation to the Group,
11.1 Remuneration Governance
The NAB Remuneration Committee has been established by the NAB Board. Its Charter (which is approved by the NAB Board) sets out the membership, responsibilities, authority and activities of the NAB Remuneration Committee. The full Charter is available online at www.nabgroup.com. As at 30 September 2015 the NAB Remuneration Committee was comprised of four independent non-executive directors. The NAB Remuneration Committee met 13 times during 2015. The Group’s Remuneration Committee (“RemCo”) was established by the CYB Investments Limited Board in April 2015. Its Charter (which is approved by the Company’s Board) sets out the membership, responsibilities, authority and activities of the RemCo. The RemCo membership consists of three independent non-executive directors and an appointed NAB representative. The RemCo operates within approved NAB Group remuneration policies and frameworks and decisions are noted by the NAB Remuneration Committee on a regular basis. Any recommendations or inititatives outside the NAB Group’s remuneration policies and frameworks must be approved by NAB Remuneration Committee. The primary purpose of the RemCo is to support the Company’s Board in ensuring adherence to the NAB Group remuneration governance structures and frameworks and to perform the role of a UK governing body in relation to remuneration requirements.
11.2 Use of External Advisers
Where appropriate, the NAB Remuneration Committee and RemCo seek and consider advice directly from external advisers, independent of management to review and provide recommendations and advice on remuneration and governance matters. Advice was provided by 3 degrees consulting and PwC respectively.
11.3 Remuneration Framework
11.3.1 Scope of the Remuneration Policy NAB Group operates a global remuneration policy (“the Policy”) that applies to NAB and all its controlled entities. The Policy covers all employees, including MRTs. The NAB Group’s overall philosophy is to adopt, where possible, a methodology which links remuneration directly to the performance and behaviour of an individual, the Group’s results, NAB Group’s results and shareholder outcomes. Further information regarding remuneration is available in the Remuneration Report section of NAB’s 2015 Annual Financial Report.
51

11.3.2 Remuneration Policy The Policy is designed to:
• attract, recognise, motivate and retain high performers; • drive employee performance; • align the interests of employees and shareholders through ownership of NAB securities; and • comply with jurisdictional remuneration regulations and Group diversity, inclusion and pay equity
commitments. The Policy uses a range of components to focus employees on achieving NAB Group’s strategy and business objectives. Each individual’s actual remuneration will reflect:
• the degree of individual achievement in meeting performance measures and compliance obligations under the performance management framework;
• parameters approved by the Board based on NAB Group’s financial and risk performance and other qualitative factors;
• NAB’s share price performance and relative shareholder returns; and • the timing and level of deferred awards.
Total Reward consists of both fixed and variable components:
• fixed remuneration provided as cash and benefits (including employer pension); and • variable remuneration reflects both individual and business performance.
The mix of fixed and variable reward is balanced to ensure that fixed remuneration provides a sufficient level of remuneration so that the variable reward components can be fully flexible, including the possibility of paying no variable reward. The remuneration mix at target is based on market information and practices. In any year, the actual mix may vary from target, given the overlay of business performance and individual performance.
Other features of the Policy
Malus The NAB Board has absolute discretion, subject to compliance with the law, to adjust any variable award and other performance-based components of remuneration downwards, or to zero, to protect the financial soundness of NAB Group. In addition, the NAB Board may vary vesting of deferred incentives if the NAB Group’s financial performance or risk management have significantly deteriorated over the vesting period. A qualitative overlay may be applied that reflects the NAB Group’s management of business risks, shareholder expectations and the quality of the financial results. This discretion can be applied at any time and may impact unvested equity awards and performance-based rewards yet to be awarded, whether in cash or equity. In exercising its discretion, the NAB Board will consider whether the rewards are appropriate given later individual or business performance. Malus may apply to any employees across the NAB Group, by division, by role and/or employee, depending on circumstances. Clawback From 1 January 2015, variable reward for MRTs, including retention awards, is subject to clawback for up to 7 years from the award date. The employee will be required to repay, up to the full amount, any performance-based reward, where the NAB Board (in its absolute discretion) determines that one or more of the following circumstances have arisen before the seventh anniversary of the reward:
• the employee has participated in, or was responsible for, conduct which resulted in significant losses to the NAB Group or relevant business;
• the employee has failed to meet appropriate standards of fitness and propriety; • the NAB Group has reasonable evidence of employee misbehaviour or material error; and • the NAB Group or the relevant business suffered a material failure of risk management, taking into account
the employee’s level of responsibility.
52
Commencement, retention and guaranteed incentives Commencement awards enable buy-out of unvested equity from previous employment. The amount, timing and performance hurdles relevant to any such awards are based on satisfactory evidence. The awards are primarily provided in the form of shares or performance rights, subject to performance hurdles, restrictions and certain forfeiture conditions, including forfeiture on resignation, unique to each offer. Guaranteed incentives or bonuses do not support the NAB Group’s performance-based culture and are not provided as part of the Policy. The NAB Group provides retention awards for key employees in roles where retention is critical over a medium-term timeframe (generally two to three years). These are normally provided in the form of shares or performance rights, subject to regulatory requirements, a restriction period, achievement of individual performance standards and forfeiture conditions, including forfeiture on resignation.
Payments on early termination
The NAB Group does not support payments on termination where the employee has been terminated for performance or misconduct reasons.
Payments made to employees on termination (including redundancy) are provided in accordance with policy and contracts of employment and are not performance related. In addition, unvested amounts for all variable, commencement and retention rewards will generally be forfeited prior to the vesting (or milestone) date on:
− resignation from the Group; − termination by the Group (except in circumstances of retrenchment or redundancy or where the Principal
Board exercises its discretion, subject to compliance with the law, that the equity not be forfeited); − failure of the Compliance Gateway (e.g. “Red” rating), including a determination that a former employee
engaged in conduct that would have caused failure of the Compliance Gateway or equivalent if still employed by the Group; or
− NAB Board determination that all or some of the amount will be forfeited. Such a determination may be made at the NAB Group, Group, business unit, role or individual level.
Deferred amounts not forfeited on cessation of employment are retained, subject to initial performance and restriction hurdles. Policy Changes The NAB Remuneration Committee reviewed the Policy during 2015 and made a number of changes applicable to the Group:
• increased the maximum ratio of the variable component of total reward to the fixed component to 2:1, which was approved by NAB as the current sole shareholder;
• introduced a ‘Clawback’ policy for MRTs in line with UK regulatory requirements; and • updated the Policy to reflect the NAB Group’s commitment to pay equity.
11.3.3 Control Function Employees Employees engaged in control functions (i.e. Risk, Internal Audit and Compliance employees) are critical to effective management of risk across the NAB Group. Independence from the business for these employees is assured through:
• setting the reward mix so that variable reward is not significant enough to encourage inappropriate behaviours while remaining competitive with the external market;
• the Risk or Finance function determining remuneration decisions, and not the business the employees support;
• performance measures and targets set align with the NAB Group and/or are specific to the function; and • Group or NAB Group performance and/or function performance being a key component for calculating
individual incentive payments.
The NAB Remuneration Committee or the RemCo, as appropriate, reviews remuneration structures for these employees and oversees the overall reward outcomes for employees in these roles at least annually.
53

11.3.4 Risk Adjustment NAB Remuneration Committee decisions and recommendations are made as far as practicable to align remuneration with shareholder returns, in accordance with regulatory reguirements and global regulatory trends. NAB Remuneration Committee’s remuneration decisions are based on a risk-adjusted view of NAB Group’s financial performance. Variable reward outcomes reflect risk at a number of levels: Individual scorecards – Individuals have specific risk related measures relevant to the individual’s role and are aligned with the RAS where appropriate. The individual’s performance against these risk measures is captured through the individual’s short-term incentive (“STI”) reward. Compliance Gateway – Supports NAB Group’s risk and compliance culture. Individuals who fail the compliance expectations of their role will have their variable reward reduced in part, or in full, depending on the severity of the breach and may not be eligible for variable reward. STI pool measures – The financial measures used to determine the STI pool are selected to capture the impact of a number of material risks (see 11.3.6 for further discussion on how the financial measures take account of risk). Risk adjustment of business outcomes – Whilst performance is assessed against compliance with the agreed risk measures and risk appetite, The RemCo may recommend to the NAB Remuneration Committee, adjustment of the financial outcomes upon which variable rewards are determined based on a qualitative overlay that reflects the Group’s management of business risks, shareholder expectations and the quality of the financial results.
11.3.5 Deferral Arrangements Variable rewards (STI, long-term incentive (“LTI”) and retention awards) are subject to deferral and retention for all MRTs in line with UK regulation:
• at least 60% of total variable reward will deferred over 3 years where the total variable reward is £500,000 or more; and
• at least 40% of total variable reward will deferred over 3 years where the MRT does not meet de minimis conditions.
Deferred variable amounts are generally provided in either shares or performance rights. Deferred variable awards are subject to malus and, from 1 January 2015, clawback will also apply for senior management. A further six month retention period applies to a proportion of deferred variable reward after performance conditions have been satisfied. In addition, half of any ‘up-front’ cash element of variable remuneration is provided in shares and / or other instruments, subject to a six month retention period. The retained amounts are restricted from being sold, transferred or exercised by the individual during the retention period. No further performance conditions apply to retention equity nor is the equity subject to any forfeiture conditions.
11.3.6 Variable Remuneration Arrangements Short-Term Incentive STI rewards are determined based on a combination of business and individual performance. The Group’s performance and STI pool is measured by a mix of growth in Group cash earnings and Return on Equity (“ROE”). These measures reasonably capture the effects of a number of material risks and minimise actions that promote short-term results at the expense of longer term business growth and success. The Group’s STI pool is calculated using the following key performance measures; cash earnings and ROE.
54
An individual’s performance is assessed against what they have delivered and how they have achieved the outcomes. Performance objectives are set as part of Group’s strategy development process, which cascades to scorecard objectives for each individual supporting key business drivers. The objectives under each business driver are selected for their alignment to the Group’s strategic direction. The key performance objectives used for senior executives of the Group in 2015 were: Key Business Driver Objectives Customer - Customer outcomes
- Attraction and retention Risk and Control - Risk appetite Sustainable Returns - RoE
- Cash earnings People - Employee engagement
STI plans link to NAB Group and Group performance by delivering smaller STI pools when performance is less than plan and larger STI pools when performance is above plan. Long-Term Incentive NAB Group long-term incentive awards are not expected be granted to Directors of the Group for the year ended 30 September 2015. Alternative long-term incentive awards in relation to the year are being finalised as part of the planned demerger and IPO. Forms of Variable Remuneration Generally, NAB Group aims to provide deferred variable remuneration as equity to align the interests of employees and shareholders. Performance rights are provided where NAB Group does not consider it appropriate to pay dividends during deferral or restriction periods. The mix of different forms of variable remuneration is dependent on the individual’s role and external market relativities. All individuals are eligible to participate in an STI plan. STI awards will generally be provided in a combination of cash and equity as described above in Deferral Arrangements (see section 11.3.5). LTI awards are provided at the discretion of the RemCo and not all MRTs would receive LTI. Retention, recognition and commencement awards may be provided to an individual depending on circumstances and are subject to regulatory requirements and restrictions. The quantum and form will vary depending on the specific circumstances at the time of the award. Linking Performance and Remuneration Performance is linked to remuneration through both fixed and variable remuneration components. Fixed remuneration is set based on a combination of market position, individual performance and NAB’s ability to pay. Poor performance, including non-compliance with Group and NAB Group policies, during a performance period will be reflected in the variable pay awarded or amount that vests at the end of the performance period. If performance is significantly weak, this may result in no variable pay being awarded, vesting and /or prior deferred awards being forfeited / lapsed. Individual employees have a responsibility to ensure they comply with policies, including the NAB Group Securities Trading Policy and UK Code of Conduct. In particular, the NAB Group Securities Trading Policy specifically prohibits directors and employees from protecting the value of unvested securities (including unvested deferred variable remuneration) with derivative instruments. Directors and employees can protect the value of vested securities in limited circumstances. Any employee found to be in breach of policies will be subject to disciplinary action.
55
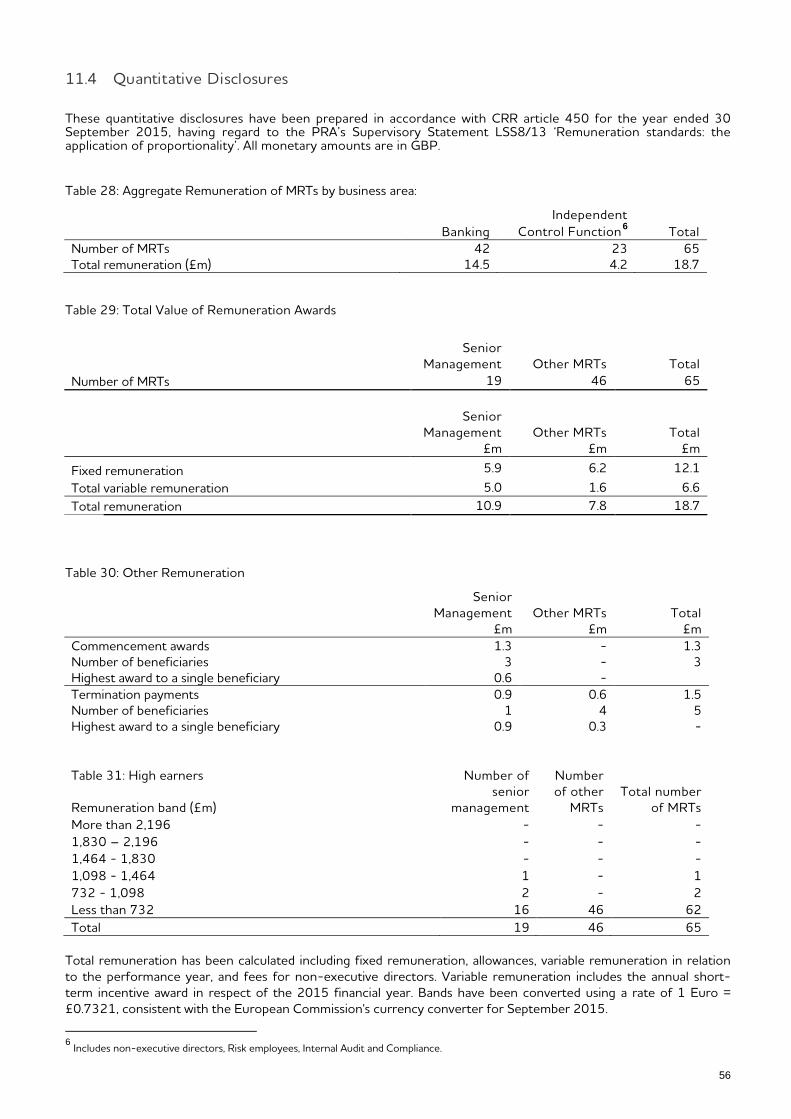
11.4 Quantitative Disclosures
These quantitative disclosures have been prepared in accordance with CRR article 450 for the year ended 30 September 2015, having regard to the PRA’s Supervisory Statement LSS8/13 ‘Remuneration standards: the application of proportionality’. All monetary amounts are in GBP.
Table 28: Aggregate Remuneration of MRTs by business area:
Banking
Independent Control Function6 Total
Number of MRTs 42 23 65 Total remuneration (£m) 14.5 4.2 18.7
Table 29: Total Value of Remuneration Awards
Senior
Management Other MRTs Total Number of MRTs 19 46 65
Senior
Management Other MRTs Total £m £m £m
Fixed remuneration 5.9 6.2 12.1 Total variable remuneration 5.0 1.6 6.6 Total remuneration 10.9 7.8 18.7
Table 30: Other Remuneration
Senior Management
£m Other MRTs
£m Total
£m Commencement awards 1.3 - 1.3 Number of beneficiaries 3 - 3 Highest award to a single beneficiary 0.6 - Termination payments 0.9 0.6 1.5 Number of beneficiaries 1 4 5 Highest award to a single beneficiary 0.9 0.3 -
Table 31: High earners Remuneration band (£m)
Number of senior
management
Number of other
MRTs Total number
of MRTs More than 2,196 - - - 1,830 – 2,196 - - - 1,464 - 1,830 - - - 1,098 - 1,464 1 - 1 732 - 1,098 2 - 2 Less than 732 16 46 62 Total 19 46 65
Total remuneration has been calculated including fixed remuneration, allowances, variable remuneration in relation to the performance year, and fees for non-executive directors. Variable remuneration includes the annual short-term incentive award in respect of the 2015 financial year. Bands have been converted using a rate of 1 Euro = £0.7321, consistent with the European Commission's currency converter for September 2015.
6 Includes non-executive directors, Risk employees, Internal Audit and Compliance.
56

Appendix 1: Disclosures for Clydesdale Bank PLC
The following tables present the disclosures required for the Bank on an individual consolidated basis. The differences between the Group and the Bank relate primarily to reserves held by entities that sit outside of the scope of the Bank solo consolidation that are included in the Group consolidation, a small impact from the risk weighted assets of these entities and Additional Tier 1 capital issued by the Group. Table 32: Capital composition As at 30 September 2015 2014
Common Equity Tier 1 (CET1) capital: Instruments and reserves £m £m Capital instruments and the related share premium accounts 2,812 2,285 Retained earnings 179 (116) Accumulated other comprehensive income (and other reserves) (1) 323 Common Equity Tier 1 (CET1) capital before regulatory adjustments 2,990 2,492 Common Equity Tier 1 (CET1) capital: regulatory adjustments Additional value adjustments (2) (2) Intangible assets (net of related tax liability) - - Deferred tax assets that rely on future profitability excluding those arising from temporary differences (273) (223) Defined benefit pension fund assets (42) (39) CET1 instruments of financial sector entities where the institution has a significant investment (318) - Total regulatory adjustments to Common Equity Tier 1 (CET1) (635) (264) Common Equity Tier 1 (CET1) capital 2,355 2,228 Additional Tier 1 (AT1) capital: instruments Capital instruments and the related share premium accounts 450 - Additional Tier 1 (AT1) capital 450 - Tier 1 Capital 2,805 2,228 Tier 2 (T2) capital: Instruments and provisions Capital instruments and the related share premium accounts 300 300 Amount of qualifying items referred to in Article 484 (5) and the related share premium accounts subject to phase out from T2 175 776 Credit risk adjustments 138 135 Tier 2 (T2) capital 613 1,211 Total Capital 3,418 3,439
Total risk weighted assets 17,795 18,292 Capital Ratios Common Equity Tier 1 13.2% 12.2% Tier 1 15.8% 12.2% Total Capital 19.2% 18.8%
The Bank’s individually consolidated CET1 ratio increased from 12.2% in September 2014 to 13.2% in September 2015. In December 2014, a capital restructure was completed to strengthen the Bank’s capital base and ensure that the PRA’s prudential capital requirements continue to be met. As part of this restructure, the Group repaid £601m of Tier 2 capital in the form of subordinated loan debt and issued £350m of CRD IV compliant AT1 Perpetual Capital Notes to the Group's immediate parent. A further £100m of AT1 Perpetual Capital Notes were issued to the Group's immediate parent in September 2015. Between June and September 2015, ordinary shares of £770m were issued as part of the preparation for the demerger and IPO. These actions led to a strengthening of the CET1 ratio. Further capital benefits from balance sheet optimisation resulted in a reduction in credit risk-weighted assets. These actions were partially offset by the impact of conduct charges incurred in the year.
57

The table below shows movements in the Bank’s capital during 2015. Table 33: Capital flow statement 2015 2014 £m £m CET1 capital CET1 capital at 1 October 2,228 2,078 Share capital: ordinary share new issuance 770 600 Share premium transfer (243) - Retained earnings and other reserves (29) (187) Prudent valuation adjustment - 1 Intangible assets - - DTA relying on future profitability (50) (223) Defined benefit pension fund assets (3) (39) Pension fund deficit adjustment - (2) CET1 instruments of financial sector entities where the institution has a significant investment (318) - 2,355 2,228 Tier 1 capital Tier 1 capital at 1 October - 300 Share capital repurchased: perpetual non-cumulative preference shares - (300) Share capital issued: Additional Tier 1 capital perpetual notes 450 - 450 - Total Tier 1 capital 2,805 2,228 Tier 2 capital Tier 2 capital at 1 October 1,211 1,209 Subordinated debt repurchase (601) - Credit risk adjustments 3 (20) Asset revaluation reserve - (2) Qualifying and material holding Tier 2 deductions - 24 613 1,211 Total capital at 30 September 3,418 3,439
Tier 1 capital The Bank’s Tier 1 capital comprises:
• ordinary shares; • retained earnings; • accumulated other comprehensive income (and other reserves); • Additional Tier 1 (“AT1”) Instruments; and • adjustments as set out by the regulatory requirements governing capital resources.
Regulatory adjustments are made where appropriate. These are made on a consistent basis as the Group, described at section 3. Tier 2 capital Tier 2 capital comprises:
• subordinated loan debt; • general and collective provisions; and • adjustments as set out by the regulatory requirements governing capital resources.
58

Table 34: CRD IV end-point vs transitional comparison Current Rules Full Impact 2015 2014 2015 2014 £m £m £m £m Common Equity Tier 1 (CET1) capital: Instruments and reserves Capital instruments and the related share premium accounts 2,812 2,285 2,812 2,285 Retained earnings 179 (116) 179 (116) Accumulated other comprehensive income (and other reserves) (1) 323 (1) 323 Common Equity Tier 1 (CET1) capital before regulatory adjustments 2,990 2,492 2,990 2,492 Common Equity Tier 1 (CET1) capital: regulatory adjustments
Additional value adjustments (2) (2) (2) (2) Intangible assets (net of related tax liability) - - - - Deferred tax assets that rely on future profitability excluding those arising from temporary differences (273) (223) (273) (223) Defined benefit pension fund assets (42) (39) (42) (39) CET1 instruments of financial sector entities where the institution has a significant investment (318) - (318) - Total regulatory adjustments to Common Equity Tier 1 (CET1) (635) (264) (635) (264) Common Equity Tier 1 (CET1) capital 2,355 2,228 2,355 2,228 Additional Tier 1 (AT1) capital: instruments Capital instruments and the related share premium accounts 450 - 450 - Additional Tier 1 (AT1) capital 450 - 450 - Tier 1 Capital 2,805 2,228 2,805 2,228 Tier 2 (T2) capital: Instruments and provisions Capital instruments and the related share premium accounts 300 300 300 300 Amount of qualifying items referred to in Article 484 (5) and the related share premium accounts subject to phase out from T2 175 776 - - Credit risk adjustments 138 135 138 135 Tier 2 (T2) capital 613 1,211 438 435 Total Capital 3,418 3,439 3,243 2,663
Total risk weighted assets 17,795 18,292 17,795 18,292 Capital Ratios Common Equity Tier 1 13.2% 12.2% 13.2% 12.2% Tier 1 15.8% 12.2% 15.8% 12.2% Total Capital 19.2% 18.8% 18.2% 14.6%
59

Table 35: Reconciliation of statutory equity to regulatory capital 2015 2014 £m £m Statutory total equity7 3,443 2,502 Less pension regulatory adjustments (42) (39) Less deductions from capital (2) (2) Less share option reserve (3) (2) Less available for sale reserve - (8) Less deferred tax asset relying on future profitability (273) (223) Less CET1 instruments of financial sector entities where the institution has a significant investment (318) - Regulatory Tier 1 capital 2,805 2,228
Table 36: Leverage Ratio
The Bank’s individual consolidated leverage ratio is calculated on a basis consistent with that of the Group, as set out in section 3.4. The table below shows the calculation of the leverage ratio for the Bank as at 30 September 2015. 2015 2014 £m £m Total Tier 1 capital for the leverage ratio Total Common Equity Tier 1 (CET1) capital 2,355 2,228 Additional Tier 1 (AT1) capital 450 - Total Tier 1 2,805 2,228 Exposures for the leverage ratio Total statutory assets per the statement of financial position8 40,548 38,619 Off balance sheet items 2,034 2,163 Derivative exposures adjustment 23 118 SFT exposure adjustment - 58 Other regulatory adjustment (635) (264) Leverage ratio exposure 41,970 40,694 Leverage ratio 6.7% 5.5%
7 Of which £3,430m relates to Clydesdale Bank PLC (2014: £2,475m). 8 Of which £40,591m relates to Clydesdale Bank PLC (2014: £38,601m).
60

Table 37: CB Minimum capital requirement - Pillar 1
The following table shows the Bank’s individual consolidated capital resources requirement under Pillar 1 as at 30 September 2015.
2015 2014 RWA Capital RWA Capital
Pillar 1 Capital Requirements £m £m £m £m Central Governments or Central Banks - - - - Regional Government or Local Authority 22 2 22 2 Public Sector Entities 3 - 3 - Multilateral Development Banks - - - - Institutions 131 11 61 5 Corporates 3,287 264 3,755 300 Retail 930 74 994 79 Secured by Mortgages on Immovable Property 10,862 869 10,552 845 Exposures in Default 427 34 611 49 Claims on Institutions and Corporates with a Short-Term Credit Assessment
- - - -
Claims in the Form of CIU 3 - 3 - Equity Exposures 6 - 27 2 Other Items 337 27 463 37 Total Credit Risk 16,008 1,281 16,491 1,319
Credit Counterparty Risk 128 10 166 13 Credit Valuation Adjustment 135 11 86 7 Operational Risk 1,524 122 1,549 124 Market Risk - - - -
17,795 1,424 18,292 1,463
61

Appendix 2: Main Features of Regulatory Capital Instruments
1 Issuer Clydesdale Bank PLC Clydesdale Bank PLC Clydesdale Bank PLC Clydesdale Bank PLC CYB Investments Limited
CYB Investments Limited
2 ISIN XS0584870660 n/a n/a n/a n/a n/a 3 Governing law English English English English English English
Regulatory treatment 4 Transitional CRR rules Tier 2 Tier 2 Additional Tier 1 Additional Tier 1 Additional Tier 1 Additional Tier 1 5 Post-transitional CRR rules Tier 2 Tier 2 Additional Tier 1 Additional Tier 1 Additional Tier 1 Additional Tier 1 6 Eligible at Group or Bank Holding Company, CB
Consolidated, CB Solo Consolidated
Holding Company, CB Consolidated, CB Solo
Consolidated
CB Consolidated, CB Solo Consolidated
CB Consolidated, CB Solo Consolidated
Holding Company Holding Company
7 Instrument type (type to be specified by each jurisdiction)
Subordinated Debt Subordinated Debt Additional Tier 1 – Perpetual Capital
Note
Additional Tier 1 – Perpetual Capital
Note
Additional Tier 1 – Perpetual Capital
Note
Additional Tier 1 – Perpetual Capital
Note 8 Regulatory capital value 175,000,000 300,000,000 350,000,000 100,000,000 150,000,000 300,000,000 9 Nominal value (£) 175,000,000 300,000,000 350,000,000 100,000,000 150,000,000 300,000,000 9a Issue price (£) 175,000,000 300,000,000 350,000,000 100,000,000 150,000,000 300,000,000 9b Redemption price (£) 175,000,000 300,000,000 350,000,000 100,000,000 150,000,000 300,000,000 10 Accounting classification Liability – amortised
cost Liability – amortised
cost Equity Equity Equity Equity
11 Original date of issue 25-Jan-11 20-Dec-13 29-Dec-14 30-Sep-15 29-Dec-14 20-Dec-13 12 Perpetual or dated Dated Dated Perpetual Perpetual Perpetual Perpetual 13 Original maturity date 25-Jan-21 20-Dec-23 n/a n/a n/a n/a 14 Issuer call subject to prior
supervisory approval Yes Yes Yes Yes Yes Yes
15 First call date 25-Jan-16 20-Dec-18 29-Dec-19 20-Dec-20 29-Dec-19 20-Dec-18 16 Subsequent call dates Any interest payment
date thereafter Any interest payment
date thereafter Any Distribution
payment date thereafter
Any Distribution payment date
thereafter
Any Distribution payment date
thereafter
Any Distribution payment date
thereafter Coupons / dividends
17 Fixed or floating dividend/coupon
Floating Floating Floating Floating Floating Floating
18 Coupon rate and any related index
3month GBP LIBOR + 442bps
3month GBP LIBOR + 341bps
6month GBP LIBOR + 690bps
6month GBP LIBOR + 655bps
6month GBP LIBOR + 690bps
6month GBP LIBOR + 763bps
19 Existence of a dividend stopper
No No No No No No
20a Fully discretionary, partially discretionary or mandatory (in terms of timing)
Mandatory Mandatory Fully discretionary Fully discretionary Fully discretionary Fully discretionary
62
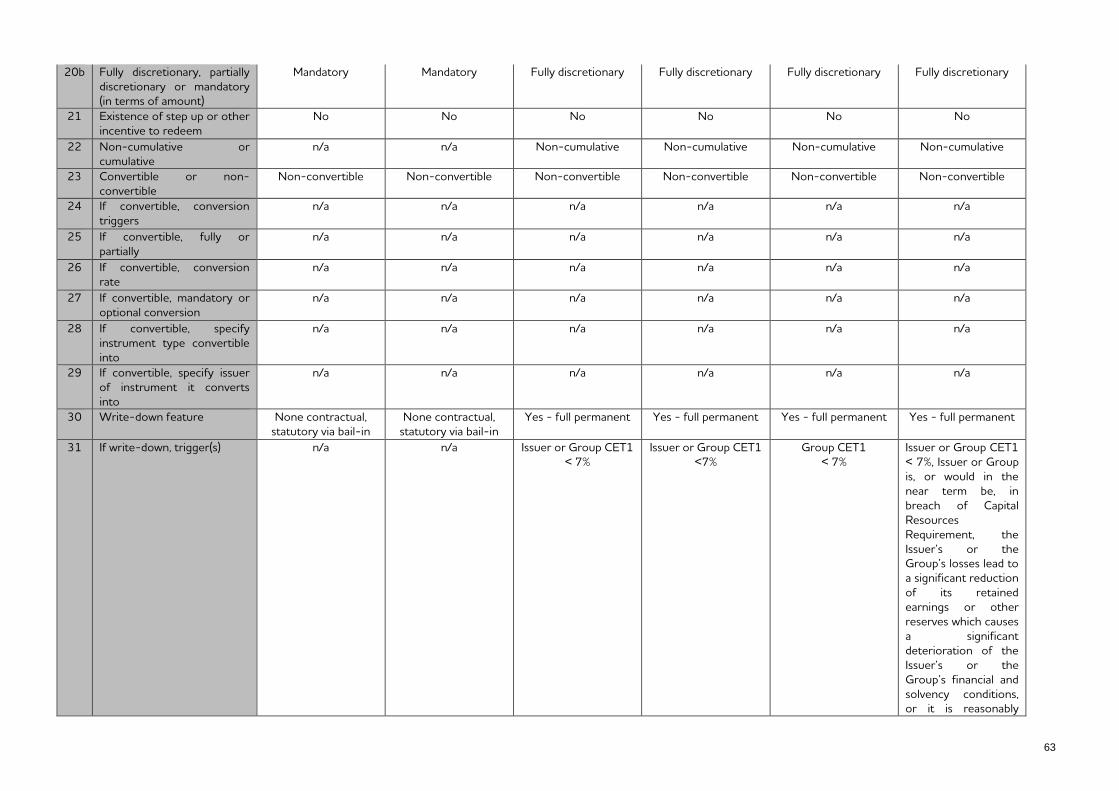
20b Fully discretionary, partially discretionary or mandatory (in terms of amount)
Mandatory Mandatory Fully discretionary Fully discretionary Fully discretionary Fully discretionary
21 Existence of step up or other incentive to redeem
No No No No No No
22 Non-cumulative orcumulative
n/a n/a Non-cumulative Non-cumulative Non-cumulative Non-cumulative
23 Convertible or non-convertible
Non-convertible Non-convertible Non-convertible Non-convertible Non-convertible Non-convertible
24 If convertible, conversion triggers
n/a n/a n/a n/a n/a n/a
25 If convertible, fully or partially
n/a n/a n/a n/a n/a n/a
26 If convertible, conversion rate
n/a n/a n/a n/a n/a n/a
27 If convertible, mandatory or optional conversion
n/a n/a n/a n/a n/a n/a
28 If convertible, specify instrument type convertible into
n/a n/a n/a n/a n/a n/a
29 If convertible, specify issuer of instrument it converts into
n/a n/a n/a n/a n/a n/a
30 Write-down feature None contractual, statutory via bail-in
None contractual, statutory via bail-in
Yes - full permanent Yes - full permanent Yes - full permanent Yes - full permanent
31 If write-down, trigger(s) n/a n/a Issuer or Group CET1 < 7%
Issuer or Group CET1 <7%
Group CET1 < 7%
Issuer or Group CET1 < 7%, Issuer or Group is, or would in the near term be, in breach of Capital Resources Requirement, the Issuer’s or the Group’s losses lead to a significant reduction of its retained earnings or other reserves which causes a significant deterioration of the Issuer’s or the Group’s financial and solvency conditions, or it is reasonably
63
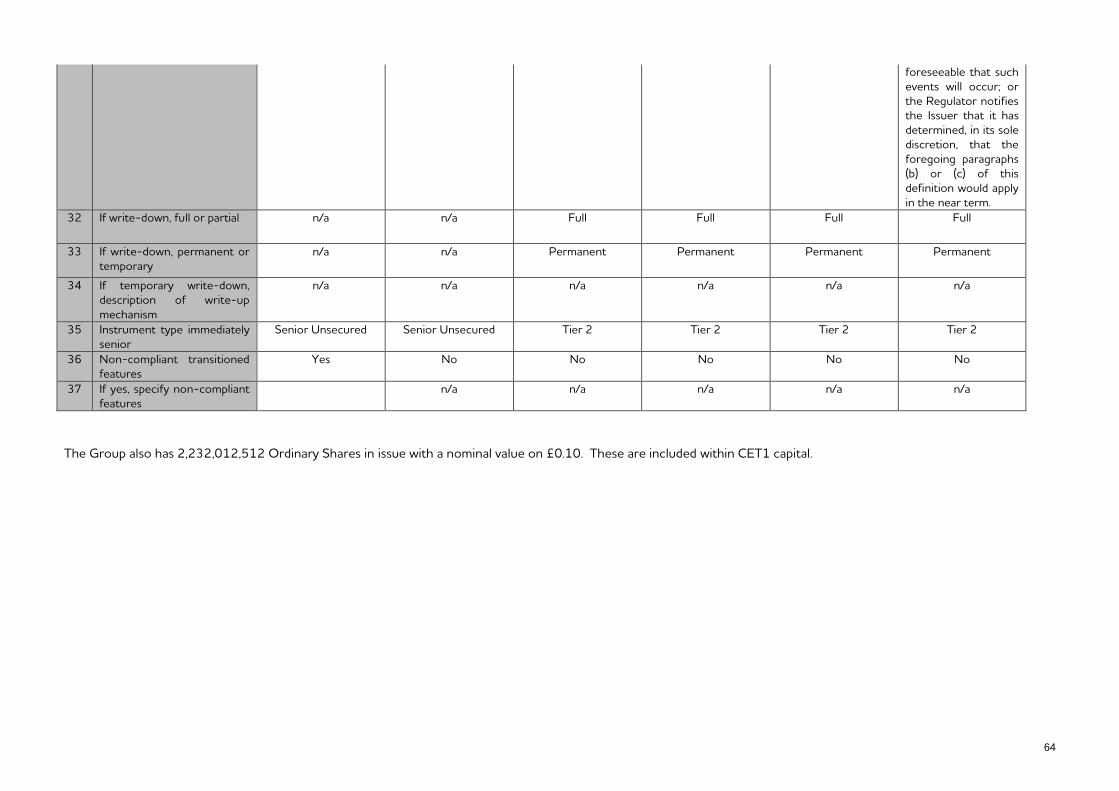
foreseeable that such events will occur; or the Regulator notifies the Issuer that it has determined, in its sole discretion, that the foregoing paragraphs (b) or (c) of this definition would apply in the near term.
32 If write-down, full or partial n/a n/a Full Full Full Full
33 If write-down, permanent or temporary
n/a n/a Permanent Permanent Permanent Permanent
34 If temporary write-down, description of write-up mechanism
n/a n/a n/a n/a n/a n/a
35 Instrument type immediately senior
Senior Unsecured Senior Unsecured Tier 2 Tier 2 Tier 2 Tier 2
36 Non-compliant transitioned features
Yes No No No No No
37 If yes, specify non-compliant features
n/a n/a n/a n/a n/a
The Group also has 2,232,012,512 Ordinary Shares in issue with a nominal value on £0.10. These are included within CET1 capital.
64

Tables
Table 1: Key ratios ................................................................................................................................. 5 Table 2: Directorships Held ...................................................................................................................14 Table 3: Governance Committees .........................................................................................................16 Table 4: Capital composition .................................................................................................................19 Table 5: Capital flow statement .............................................................................................................21 Table 6 : CRD IV end-point vs transitional comparison ...........................................................................22 Table 7: Reconciliation of Statutory Equity to Regulatory Capital ...........................................................23 Table 8: Leverage Ratio ........................................................................................................................23 Table 9: Pillar 1 Capital Requirements ...................................................................................................26 Table 10: Credit Risk RWAs ..................................................................................................................27 Table 11: Credit Risk Exposures by Exposure Class ................................................................................28 Table 12: Credit Risk Exposure by Industry ............................................................................................29 Table 13: Credit Risk Exposure by Residual Maturity ..............................................................................31 Table 14: Credit Risk Exposure by Geography .......................................................................................32 Table 15: All Past Due and Impaired Loans and Advances to Customers by Industry ................................34 Table 16: The Movement in Impairment Provisions (Includes Fair Value) .................................................35 Table 17: Analysis of Impairment Provisions by Industry (including Fair Value) ........................................35 Table 18: Exposure Values associated with Credit Quality Step ..............................................................36 Table 19: Use of credit risk mitigation techniques ..................................................................................38 Table 20: Operational risk RWAs ..........................................................................................................40 Table 21: Outstanding notes .................................................................................................................42 Table 22: On balance sheet securitised exposures .................................................................................42 Table 23: Fair Value of Encumbered Assets (Template A) .......................................................................46 Table 24: Encumbered Assets/ Collateral Received & Associated Liabilities (Template C) .........................46 Table 25: Counterparty credit risk exposure ..........................................................................................48 Table 26: Net derivatives credit exposure ..............................................................................................48 Table 27: Interest Rate Risk in the Banking Book ...................................................................................50 Table 28: Aggregate Remuneration of MRTs by business area: ...............................................................56 Table 29: Total Value of Remuneration Awards ....................................................................................56 Table 30: Other Remuneration ............................................................................................................56 Table 31: High earners .........................................................................................................................56 Table 32: Capital composition ...............................................................................................................57 Table 33: Capital flow statement ...........................................................................................................58 Table 34: CRD IV end-point vs transitional comparison ..........................................................................59 Table 35: Reconciliation of statutory equity to regulatory capital ...........................................................60 Table 36: Leverage Ratio ......................................................................................................................60 Table 37: CB Minimum capital requirement - Pillar 1 .............................................................................61
65
Glossary
Basel II The capital adequacy framework issued by the Basel Committee on Banking Supervision (“BCBS”) in June 2006 in the form of the “International Convergence of Capital Measurement and Capital Standards”.
Basel III In December 2010, the BCBS issued final rules “Basel III: A global regulatory framework for more resilient banks and banking systems” and “Basel III: International framework for liquidity risk measurement, standards and monitoring”. Together these documents present the BCBS’s reforms to strengthen global capital and liquidity rules with the goal of promoting a more resilient banking sector. The new requirements are being phased in starting 1 January 2014 with full implementation by 1 January 2019.
Capital conservation buffer A buffer to ensure banks build up capital buffers outside periods of stress which can be drawn down as losses are incurred.
Capital Requirements Directive IV (“CRD IV”)
The European Union’s (“EU”) proposal to implement Basel III, the international agreement on bank capital standards agreed at G20 level. It replaces the EU’s earlier capital requirements directives with a revised package consisting of a new Capital Requirements Directive (“CRD”) and a new Capital Requirements Regulation (“CRR”). The CRD IV package raises capital and liquidity requirements for European banks and harmonises the European framework for bank supervision.
Cash Ratio Deposit A non-interest bearing deposit lodged with the Bank of England (“BoE”), which are then invested in interest-yielding assets to fund BoE operations.
Clawback Clawback provision permits NAB to require an individual to repay all or part of a variable pay award after payment has been made. Awards are subject to clawback for up to seven years from when the award is made. This requirement will continue to apply if the individual leaves employment with the Group.
Collateral The assets of a borrower that are used as security against a loan facility.
Common Equity Tier 1 (“CET1”) capital
The highest quality form of regulatory capital that comprises total shareholders’ equity (excluding preference shares issued) and related non-controlling interests, less goodwill and intangible assets and certain other regulatory adjustments.
Common Equity Tier 1 ratio CET1 capital as a percentage of risk weighted assets.
Compliance Gateway All employees must satisfy threshold measures for compliance which reflect a range of internal and external regulatory requirements.
Countercyclical capital buffer A capital buffer to ensure eligible firms have a sufficient capital base to absorb losses in stressed periods.
Counterparty credit risk Counterparty credit risk (“CCR”) is the risk that a counterparty to a transaction may default before the final settlement of the transaction’s cash flows. This risk concerns financial instruments, including derivatives and repurchase agreements.
Covered Bonds A corporate bond with primary recourse to the institution and secondary recourse to a pool of assets that act as security for the
66
bonds on issuer default. Covered bonds remain on the issuer’s balance sheet and are a source of term funding for the Group.
Credit conversion factor (“CCF”) Credit conversion factors (“CCF”) are used in determining the exposure at default in relation to a credit risk exposure. The CCF is an estimate of the proportion of undrawn and off-balance sheet commitments expected to be drawn down at the point of default.
Credit quality steps A credit quality assessment scale as set out in CRD IV.
Credit risk The potential that a customer or counterparty will fail to meet its obligations to the Group in accordance with agreed terms and arises from both the Group's lending activities and treasury operations, including hedging activities.
Credit risk mitigation Techniques to reduce the potential loss in the event that a customer (borrower or counterparty) becomes unable to meet its obligations. This may include the taking of financial or physical security, the assignment of receivables or the use of credit derivatives, guarantees, credit insurance, set-off or netting.
Earnings at risk (“EaR”) A measure of the quantity by which net interest income might change in the event of an adverse change in interest rates.
EBA Implementing Technical Standard on Disclosure for Own Funds
Commission Implementing Regulation (EU) No 1423/2013 of 20 December 2013 laying down implementing technical standards with regard to disclosure of own funds requirements for institutions according to Regulation (EU) No 575/2013 of the European Parliament and of the Council.
Encumbrance Denotes those assets on a bank’s balance sheet which have been pledged as security, collateral or legally ‘ring-fenced’ in some other way which prevents the firm from being able to transfer, pledge, sell or otherwise use/dispose of these assets.
External Credit Assessment Institutions (“ECAI”)
External Credit Assessment Institutions (“ECAIs”) include external credit rating agencies such as Moody's, Fitch, and Standard and Poor’s.
FCA Financial Conduct Authority.
The Group CYB Investments Limited and its controlled entities.
Group cash earnings Cash earnings is defined as net profit attributable to owners of the Group, adjusted for the items the Group considers appropriate to better reflect the underlying performance of the Group. In September 2015 cash earnings has been adjusted for the following:
• distributions;
• treasury shares;
• fair value and hedge ineffectiveness;
• life insurance economic assumption variation;
• amortisation of acquired intangible assets; and
• sale and demerger costs.
Interest rate risk in the banking book (“IRRBB”)
IRRBB arises from changes in interest rates that adversely impact the Group’s financial condition in terms of earnings (net interest income) or economic value of the balance sheet.
67

Internal Capital Adequacy Assessment Process (“ICAAP”)
The Bank’s own assessment of the levels of capital that it needs to hold through an examination of its risk profile from regulatory and economic capital viewpoints.
Leverage Ratio This is a regulatory standard ratio proposed by the Basel III reforms and is Tier 1 capital divided by the total on and off balance sheet exposures expressed as a percentage. The BCBS has proposed to test a minimum requirement of 3% for the leverage ratio during a parallel run period from 1 January 2013 to 1 January 2017, with a view to migrating to a Pillar 1 treatment on 1 January 2018 based on appropriate review and calibration.
Malus A malus arrangement permits NAB to prevent vesting of all or part of deferred remuneration. Malus adjustments to remuneration may be done at NAB’s discretion, or may be controlled by a pre-set formula. Malus arrangements do not reverse vesting after it has already occurred, so they have no force after the end of the deferral period.
Market risk The risk associated with adverse changes in the fair value of positions held by the Group as a result of movement in market factors such as interest rates, foreign exchange rates, volatility and credit spreads.
Material Risk Takers Comprises categories of employees, including senior management, risk takers, employees engaged in control functions and any employee receiving total remuneration that takes them into the same remuneration bracket as senior management and risk takers, whose professional activities have a material impact on the Bank’s risk profile. MRTs are identified in accordance with the criteria set out in articles 3 to 5 of the Material Risk Takers Regulation (Commission Delegated Regulation (EU) No 604/2014 of 4 March 2014).
NAB National Australia Bank Limited. A company incorporated in the State of Victoria, Australia. The ultimate parent of CYB Investments Limited (formerly known as National Australia Group Europe Limited).
NAB Group NAB and its controlled entities.
Operational risk The risk of loss resulting from inadequate or failed internal processes, people and systems or from external events.
Performance rights A performance right is a right to acquire one NAB ordinary share, once the performance right has vested based on achievement of the related performance hurdle or at the Board’s discretion. Each performance right entitles the holder to be provided with one NAB ordinary share subject to adjustment for capital actions. The performance right is issued at no charge to the employee. To acquire a share, the holder must exercise the right but there is no exercise price to be paid. Shares are issued on exercise of performance rights. Performance rights may be used instead of shares due to jurisdictional reasons, including awards such as deferred STI and commencement and other retention programs. The terms and conditions, including lapsing, will vary for each particular grant. Performance rights are issued by NAB. No dividend income is provided to the employee until the end of the restriction period and the performance conditions have been met and the performance rights are exercised.
Pillar 1 The quantitative elements of the Basel III framework including the minimum regulatory capital requirements for credit, operational and market risks.
68

Pillar 2 The qualitative expectations of the Basel III framework to be met through the supervisory review process. This includes the ICAAP, governance process and the supervisory review and evaluation process.
Pillar 3 The final pillar of the Basel III framework which aims to encourage market discipline by improving the information made available to the market. The pillar sets out disclosure requirements for banks on their capital, risk exposures and risk assessment processes.
PPI Payment Protection Insurance
PRA Prudential Regulation Authority PRA Buffer A capital buffer to ensure a firm is able to meet its minimum capital
requirements under stress in line with the PRA’s risk appetite.
Regulatory capital The capital which the Group holds, determined in accordance with rules established by the PRA.
Repurchase agreement A short-term funding agreement that allows a borrower to create a collateralised loan by selling a financial asset to a lender. As part of the agreement, the borrower commits to repurchase the security at a date in the future repaying the proceeds of the loan. For the counter-party (buying the security and agreeing to sell in the future) it is a reverse repurchase agreement or a reverse repo.
Residential mortgage-backed securities (“RMBSs”)
Securities that represent interests in groups or pools of underlying mortgages. Investors in these securities have the right to cash received from future mortgage payments (interest and principal).
Return on equity (“ROE”) ROE is calculated as cash earnings divided by average shareholders’ equity, excluding non-controlling interests and other equity instruments and adjusted for treasury shares. It allows for risk to the extent that actual equity aligns with target equity and RWAs. ROE also measures inorganic growth.
Risk appetite The amount and type of risk that the Group is prepared to seek, accept or tolerate.
Risk weighted assets (RWAs) On and off balance sheet assets of the Group are allocated a risk weighting based on the amount of capital required to support the asset.
Securitisation The practice of pooling similar types of contractual debt and packaging the cash flows from the financial asset into securities that can be sold to institutional investors in debt capital markets. It provides the Group with a source of secured funding that can achieve a reduction in funding costs by offering typically AAA rated securities secured by the underlying financial asset.
Standardised Approach In relation to credit risk, a method for calculating credit risk capital requirements requiring the use of a standard set of risk weights prescribed by the regulator. Use may be made of external credit ratings supplied by ECAIs to assign risk weights to exposures. In relation to operational risk, a method of calculating the operational capital requirement by the application of a supervisory defined percentage charge to the gross income of eight specified business lines.
Stress testing The term used to describe techniques where plausible events are
69

considered as vulnerabilities to ascertain how this will impact the own funds which a bank requires to hold.
Systemic Risk Buffer A buffer for the financial sector to prevent, or mitigate, long-term non-cyclical systemic or macroprudential risks.
Tier 1 capital A component of regulatory capital which is able to absorb losses, is permanent and available when required, ranks for repayment upon winding up/administration or similar procedures after all other debts and liabilities, and has no fixed inescapable costs. It comprises core Tier 1 and other Tier 1 capital, which includes qualifying capital instruments such as non-cumulative perpetual preference shares and hybrid capital securities.
Tier 1 capital ratio Tier 1 capital as a percentage of risk weighted assets.
Tier 2 capital A component of regulatory capital which includes forms of capital that do not meet the requirements for permanency and absence of inescapable fixed servicing costs that apply to Tier 1 capital. It comprises qualifying subordinated loan capital, related non-controlling interests, allowable collective impairment allowances and unrealised gains arising on the fair valuation of equity instruments held as available-for-sale. Tier 2 capital also includes reserves arising from the revaluation of properties.
Z notes Subordinated notes which provide credit enhancement to the securitisation structures and increase the excess spread available to the rated Class A notes. Losses on the mortgage portfolio are borne first by the Z notes.
70