Embed Size (px)
Citation preview
NASA Technical Memorandum 110374
Piloted Simulation Tests ofPropulsion Control as Backup toLoss of Primary Flight Controlsfor a Mid-Size Jet Transport
John Bull, CAELUM Research Corporation, Mountain View, California
Robert Mah, Gloria Davis, Joe Conley, and Gordon Hardy, Ames Research Center,Moffett Field, California
Jim Gibson, Recom Technologies, Inc., San Jose, California
Matthew Blake, Ames Research Center, Moffett Field, California
Don Bryant and Diane Williams, ManTech/NSI Technology Services Corporation,Sunnyvale, California
December 1995
National Aeronautics andSpace Administration
Ames Research CenterMoffett Field, California 94035-1000
https://ntrs.nasa.gov/search.jsp?R=19960009817 2018-05-22T07:26:14+00:00Z

TABLE OF CONTENTS
Summary ................................................................................................................................................................
1 Introduction .....................................................................................................................................................
1.1 Purpose of Each Series of Piloted Simulation Tests ..............................................................................
Simulation Aircraft Description .....................................................................................................................2.1 ACFS Facility Description .....................................................................................................................2.2 ACFS Aircraft Physical Dimensions .....................................................................................................2.3 ACFS Aircraft Flight Dynamics ............................................................................................................2.4 ACFS Turbulence Model .......................................................................................................................
PCA Concept And Control Laws ...................................................................................................................3.1 PCA Typical Step Response Time Histories .........................................................................................3.2 PCA Industry Benefits ...........................................................................................................................
Pilot Interface Tests (June 1992) ....................................................................................................................4.1 Pilot Interface Test Objectives ...............................................................................................................4.2 Pilot Interface Test PCA Modes ............................................................................................................
4.3 Pilot Interface Test Displays ..................................................................................................................4.4 Pilot Interface Test Description .............................................................................................................4.5 Pilot Interface Test Results ....................................................................................................................4.6 Pilot Interface Test Conclusions ............................................................................................................
PCA5.15.25.35.45.55.6
Mode/Display Tests (Aug. 1994) ...........................................................................................................PCA Mode/Display Test Objectives ......................................................................................................PCA Mode/Display Test ModesTested .................................................................................................PCA Mode/Display Test Displays Tested .............................................................................................PCA Mode/Display Test Description ............................................................................ , .......................PCA Mode/Display Test Results ...........................................................................................................PCA Mode/Display Test Conclusions ...................................................................................................
PCA6.16.26.36.4
Full-Flight Envelope Tests (Apr. 1995) .................................................................................................PCA Full-Flight Envelope Test Objectives ...........................................................................................PCA Full-Flight Envelope Test Description ..........................................................................................PCA Full-Flight Envelope Test Results .................................................................................................PCA Full-Hight Envelope Test Conclusions .........................................................................................
7 Summary of Conclusions ...............................................................................................................................
Appendix A - PCA Control Law Block Diagram .................................................................................................
Appendix B - PCA Longitudinal Control Law Equations ....................................................................................
Appendix C - PCA Lateral-Directional Control Law Equation ............................................................................
Appendix D - PCA Coupled Approach Control Law Equations ..........................................................................
Appendix E - PCA EPR Initial Conditions ...........................................................................................................
Appendix F - PCA Responses to -3 Degree Flightpath Angle Command ...........................................................
Appendix G - PCA Responses to 10 Degree Bank Angle Command ...................................................................
References ..............................................................................................................................................................
Page
66666
1010
10101010101014
1414141516
19
21
23
25
27
29
31
33
35
iii

v _
LIST OF TABLES
Table 1. ACFS facility description ........................................................................................................................
Table 2. ACFS aircraft physical dimensions .........................................................................................................
Table 3. ACFS open loop dynamics ......................................................................................................................
Table 4. ACFS light turbulence model amplitude and bandwidth .........................................................................
Table 5. PCA industry benefits ..............................................................................................................................
Table 6. PCA full-flight envelope test subject crews ............................................................................................
Table 7. PCA full-flight envelope test matrix .......................................................................................................
Table 8. PCA full-flight envelope parameter test ranges .......................................................................................
Table 9. PCA pilot workload .................................................................................................................................
LIST OF FIGURES
Page
2
2
3
6
6
14
14
14
15
Figure 1. ACFS open loop longitudinal dynamics .................................................................................................
Figure 2. ACFS open loop lateral-directional dynamics .......................................................................................
Figure 3. PCA implementation ..............................................................................................................................
Figure 4. PCA flightpath angle step responses at low, medium, and cruise altitudes ...........................................
Figure 5. PCA bank angle step responses at low, medium, and cruise altitudes ..................................................
Figure 6. MCP vs. sidestick pilot Cooper-Harper ratings .....................................................................................
Figure 7. PCA mode pilot Cooper-Harper ratings .................................................................................................
Figure 8. PCA heading vs. bank mode pilot preference ........................................................................................
Figure 9. PCA display vs. no display pilot preference ..........................................................................................
Figure I0. PCA touchdown Footprints .., ..............................................................................................................
Figure 1 I. PCA pilot Cooper-Harper ratings .........................................................................................................
Figure 12. PCA mode pilot preference ..................................................................................................................
Figure 13. PCA operational limits with out-of-trim yaw moment .........................................................................
Figure 14. PCA approach time histories (manual throttle mode vs. PCA MCP mode) ........................................
Figure 15. PCA approach time histories (PCA fully coupled mode vs. PCA coupled localizer-only mode) .......
Page
4
5
7
8
9
11
12
12
13
13
15
15
16
17
18

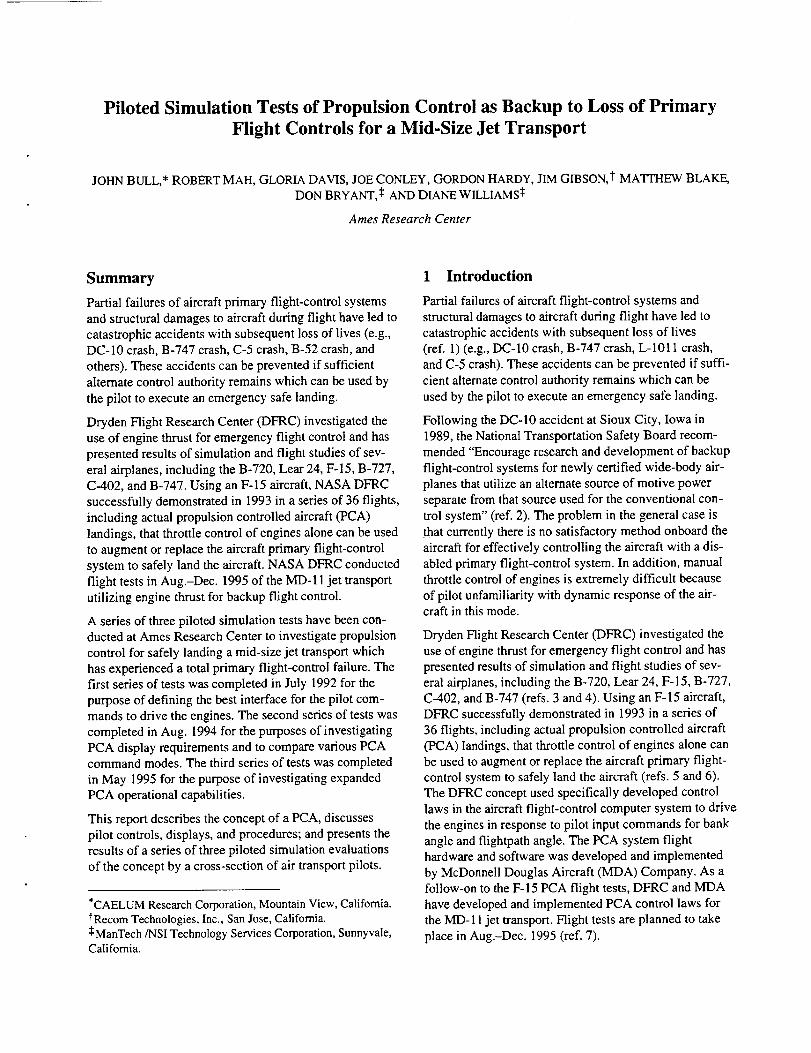
Piloted Simulation Tests of Propulsion Control as Backup to Loss of Primary
Flight Controls for a Mid-Size Jet Transport
JOHN BULL,* ROBERT MAH, GLORIA DAVIS, JOE CONLEY, GORDON HARDY, JIM GIBSON, t MATITIEW BLAKE,DON BRYANT, _ AND DIANE WILLIAMS ¢
Ames Research Center
Summary
Partial failures of aircraft primary flight-control systems
and structural damages to aircraft during flight have led to
catastrophic accidents with subsequent loss of lives (e.g.,DC-10 crash, B-747 crash, C-5 crash, B-52 crash, and
others). These accidents can be prevented if sufficient
alternate control authority remains which can be used by
the pilot to execute an emergency safe landing.
Dryden Flight Research Center (DFRC) investigated the
use of engine thrust for emergency flight control and has
presented results of simulation and flight studies of sev-
eral airplanes, including the B-720, Lear 24, F-15, B-727,C-402, and B-747. Using an F-15 aircraft, NASA DFRC
successfully demonstrated in 1993 in a series of 36 flights,
including actual propulsion controlled aircraft (PCA)
landings, that throttle control of engines alone can be used
to augment or replace the aircraft primary flight-control
system to safely land the aircraft. NASA DFRC conducted
flight tests in Aug.-Dec. 1995 of the MD-11 jet transport
utilizing engine thrust for backup flight control.
A series of three piloted simulation tests have been con-
ducted at Ames Research Center to investigate propulsion
control for safely landing a mid-size jet transport which
has experienced a total primary flight-control failure. The
first series of tests was completed in July 1992 for the
purpose of defining the best interface for the pilot com-
mands to drive the engines. The second series of tests was
completed in Aug. 1994 for the purposes of investigating
PCA display requirements and to compare various PCAcommand modes. The third series of tests was completed
in May 1995 for the purpose of investigating expandedPCA operational capabilities.
This report describes the concept of a PCA, discussespilot controls, displays, and procedures; and presents the
results of a series of three piloted simulation evaluations
of the concept by a cross-section of air transport pilots.
*CAELUM Research Corporation, Mountain View, California.
_tRecom Technologies, Inc., San Jose, California.:_ManTech/NSI Technology Services Corporation, Sunnyvale,California.
1 Introduction
Partial failures of aircraft flight-control systems and
structural damages to aircraft during flight have led to
catastrophic accidents with subsequent loss of lives
(ref. 1) (e.g., DC-10 crash, B-747 crash, L-1011 crash,and C-5 crash). These accidents can be prevented if suffi-
cient alternate control authority remains which can be
used by the pilot to execute an emergency safe landing.
Following the DC-10 accident at Sioux City, Iowa in1989, the National Transportation Safety Board recom-
mended "Encourage research and development of backup
flight-control systems for newly certified wide-body air-
planes that utilize an alternate source of motive powerseparate from that source used for the conventional con-
trol system" (ref. 2). The problem in the general case is
that currently there is no satisfactory method onboard the
aircraft for effectively controlling the aircraft with a dis-
abled primary flight-control system. In addition, manual
throttle control of engines is extremely difficult because
of pilot unfamiliarity with dynamic response of the air-craft in this mode.
Dryden Flight Research Center (DFRC) investigated the
use of engine thrust for emergency flight control and has
presented results of simulation and flight studies of sev-
eral airplanes, including the B-720, Lear 24, F-15, B-727,C-402, and B-747 (refs. 3 and 4). Using an F-15 aircraft,
DFRC successfully demonstrated in 1993 in a series of
36 flights, including actual propulsion controlled aircraft
(PCA) landings, that throttle control of engines alone can
be used to augment or replace the aircraft primary flight-
control system to safely land the aircraft (refs. 5 and 6).
The DFRC concept used specifically developed control
laws in the aircraft flight-control computer system to drive
the engines in response to pilot input commands for bank
angle and flightpath angle. The PCA system flighthardware and software was developed and implemented
by McDonnell Douglas Aircraft (MDA) Company. As a
follow-on to the F-15 PCA flight tests, DFRC and MDAhave developed and implemented PCA control laws for
the MD-11 jet transport. Flight tests are planned to take
place in Aug.-Dec. 1995 (ref. 7).
AmesResearchCenter(ARC)hasconductedthreePCApilotedsimulationtestsforamid-sizejet transportinsup-portofandcomplementarytothePCAtestsconductedbyDFRC.
ThisreportdescribestheconceptofaPCA,discussespilotcontrols,displays,andprocedures;andpresentstheresultsofaseriesofthreepilotedsimulationevaluationsof theconceptbyacross-sectionofairtransportpilots.
1.1 Purpose of Each Series of NASA Ames PilotedSimulation Tests
A series of three piloted simulation tests have been con-
ducted at ARC to investigate propulsion control for safely
landing a mid-size jet transport which has experienced a
total primary flight-control failure. The first series of tests
was completed in July 1992 for the purpose of defining
the best interface for the pilot commands to drive the
engines. The second series of tests was completed in
Aug. 1994 for the purposes of investigating PCA display
requirements and to compare various PCA commandmodes. The third series of tests was completed in May
1995 for the purpose of investigating expanded PCA
operational capabilities throughout the full-flight
envelope.
2 Simulation Aircraft Description
The piloted simulations were conducted in the Advanced
Concepts Flight Simulator (ACFS) at ARC (table i).
2.1 ACTS Facility Description
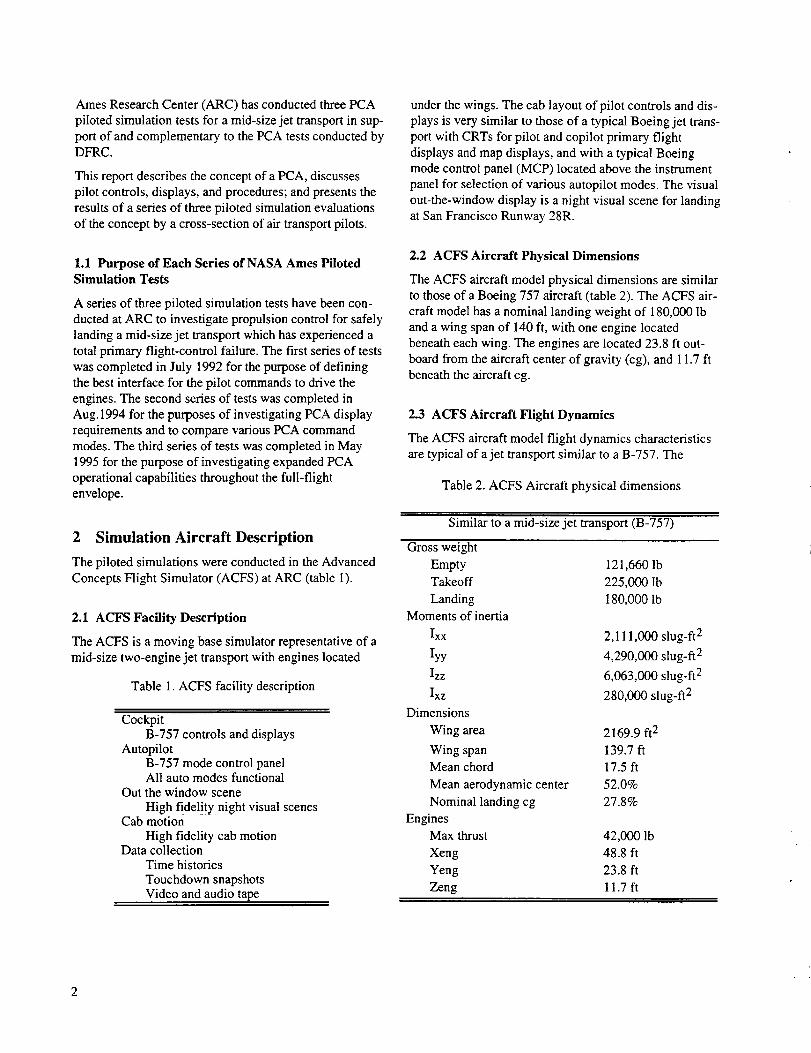
The ACFS is a moving base simulator representative of a
mid-size two-engine jet transport with engines located
Table 1. ACFS facility description
CockpitB-757 controls and displays
AutopilotB-757 mode control panelAll auto modes functional
Out the window scene
High fidelity night visual scenesCab motion
High fidelity cab motionData collection
Time histories
Touchdown snapshotsVideo and audio tape
under the wings. The cab layout of pilot controls and dis-
plays is very similar to those of a typical Boeing jet trans-
port with CRTs for pilot and copilot primary flight
displays and map displays, and with a typical Boeingmode control panel (MCP) located above the instrument
panel for selection of various autopilot modes. The visual
out-the-window display is a night visual scene for landingat San Francisco Runway 28R.
2.2 ACFS Aircraft Physical Dimensions
The ACFS aircraft model physical dimensions are similar
to those of a Boeing 757 aircraft (table 2). The ACFS air-
craft model has a nominal landing weight of 180,000 Ib
and a wing span of 140 ft, with one engine located
beneath each wing. The engines are located 23.8 ft out-
board from the aircraft center of gravity (cg), and 11.7 ft
beneath the aircraft cg.
2.3 ACFS Aircraft Flight Dynamics
The ACFS aircraft model flight dynamics characteristicsare typical of a jet transport similar to a B-757. The
Table 2. ACFS Aircraft physical dimensions
Similar to a mid-size jet transport (B-757)
Gross weight
Empty 121,660 Ib
Takeoff 225,000 Ib
Landing 180,000 lb
Moments of inertia
Ixx 2,111,000 slug-ft 2
Iyy 4,290,000 slug-ft 2
Izz 6,063,000 slug-ft 2
Ixz 280,000 slug-ft 2
Dimensions
Wing area 2169.9 ft 2
Wing span 139.7 ftMean chord 17.5 ft
Mean aerodynamic center 52.0%
Nominal landing cg 27.8%
Engines
Max thrust 42,000 lb
Xeng 48.8 ft
Yeng 23.8 ft
Zeng 11.7 ft
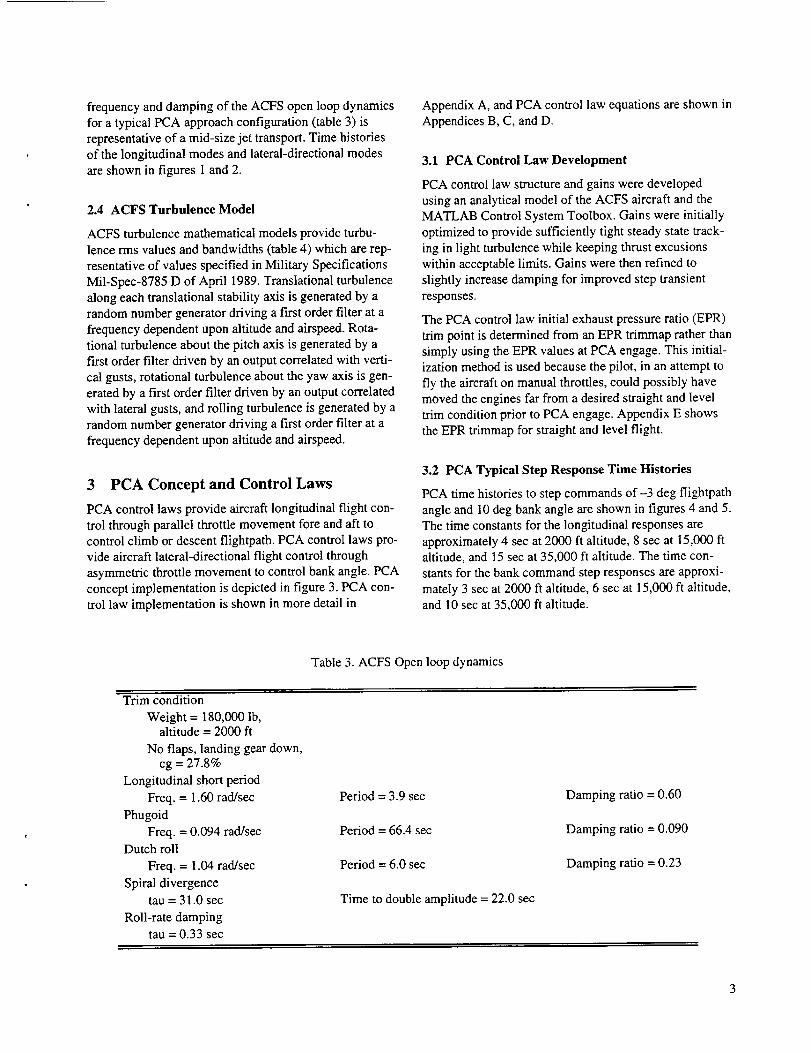
frequencyanddampingoftheACFSopenloopdynamicsforatypicalPCAapproachconfiguration(table3)isrepresentativeofamid-sizejet transport.Timehistoriesofthelongitudinalmodesandlateral-directionalmodesareshownin figures1and2.
2.4 ACFS Turbulence Model
ACFS turbulence mathematical models provide turbu-
lence rms values and bandwidths (table 4) which are rep-
resentative of values specified in Military Specifications
Mil-Spec-8785 D of April 1989. Translational turbulence
along each translational stability axis is generated by arandom number generator driving a first order filter at a
frequency dependent upon altitude and airspeed. Rota-tional turbulence about the pitch axis is generated by a
first order filter driven by an output correlated with verti-
cal gusts, rotational turbulence about the yaw axis is gen-
erated by a first order filter driven by an output correlated
with lateral gusts, and rolling turbulence is generated by a
random number generator driving a first order filter at a
frequency dependent upon altitude and airspeed.
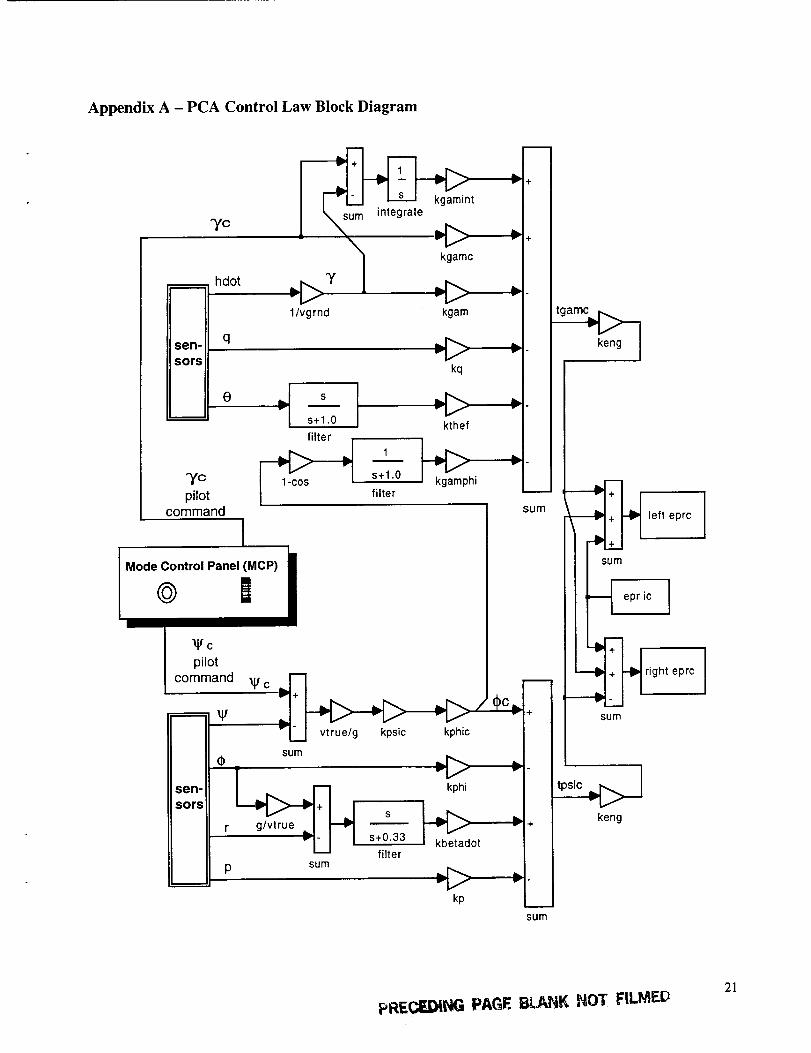
3 PCA Concept and Control Laws
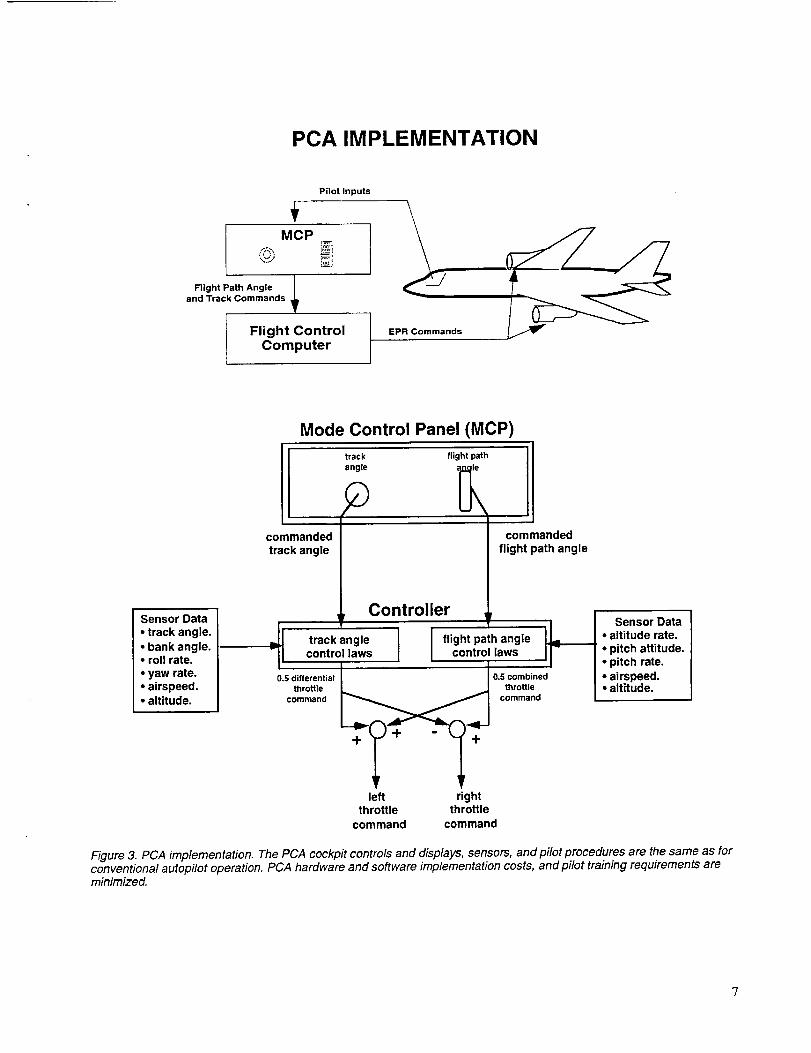
PCA control laws provide aircraft longitudinal flight con-
trol through parallel throttle movement fore and aft tocontrol climb or descent flightpath. PCA control laws pro-
vide aircraft lateral-directional flight control through
asymmetric throttle movement to control bank angle. PCA
concept implementation is depicted in figure 3. PCA con-
trol law implementation is shown in more detail in
Appendix A, and PCA control law equations are shown in
Appendices B, C, and D.
3.1 PCA Control Law Development
PCA control law structure and gains were developed
using an analytical model of the ACFS aircraft and the
MATLAB Control System Toolbox. Gains were initially
optimized to provide sufficiently tight steady state track-
ing in light turbulence while keeping thrust excusions
within acceptable limits. Gains were then refined to
slightly increase damping for improved step transient
responses.
The PCA control law initial exhaust pressure ratio (EPR)
trim point is determined from an EPR trimmap rather than
simply using the EPR values at PCA engage. This initial-ization method is used because the pilot, in an attempt to
fly the aircraft on manual throttles, could possibly havemoved the engines far from a desired straight and level
trim condition prior to PCA engage. Appendix E shows
the EPR trimmap for straight and level flight.
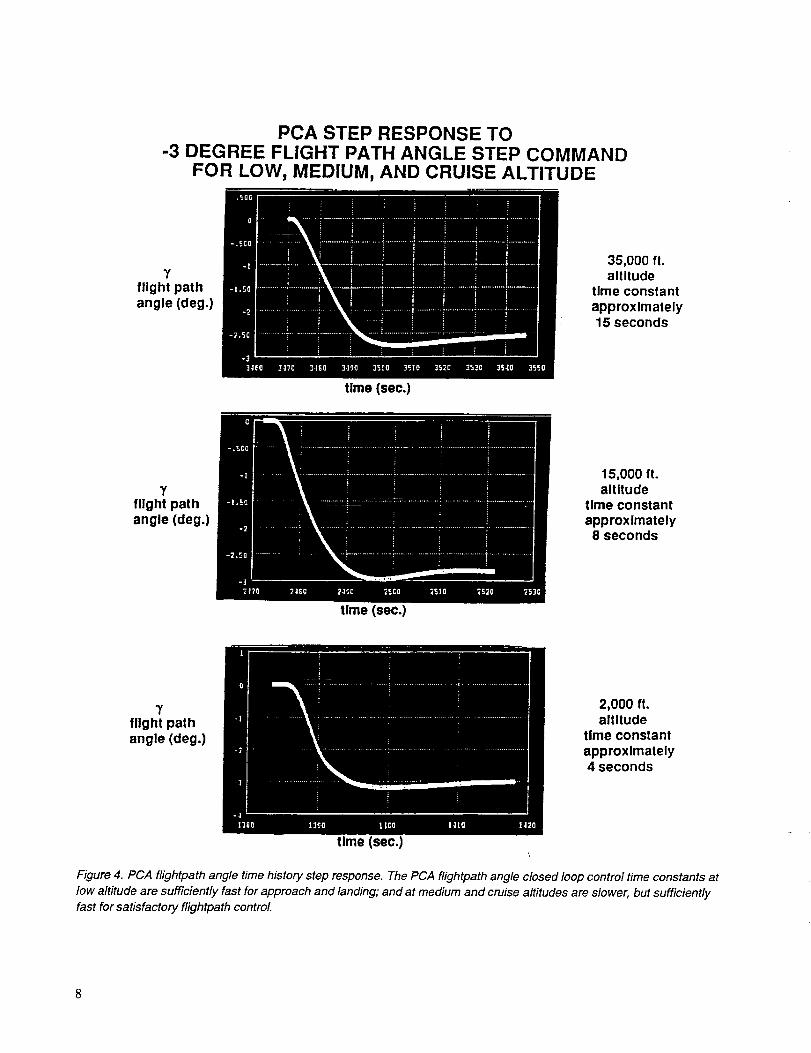
3.2 PCA Typical Step Response Time Histories
PCA time histories to step commands of-3 deg flightpath
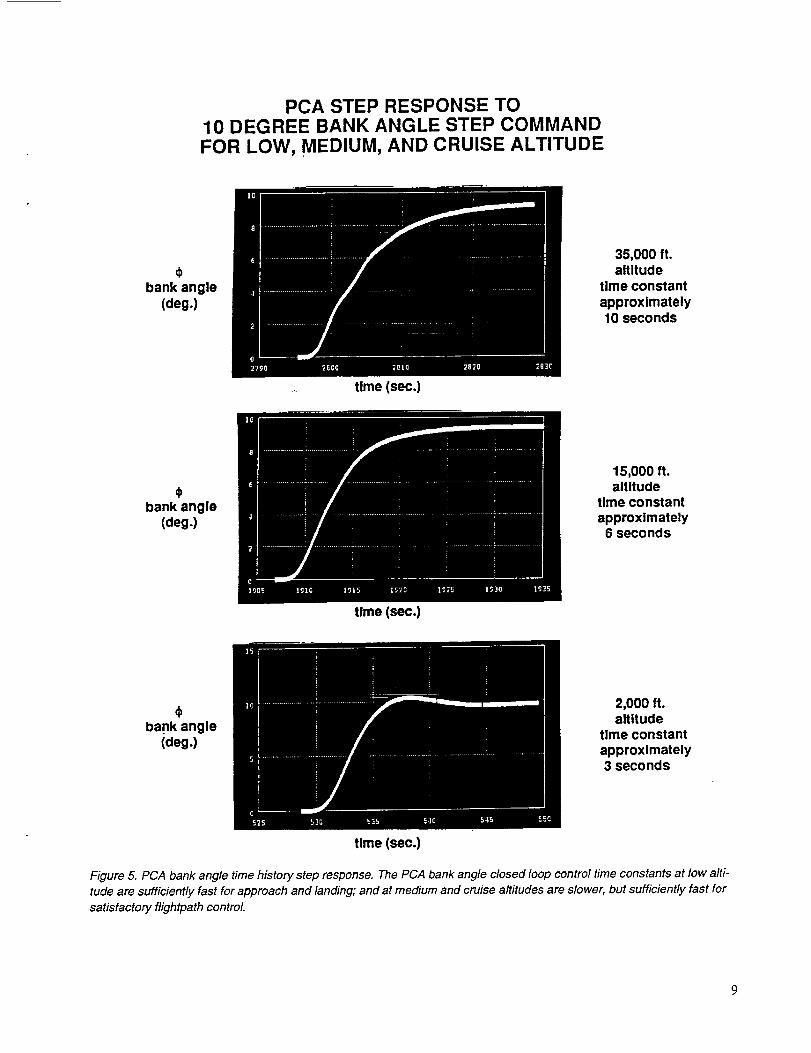
angle and 10 deg bank angle are shown in figures 4 and 5.The time constants for the longitudinal responses are
approximately 4 sec at 2000 ft altitude, 8 sec at 15,000 ftaltitude, and 15 sec at 35,000 ft altitude. The time con-
stants for the bank command step responses are approxi-
mately 3 sec at 2000 ft altitude, 6 sec at 15,000 ft altitude,
and 10 sec at 35,000 ft altitude.
Table 3. ACFS Open loop dynamics
Trim condition
Weight = 180,000 lb,altitude = 2000 ft
No flaps, landing gear down,cg = 27.8%
Longitudinal short period
Freq. = 1.60 rad/sec
Phugoid
Freq. = 0.094 rad/sec
Dutch roll
Freq. = 1.04 rad/sec
Spiral divergencetau = 31.0 sec
Roll-rate damping
tau = 0.33 sec
Period = 3.9 sec
Period = 66.4 sec
Period = 6.0 sec
Time to double amplitude = 22.0 sec
Damping ratio = 0.60
Damping ratio = 0.090
Damping ratio = 0.23
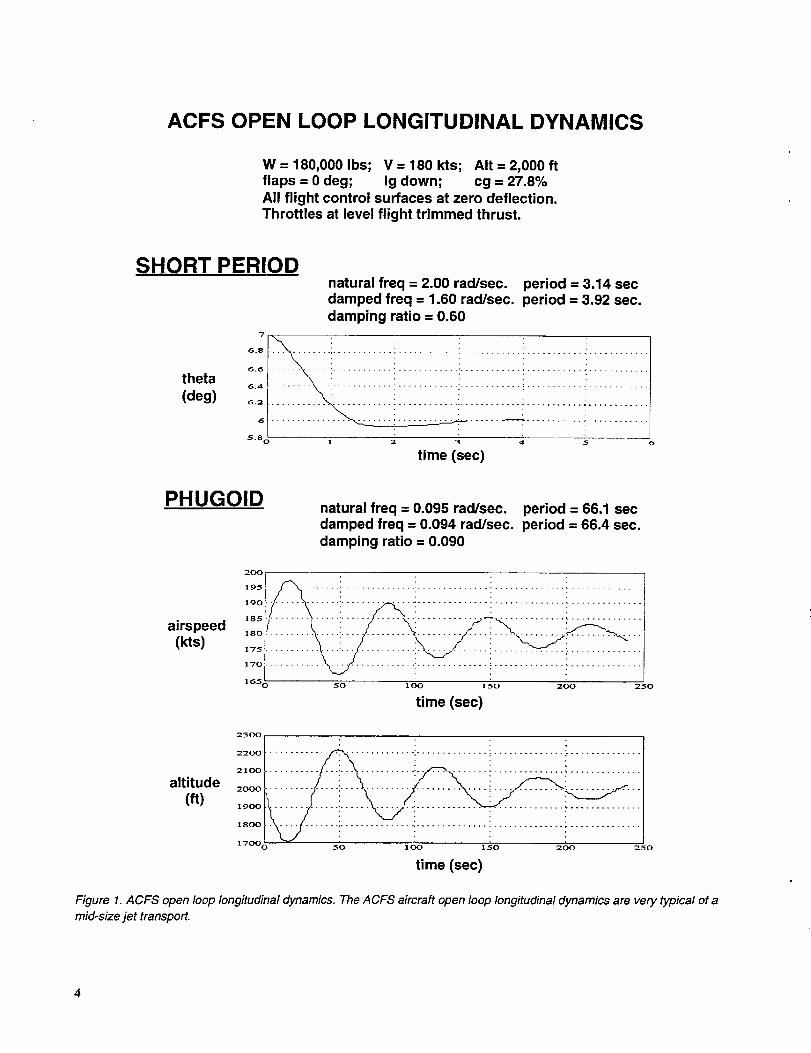
ACFS OPEN LOOP LONGITUDINAL DYNAMICS
W = 180,000 Ibs; V = 180 kts; AIt = 2,000 ftflaps = 0 deg; Ig down; cg = 27.8%All flight control surfaces at zero deflection.Throttles at level flight trimmed thrust.
SHORT PERIOD
theta
(deg)
natural freq = 2.00 rad/sec, period = 3.14 secdamped freq = 1.60 rad/sec, period = 3.92 sec.damping ratio = 0.60
time (sec)
PHUGOIDnatural freq = 0.095 rad/sec, period = 66.1 secdamped freq = 0.094 rad/sec, period = 66.4 sec.damping ratio = 0.090
airspeed(kts)
2O0
,8o i ..................... !....165_) 50 1 (90 150 200 250
time (sec)
altitude
(ft)
230O
2200
2100
20O0
1900
1800
i-7oo6 50 100 150 200 250
time (sec)
Figure 1. ACFS open loop Iongfudinal dynamics. The ACFS aircraft open loop longitudinal dynamics are very typical of a
mid-size jet transport.
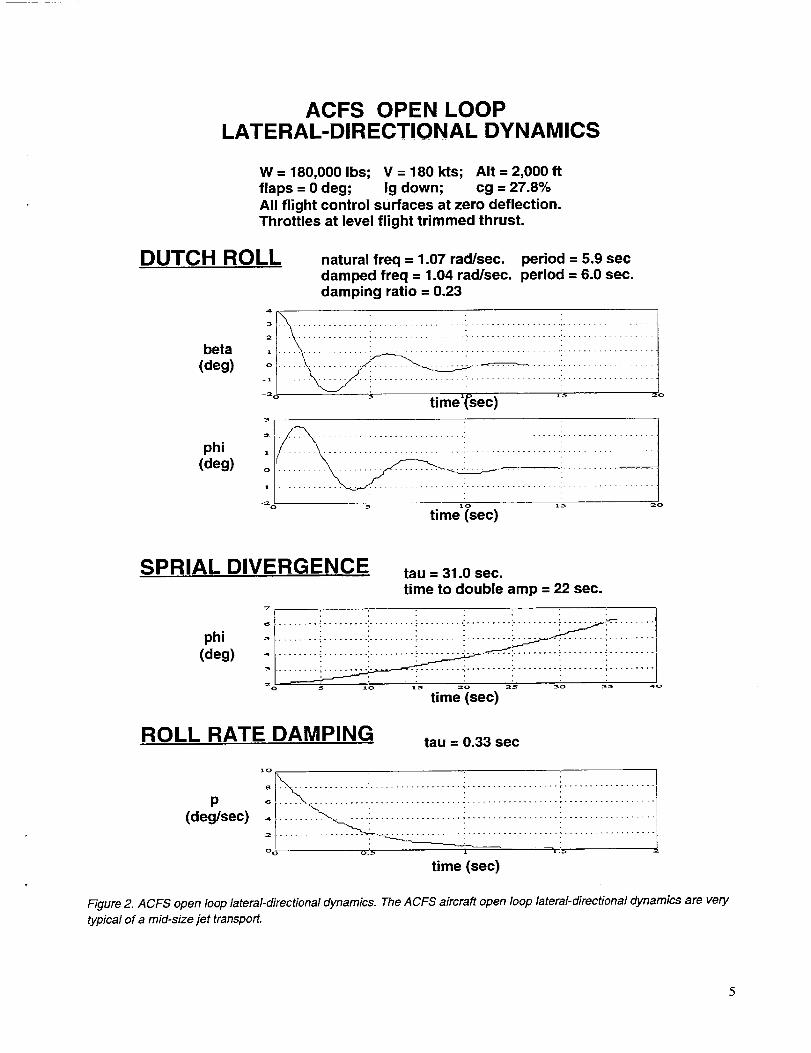
ACFS OPEN LOOPLATERAL-DIRECTIONAL DYNAMICS
W = 180,000 Ibs; V = 180 kts; AIt = 2,000 ftflaps = 0 deg; lg down; cg = 27.8%All flight control surfaces at zero deflection.Throttles at level flight trimmed thrust.
DUTCH ROLL
beta
(deg)
phi(deg)
natural freq = 1.07 rad/sec, period = 5.9 secdamped freq = 1.04 rad/sec, period = 6.0 sec.damping ratio = 0.23
-x ......... " Z _i
timel(_sec)
31 :
............ ',................... i ................... i ..................
o ................. ' ...... ' ................. i .............
:2O 5 10 15 _o
time (sec)
SPRIAL DIVERGENCE
phi(deg)
tau = 31.0 sec.time to double amp = 22 sec.
-7 ; _ _ . •
lt_ 2o 25
time (sec)
ROLL RATE DAMPING tau = 0.33 sec
P(deg/sec)
time (sec)
Figure 2. ACFS open loop lateral-directional dynamics. The ACFS aircraft open loop lateral-directional dynamics are very
typical of a mid-size jet transport.
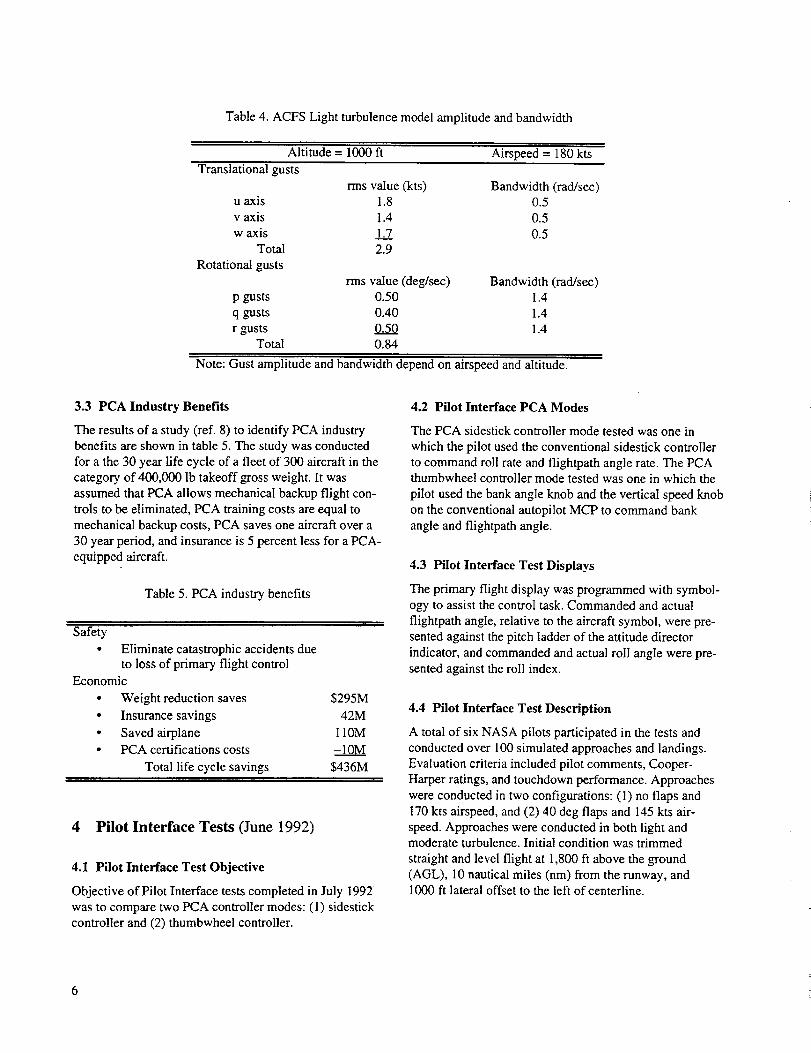
Table 4. ACFS Light turbulence model amplitude and bandwidth
Altitude = 1000 ft Airspeed = 180 kts
Translational gusts
rms value (kts) Bandwidth (rad/sec)u axis 1.8 0.5
v axis 1.4 0.5
w axis 1.___27 0.5Total 2.9
Rotational gusts
rms value (deg/sec) Bandwidth (rad/sec)p gusts 0.50 1.4
q gusts 0.40 1.4
r gusts 0.50 1.4Total 0.84
Note: Gust amplitude and bandwidth depend on airspeed and altitude.
3.3 PCA Industry Benefits
The results of a study (ref. 8) to identify PCA industry
benefits are shown in table 5. The study was conducted
for a the 30 year life cycle of a fleet of 300 aircraft in the
category of 400,000 Ib takeoff gross weight. It was
assumed that PCA allows mechanical backup flight con-trois to be eliminated, PCA training costs are equal to
mechanical backup costs, PCA saves one aircraft over a
30 year period, and insurance is 5 percent less for a PCA-
equipped aircraft.
Table 5. PCA industry benefits
Safety
• Eliminate catastrophic accidents dueto loss of primary flight control
Economic
• Weight reduction saves $295M
• Insurance savings 42M
• Saved airplane 110M
• PCA certifications costs -10M
Total life cycle savings $436M
4 Pilot Interface Tests (June 1992)
4.1 Pilot Interface Test Objective
Objective of Pilot Interface tests completed in July 1992
was to compare two PCA controller modes: (1) sidestickcontroller and (2) thumbwheel controller.
4.2 Pilot Interface PCA Modes
The PCA sidestick controller mode tested was one in
which the pilot used the conventional sidestick controller
to command roll rate and flightpath angle rate. The PCAthumbwheel controller mode tested was one in which the
pilot used the bank angle knob and the vertical speed knobon the conventional autopilot MCP to command bank
angle and flightpath angle.
4.3 Pilot Interface Test Displays
The primary flight display was programmed with symbol-
ogy to assist the control task. Commanded and actual
flightpath angle, relative to the aircraft symbol, were pre-
sented against the pitch ladder of the attitude director
indicator, and commanded and actual roll angle were pre-
sented against the roll index.
4.4 Pilot Interface Test Description
A total of six NASA pilots participated in the tests and
conducted over 100 simulated approaches and landings.
Evaluation criteria included pilot comments, Cooper-
Harper ratings, and touchdown performance. Approaches
were conducted in two configurations: (1) no flaps and
170 kts airspeed, and (2) 40 deg flaps and 145 kts air-
speed. Approaches were conducted in both light andmoderate turbulence. Initial condition was trimmed
straight and level flight at 1,800 ft above the ground
(AGL), 10 nautical miles (nm) from the runway, and1000 ft lateral offset to the left of centerline.
PCA IMPLEMENTATION
Pilot Inputs
MCP I
/Flight Path Angle |
and Track Commands
Flight ControlComputer
EPR Commands
Sensor Data
_ track angle.bank angle.
• roll rate.• yaw rate.• airspeed.• altitude,
Mode Control Panel (MCP)
track flight path
angle _n¢ le
co nmandedck angle
Controller! I
commandedflightpath angle
track angle flight path anglecontrol laws control laws
0.S differential 0.5 combinedthrottle throttle
command command
+ +
left rightthrottle throttle
command command
Sensor Data• altitude rate.• pitch attitude.• pitch rate.• airspeed.° altitude.
Figure 3. PCA implementation. The PCA cockpit controls and displays, sensors, and pilot procedures are the same as forconventional autopilot operation. PCA hardware and software implementation costs, and pilot training requirements areminimized.
PCA STEP RESPONSE TO-3 DEGREE FLIGHT PATH ANGLE STEP COMMAND
FOR LOW, MEDIUM, AND CRUISE ALTITUDE
7flight pathangle (deg.)
35,000 ft.altitude
time constantapproximately15 seconds
time (sec.)
7flight pathangle (deg.)
15,000 ft.altitude
time constantapproximately8 seconds
time (see.)
Tflight pathangle (deg.)
2,000 ft.altitude
time constantapproximately4 seconds
time (sec.)
Figure 4. PCA flightpath angletime history step response. The PCA flightpath angleclosed loop control time constants atlow altitude are sufficiently fast for approach and landing; and at medium and cruise altitudes are slower, but sufficientlyfast for satisfactory flightpath control
PCA STEP RESPONSE TO10 DEGREE BANK ANGLE STEP COMMANDFOR LOW, MEDIUM, AND CRUISE ALTITUDE
4_bank angle
(deg.)
35,000 ft.altitude
time constantapproximately10 seconds
time (sec.)
bank angle(deg.)
15,000 ft.altitude
time constantapproximately6 seconds
time (sec.)
bank angle(deg.)
2,000 ft.altitude
time constantapproximately3 seconds
time (sec.)
Figure 5. PCA bank angle time history step response. The PCA bank angle closed loop control time constants at low alti-tude are sufficientlyfast for approach and landing; and at medium and cruise altitudes are slower, but sufficiently fast forsatisfactory flightpath control
4.5 Pilot Interface Test Results
The sidestick control mode was slow and required contin-
uous pilot attention to achieve a desired command. It wasdifficult to make precise simultaneous multiaxis inputswith the sidestick. The thumbwheel mode allowed desired
commands to be set quickly using the digitaI window as
feedback. A disadvantage of the thumbwheel bank com-
mand was that the control knob had no zero angle detent,
thus requiring the pilot to look down in the cockpit to
determine if he had commanded zero bank angle.
The task defined for the Cooper-Harper ratings was to
land on the runway with a sink rate of less than 16 fps,
bank angle of less than 10 deg, and touchdown on the firsthalf of the runway. In all cases investigated (no flaps,
40 deg flaps, light and moderate turbulence), pilots pre-ferred the thumbwheel controller to the sidestick con-
troller. Average Cooper-Harper ratings for each case is
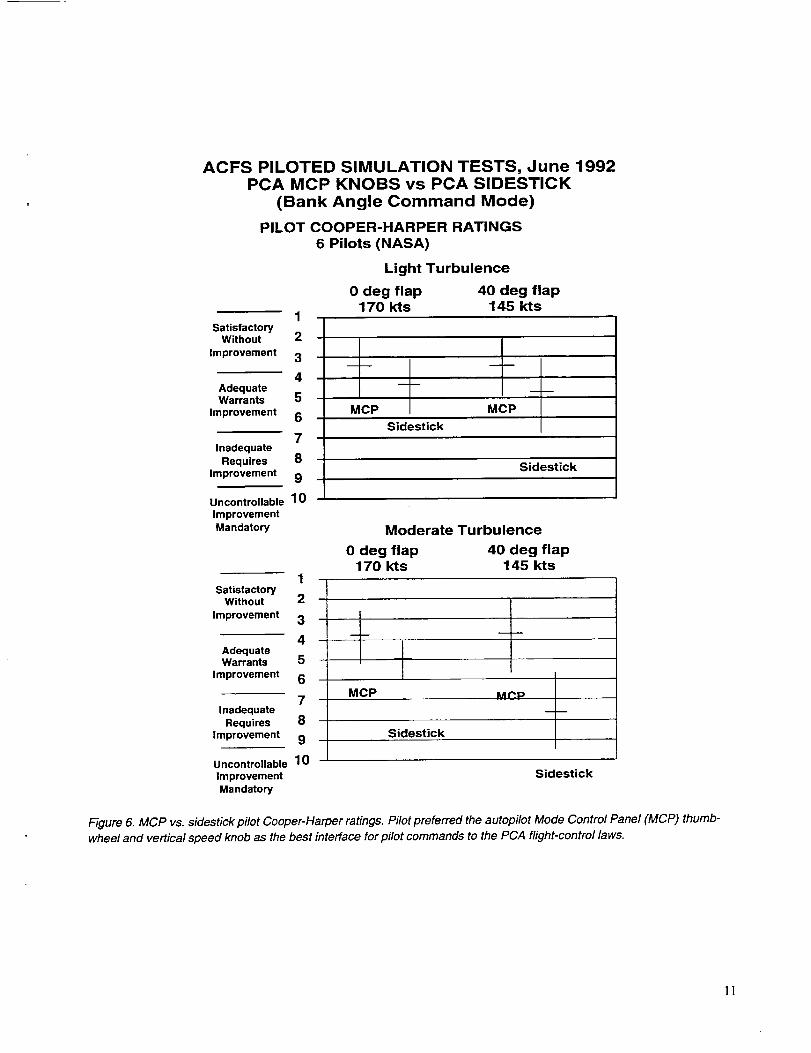
shown in figure 6. The mean rating with 0 deg flaps in the
sidestick mode was 4.5 compared to a mean rating with
the MCP thumbwheeI of 3.6. The mean rating with 40 deg
flaps in the sidestick mode was 5.1 compared to a mean
rating with the MCP thumbwheeI of 3.9.
4.6 Pilot Interface Test Conclusions
Pilots preferred the MCP thumbwheel controller to thesidestick controller for PCA approach and landing.
5 PCA Mode/Display Tests (Aug. 1994)
5.1 PCA Mode/Display Test Objectives
Objectives of the PCA Mode tests completed in Aug.
1994 were (1) to evaluate PCA bank mode vs. PCA head-
ing mode, and (2) to investigate PCA performance
enhancement with additional displays.
5.2 PCA Mode/Display Test Modes Tested
The PCA heading mode was one in which the pilot con-
trolled aircraft heading by commanding heading through
the heading select knob on the MCP. The PCA bank modewas one in which the pilot controlled aircraft bank angle
by commanding bank angle by using the same heading
select knob on the MCP. In the bank mode, the signals
from the heading select knob represent bank commands
rather than heading commands. PCA flightpath angle con-
trol was provided by pilot inputs using the MCP vertical
speed knob. A digital command readout was provided
above both the heading knob and the vertical speed knob.
5.3 PCA Mode/Display Test Displays Tested
Symbology was added to the conventional primary flight
director display to provide feedback to the pilot on com-manded flightpath angle and commanded bank angle in
addition to normal digital readouts on the MCP. The
commanded flightpath angle was a horizontal green bar
which moved vertically to the commanded flightpath
angle on the pitch attitude indicator. The commanded
bank angle command was achieved by rolling the same
horizontal green bar to the commanded bank angle.
5.4 PCA Mode/Display Test Description
The test matrix and approach sequence flown by each
pilot was carefully planned in order to obtain statisticallysignificant and valid data for comparison purposes. Prior
to conducting test data approaches, each pilot received anhour of checkout of the cab conventional controls and
displays, three approach and landings with conventional
sidestick and conventional autopilot modes, and three
PCA training approaches. In addition, the order of PCA
test data approaches was varied for each subject pilot to
eliminate mode sequence from statistical significance.
A total of 13 pilots (NASA, FAA, airline, and industry)
participated in the tests and conducted 261 approaches ineither bank mode or heading mode (half with and half
without the additional PCA displays on the primary flight
director). Approaches were conducted in both light and
moderate turbulence. Initial approach point condition was
trimmed straight and level flight at 2000 ft above the
ground (AGL), 10 nautical miles (nm) from the runway,and 2000 ft lateral offset to the left of centerline. Evalua-
tion criteria included pilot comments, Cooper-Harper rat-
ings, approach flightpath control performance, and touch-
down performance.
5.5 PCA Mode/Display Test Results
The PCA heading command mode required significantly
less pilot workload for approach and landing than did the
PCA bank command mode. This was because the pilot is
required to input fewer commands using the MCP heading
command knob than is required when using the bank
command MCP knob. In addition, the bank angle com-
mand knob had no zero detent, thus requiring the pilot to
look down at the digital readout to determine if he had
commanded zero bank angle. However, pilots commented
that they felt they had more immediate control in the bank
command mode, particularly when crossing the runway
10
ACFS PILOTED SIMULATION TESTS, June 1992PCA MCP KNOBS vs PCA SIDESTICK
(Bank Angle Command Mode)
PILOT COOPER-HARPER RATINGS6 Pilots (NASA)
1Satisfactory
Without 2
Improvement 3
4AdequateWarrants 5
Improvement 6
7Inadequate
Requires 8
Improvement 9
Uncontrollable 10
Improvement
Mandatory
1Satisfactory
Without 2
Improvement 3
4AdequateWarrants 5 -
Improvement 6
7 -Inadequate
Requires 8 -
Improvement 9 -
Uncontrollable10 -Improvement
Mandatory
Light Turbulence
0 deg flap 40 deg flap170 kts 145 kts
-- m
MCP MCP
Sidestick I
Sidestick
Moderate Turbulence
0 deg flap 40 deg flap170 kts 145 kts
I
I
MCP Mp.p
Sidestick
Sidestick
Figure 6. MCP vs. sidestick pilot Cooper-Harper ratings. Pilot preferred the autopilot Mode Control Pane/(MCP) thumb-
wheel and vertical speed knob as the best interface for pilot commands to the PCA flight-control laws.
1]
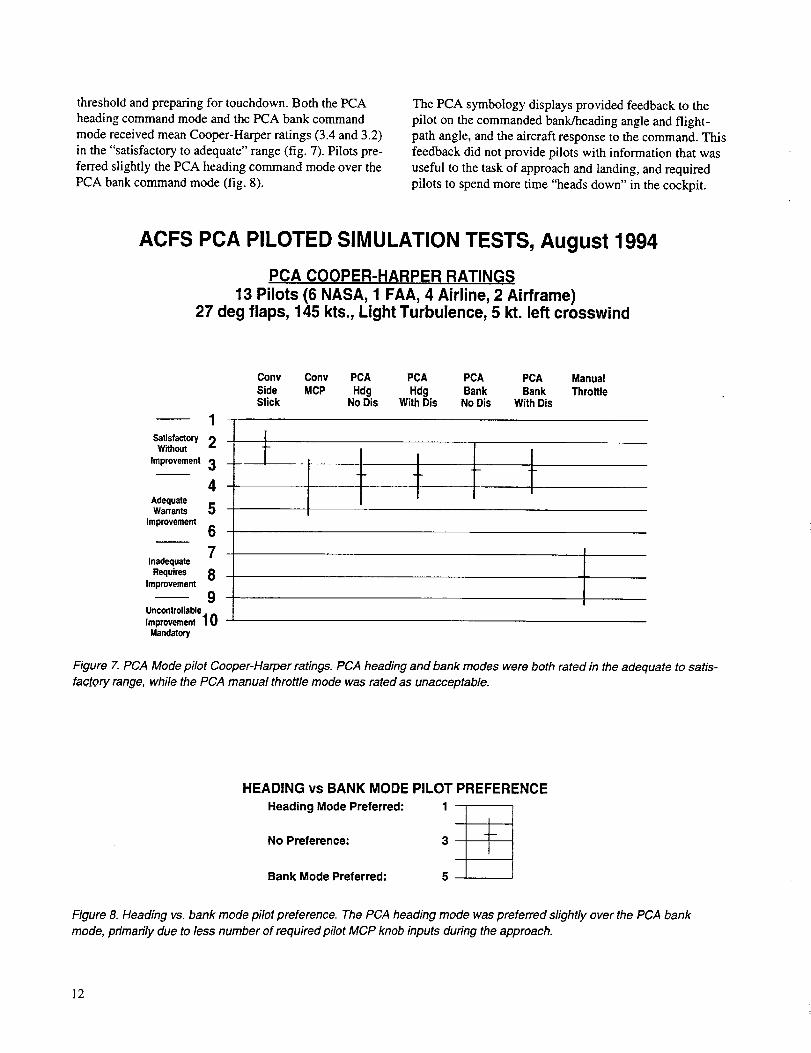
threshold and preparing for touchdown. Both the PCA
heading command mode and the PCA bank command
mode received mean Cooper-Harper ratings (3.4 and 3.2)
in the "satisfactory to adequate" range (fig. 7). Pilots pre-
ferred slightly the PCA heading command mode over the
PCA bank command mode (fig. 8).
The PCA symbology displays provided feedback to the
pilot on the commanded bank/heading angle and flight-path angle, and the aircraft response to the command, This
feedback did not provide pilots with information that was
useful to the task of approach and landing, and required
pilots to spend more time "heads down" in the cockpit.
ACFS PCA PILOTED SIMULATION TESTS, August 1994
PCA COOPER-HARPER RATINGS
13 Pilots (6 NASA, 1 FAA, 4 Airline, 2 Airframe)27 deg flaps, 145 kts., Light Turbulence, 5 kt. left crosswind
1
_,o_ 2Without
Improvement 34
AdequateWarrants 5
Improvement6
7Inadequate
Requires 8Improvement
9Uncontrollable
Improvement 10
Mandetoty
Cony Cony PCA PCA PCA PCA ManualSide MCP Hdg Hdg Bank Bank ThrottleStick No Dis WithDis NoDis WithDis
Figure 7. PCA Mode pilot Cooper-Harper ratings. PCA heading and bank modes were both rated in the adequate to satis-factory range, while the PCA manual throttle mode was rated as unacceptable.
HEADING vs BANK MODE PILOT PREFERENCE
Heading Mode Preferred: 1_ t
No Preference: 3
Bank Mode Preferred: 5
Figure 8. Heading vs. bank mode pilot preference. The PCA heading mode was preferred slightly over the PCA bank
mode, primarily due to less number of required pilot MCP knob inputs during the approach.
12
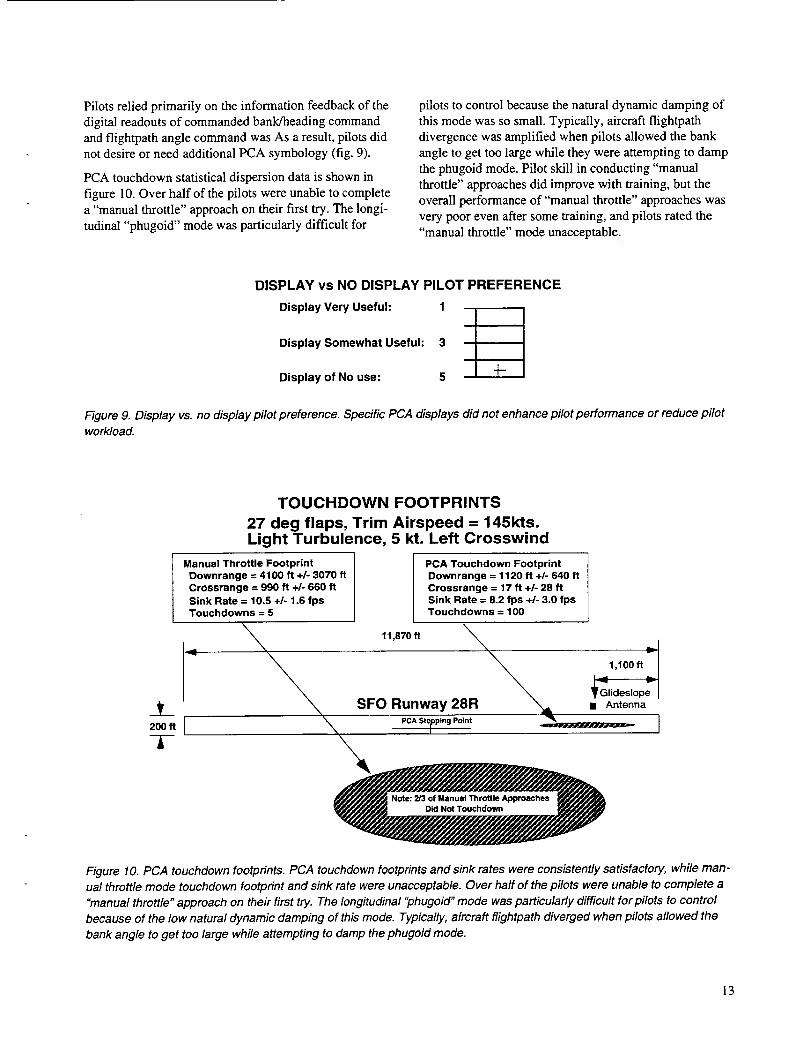
Pilots relied primarily on the information feedback of the
digital readouts of commanded bank/heading command
and flightpath angle command was As a result, pilots didnot desire or need additional PCA symbology (fig. 9).
PCA touchdown statistical dispersion data is shown in
figure 10. Over half of the pilots were unable to completea "manual throttle" approach on their first try. The longi-
tudinal "phugoid" mode was particularly difficult for
pilots to control because the natural dynamic damping of
this mode was so small. Typically, aircraft flightpath
divergence was amplified when pilots allowed the bank
angle to get too large while they were attempting to damp
the phugoid mode. Pilot skill in conducting "manualthrottle" approaches did improve with training, but the
overall performance of "manual throttle" approaches was
very poor even after some training, and pilots rated the"manual throttle" mode unacceptable.
DISPLAY vs NO DISPLAY PILOT PREFERENCE
Display Very Useful: 1
Display Somewhat Useful: 3
Display of No use: 5
Figure 9. Display vs. no display pilot preference. Specific PCA displays did not enhance pilot performance or reduce pilotworkload.
4
J__200 ft I
I
TOUCHDOWN FOOTPRINTS
27 deg flaps, Trim Airspeed = 145kts.Light Turbulence, 5 kt. Left Crosswind
Manual Throttle Footprint
Downrange = 4100 ft +/- 3070 ft
Crossrange = 990 ft +/- 660 ft
Sink Rate = 10.5 +/- 1.6 fpsTouchdowns = 5
\
PCA Touchdown Footprint
Downrange = 1120 ft +/- 640 ft
Crossrange = 17 ft +/- 28 ft
Sink Rate = 8.2 fps +/- 3.0 fpsTouchdowns = 100
11,870 ft
SFO Runway 28R _ • Antenna
PCASto_plngPoint I
\
Figure 10. PCA touchdown footprints. PCA touchdown footprints and sink rates were consistently satisfactory, while man-
ual throttle mode touchdown footprint and sink rate were unacceptable. Over half of the pilots were unable to complete a
"manual throttle" approach on their first try. The longitudinal "phugoid" mode was particularly difficult for pilots to control
because of the low natural dynamic damping of this mode. Typically, aircraft flightpath diverged when pilots allowed the
bank angle to get too large while attempting to damp the phugoid mode.
13
5.6 PCA Mode/Display Test Conclusions
Pilots rated the bank mode and heading mode about equal
(Cooper-Harpers both about 3.8), but preferred the head-
ing mode over the bank mode. Additional displays for
PCA on the primary flight director were not helpful in
flying the approach and landing.
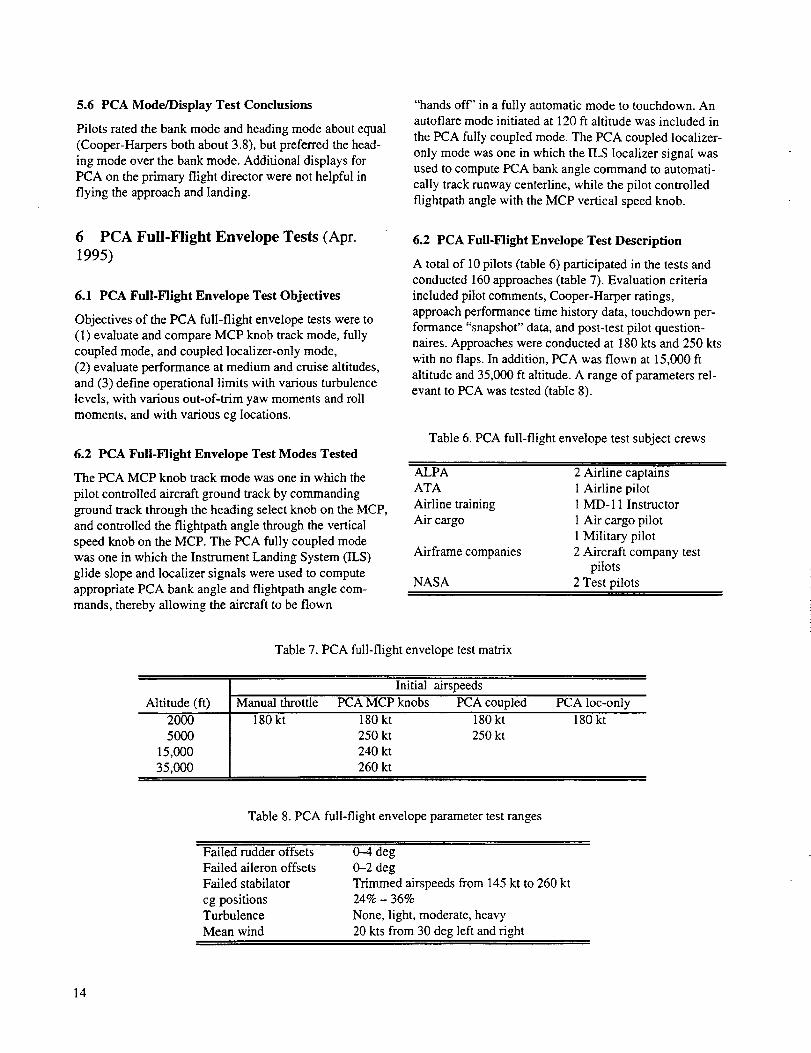
6 PCA Full-Flight Envelope Tests (Apr.
1995)
6.1 PCA Full-Flight Envelope Test Objectives
Objectives of the PCA full-flight envelope tests were to
(1) evaluate and compare MCP knob track mode, fully
coupled mode, and coupled localizer-only mode,
(2) evaluate performance at medium and cruise altitudes,
and (3) define operational limits with various turbulence
levels, with various out-of-trim yaw moments and roll
moments, and with various cg locations.
6.2 PCA Full-Flight Envelope Test Modes Tested
The PCA MCP knob track mode was one in which the
pilot controlled aircraft ground track by commanding
ground track through the heading select knob on the MCP,
and controlled the flightpath angle through the vertical
speed knob on the MCP. The PCA fully coupled mode
was one in which the Instrument Landing System OLS)
glide slope and localizer signals were used to compute
appropriate PCA bank angle and flightpath angle com-
mands, thereby allowing the aircraft to be flown
"hands off" in a fully automatic mode to touchdown. Anautoflare mode initiated at 120 ft altitude was included in
the PCA fully coupled mode. The PCA coupled localizer-
only mode was one in which the ILS localizer signal was
used to compute PCA bank angle command to automati-
cally track runway centerline, while the pilot controlled
flightpath angle with the MCP vertical speed knob.
6.2 PCA Full-Flight Envelope Test Description
A total of 10 pilots (table 6) participated in the tests andconducted 160 approaches (table 7). Evaluation criteria
included pilot comments, Cooper-Harper ratings,
approach performance time history data, touchdown per-
formance "snapshot" data, and post-test pilot question-
naires. Approaches were conducted at 180 kts and 250 kts
with no flaps. In addition, PCA was flown at 15,000 ft
altitude and 35,000 fl altitude. A range of parameters rel-evant to PCA was tested (table 8).
Table 6. PCA full-flight envelope test subject crews
ALPA 2 Airline captains
ATA 1 Airline pilot
Airline training 1 MD-11 Instructor
Air cargo I Air cargo pilot
1 Military pilot
Airframe companies 2 Aircraft company testpilots
NASA 2 Test pilots
Table 7. PCA full-flight envelope test matrix
Initial airspeeds
Altitude (ft) Manual throttle PCA MCP knobs PCA coupled PCA loc-only
2000 180 kt 180 kt 180 kt 180 kt
5000 250 kt 250 kt
15,000 240 kt
35,000 260 kt
Table 8. PCA full-flight envelope parameter test ranges
Failed rudder offsets 0-4 deg
Failed aileron offsets 0-2 deg
Failed stabilator Trimmed airspeeds from 145 kt to 260 kt
cg positions 24% - 36%
Turbulence None, light, moderate, heavy
Mean wind 20 kts from 30 deg left and right
14
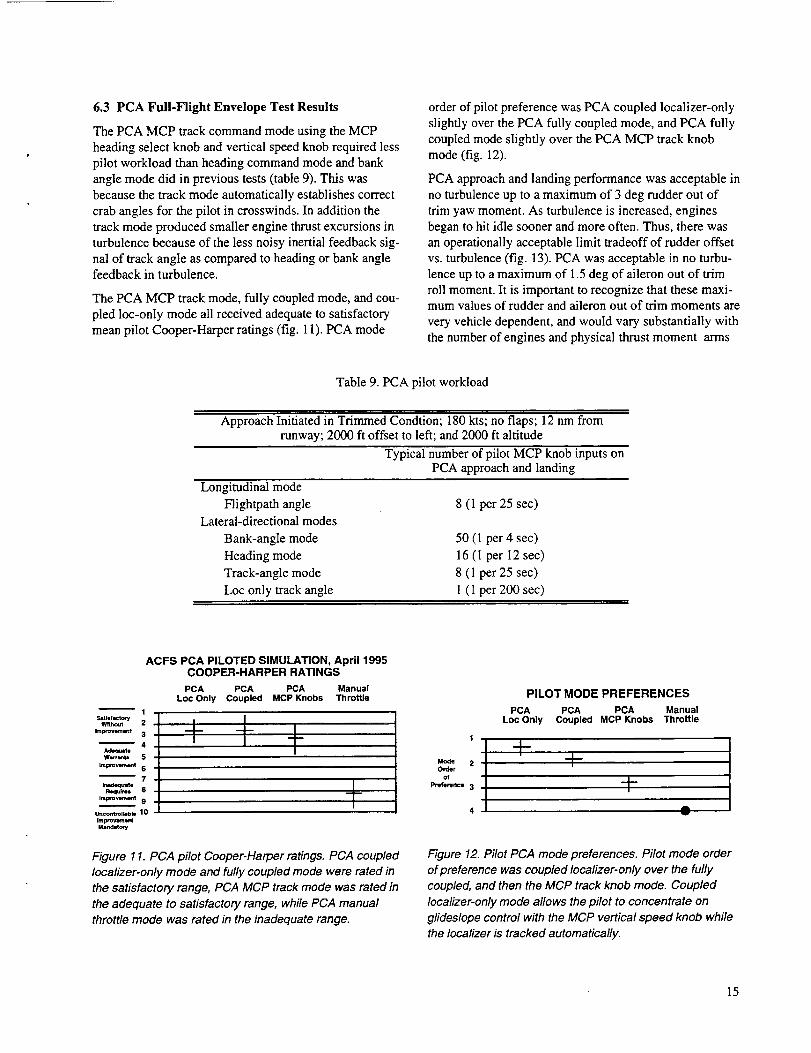
6.3PCAFull-Flight Envelope Test Results
The PCA MCP track command mode using the MCP
heading select knob and vertical speed knob required less
pilot workload than heading command mode and bank
angle mode did in previous tests (table 9). This was
because the track mode automatically establishes correct
crab angles for the pilot in crosswinds. In addition the
track mode produced smaller engine thrust excursions in
turbulence because of the less noisy inertial feedback sig-
nal of track angle as compared to heading or bank anglefeedback in turbulence.
The PCA MCP track mode, fully coupled mode, and cou-
pled loc-only mode all received adequate to satisfactory
mean pilot Cooper-Harper ratings (fig. 11). PCA mode
order of pilot preference was PCA coupled localizer-only
slightly over the PCA fully coupled mode, and PCA fully
coupled mode slightly over the PCA MCP track knob
mode (fig. 12).
PCA approach and landing performance was acceptable in
no turbulence up to a maximum of 3 deg rudder out of
trim yaw moment. As turbulence is increased, engines
began to hit idle sooner and more often. Thus, there was
an operationally acceptable limit tradeoff of rudder offset
vs. turbulence (fig. 13). PCA was acceptable in no turbu-
lence up to a maximum of 1.5 deg of aileron out of trim
roll moment. It is important to recognize that these maxi-mum values of rudder and aileron out of trim moments are
very vehicle dependent, and would vary substantially with
the number of engines and physical thrust moment arms
Table 9. PCA pilot workload
Approach Initiated in Trimmed Condtion; 180 kts; no flaps; 12 nm fromrunway; 2000 ft offset to left; and 2000 ft altitude
Typical number of pilot MCP knob inputs onPCA approach and landing
Longitudinal mode
Flightpath angle
Lateral-directional modes
Bank-angle mode
Heading mode
Track-angle mode
Loc only track angle
8 (1 per 25 sec)
50 (1 per 4 sec)
16 (1 per 12 sec)
8 (1 per 25 sec)
1 (1 per 200 sec)
ACFS PCA PILOTED SIMULATION, April 1995COOPER-HARPER RATINGS
PCA PCA PCA Manual
Loc Only Coupled MCP Knobs Throttle
1
lmp_ovlmerd
Mandatory
Figure 11. PCA pilot Cooper-Harper ratings. PCA coupledIocalizer-only mode and fully coupled mode were rated in
the satisfactory range, PCA MCP track mode was rated in
the adequate to satisfactory range, while PCA manual
throttle mode was rated in the inadequate range.
Mode 2Order
of
Prefenmce 3
PILOT MODE PREFERENCES
PCA PCA PCA Manual
Loc Only Coupled MCP Knobs Throttle
t4 A
w
Figure 12. Pilot PCA mode preferences. Pilot mode order
of preference was coupled Iocalizer-only over the fullycoupled, and then the MCP track knob mode. Coupled
Iocalizer-only mode allows the pilot to concentrate on
glideslope control with the MCP vertical speed knob whilethe Iocalizer is tracked automatically.
15
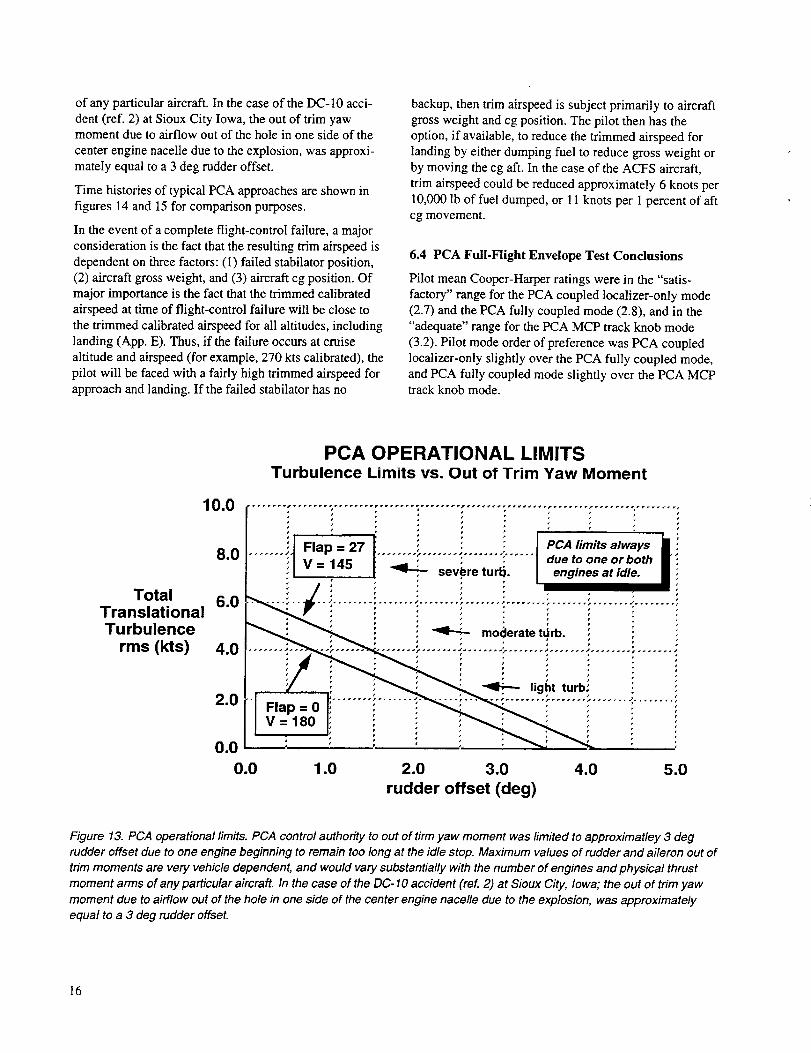
of any particular aircraft. In the case of the DC-10 acci-
dent (ref. 2) at Sioux City Iowa, the out of trim yawmoment due to airflow out of the hole in one side of the
center engine nacelle due to the explosion, was approxi-
mately equal to a 3 deg rudder offset.
Time histories of typical PCA approaches are shown in
figures 14 and 15 for comparison purposes.
In the event of a complete flight-control failure, a major
consideration is the fact that the resulting trim airspeed is
dependent on three factors: (1) failed stabilator position,
(2) aircraft gross weight, and (3) aircraft cg position. Ofmajor importance is the fact that the trimmed calibrated
airspeed at time of flight-control failure will be close to
the trimmed calibrated airspeed for all altitudes, including
landing (App. E). Thus, if the failure occurs at cruise
altitude and airspeed (for example, 270 kts calibrated), the
pilot will be faced with a fairly high trimmed airspeed for
approach and landing. If the failed stabilator has no
backup, then trim airspeed is subject primarily to aircraftgross weight and cg position. The pilot then has the
option, if available, to reduce the trimmed airspeed for
landing by either dumping fuel to reduce gross weight orby moving the cg aft. In the case of the ACFS aircraft,
trim airspeed could be reduced approximately 6 knots per
10,000 lb of fuel dumped, or 11 knots per I percent of aftcg movement.
6.4 PCA Full-Flight Envelope Test Conclusions
Pilot mean Cooper-Harper ratings were in the "satis-
factory" range for the PCA coupled localizer-only mode(2.7) and the PCA fully coupled mode (2.8), and in the
"adequate" range for the PCA MCP track knob mode
(3.2). Pilot mode order of preference was PCA coupled
localizer-only slightly over the PCA fully coupled mode,and PCA fully coupled mode slightly over the PCA MCPtrack knob mode.
10.0
8.0
PCA OPERATIONAL LIMITSTurbulence Limits vs. Out of Trim Yaw Moment
Total 6.0TranslationalTurbulence
rms (kts) 4.0
2.0
il r....... Flap = 27 ......................... ; ..... due to one or both
V = 145 _ sev,_re turin, engines at idle.
_ m°_leratetirb" i ! i
i/ i i"_ i _ _" 'ight turbi i
..oJi i i ,,1.0 2.0 3.0 4.0 5.0
rudder offset (deg)
Figure 13. PCA operational limits. PCA control authority to out of tirm yaw moment was limited to approximatley 3 degrudder offset due to one engine beginning to remain too long at the idle stop. Maximum values of rudder and aileron out of
trim moments are very vehicle dependent, and would vary substantially with the number of engines and physical thrustmoment arms of any particular aircraft. In the case of the DC- 10 accident (ref. 2) at Sioux City, Iowa; the out of trim yaw
moment due to airflow out of the hole in one side of the center engine nacelle due to the explosion, was approximately
equal to a 3 deg rudder offset.
16
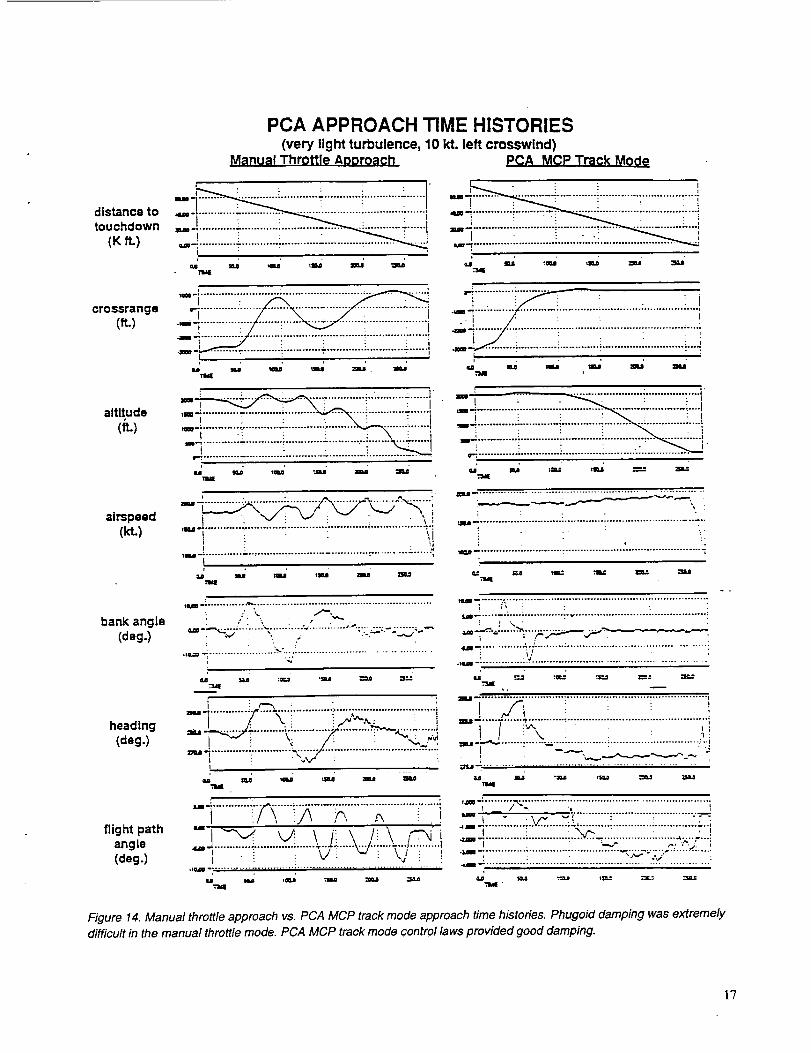
distance totouchdown
(K ft.)
crossrange(ft.)
altitude
airspeed(kt.)
bank angle(dag.)
heading(dag.)
flight pathangle(deg.)
PCA APPROACH TIME HISTORIES(very light turbulence, 10 kt. left crosswind)
Manupl Throttle AoDrOPCh
............:,............i......1............:-............!............=........_............+......t=-,==========================================,
U _ I_ tIJJ _"nMI
============================================================I
, , . , ,
tOaJI ms= _U.r_ I
t ; : . . . ]"
,--n_Y:Z ......i............-......'======================================================
i v : _ : z . ...'_._..,IILll o. 0. .......... . ............. : .......... .............. .0 .......... • .
_ \JU Ull _ tl,0 J _
Ul_l -; ............ 0,. ...........................................................
I
I i p--_ i " !
................. illl ......--'i, ............"............_.';,;zi ......
i
BjI, IIMII _ I0_,1 _ :IIM
........... .............. i ...... _..._.: ...... ",.../..; ........ 1...'.......
-7 "} _ k/ '-": kJ :: !• Hl,,ml ........... i....... 1.....................................................
IIMI,_4 E _ lo=,JI :m,,o _
PCA MCP Track Mode
%,,, ..- ,,u" .-. .,--' =u'
::::::::::::::::::::::::::::::::::::::::::::::::::::::::::::::
,,,=..:,......;,,......:............._..........................._.................._
.,.=-, ............. '.. .........._............................................ ::_ . _,'
4(L,JB ........................................................................
CM_ _ =eL= :_...1 :ll=::
-" ...... 7......7,:k:.........::.............:............. i...................
I : ---".-" " " "]
I._" . --_._;. ............ "............................ .'.",_=
.,,=.! ............._.._..........;- ...........:.............:.............._..;J ...........................;.__..i .............:.............'.J
''" -,.............:.............:................"__'%:;."..............i
u _4.0 tl::u 11=.= , ,r'. :3O.=,"_"
Figure 14. Manual throttle approach vs. PCA MOP track mode approach time histories. Phugoid damping was extremelydifficult in the manual throttle mode. PCA MCP track mode control laws provided good damping.
l'7
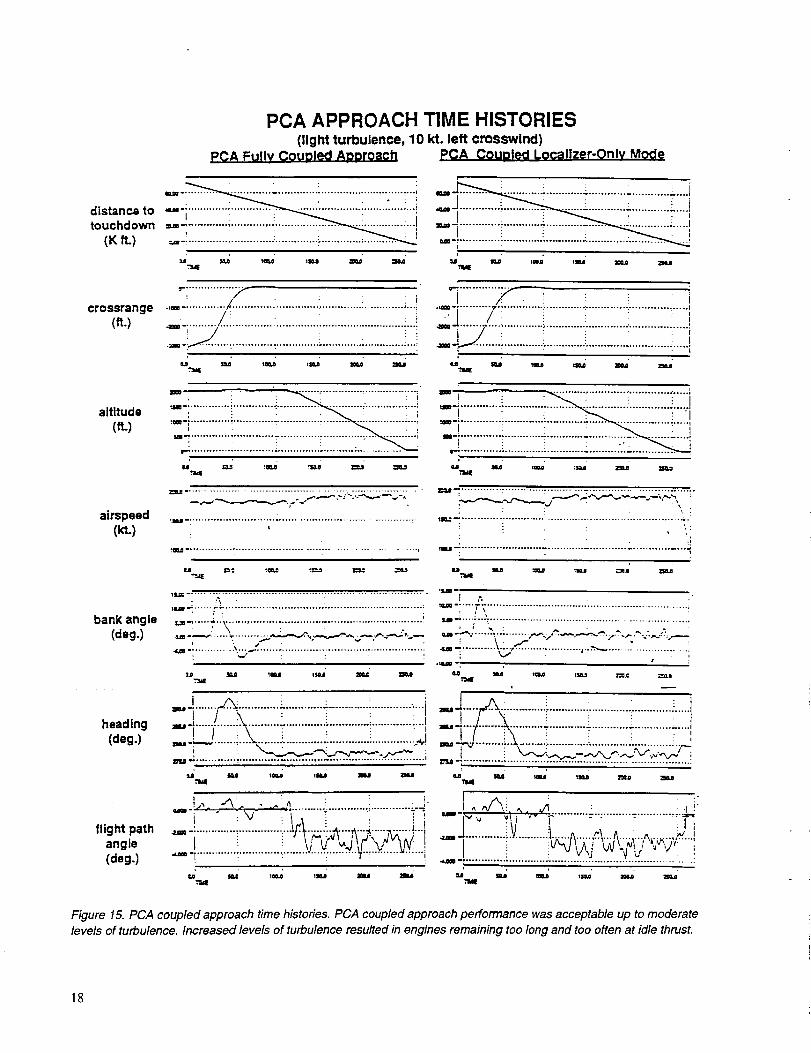
distanca totouchdown
(K ft.)
crossrange(ft.)
altitude
(ft.)
airspeed(kL)
bank angle(deg.)
heading(deg.)
flight pathangle(deg.)
PCA APPROACH TIME HISTORIES(light turbulence, 10 kt. left cmsswind)
PCA Fully Coupled ADoroach
! : : , :
_jB__iiiii._, ; : ; ................. !
PCA CouDled Locallzer-Onlv Mode
r
=_ .......i............:............-............_....!
=====================================!I i i _ : ,_-__
.,.:11111111111117......................_.............._.............i...!= ...........,/.i..............!.............._..........................._...! .._[........7i .............i.............i............._.............!,
.._ Jr.._.........:...........................i..........................._.....I
•.,-:.............i.............i..............: ............-.............i...I: : . , : : ;
"='i ............. ;-............. _.............. :'......................... ;""!,,.-:,........................................................_"............._, ............._...............
=1 : : "..........i ............_.............i"''''=
_._._.._-._-__............_........_.........•..........._
.................................... ..--_-.-, --,-".::._.....=-- . .
to_ll - ..................................................... i
,_,-:......:...\ ...............:..............:.................................._-_" ...... : ........ .:;_,_. _ _,.._._ ,_,.---_--_ :;_
-=-i............::,::.-":"......i.............................:.................:
: i : i i
::::::::::::::::::::::::::::::::::::::::::::::::::....:::::::::::i:::i,,=_,.._.......!....X........_............................i..............i.,J,,.,.!...................___-...._..._L.:,
I : : • : 1
"_............. •............. "............. .......... '-,r'"........... :'"i
! i : : ;:
,=.t-: ........................... : .......................................... ;_
,_.;...,;.._ .................. _ ...........................................
"_ - ..........."_':'"":_'"_.,"'"'_ ...........r:""- ........................ :.,,..: 7 • :
=.q::::.5....._..........._............-........::::::::::::::::::::::::..._/ .........i..X,.........!.............i......:,;---!-_-:-:H_.!._:..,.......i....__.-._:.:_t ...'..,,:_...,:
• ; k ,-
- I"_ "_i" i"..........-- .........-............_T,
, .... , ,
Figure 15. PCA coupled approach time histories. PCA coupled approach performance was acceptable up to moderate
levels of turbulence. Increased levels of turbulence resulted in engines remaining too long and too often at idle thrust.
18
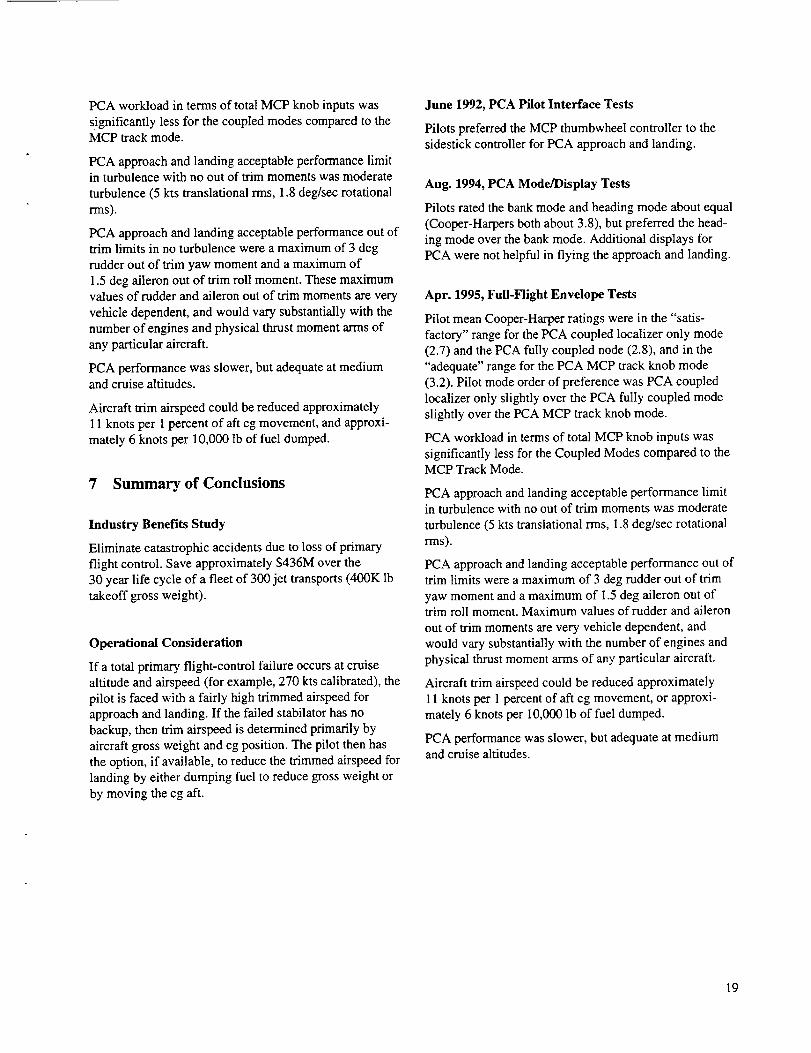
PCA workload in terms of total MCP knob inputs was
significantly less for the coupled modes compared to theMCP track mode.
PCA approach and landing acceptable performance limitin turbulence with no out of trim moments was moderate
turbulence (5 kts translational rms, 1.8 deg/sec rotational
rms).
PCA approach and landing acceptable performance out oftrim limits in no turbulence were a maximum of 3 deg
rudder out of trim yaw moment and a maximum of
1.5 deg aileron out of trim roll moment. These maximumvalues of rudder and aileron out of trim moments are very
vehicle dependent, and would vary substantially with the
number of engines and physical thrust moment arms of
any particular aircraft.
PCA performance was slower, but adequate at mediumand cruise altitudes.
Aircraft trim airspeed could be reduced approximately
11 knots per 1 percent of aft cg movement, and approxi-
mately 6 knots per 10,000 lb of fuel dumped.
7 Summary of Conclusions
Industry Benefits Study
Eliminate catastrophic accidents due to loss of primary
flight control. Save approximately $436M over the30 year life cycle of a fleet of 300 jet transports (400K Ib
takeoff gross weight).
Operational Consideration
If a total primary flight-control failure occurs at cruisealtitude and airspeed (for example, 270 kts calibrated), the
pilot is faced with a fairly high trimmed airspeed for
approach and landing. If the failed stabilator has nobackup, then trim airspeed is determined primarily by
aircraft gross weight and cg position. The pilot then has
the option, if available, to reduce the trimmed airspeed for
landing by either dumping fuel to reduce gross weight or
by moving the cg aft.
June 1992, PCA Pilot Interface Tests
Pilots preferred the MCP thumbwheel controller to the
sidesfick controller for PCA approach and landing.
Aug. 1994, PCA Mode/Display Tests
Pilots rated the bank mode and heading mode about equal
(Cooper-Harpers both about 3.8), but preferred the head-
ing mode over the bank mode. Additional displays forPCA were not helpful in flying the approach and landing.
Apr. 1995, Furl-Flight Envelope Tests
Pilot mean Cooper-Harper ratings were in the "satis-
factory" range for the PCA coupled localizer only mode
(2.7) and the PCA fully coupled node (2.8), and in the
"adequate" range for the PCA MCP track knob mode
(3.2). Pilot mode order of preference was PCA coupled
iocalizer only slightly over the PCA fully coupled mode
slightly over the PCA MCP track knob mode.
PCA workload in terms of total MCP knob inputs was
significantly less for the Coupled Modes compared to theMCP Track Mode.
PCA approach and landing acceptable performance limitin turbulence with no out of trim moments was moderate
turbulence (5 kts translational rms, 1.8 deg/sec rotational
rms).
PCA approach and landing acceptable performance out oftrim limits were a maximum of 3 deg rudder out of trim
yaw moment and a maximum of 1.5 deg aileron out oftrim roll moment. Maximum values of rudder and aileron
out of trim moments are very vehicle dependent, and
would vary substantially with the number of engines and
physical thrust moment arms of any particular aircraft.
Aircraft trim airspeed could be reduced approximately
11 knots per 1 percent of aft cg movement, or approxi-
mately 6 knots per 10,000 lb of fuel dumped.
PCA performance was slower, but adequate at mediumand cruise altitudes.
19

Appendix A - PCA Control Law Block Diagram
'yc
hdot
qsen-sors
e
t
urn integrate
NXj kgarnc
1/vgrnd kgam
s+1.0
filter
pilotcommand
I
gc
pilotcommand
I
[D w
sen-sors
r
P
kq
kthef
s+1.0 hi
filter
!I
-=+ I
;!h..
kphiI
s kb_etad _+s+0.33 ot
sum
/ _cv +
v U vtrue/g kpsic kphic [I
sum _p,,,,_ =.!
_ v [,,,/ ir -
sumfilter
m
left eprc
sum
--_ epr ic I
right eprc
tp.__SS'C
keng
PRECEDiI_IG PAGE BLANK NOT FILMED
21

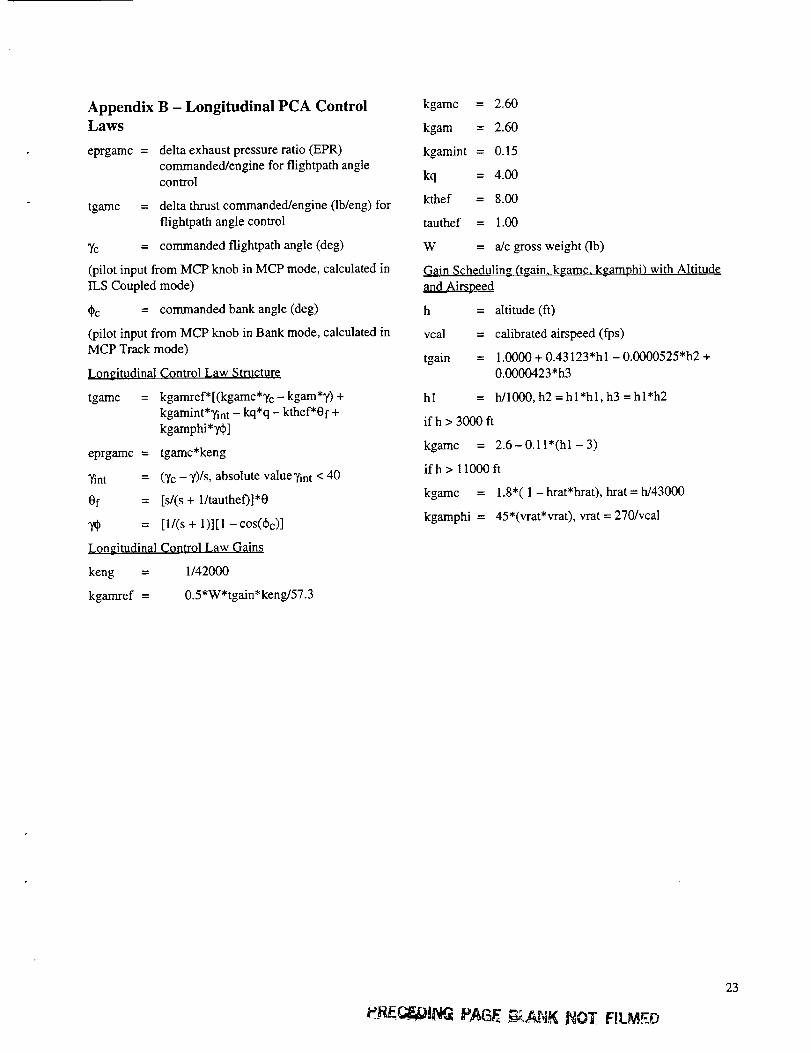
Appendix B - Longitudinal PCA Control
Laws
eprgamc = delta exhaust pressure ratio (EPR)
commanded/engine for flightpath anglecontrol
tgamc = delta thrust commanded/engine (lb/eng) forflightpath angle control
7c = commanded flightpath angle (deg)
(pilot input from MCP knob in MCP mode, calculated in
ILS Coupled mode)
_c = commanded bank angle (deg)
(pilot input from MCP knob in Bank mode, calculated inMCP Track mode)
Longitudinal Control Law Strgcture
tgamc =
eprgamc =
Tint =
Of =
Lon gitudi nal
keng =
kgamref =
kgamref* [(kgamc*Tc - kgam*7) +
kgamint*Tint - kq*q - kthef*0f +
kgamphi*Td_]
tgamc*keng
(Yc -y)/s, absolute valueyint < 40
[s/(s + 1/tauthef)]*0
[l/(s + 1)][1 - cos(_bc)]
Control Law Gains
1/42000
0.5 *W *tgain *keng/57.3
kgamc = 2.60
kgam = 2.60
kgamint = 0.15
kq = 4.00
kthef = 8.00
tauthef = 1.00
W = a/c gross weight (lb)
Gain Scheduling (tgain. kgamc, kgamp_hi) with Altitudeand Airspeed
h = altitude (ft)
vcal = calibrated airspeed (fps)
tgain = 1.0000 + 0.43123"h 1 - 0.0000525"h2 +0.0001M23*h3
hi = h/1000, h2=hl*hl,h3 =hl*h2
if h > 3000 fl
kgamc = 2.6-0.1 l*(hl - 3)
if h> 1 I000 ft
kgamc = 1.8"( 1 - hrat*hrat), hrat = h143000
kgamphi = 45*(vrat*vrat), vrat = 270/vcal
eR£ .C I G PAGE -ANK FIL O
23

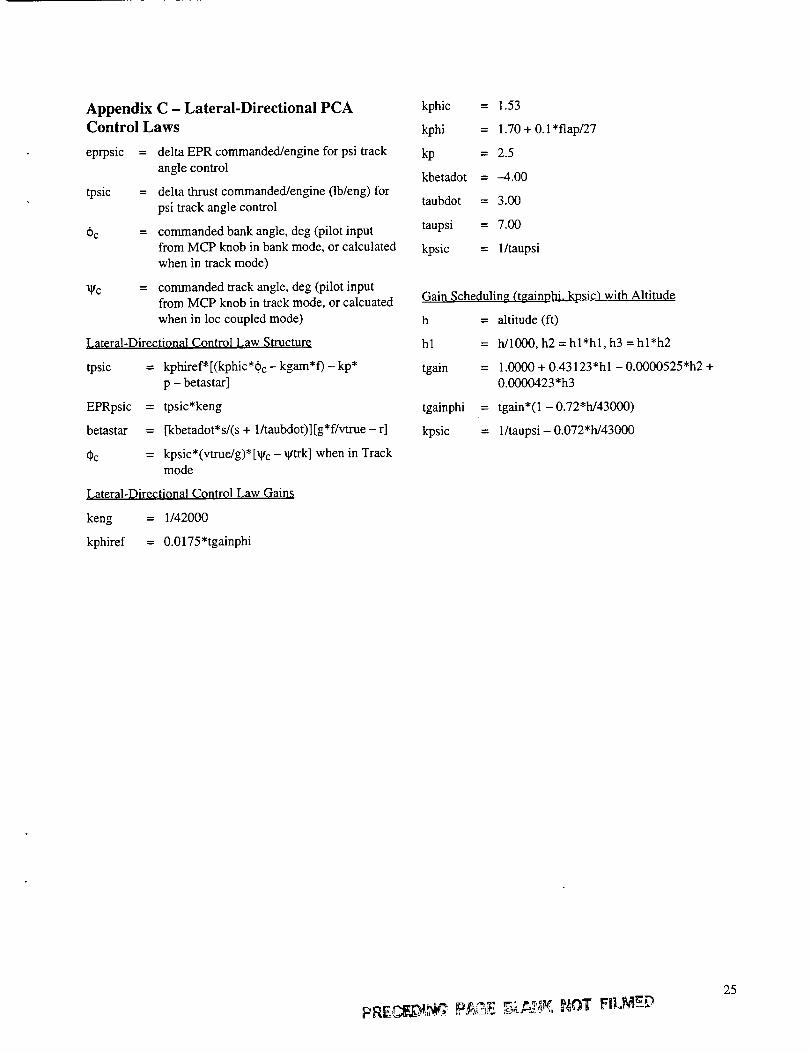
Appendix C - Lateral-Directional PCA
Control Laws
eprpsic = delta EPR commanded/engine for psi track
angle control
tpsic = delta thrust commanded/engine (lb/eng) for
psi track angle control
_c = commanded bank angle, deg (pilot inputfrom MCP knob in bank mode, or calculated
when in track mode)
• c = commanded track angle, deg (pilot inputfrom MCP knob in track mode, or calcuated
when in loc coupled mode)
Lateral-Directional Control Law Structure
tpsic = kphiref*[(kphic*Oc - kgam*f) - kp*
p - betastar]
EPRpsic = tpsic*keng
betastar = [kbetadot*s/(s + 1/taubdot)][g*f/vtrue - r]
Oc = kpsic*(vtrue/g)*[_c - _trk] when in Trackmode
Lateral-Directional Control Law Gains
keng = 1/42000
kphiref = 0.0175*tgainphi
kphic = 1.53
kphi = 1.70 + 0. l*flap/27
kp = 2.5
kbetadot = -4.00
taubdot = 3.00
taupsi = 7.00
kpsic = 1/taupsi
Gain Scheduling (tgainphi.kpsic) with Altitude
h = altitude (ft)
hl = h/1000, h2=hl*hl,h3 =hl*h2
tgain = 1.0000 + 0.43123"hl - 0.0000525"h2 +0.0000423"h3
tgainphi = tgain*(1 - 0.72"h/43000)
kpsic = 1/taupsi - 0.072"h/43000
25

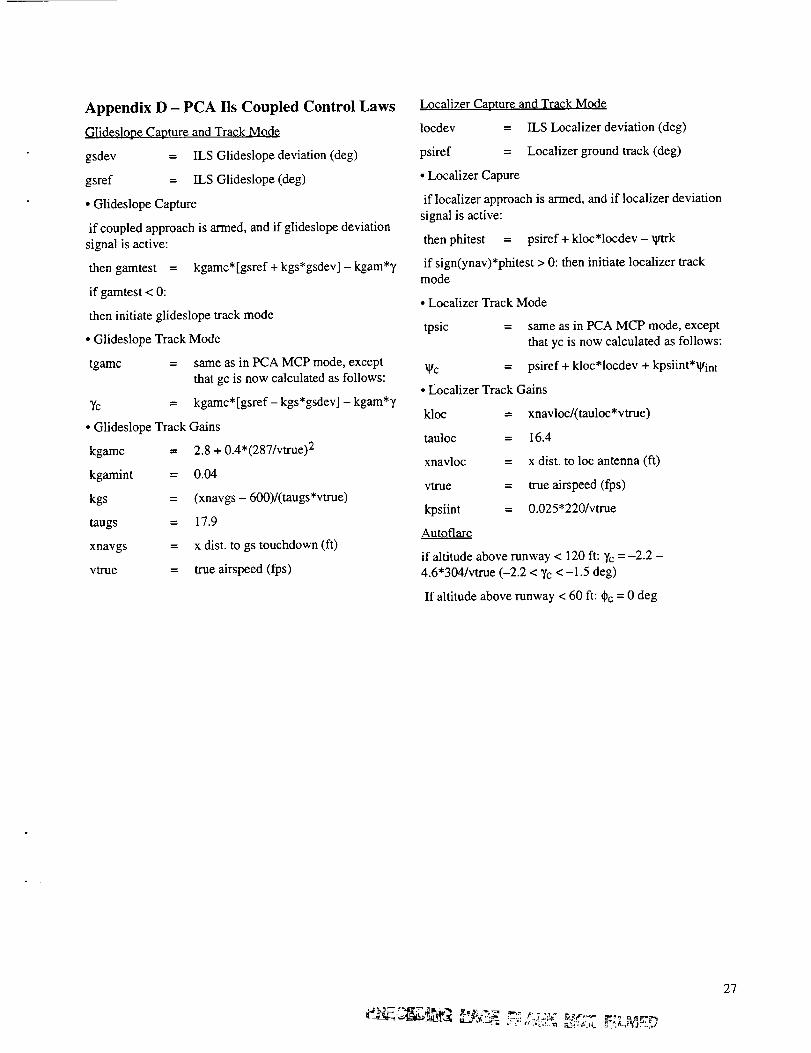
Appendix D - PCA Ils Coupled Control Laws
C,31ideslope Capture and Track Mode
gsdev = ILS Glideslope deviation (deg)
gsref = ILS Glideslope (deg)
• Glideslope Capture
if coupled approach is armed, and if glideslope deviation
signal is active:
then gamtest = kgamc*[gsref + kgs*gsdev] - kgam*7
if gamtest < 0:
then initiate glideslope track mode
° Glideslope Track Mode
tgamc = same as in PCA MCP mode, exceptthat gc is now calculated as follows:
7c = kgamc*[gsref- kgs*gsdev] - kgam*7
• Glideslope Track Gains
kgamc --- 2.8 + 0.4*(287/vtrue) 2
kgamint = 0.04
kgs = (xnavgs - 600)/(taugs*vtrue)
taugs = 17.9
xnavgs -- x dist. to gs touchdown (ft)
vtrue = true airspeed (fps)
kloc
tauloc
xnavloc
vtrue
kpsiint
Autqflare
L0calizer Capture angl Track Mode
locdev = ILS Localizer deviation (deg)
psiref = Localizer ground track (deg)
• Localizer Capure
if locaIizer approach is armed, and if localizer deviation
signal is active:
then phitest = psiref + kloc*locdev - vtrk
if sign(ynav)*phitest > 0: then initiate localizer track
mode
• Localizer Track Mode
tpsic = same as in PCA MCP mode, exceptthat yc is now calculated as follows:
• c = psiref + kloc*locdev + kpsiint*_int
• Localizer Track Gains
= xnavloc/(tauloc*vtrue)
= 16.4
= x dist. to loc antenna (ft)
= true airspeed (fps)
= 0.025*220/vtrue
if altitude above runway < 120 ft: Yc= -2.2 -
4.6*304/vtrue (-2.2 < )'c < -1.5 deg)
If altitude above runway < 60 ft: ¢c = 0 deg
27

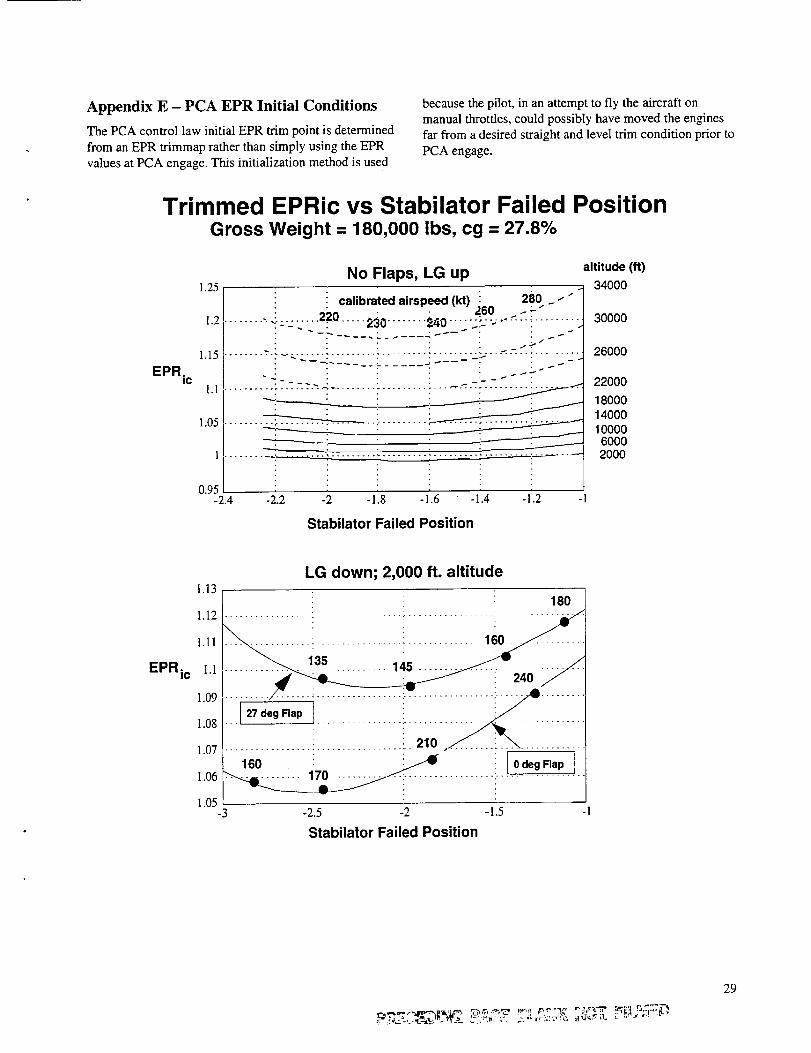
Appendix E - PCA EPR Initial Conditions
The PCA control law initial EPR trim point is determined
from an EPR trimmap rather than simply using the EPR
values at PCA engage• This initialization method is used
because the pilot, in an attempt to fly the aircraft on
manual throttles, could possibly have moved the engines
far from a desired straight and level trim condition prior to
PCA engage.
Trimmed EPRic vs Stabilator Failed PositionGross Weight = 180,000 lbs, cg = 27.8%
EPR.IC
1.25No Flaps, LG up
1.2
1.15
1.1
1.05
1
0.95
i ! calibrated airspeed (kt) ,_ 28! _-" ".........:........22.Q.....z_0........_4o.....=.:-6-°-":•-_........
: .2-----------"
-2.4 -2.2 -2 -1.8 -1.6 -1.4 -1.2 -1
altitude(R)
34000
30000
26000
22000
180001400010000
60002000
Stabilator Failed Position
EPRic
1.13LG down; 2,000 ft. altitude
1.12
1.11
1.1
1.O9
1.08
1.07
1.06
1.05
180
16o : _ 10de, Flap i
-3 -2.5 -2 -1.5
Stabilator Failed Position
-1
29

¥ ,_ -
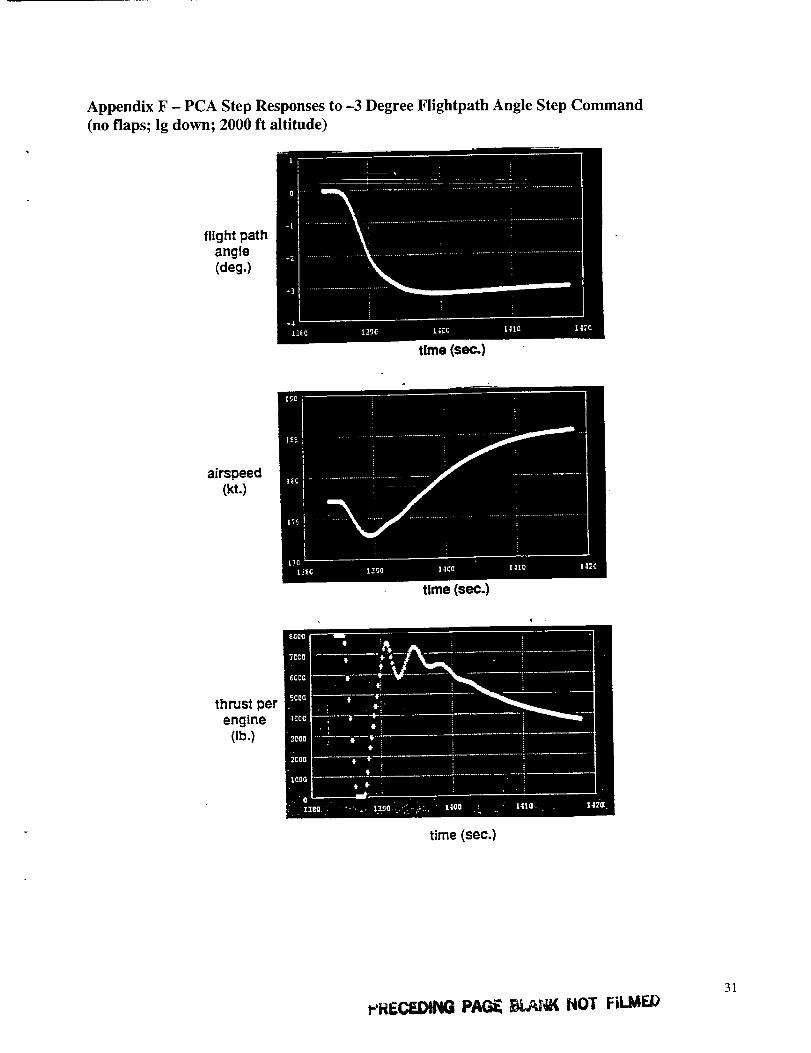
Appendix F - PCA Step Responses to -3 Degree Flightpath Angle Step Command
(no flaps; lg down; 2000 ft altitude)
flight pathangle(deg.)
time (see.)
airspeed(kt .)
tlme (see.)
thrust perengine
(lb.)
time (sec.)
r'FtE_ PAGE _'4_ HOT FILMED
31

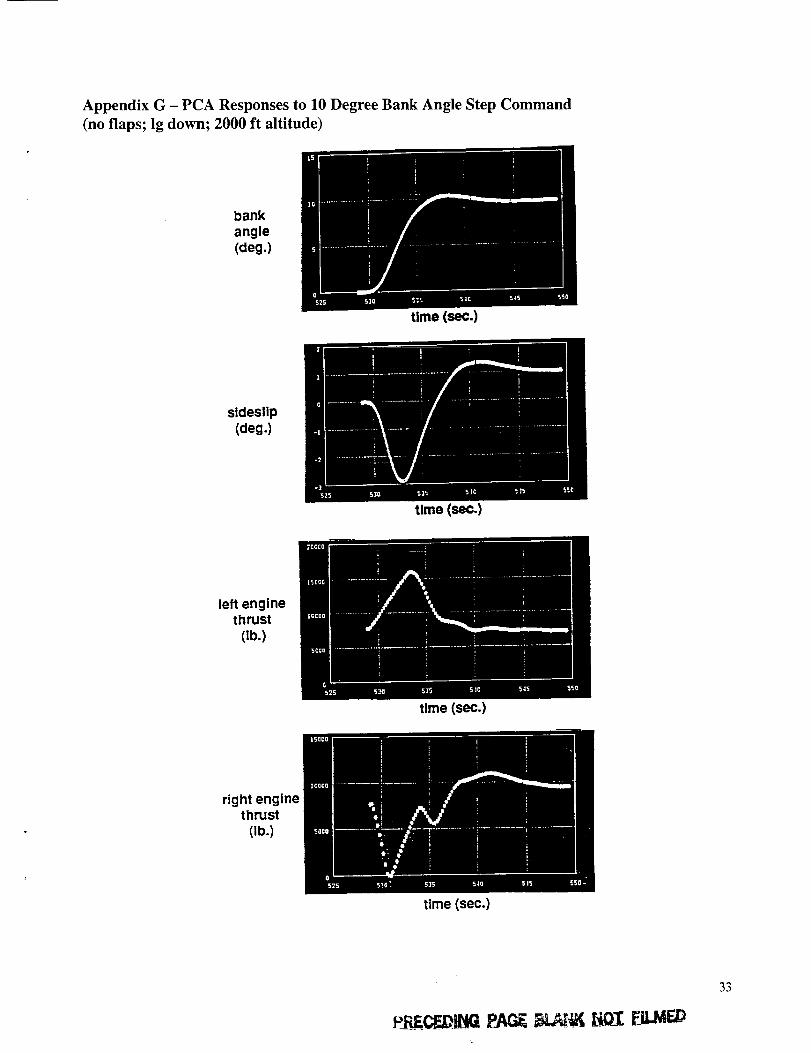
Appendix G - PCA Responses to 10 Degree Bank Angle Step Command
(no flaps; Ig down; 2000 ft altitude)
bankangle(deg.)
time (sec.)
sideslip(deg.)
time (sec.)
left enginethrust
(lb.)
time (sec.)
right enginethrust
Ob.)
time (sec.)
P_CF._ PAC.__ IiOI FCM_
33

References
I. Burcham, F. W.; Fullerton, C. G.; Gi]yard, G.;
Wolf, T.; and Stewart, J.: A Preliminary
Investigation of the Use of Throttles for
Emergency Flight Control. AIAA-91-2222, June1991.
2. National Transportation Safety Board, Aircraft
Accident Report, PB90-910406,NTSB/AAR-90/06, United Airlines Flight 232,
McDonnell Douglas DC-10, Sioux Gateway
Airport, Sioux City, Iowa, July 1989.
3. Gilyard, F.; Conley, J.; Le, J.; and Burcham, F.: ASimulation Evaluation of a Four-Engine Jet
Transport Using Engine Thrust Modulation for
Flight Path Control. AIAA 91-2223, June 1991.
4. Burcham, Frank W., Jr.; and Fullerton, C. Gordon:
Controlling Crippled Aircraft With Throttles.
Flight Safety Foundation Paper and NASATM-104238, Nov. 1991.
5. Burcham, Frank W., Jr.; Maine, Trindel; and Wolf,
Thomas: Flight Testing and Simulation of an
F-15 Airplane Using Throttles for Flight Control.AIAA-92-4109-CP and NASA TM-104255.
6. Burcham, F. W.; Maine, Trindel; Fullerton, Gordon;
and Wells, Ed: Preliminary Flight Test Results of
a Fly-By-Throttle Emergency Flight Control
System on an F-15 Airplane. AIAA 93-1820,June 1993.
7. NASA Dryden Flight Research Center: MD-11
Propulsion Controlled Aircraft Project Schedule,
July 1995.
8. Gelhausen, Paul: PCA Benefits Assessment. PCA
Workshop, NASA Dryden, June 1993.
35
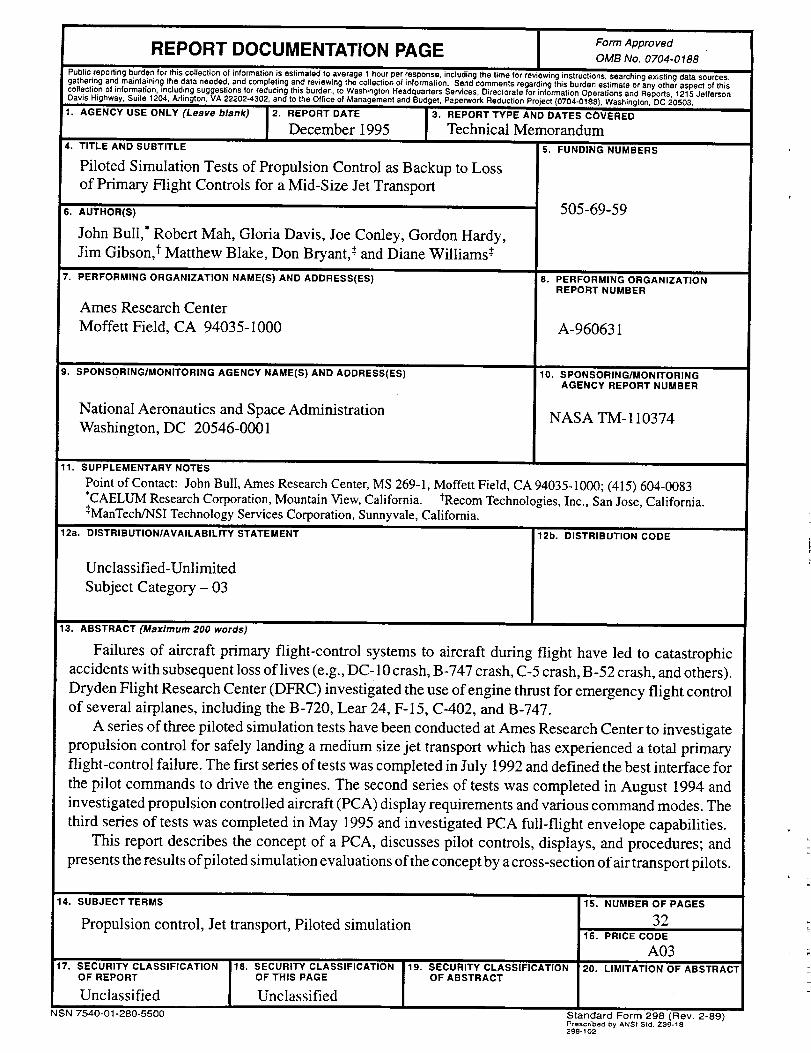
REPORT DOCUMENTATION PAGE Fo_ApprovedOMB No. 0704-0188
Public reporting burden for this collection of information is estimated to average I hourper response, including the time for reviewing instructions, searchingexisting data sources,gatheringand maintaining the data needed, and completingand reviewing the collectionof information. Send comments regarding this burden estimate or any other aspect of thiscollection of information, includingsuggestionsfor reducing this burden, to Washington Headquarters Services, Directorate for informationOperations and Reports, 1215 JeffersonDavis Highway, Suite 1204, Arlington, MA 22202-4302, and to the Office of Management and Budget, Paperwork Reduction Project (0704-0188), Washington, DC 20503.
1. AGENCY USE ONLY (Leave blank) 2. REPORT DATE 3. REPORT TYPE AND DATES COVERED
December 1995 Technical Memorandum
4. TITLE AND SUBTITLE 5. FUNDING NUMBERS
Piloted Simulation Tests of Propulsion Control as Backup to Loss
of Primary Flight Controls for a Mid-Size Jet Transport
6. AUTHOR(S) 505-69-59
John Bull,* Robert Mah, Gloria Davis, Joe Conley, Gordon Hardy,
Jim Gibson, t Matthew Blake, Don Bryant,¢ and Diane Williams_
7. PERFORMING ORGANIZATION NAME(S) AND ADDRESS(ES) 8. PERFORMING ORGANIZATIONREPORT NUMBER
Ames Research Center
Moffett Field, CA 94035- i 000 A-960631
9. SPONSORING/MONITORING AGENCY NAME(S) AND ADDRESS(ES) 10. SPONSORING/MONITORINGAGENCY REPORT NUMBER
National Aeronautics and Space Administration NASA TM- 110374Washington, DC 20546-0001
11. SUPPLEMENTARY NOTES
Point of Contact: John Bull, Ames Research Center, MS 269-l, Moffett Field, CA 94035-1000; (415) 604-0083*CAELUM Research Corporation, Mountain View, California. tRecom Technologies, Inc., San Jose, California._+ManTech/NSI Technology Services Corporation, Sunnyvale, California.
12a. DISTRIBUTION/AVAILABILITY STATEMENT
Unclassified-Unlimited
Subject Category - 03
12b. DISTRIBUTION CODE
13. ABSTRACT (Maximum 200 words)
Failures of aircraft primary flight-control systems to aircraft during flight have led to catastrophic
accidents with subsequent loss of lives (e.g., DC- 10 crash, B-747 crash, C-5 crash, B-52 crash, and others).
Dryden Flight Research Center (DFRC) investigated the use of engine thrust for emergency flight control
of several airplanes, including the B-720, Lear 24, F-15, C-402, and B-747.
A series of three piloted simulation tests have been conducted at Ames Research Center to investigate
propulsion control for safely landing a medium size jet transport which has experienced a total primary
flight-control failure. The first series of tests was completed in July 1992 and defined the best interface for
the pilot commands to drive the engines. The second series of tests was completed in August 1994 and
investigated propulsion controlled aircraft (PCA) display requirements and various command modes. The
third series of tests was completed in May 1995 and investigated PCA full-flight envelope capabilities.
This report describes the concept of a PCA, discusses pilot controls, displays, and procedures; and
presents the results of piloted simulation evaluations of the concept by a cross-section of air transport pilots.
14. SUBJECT TERMS
Propulsion control, Jet transport, Piloted simulation
17. SECURITY CLASSIFICATIONOF REPORT
Unclassified
NSN7s4o-o1-a8o-ssoo
18. SECURITY CLASSIFICATIONOF THIS PAGE
Unclassified
19. SECURITY CLASSIFICATIONOF ABSTRACT
15. NUMBER OF PAGES
3216. PRICE CODE
A0320. LIMITATION OF ABSTRACT
Standard Form 298 (Rev. 2-89)Prescribed by ANSI Std. Z39-18298-102
=