Embed Size (px)
Citation preview
Pine River-Van Etten Lake Watershed
Management Plan
September 2008
Prepared by:
Huron Pines
501 Norway St.
Grayling, Michigan 49738
(989) 348-9319
Funding provided by the Michigan Department of Environmental Quality and the
U.S. Environmental Protection Agency
TABLE OF CONTENTS
Listing of Tables 5
Listing of Maps 7
Project Partners 9
Executive Summary 9
Chapter One: Getting to Know the
Pine River-Van Etten Lake Watershed 1-1
I. DESCRIPTION OF THE PINE RIVER-VAN ETTEN LAKE WATERSHED 1-1
A. Geography 1-1
B. History of the Region 1-3
C. Demographics 1-3
D. Local Land Use Zoning and Planning 1-4
1. In General 1-4
2. Analysis of Local Planning and Zoning Efforts 1-6 E. Bedrock and Glacial History 1-11
F. Climate, Topography and Soils Associations 1-11
G. Groundwater Flow 1-13
H. LandUse/Land Cover 1-14
I. Wildlife Resources 1-17
J. Fisheries Resources 1-17
K. Hydrology 1-19
L. Dams 1-20
M. Water Chemistry 1-20
N. Recreation Resources 1-22
II. PREVIOUS STUDIES 1-22
III. DESIGNATED USES AND WATERSHED CONCERNS 1-24
A. Designated Uses 1-24
B. Watershed Concerns 1-27
C. Known and Suspected Pollutants 1-31
D. Sources of Pollutants 1-32
E. Desired Uses 1-34
Chapter Two: Critical Area 2-1 I. INTRODUCTION 2-1
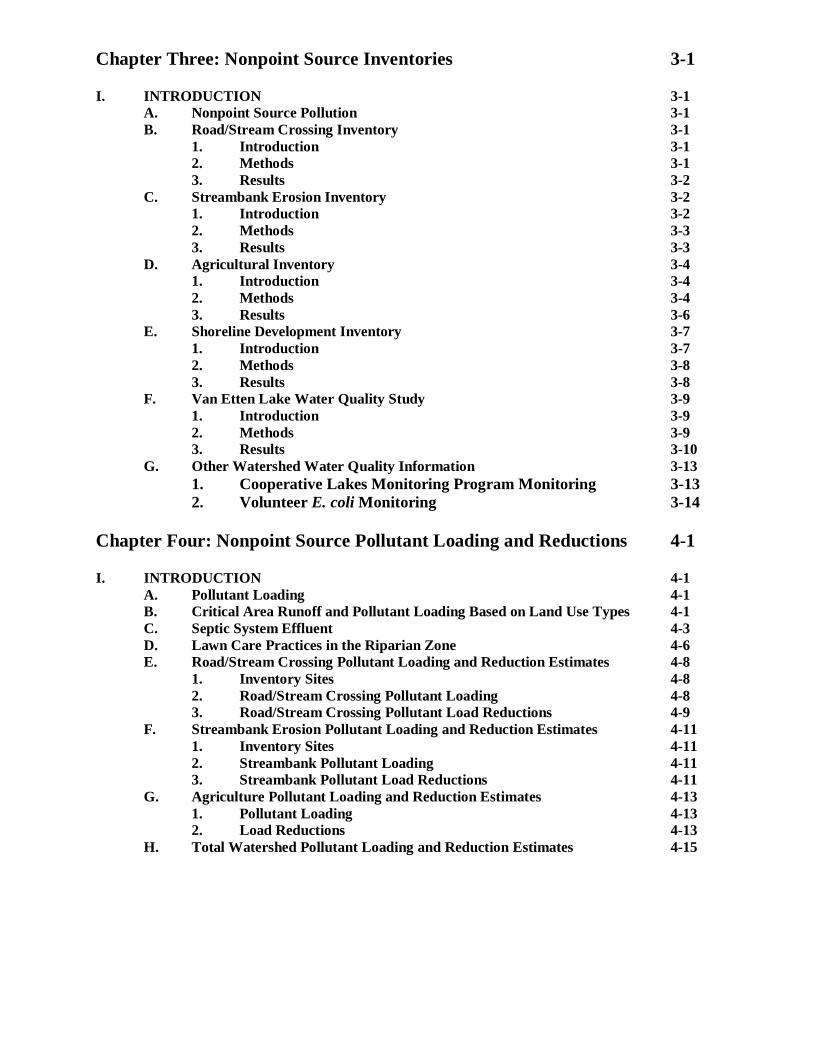
Chapter Three: Nonpoint Source Inventories 3-1 I. INTRODUCTION 3-1
A. Nonpoint Source Pollution 3-1
B. Road/Stream Crossing Inventory 3-1
1. Introduction 3-1
2. Methods 3-1
3. Results 3-2
C. Streambank Erosion Inventory 3-2
1. Introduction 3-2
2. Methods 3-3
3. Results 3-3
D. Agricultural Inventory 3-4
1. Introduction 3-4
2. Methods 3-4
3. Results 3-6
E. Shoreline Development Inventory 3-7
1. Introduction 3-7
2. Methods 3-8
3. Results 3-8
F. Van Etten Lake Water Quality Study 3-9
1. Introduction 3-9
2. Methods 3-9
3. Results 3-10
G. Other Watershed Water Quality Information 3-13
1. Cooperative Lakes Monitoring Program Monitoring 3-13
2. Volunteer E. coli Monitoring 3-14
Chapter Four: Nonpoint Source Pollutant Loading and Reductions 4-1 I. INTRODUCTION 4-1
A. Pollutant Loading 4-1
B. Critical Area Runoff and Pollutant Loading Based on Land Use Types 4-1
C. Septic System Effluent 4-3
D. Lawn Care Practices in the Riparian Zone 4-6
E. Road/Stream Crossing Pollutant Loading and Reduction Estimates 4-8
1. Inventory Sites 4-8
2. Road/Stream Crossing Pollutant Loading 4-8
3. Road/Stream Crossing Pollutant Load Reductions 4-9
F. Streambank Erosion Pollutant Loading and Reduction Estimates 4-11
1. Inventory Sites 4-11
2. Streambank Pollutant Loading 4-11
3. Streambank Pollutant Load Reductions 4-11
G. Agriculture Pollutant Loading and Reduction Estimates 4-13
1. Pollutant Loading 4-13
2. Load Reductions 4-13
H. Total Watershed Pollutant Loading and Reduction Estimates 4-15
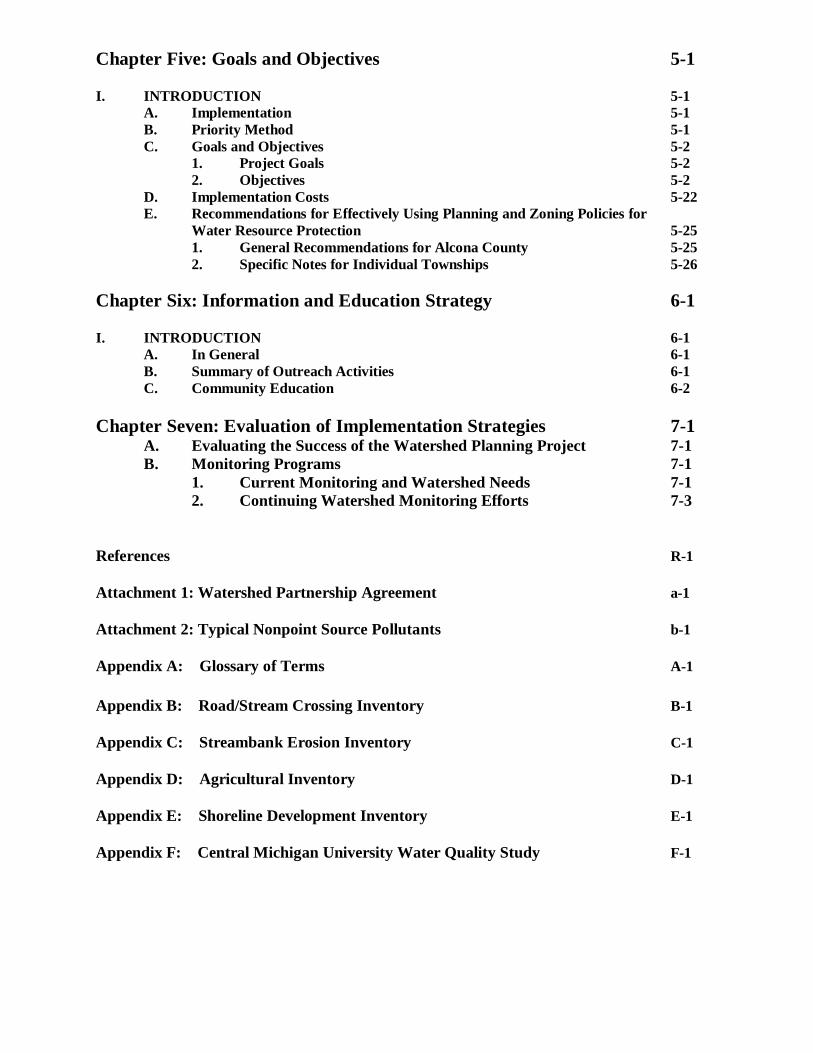
Chapter Five: Goals and Objectives 5-1 I. INTRODUCTION 5-1
A. Implementation 5-1
B. Priority Method 5-1
C. Goals and Objectives 5-2
1. Project Goals 5-2
2. Objectives 5-2
D. Implementation Costs 5-22
E. Recommendations for Effectively Using Planning and Zoning Policies for
Water Resource Protection 5-25
1. General Recommendations for Alcona County 5-25
2. Specific Notes for Individual Townships 5-26
Chapter Six: Information and Education Strategy 6-1 I. INTRODUCTION 6-1
A. In General 6-1
B. Summary of Outreach Activities 6-1
C. Community Education 6-2
Chapter Seven: Evaluation of Implementation Strategies 7-1 A. Evaluating the Success of the Watershed Planning Project 7-1
B. Monitoring Programs 7-1
1. Current Monitoring and Watershed Needs 7-1
2. Continuing Watershed Monitoring Efforts 7-3
References R-1
Attachment 1: Watershed Partnership Agreement a-1
Attachment 2: Typical Nonpoint Source Pollutants b-1
Appendix A: Glossary of Terms A-1
Appendix B: Road/Stream Crossing Inventory B-1
Appendix C: Streambank Erosion Inventory C-1
Appendix D: Agricultural Inventory D-1
Appendix E: Shoreline Development Inventory E-1
Appendix F: Central Michigan University Water Quality Study F-1
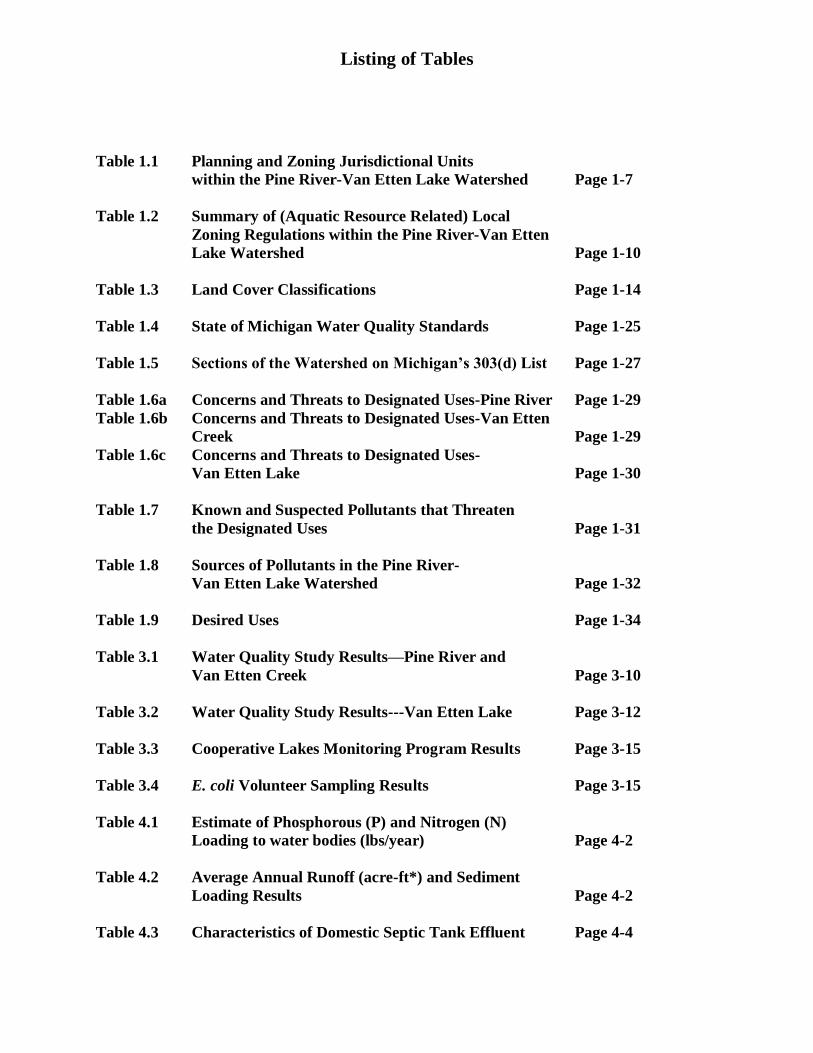
Listing of Tables
Table 1.1 Planning and Zoning Jurisdictional Units
within the Pine River-Van Etten Lake Watershed Page 1-7
Table 1.2 Summary of (Aquatic Resource Related) Local
Zoning Regulations within the Pine River-Van Etten
Lake Watershed Page 1-10
Table 1.3 Land Cover Classifications Page 1-14
Table 1.4 State of Michigan Water Quality Standards Page 1-25
Table 1.5 Sections of the Watershed on Michigan’s 303(d) List Page 1-27
Table 1.6a Concerns and Threats to Designated Uses-Pine River Page 1-29
Table 1.6b Concerns and Threats to Designated Uses-Van Etten
Creek Page 1-29
Table 1.6c Concerns and Threats to Designated Uses-
Van Etten Lake Page 1-30
Table 1.7 Known and Suspected Pollutants that Threaten
the Designated Uses Page 1-31
Table 1.8 Sources of Pollutants in the Pine River-
Van Etten Lake Watershed Page 1-32
Table 1.9 Desired Uses Page 1-34
Table 3.1 Water Quality Study Results—Pine River and
Van Etten Creek Page 3-10
Table 3.2 Water Quality Study Results---Van Etten Lake Page 3-12
Table 3.3 Cooperative Lakes Monitoring Program Results Page 3-15
Table 3.4 E. coli Volunteer Sampling Results Page 3-15
Table 4.1 Estimate of Phosphorous (P) and Nitrogen (N)
Loading to water bodies (lbs/year) Page 4-2
Table 4.2 Average Annual Runoff (acre-ft*) and Sediment
Loading Results Page 4-2
Table 4.3 Characteristics of Domestic Septic Tank Effluent Page 4-4
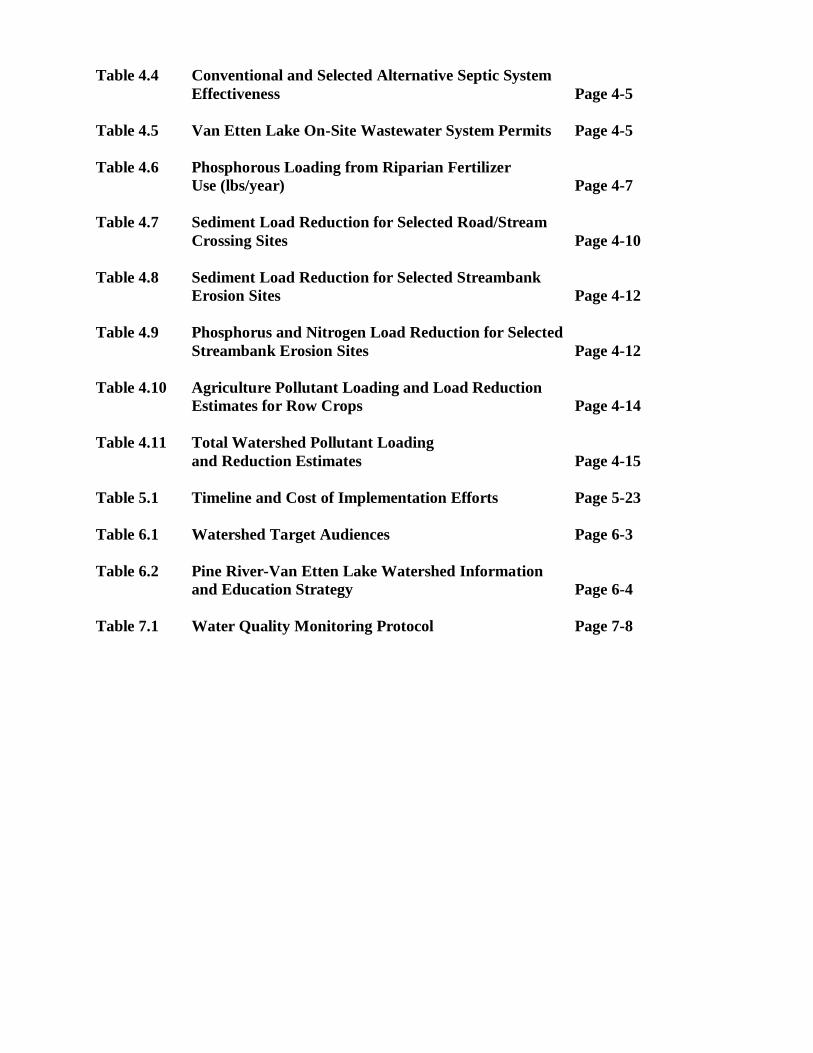
Table 4.4 Conventional and Selected Alternative Septic System
Effectiveness Page 4-5
Table 4.5 Van Etten Lake On-Site Wastewater System Permits Page 4-5
Table 4.6 Phosphorous Loading from Riparian Fertilizer
Use (lbs/year) Page 4-7
Table 4.7 Sediment Load Reduction for Selected Road/Stream
Crossing Sites Page 4-10
Table 4.8 Sediment Load Reduction for Selected Streambank
Erosion Sites Page 4-12
Table 4.9 Phosphorus and Nitrogen Load Reduction for Selected
Streambank Erosion Sites Page 4-12
Table 4.10 Agriculture Pollutant Loading and Load Reduction
Estimates for Row Crops Page 4-14
Table 4.11 Total Watershed Pollutant Loading
and Reduction Estimates Page 4-15
Table 5.1 Timeline and Cost of Implementation Efforts Page 5-23
Table 6.1 Watershed Target Audiences Page 6-3
Table 6.2 Pine River-Van Etten Lake Watershed Information
and Education Strategy Page 6-4
Table 7.1 Water Quality Monitoring Protocol Page 7-8
Listing of Maps
Map 1 Pine River-Van Etten Lake Watershed Base Map Page 1-2
Map 2 Pine River-Van Etten Lake Watershed: Townships
with Greater than 10% Growth 1980-2000 Page 1-4
Map 3 Pine River-Van Etten Lake Watershed Bedrock
Geology and Water Wells Page 1-11
Map 4 Pine River-Van Etten Lake Watershed Landforms Page 1-12
Map 5 DARCY: Pine River-Van Etten Lake Watershed Page 1-13
Map 6 Pine River-Van Etten Lake Watershed
Land Cover (1992) Page 1-16
Map 7 Pine River-Van Etten Lake Watershed
Subwatersheds Page 1-19
Map 8 Dam Locations in the Watershed Page 1-20
Map 9 Pine River-Van Etten Lake Watershed
Conservation and Recreation Lands (CARL) Page 1-22
Map 10 Watershed Subbasins for Determining
Local Concerns Page 1-28
Map 11 Pine River-Van Etten Lake Watershed
Critical Area Page 2-2
Map 12 Pine River-Van Etten Lake Watershed
Road/Stream Crossings Page 3-2
Map 13 Pine River-Van Etten Lake Watershed
Streambank Inventory Sites Page 3-3
Map 14 Pine River-Van Etten Lake Watershed
Agricultural Inventory Sites Page 3-4
Map 15 Pine River-Van Etten Lake Watershed
Agricultural Inventory Priority Sites Page 3-6
Map 16 Pine River-Van Etten Lake Watershed
E. coli Sampling Locations and Results 2005-2008 Page 3-14
Map 17 Monitoring Sites on the Pine River System Page 7-4

Pine River-Van Etten Lake Watershed
Coalition Partners
Alcona Conservation District
Alcona County Commissioners
Alcona County Road Commission
Curtis Township
District Health Department #2
Greenbush Township
Gustin Township
Harrisville Township
Hawes Township
Huron Pines Resource Conservation & Development Area Council
Iosco Conservation District
Iosco County Commissioners
Iosco County Drain Commission
Iosco County Road Commission
Michigan Department of Environmental Quality
Michigan Department of Natural Resources Fisheries Division
Michigan Groundwater Stewardship Program
Michigan Lakes and Streams Association
Michigan State University Department of Fish and Wildlife
Michigan State University Extension
Mikado Township
Millen Township
Northeast Michigan Council of Governments
Oscoda High School
Oscoda Township
Sprinkler Lake Outdoor Education Center
USDA Farm Service Agency
USDA Forest Service
USDA Natural Resources Conservation Service
US Fish and Wildlife Service
Van Etten Lake Association
Village of Lincoln

Discussing Water Quality Study Results
EXECUTIVE SUMMARY
The 187,000-acre Pine River watershed drains into Van Etten Lake, a 1,409-acre reservoir. The
upper watershed is plagued by excessive sediment, elevated water temperatures in the
“coldwater” streams and unrestricted livestock access to streams. Van Etten Lake experiences
annual algae blooms, exotic species invasions, loss of shoreline vegetation and accumulation of
sediment. The Pine River-Van Etten Lake (PRVEL) Watershed Coalition was formed in 1999 to
address these water quality concerns.
In 2001 Huron Pines Resource Conservation and Development Area Council, Inc. was awarded a
Section 319 Nonpoint Source Watershed Planning Grant by the Michigan Department of
Environmental Quality to work with the PRVEL Coalition to develop this watershed
management plan. In 2006, Huron Pines was again awarded a Section 319 grant to revise the
plan to meet the Environmental Protection Agency’s standards for watershed management plans.
The Pine River-Van Etten Lake watershed management
plan was developed with the active participation of a
Steering Committee comprised of a diverse group of
stakeholders. The Pine River-Van Etten Lake
Watershed Steering Committee is a collaborative
partnership of over 25 local, state, federal, nonprofit
and citizen’s organizations. The Steering Committee
provided input during meetings on the threats and
issues throughout the watershed, reviewed text related
to the management plan, and provided input on the
goals and objectives for watershed management efforts.
The 2003 Project
In addition to bi-monthly advertised Steering Committee meetings that were open to the public
throughout the eighteen month planning grant, the Coalition sponsored a well attended special
public meeting in January 2003 to present the results of the water quality study performed by
Central Michigan University. The Coalition also sponsored a Public Forum in February 2003 to
present a synopsis of the watershed management plan development process and solicit additional
public input prior to submitting the completed plan to the Michigan Department of
Environmental Quality.
The following questions, comments and responses were documented during the Public Forum:
Logjams in the Pine River are not allowing sediment to flush out.
Response: Log jams help reduce the erosive action of stream velocities and act as natural
barriers to sediment migration. They also provide critical habitat to aquatic and near shore
terrestrial wildlife.
How much of the Phosphorus (P) loading is attributed to lakefront property owners and how
much from upstream sources?
Response: The data indicate that the outputs for P are greater at the dam than the inputs at the
mouth of the Pine River. This indicates that a source of P is coming from around the lake.

More specific information will be available in the Central Michigan University Water
Quality Study report when it is completed.
What effect does the drastic drop of the water level (from dam management) have on the
flushing ability of the river?
Response: In general, the same amount of water will continue to flow from the Pine River
into the lake. A drop in lake level would most likely not have a significant impact on the
flushing ability of the river.
Dam manager made comments about precipitation, dam gates, springtime capacity etc.
How enforceable are the recommendations and what is the protocol for enacting changes?
Response: Those recommendations that fall within an existing regulatory scheme may be
addressed by the respective enforcement agency, however the promotion of information and
education is a large component of enacting the watershed restoration activities identified
within the plan.
How will the grant dollars be spent?
Response: Grant dollars received will be utilized to implement restoration activities such as
installing structural and vegetative best management practices at priority road/stream
crossing and streambank erosion sites, developing educational materials and providing
technical support and information to target audiences and assisting with land protection and
various natural resource management objectives within the watershed.
How well do/will the townships work together?
Response: The Coalition has found participating townships to be very cooperative and
helpful in supporting the development of the watershed management plan and is confident
that such efforts will extend within their (the townships) working relationships as well.
How long would it take to straighten out the watershed if money was no object?
Response: That’s a tough question. The watershed is extremely large and has numerous
problems affecting its water quality and use. Some of the watershed goals and objectives
timelines range into 15 years for completion of certain tasks. Let’s revisit this question at that
time and see where we are.
Sediment load accelerated; will the plan address the load that is currently at the North Bay of
Van Etten Lake?
Response: Being a reservoir, and the discharge point of the Pine River, Van Etten Lake is
going to experience sediment loading. As such, the North Bay is receiving the bulk of this
sediment. Restoration activities at sites of streambank erosion along the Pine River and its
tributaries will reduce future sediment loading to the lake. However there appear to be few
options outside of dredging to address the removal of the sediment at the north end of the
lake. This issue is somewhat outside the scope of the Coalition and would best be addressed
through the Van Etten Lake Association and Oscoda Township.
Since 2003
The PRVEL Coalition continues to hold quarterly meetings that are open to the public. In 2008,
the Steering Committee partnership agreement was changed to make those meetings coincide
with the Coalition’s. The Coalition advertises the meetings in the local newspaper and invites
resource professionals to give presentations on current resource management in the watershed.
Recent presentations have included updates on fish passage and dam management, fisheries and
stocking, road/stream crossing repairs, and greenbelting and volunteer opportunities.
Members of the PRVEL Coalition also perform regular E. coli and macroinvertebrate
monitoring. The Coalition was recently granted funding from the MiCorps monitoring program
and in 2008 will begin taking the first data for that program with the help of local volunteers and
the Oscoda High School science classes.
The Watershed Management Plan
The watershed management plan and planning process bring together a variety of local partners
to identify, prioritize and then implement the plan to remediate nonpoint source pollution
problems in the watershed. The PRVEL Coalition identified the following six goals for
improving and protecting water quality in the Pine River-Van Etten Lake watershed:
1) Improve and protect the coldwater fishery of the Pine River and its tributaries.
2) Ensure that the total/partial body contact designated use for Van Etten Lake is met.
3) Restore Van Etten Creek to levels that will ensure it is removed from the State’s non-
attainment list.
4) Improve and protect the aquatic habitat within the watershed.
5) Protect critical wildlife habitat areas within the watershed.
6) Sustain the Pine River-Van Etten Lake Watershed Coalition.
Strategies for accomplishing the above goals generally take the form of one or more of the
following: implementing structural and vegetative Best Management Practices at problem sites,
educating watershed stakeholders and communicating key watershed concepts to the public,
improving upon existing land use planning programs, providing technical assistance to property
owners to ensure effective stewardship practices are used, working with land conservancies and
property owners on voluntary land protection measures, monitoring problems, incorporating
design criteria into new developments before problems are created, maintaining a strong
watershed partnership and evaluating efforts.
The Pine River-Van Etten Lake Watershed Coalition Partners recognize the need to work both
together and independently on the objectives within this plan in order to accomplish a vision that
they all share, an improved quality of water resources and thus an improved quality of life.
Pine River-Van Etten Lake Watershed Management Plan 1-1
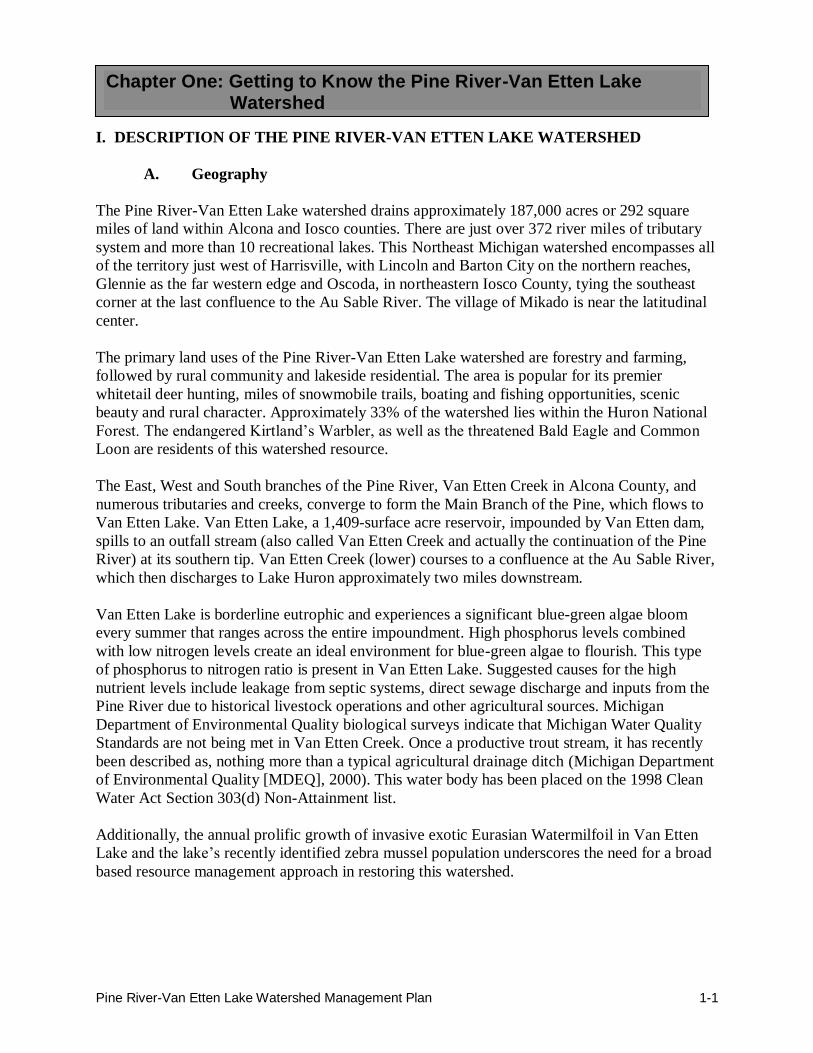
I. DESCRIPTION OF THE PINE RIVER-VAN ETTEN LAKE WATERSHED
A. Geography
The Pine River-Van Etten Lake watershed drains approximately 187,000 acres or 292 square
miles of land within Alcona and Iosco counties. There are just over 372 river miles of tributary
system and more than 10 recreational lakes. This Northeast Michigan watershed encompasses all
of the territory just west of Harrisville, with Lincoln and Barton City on the northern reaches,
Glennie as the far western edge and Oscoda, in northeastern Iosco County, tying the southeast
corner at the last confluence to the Au Sable River. The village of Mikado is near the latitudinal
center.
The primary land uses of the Pine River-Van Etten Lake watershed are forestry and farming,
followed by rural community and lakeside residential. The area is popular for its premier
whitetail deer hunting, miles of snowmobile trails, boating and fishing opportunities, scenic
beauty and rural character. Approximately 33% of the watershed lies within the Huron National
Forest. The endangered Kirtland’s Warbler, as well as the threatened Bald Eagle and Common
Loon are residents of this watershed resource.
The East, West and South branches of the Pine River, Van Etten Creek in Alcona County, and
numerous tributaries and creeks, converge to form the Main Branch of the Pine, which flows to
Van Etten Lake. Van Etten Lake, a 1,409-surface acre reservoir, impounded by Van Etten dam,
spills to an outfall stream (also called Van Etten Creek and actually the continuation of the Pine
River) at its southern tip. Van Etten Creek (lower) courses to a confluence at the Au Sable River,
which then discharges to Lake Huron approximately two miles downstream.
Van Etten Lake is borderline eutrophic and experiences a significant blue-green algae bloom
every summer that ranges across the entire impoundment. High phosphorus levels combined
with low nitrogen levels create an ideal environment for blue-green algae to flourish. This type
of phosphorus to nitrogen ratio is present in Van Etten Lake. Suggested causes for the high
nutrient levels include leakage from septic systems, direct sewage discharge and inputs from the
Pine River due to historical livestock operations and other agricultural sources. Michigan
Department of Environmental Quality biological surveys indicate that Michigan Water Quality
Standards are not being met in Van Etten Creek. Once a productive trout stream, it has recently
been described as, nothing more than a typical agricultural drainage ditch (Michigan Department
of Environmental Quality [MDEQ], 2000). This water body has been placed on the 1998 Clean
Water Act Section 303(d) Non-Attainment list.
Additionally, the annual prolific growth of invasive exotic Eurasian Watermilfoil in Van Etten
Lake and the lake’s recently identified zebra mussel population underscores the need for a broad
based resource management approach in restoring this watershed.
Chapter One: Getting to Know the Pine River-Van Etten Lake Watershed

Chapter 1: Getting to Know the Pine River-Van Etten Lake Watershed
Pine River-Van Etten Lake Watershed Management Plan 1-2
Map 1 delineates the Pine River-Van Etten Lake watershed boundary.
Chapter 1: Getting to Know the Pine River-Van Etten Lake Watershed
Pine River-Van Etten Lake Watershed Management Plan 1-3
B. History of the Region
In 1840 the Michigan Legislature created the Alcona District. Alcona is a Chippewa word that
means ―a fine plain.‖ Commercial fishing in the Great Lakes was the industry that helped
establish Alcona County’s first settlement of Springport in 1846. As the fishing fleet grew larger,
other ports were built at Harrisville, Alcona, and Black River. In 1857, rye was successfully
raised near Springport as the county’s first crop.
The site of a grist and saw mill owned by Benjamin Harris, became the county seat known as
Harrisville, when in 1869, Alcona County was established. The availability of good ports and
ships accommodated an expanding lumber industry within the county. Logging operations as far
west as Curran cut through the county’s forests and opened up the area for farming (Alcona
Conservation District, 2001).
Today, Alcona County attracts many tourists to its beautiful woods and beaches. Harrisville State
Park, located on the shores of Lake Huron, hosts over 170,000 visitors a year.
Within Iosco County, Louis Chevalier was one of the first French fur traders to explore the
region, when just prior to 1800, he entered the mouth of the Au Sable River. Ottawa and
Algonquin Indians were the native tribes inhabiting the area at that time.
In 1857 the Michigan Legislature created Kahnotin County. It was named after an Indian word
meaning ―in the path of the big wind.‖ However Henry Schoolcraft renamed it ―Iosco‖ to mean
―Water of Light.‖ The first settlement in Iosco County was Au Sable, established in 1848. Tawas
City followed in 1855.
In 1840 gypsum was discovered along the shores of Lake Huron in the southern part of the
county. In 1862 quarries began to be mined and by 1891, the progenitor of the present United
States Gypsum Company began operations.
As in most northern Michigan communities, the lumbering era, which started in the mid 1860’s,
contributed to the development of Iosco County. The era effectively ended in 1911 when much
of Au Sable and Oscoda burned to the ground.
An Army Air Field, Camp Skeel, was constructed in 1925 outside of Oscoda. The base was used
during World War II and in 1953 became the Strategic Air Command’s, Wurtsmith Air Force
Base (Iosco Conservation District, 2001). The Department of Defense closed the base in 1992,
which resulted in a significant loss of population and economic infrastructure to the area.
C. Demographics
Predominately rural, Alcona County has a total population of 11,719, and a median household
income of $31,362 per year. Alcona County’s population has grown by 15.5% over the last 10
years. Approximately 48% of the housing units in Alcona County are for seasonal use.
Approximately 85% of the Pine River-Van Etten Lake watershed is within Alcona County,
covering about 36% of the county (US Census Bureau, 2002).
Chapter 1: Getting to Know the Pine River-Van Etten Lake Watershed
Pine River-Van Etten Lake Watershed Management Plan 1-4
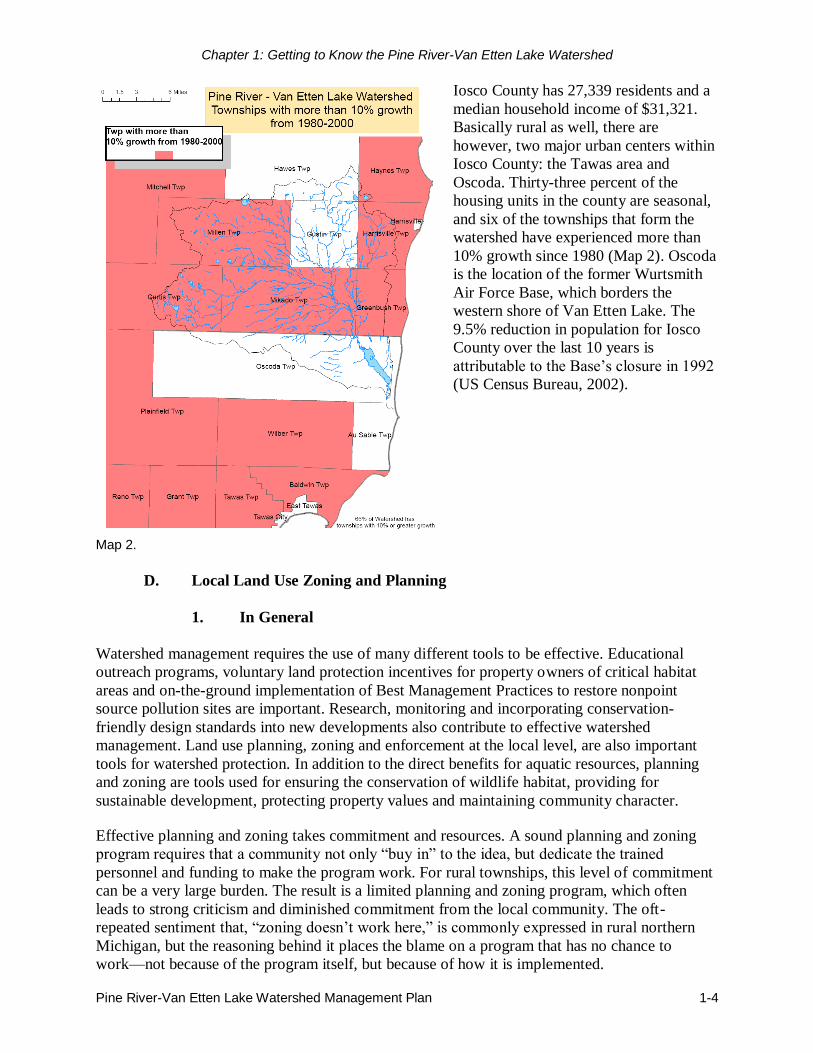
Iosco County has 27,339 residents and a
median household income of $31,321.
Basically rural as well, there are
however, two major urban centers within
Iosco County: the Tawas area and
Oscoda. Thirty-three percent of the
housing units in the county are seasonal,
and six of the townships that form the
watershed have experienced more than
10% growth since 1980 (Map 2). Oscoda
is the location of the former Wurtsmith
Air Force Base, which borders the
western shore of Van Etten Lake. The
9.5% reduction in population for Iosco
County over the last 10 years is
attributable to the Base’s closure in 1992
(US Census Bureau, 2002).
Map 2.
D. Local Land Use Zoning and Planning
1. In General
Watershed management requires the use of many different tools to be effective. Educational
outreach programs, voluntary land protection incentives for property owners of critical habitat
areas and on-the-ground implementation of Best Management Practices to restore nonpoint
source pollution sites are important. Research, monitoring and incorporating conservation-
friendly design standards into new developments also contribute to effective watershed
management. Land use planning, zoning and enforcement at the local level, are also important
tools for watershed protection. In addition to the direct benefits for aquatic resources, planning
and zoning are tools used for ensuring the conservation of wildlife habitat, providing for
sustainable development, protecting property values and maintaining community character.
Effective planning and zoning takes commitment and resources. A sound planning and zoning
program requires that a community not only ―buy in‖ to the idea, but dedicate the trained
personnel and funding to make the program work. For rural townships, this level of commitment
can be a very large burden. The result is a limited planning and zoning program, which often
leads to strong criticism and diminished commitment from the local community. The oft-
repeated sentiment that, ―zoning doesn’t work here,‖ is commonly expressed in rural northern
Michigan, but the reasoning behind it places the blame on a program that has no chance to
work—not because of the program itself, but because of how it is implemented.
Chapter 1: Getting to Know the Pine River-Van Etten Lake Watershed
Pine River-Van Etten Lake Watershed Management Plan 1-5
Once a community makes the commitment to adopt a planning and zoning program (either by
dedicating the staff and funds themselves or by working with other townships or at the county
level), there is a systematic process used to implement the program. Public input, along with an
inventory of community resources, is used to generate a master plan. Within that plan, there are
standards that are reasonable yet adequate for protecting what the community feels is important,
as well as protecting individual, private property.
A watershed management program is a means of protecting individual property rights. The rights
of individual property owners are often seen as a roadblock to a community land use planning
and zoning program. This is unfortunate, as this program is actually a method for protecting
rights. A land use planning program must be based on input from private property owners, who
ultimately derive a benefit from the program. For example, lack of a zoning standard for
requiring a buffer zone of vegetation along a waterway can lead to excessive clearing of
vegetation along a streambank, which often leads to severe erosion at a particular site, negatively
impacting properties downstream by increasing sedimentation, turbidity, increasing the nutrient
load and possibly contributing to widening and warming of the stream. All of these problems are
found in the Pine River-Van Etten Lake watershed. Thus zoning can work not only as a
regulatory tool, but also as an approach for educating landowners before they take actions that
(albeit unintentionally) harm the rights of other property owners.
Following adoption of a master plan, the local unit of government creates a zoning ordinance.
The zoning ordinance must be based on the goals set forth in the master plan. Assuming both of
these documents are written well and made readily available to the public, the community is now
on the right track. However, even once local government units have "good" land use policies in
place, there is still work that needs to be done—the governing body must keep their policies up-
to-date and make decisions regarding infrastructure and zoning in accordance with their plan.
Often, volunteers on local zoning boards are pressured to make a decision on a site-specific issue
without considering the whole system. Zoning standards and decisions must be made with the
comprehensive master plan in mind; it can be extremely difficult to step back from a particular
issue and consider the big picture, but that is exactly what trained planning commission officials
must do. In addition, zoning regulations need to be enforced and followed up. Without
enforcement, the majority that make the effort to follow land use regulations are, in effect,
penalized, as they have gone to greater effort and expense than those not following regulations.
Such systems will eventually break down for local units of government—either most everyone
will eventually give up on trying to follow the rules or the court system will not hold up the
regulations.
In the state of Michigan, planning and zoning are implemented at the township, municipal, or
county level. The enabling legislation for land use planning for cities and villages, townships,
and counties was consolidated from four acts into two:
Public Act 33 of 2008—Michigan Planning Enabling Act
Public Act 281 of 1945—Regional Planning Act
The state previously had three legislative zoning acts that enabled local units of government to
control land uses through regulation of activities on the land. These acts (covering cities and
villages, townships, and counties) were consolidated into one overarching act in 2006:
Chapter 1: Getting to Know the Pine River-Van Etten Lake Watershed
Pine River-Van Etten Lake Watershed Management Plan 1-6
Public Act 110 of 2006—Michigan Zoning Enabling Act
(amended by Public Act 12 of 2008)
In addition to planning and zoning, there are state regulations that are intended to help conserve
natural resources. Relevant state laws for water resource protection include (this is only a brief
summary, please see the respective law or contact MDEQ for more information):
Act 451, Part 91—Soil Erosion Control and Sedimentation Act
(for earth changes within 500 feet of the shoreline)
Act 451, Part 303—Wetland Protection
(covers the dredging, draining, or filling of regulated wetlands; however, non-contiguous
wetlands in rural counties are generally not regulated wetlands)
Act 451, Part 301—Inland Lakes & Streams Act
(covers almost all work done below the ordinary high water mark)
Public Act 368 (1978)—Aquatic Nuisance Control
This following review of local land use regulations is not intended to evaluate the history of
planning and zoning within the watershed, nor to be the sole basis for determining the
effectiveness of policies regarding water resource management. It may provide insight into how
effective local unit of government are at protecting aquatic resources and help to identify some
of the glaring weaknesses within current zoning ordinances.
For some of the issues related to watershed management, agencies beyond the local unit of
government have a regulatory role. In the case of soil erosion and sedimentation, the Michigan
Department of Environmental Quality (MDEQ) has jurisdiction, but they have an agreement
with counties to enforce the program at the local level (thus every county has a soil erosion
officer). For wetlands, MDEQ also has jurisdiction. Questions regarding wetlands and the
permitting process should be sent to MDEQ’s Geological and Land Management Division (their
field office for Alcona County is in Gaylord). Regulations for septic systems are handled through
the District Health Department. In all three of the areas listed above, a local community may
adopt their own policies that are equal to or more stringent than the standards already in place.
Such a decision may lead to more work for the local unit of government and a greater
expenditure of fiscal resources; it may also create an opportunity to better achieve the goals laid
out in the master plan.
2. Analysis of Local Planning and Zoning Efforts
Townships located in a county with zoning have the option of having the county handle the
entire planning and zoning program or administering their own. (In rare cases, neither a county
nor township may have a zoning ordinance, these areas are considered ―unzoned‖). Alcona,
County produced a master plan in 1978. However, the County Planning Commission was later
dissolved and no county zoning ordinance was adopted. Townships within the PRVEL watershed
are thus responsible for their own program and receive no service from the county in this regard.
Below in Table 1.1 is a list of townships within the PRVEL watershed and the adoption date of
their master plans and zoning ordinances. (In those instances where major revisions appear to
have been made by the township, the ―revised‖ plan/ordinance date is used, rather than the
Chapter 1: Getting to Know the Pine River-Van Etten Lake Watershed
Pine River-Van Etten Lake Watershed Management Plan 1-7
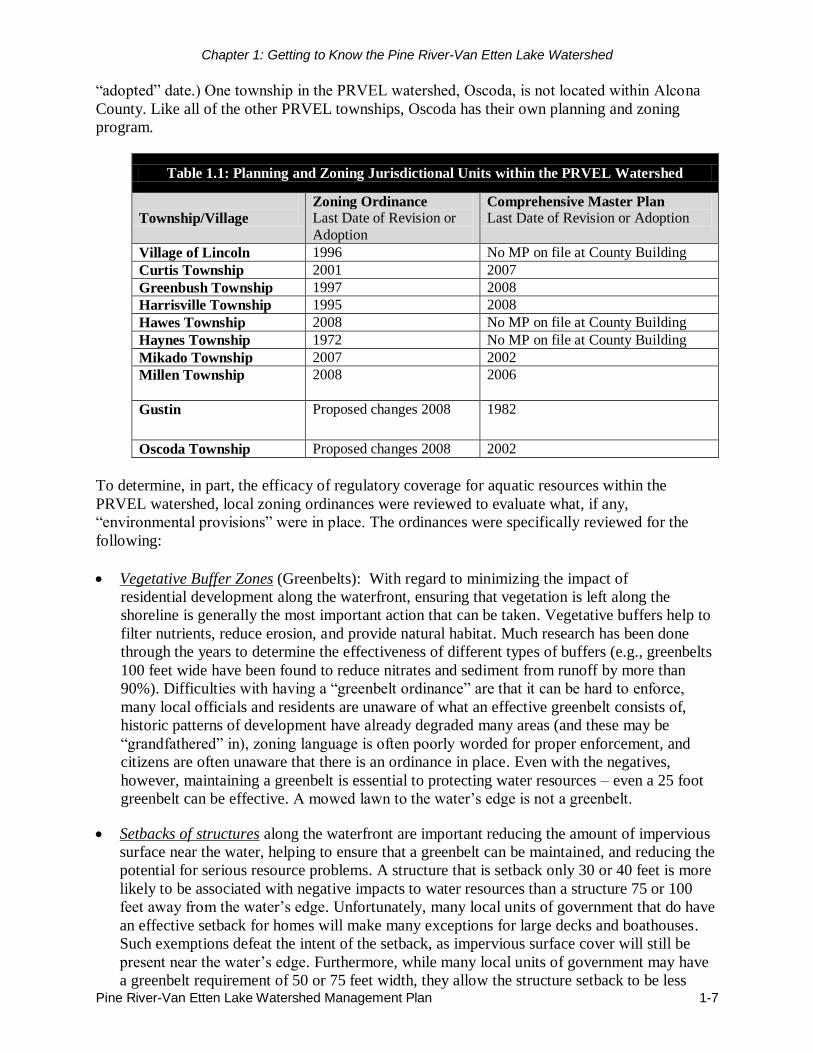
―adopted‖ date.) One township in the PRVEL watershed, Oscoda, is not located within Alcona
County. Like all of the other PRVEL townships, Oscoda has their own planning and zoning
program.
Table 1.1: Planning and Zoning Jurisdictional Units within the PRVEL Watershed
Township/Village
Zoning Ordinance Last Date of Revision or
Adoption
Comprehensive Master Plan Last Date of Revision or Adoption
Village of Lincoln 1996 No MP on file at County Building
Curtis Township 2001 2007
Greenbush Township 1997 2008
Harrisville Township 1995 2008
Hawes Township 2008 No MP on file at County Building
Haynes Township 1972 No MP on file at County Building
Mikado Township 2007 2002
Millen Township 2008
2006
Gustin Proposed changes 2008 1982
Oscoda Township Proposed changes 2008 2002
To determine, in part, the efficacy of regulatory coverage for aquatic resources within the
PRVEL watershed, local zoning ordinances were reviewed to evaluate what, if any,
―environmental provisions‖ were in place. The ordinances were specifically reviewed for the
following:
Vegetative Buffer Zones (Greenbelts): With regard to minimizing the impact of
residential development along the waterfront, ensuring that vegetation is left along the
shoreline is generally the most important action that can be taken. Vegetative buffers help to
filter nutrients, reduce erosion, and provide natural habitat. Much research has been done
through the years to determine the effectiveness of different types of buffers (e.g., greenbelts
100 feet wide have been found to reduce nitrates and sediment from runoff by more than
90%). Difficulties with having a ―greenbelt ordinance‖ are that it can be hard to enforce,
many local officials and residents are unaware of what an effective greenbelt consists of,
historic patterns of development have already degraded many areas (and these may be
―grandfathered‖ in), zoning language is often poorly worded for proper enforcement, and
citizens are often unaware that there is an ordinance in place. Even with the negatives,
however, maintaining a greenbelt is essential to protecting water resources – even a 25 foot
greenbelt can be effective. A mowed lawn to the water’s edge is not a greenbelt.
Setbacks of structures along the waterfront are important reducing the amount of impervious
surface near the water, helping to ensure that a greenbelt can be maintained, and reducing the
potential for serious resource problems. A structure that is setback only 30 or 40 feet is more
likely to be associated with negative impacts to water resources than a structure 75 or 100
feet away from the water’s edge. Unfortunately, many local units of government that do have
an effective setback for homes will make many exceptions for large decks and boathouses.
Such exemptions defeat the intent of the setback, as impervious surface cover will still be
present near the water’s edge. Furthermore, while many local units of government may have
a greenbelt requirement of 50 or 75 feet width, they allow the structure setback to be less

Chapter 1: Getting to Know the Pine River-Van Etten Lake Watershed
Pine River-Van Etten Lake Watershed Management Plan 1-8
than the greenbelt restriction. Such a scenario significantly reduces the effectiveness of the
greenbelt requirement. In addition, during the construction period, a structure being built less
than 50 feet from the water will have a construction site that runs right down to the water.
This leads to the unavoidable problem of the destruction of the greenbelt during construction.
Maintaining the natural greenbelt in the first place is much easier than restoring a greenbelt.
Setback requirements should be regarded as a key element for water resource protection.
Minimum Lot Width for waterfront parcels is important for waterbodies because it ultimately
determines the number of homes that will be built on the water. Developed shorelines with
less than a 100-ft minimum lot width often experience water resource problems. Generally,
the smaller the lot width around a lake, the more homes, the more septic systems, user
conflicts, fertilizer use, degraded shorelines, and the more that impervious cover all
contribute to reducing surface water quality.
Open space preservation is used for communities to protect their rural character, as well as
maintain prime recreational, farm or forestland. Unfortunately, most zoning ordinances, if
implemented correctly, are not written in such a way to accomplish those goals. Many local
units of government that have open space guidelines in this watershed typically state
something to the effect of, "At least 40% of the total gross project shall be left as open
space.‖ Some only require 25%, which is not a way to accomplish their community goals.
An improvement to the open space section of their ordinances would be to require the
developer to increase the amount of open space to 50 or 60% and also make sure that some
of the set aside acreage is from the developable portion of the site. Steep slopes, surface
water, wetlands, etc., should be excluded from this calculation; otherwise only the most
undesirable areas will be set aside as open space. Ordinance language should be something
such as, "A minimum of 60% of the parent parcel's gross acreage shall be set aside as
permanently protected open space. This area shall include at least half of the parcel's
buildable land area."
In 2001, the State of Michigan amended the county, city, village and township zoning acts to
require all qualified communities to amend their zoning ordinances, to provide the ―open
space/cluster development‖ option by December 16, 2002. Qualified communities are those
with a zoning ordinance in place, 1,800 or more people, and currently have undeveloped land
(zoned for residential use) at a density of two dwelling units per acre or less.
In addition to open space protection zoning, there are incentive programs that local
communities can adopt to encourage open space preservation, such as allowing higher
development densities on the remaining land in a development or through setting up a
Purchase of Development Rights (PDR) program. At the time of this report, no townships in
the Pine River-Van Etten Lake watershed had taken this course of action.
Septic Systems are under the jurisdiction of the District Health Department. Typically, only
severe problems are addressed, departments are understaffed, and there are poor records of
septic systems. Some local units of government have begun to initiate their own programs for
inspections, maintenance, or replacement requirements. Generally, such a program is being
run as a ―Point of Sale‖ program, whereby inspections of septic systems are required at the
time of property transfer. System upgrades are then required for those that are not working
properly.
Chapter 1: Getting to Know the Pine River-Van Etten Lake Watershed
Pine River-Van Etten Lake Watershed Management Plan 1-9
Wetland Protection is handled through the state Department of Environmental Quality. For
rural northern Michigan, the law does not cover isolated wetlands. Some communities have
addressed this oversight by adopting their own wetland regulatory program, which is
authorized through the state wetland act. In the table below, only those ordinances that have
standards in addition to those at the state level are noted.
Stormwater Management is recognized as critical for keeping oils, greases, organic debris,
and trash from running directly into a waterbody. While stormwater control measures are
often taken during construction, the post-construction runoff of stormwater is a problem that
is often overlooked. Proper management would require that new developments handle their
own stormwater on-site (or at least do not increase the amount of runoff that would otherwise
occur at the undeveloped site), rather than get the stormwater off their site as quickly as
possible (which has been the historic engineering practice).
Lot Coverage/Impervious Cover is, on a watershed-wide level, an important indicator for
overall watershed health. (Studies have been conducted that show water quality declines once
10% of the land area in a watershed is covered by impervious surfaces and that serious
problems occur once more than 25% of the land area is covered.) Communities that
recognize this fact sometimes attempt to address this problem on a parcel by parcel level by
placing a maximum on the amount of land that can be covered by impervious cover. While
well intended, these standards typically state that the buildings can only occupy a certain
percentage of land, but fail to address roads, driveways, decks, patios, and walkways, which
are all a part of the impervious cover issue.
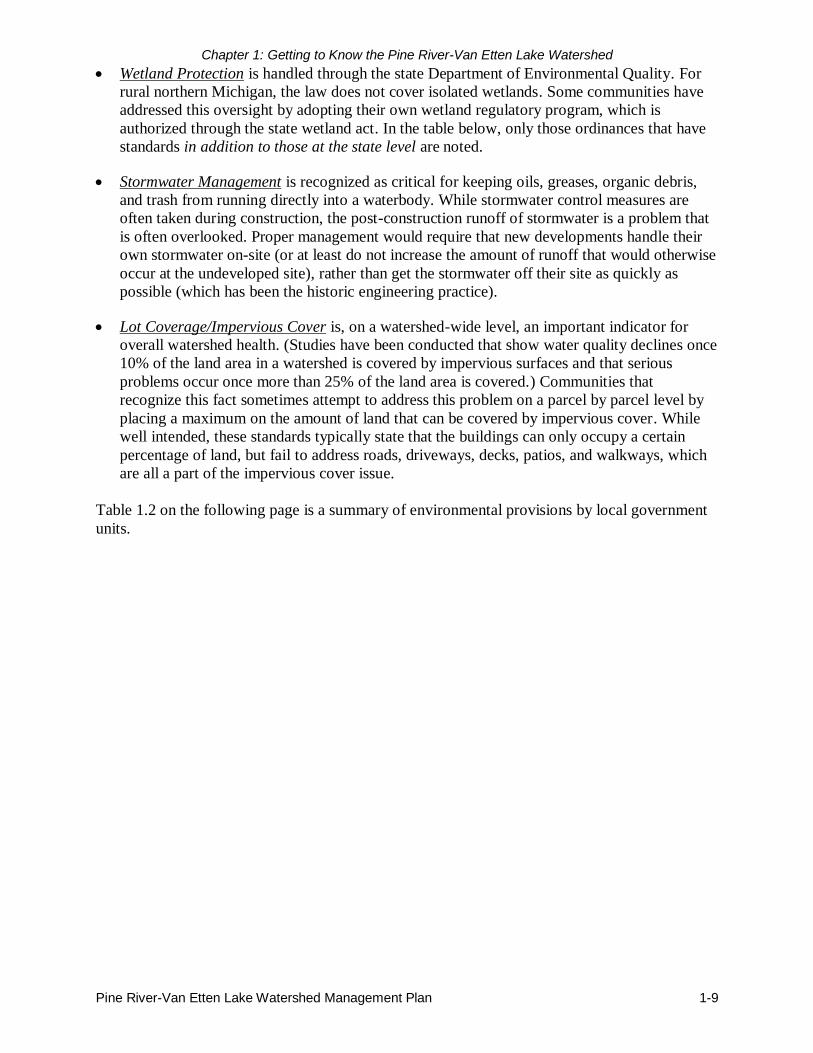
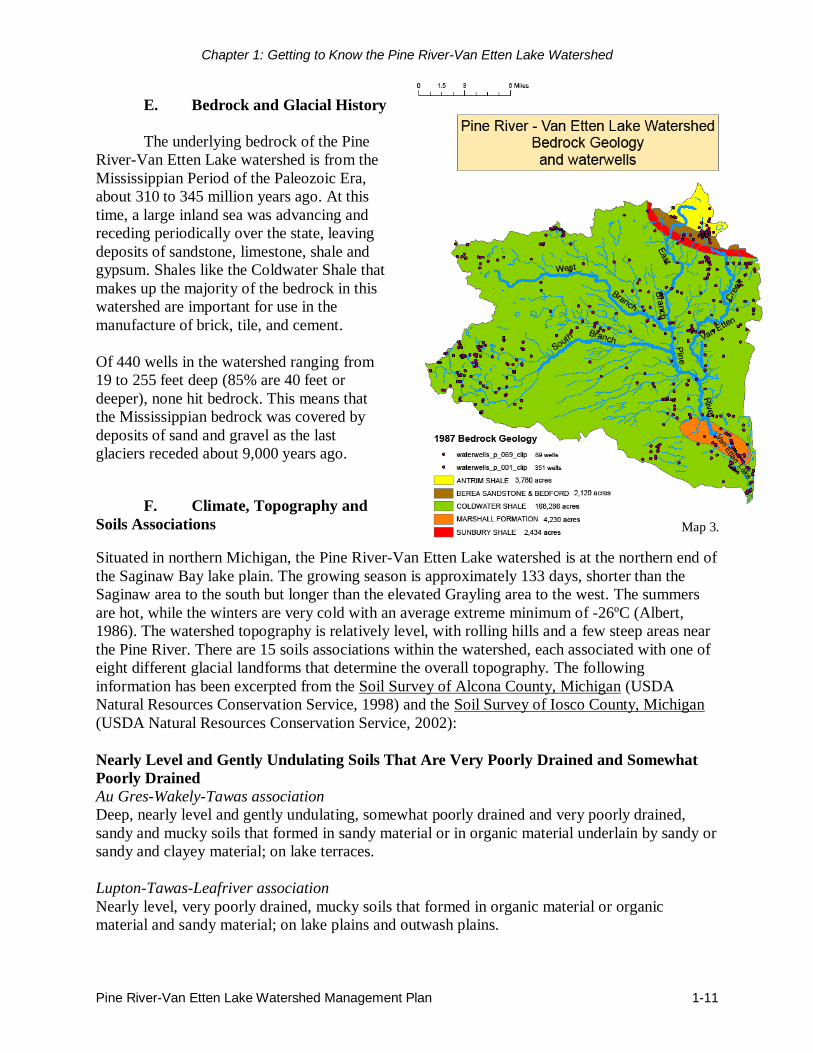
Table 1.2 on the following page is a summary of environmental provisions by local government
units.
Chapter 1: Getting to Know the Pine River-Van Etten Lake Watershed
Pine River-Van Etten Lake Watershed Management Plan 1-10
Table 1.2: Summary of (Aquatic Resource-Related) Local Zoning Regulations within the PRVEL Watershed
Type: Local Government Unit Curtis
Township
Greenbush
Township
Harrisville
Township
Hawes
Township
Haynes
Township
Mikado
Township
Millen
Township
Gustin
Township
Village
of
Lincoln
Oscoda
Township
Vegetative
Buffer Zones
(greenbelts)
No No
Yes (20 ft), but
only within the
shoreline
protection district
No No Yes (70% of
shoreline) 45 ft No No
50 ft from
water’s
edge
Waterfront
Setbacks for
Structures
25 ft (50 for
industrial) 25 ft
60 ft (ag
district) 40 ft
40 ft (for R-
1 Zone)
75 ft for
buildings, 25
for patios
75 ft 40 ft 25 ft 25ft for R-3
Minimum
Lot Width
for Riparian
Parcels
90 ft FRR
90 ft R-1
110 ft R-2
100 ft 330 ft (ag
district)
80 ft (Res
Zone)
200ft(Forest
Rec Zone)
80ft (for R-
1 Zone)
Only denotes
min lot size;
15,000 sq ft
for R-1
100 ft 100 ft 65 ft 50ft for R-3
Open Space No No
Yes, in PUD section of
ordinance: 40%
requirement
No No No No No No
Yes, township
currently
amending
this section
Septic
Systems No No No No No No No No No No
Wetland
Protection No No No No No No No No No No
Stormwater
Management
Yes, some
language
under site
plan review
section
No No No No No No No No Yes
Maximum
% of Lot
Coverage
(Impervious
Cover)
No
35% Max
for riparian lots
Yes, (30%)
only for
shoreline protection
district
No No No 30% No
25% Max
lot coverage by building
area
35% max
lot coverage
by principle and
accessory
buildings
Chapter 1: Getting to Know the Pine River-Van Etten Lake Watershed
Pine River-Van Etten Lake Watershed Management Plan 1-11
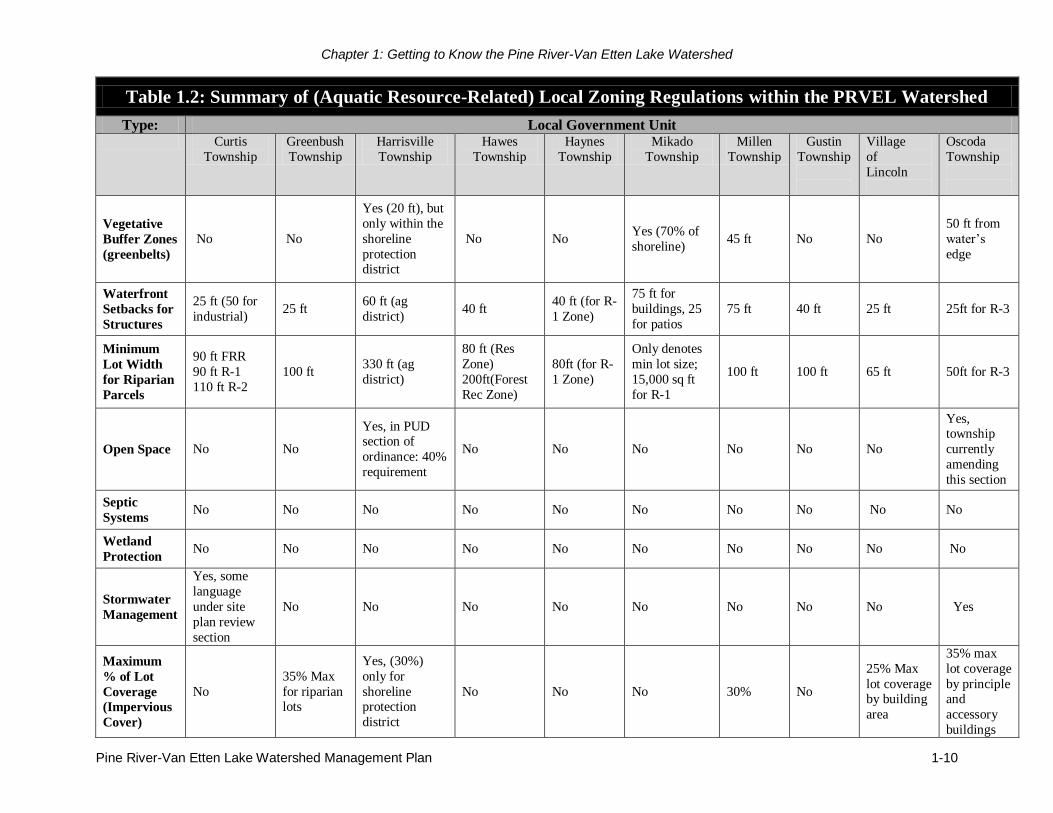
E. Bedrock and Glacial History
The underlying bedrock of the Pine
River-Van Etten Lake watershed is from the
Mississippian Period of the Paleozoic Era,
about 310 to 345 million years ago. At this
time, a large inland sea was advancing and
receding periodically over the state, leaving
deposits of sandstone, limestone, shale and
gypsum. Shales like the Coldwater Shale that
makes up the majority of the bedrock in this
watershed are important for use in the
manufacture of brick, tile, and cement.
Of 440 wells in the watershed ranging from
19 to 255 feet deep (85% are 40 feet or
deeper), none hit bedrock. This means that
the Mississippian bedrock was covered by
deposits of sand and gravel as the last
glaciers receded about 9,000 years ago.
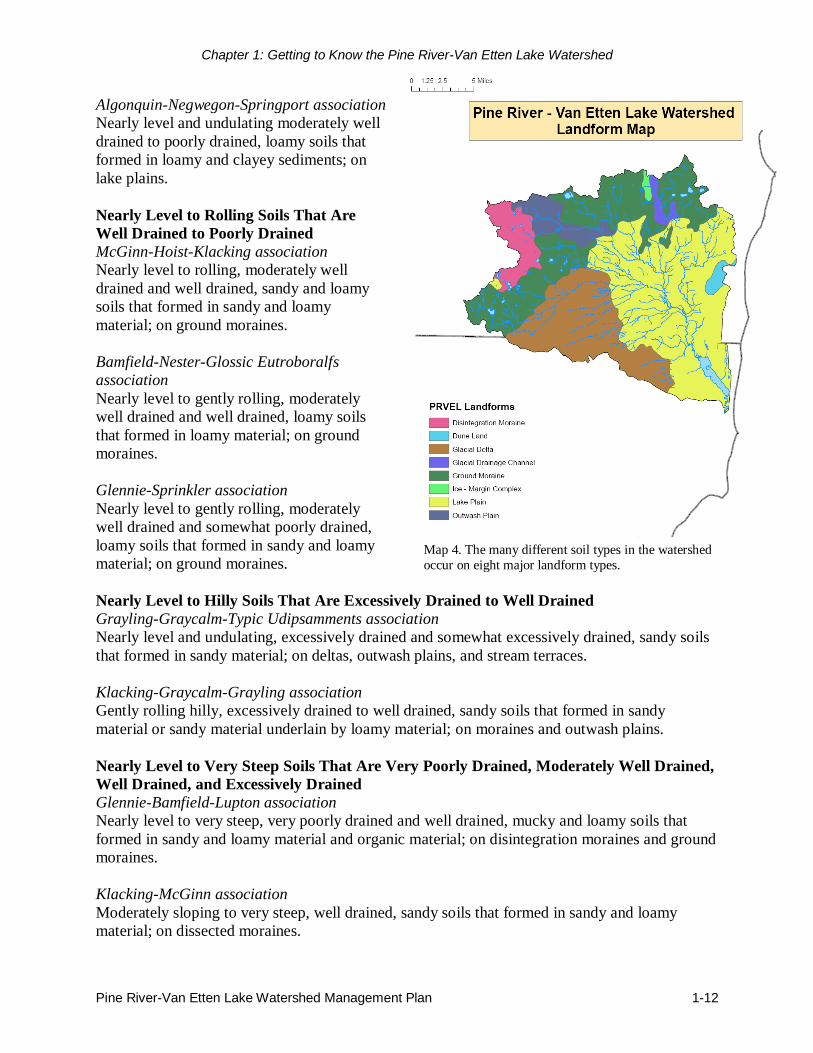
F. Climate, Topography and
Soils Associations
Situated in northern Michigan, the Pine River-Van Etten Lake watershed is at the northern end of
the Saginaw Bay lake plain. The growing season is approximately 133 days, shorter than the
Saginaw area to the south but longer than the elevated Grayling area to the west. The summers
are hot, while the winters are very cold with an average extreme minimum of -26ºC (Albert,
1986). The watershed topography is relatively level, with rolling hills and a few steep areas near
the Pine River. There are 15 soils associations within the watershed, each associated with one of
eight different glacial landforms that determine the overall topography. The following
information has been excerpted from the Soil Survey of Alcona County, Michigan (USDA
Natural Resources Conservation Service, 1998) and the Soil Survey of Iosco County, Michigan
(USDA Natural Resources Conservation Service, 2002):
Nearly Level and Gently Undulating Soils That Are Very Poorly Drained and Somewhat
Poorly Drained
Au Gres-Wakely-Tawas association
Deep, nearly level and gently undulating, somewhat poorly drained and very poorly drained,
sandy and mucky soils that formed in sandy material or in organic material underlain by sandy or
sandy and clayey material; on lake terraces.
Lupton-Tawas-Leafriver association
Nearly level, very poorly drained, mucky soils that formed in organic material or organic
material and sandy material; on lake plains and outwash plains.
Map 3.
Chapter 1: Getting to Know the Pine River-Van Etten Lake Watershed
Pine River-Van Etten Lake Watershed Management Plan 1-12
Algonquin-Negwegon-Springport association
Nearly level and undulating moderately well
drained to poorly drained, loamy soils that
formed in loamy and clayey sediments; on
lake plains.
Nearly Level to Rolling Soils That Are
Well Drained to Poorly Drained
McGinn-Hoist-Klacking association
Nearly level to rolling, moderately well
drained and well drained, sandy and loamy
soils that formed in sandy and loamy
material; on ground moraines.
Bamfield-Nester-Glossic Eutroboralfs
association
Nearly level to gently rolling, moderately
well drained and well drained, loamy soils
that formed in loamy material; on ground
moraines.
Glennie-Sprinkler association
Nearly level to gently rolling, moderately
well drained and somewhat poorly drained,
loamy soils that formed in sandy and loamy
material; on ground moraines.
Nearly Level to Hilly Soils That Are Excessively Drained to Well Drained
Grayling-Graycalm-Typic Udipsamments association
Nearly level and undulating, excessively drained and somewhat excessively drained, sandy soils
that formed in sandy material; on deltas, outwash plains, and stream terraces.
Klacking-Graycalm-Grayling association
Gently rolling hilly, excessively drained to well drained, sandy soils that formed in sandy
material or sandy material underlain by loamy material; on moraines and outwash plains.
Nearly Level to Very Steep Soils That Are Very Poorly Drained, Moderately Well Drained,
Well Drained, and Excessively Drained
Glennie-Bamfield-Lupton association
Nearly level to very steep, very poorly drained and well drained, mucky and loamy soils that
formed in sandy and loamy material and organic material; on disintegration moraines and ground
moraines.
Klacking-McGinn association
Moderately sloping to very steep, well drained, sandy soils that formed in sandy and loamy
material; on dissected moraines.
Map 4. The many different soil types in the watershed
occur on eight major landform types.
Chapter 1: Getting to Know the Pine River-Van Etten Lake Watershed
Pine River-Van Etten Lake Watershed Management Plan 1-13
Zimmerman-Alcona association
Gently rolling to very steep, moderately well drained to excessively drained, sandy soils that
formed in stratified sandy and loamy material; on moraines.
Soils on Wave-Built Terraces, Beach Ridges, and Dunes
Au Gres-Tawas-Wurtsmith association
Nearly level and undulating, somewhat poorly drained, very poorly drained, and moderately well
drained, sandy and mucky soils on wave-built terraces and beach ridges.
Deer Park-Meehan-Wurtsmith association
Nearly level to rolling, excessively drained, somewhat poorly drained, and moderately well
drained, sandy soils on wave-built terraces, beach ridges, and dunes.
Deford-Tawas-Lupton association
Nearly level, very poorly drained, sandy and mucky soils on wave built terraces.
Soils on Outwash Plains, Stream Terraces, and Deltas
Grayling association
Nearly level to rolling, excessively drained, sandy soils on outwash plains and deltas.
Soils on Lake Plains
Algonquin-Allendale-Springport association
Nearly level, somewhat poorly drained and poorly
drained, clayey, sandy, and loamy soils.
Soils on Till Plains and Moraines
Kawkawlin-Nester association
Nearly level to gently rolling, somewhat poorly
drained and moderately well drained, loamy soils
on till plains.
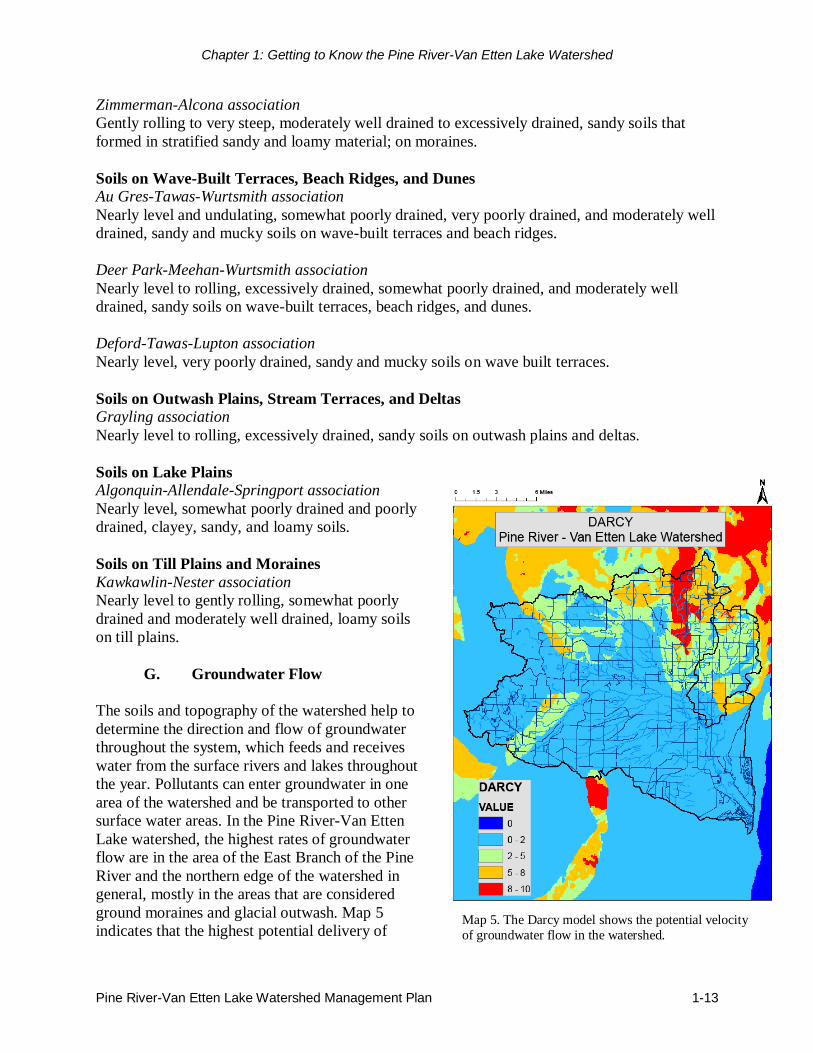
G. Groundwater Flow
The soils and topography of the watershed help to
determine the direction and flow of groundwater
throughout the system, which feeds and receives
water from the surface rivers and lakes throughout
the year. Pollutants can enter groundwater in one
area of the watershed and be transported to other
surface water areas. In the Pine River-Van Etten
Lake watershed, the highest rates of groundwater
flow are in the area of the East Branch of the Pine
River and the northern edge of the watershed in
general, mostly in the areas that are considered
ground moraines and glacial outwash. Map 5
indicates that the highest potential delivery of Map 5. The Darcy model shows the potential velocity
of groundwater flow in the watershed.

Chapter 1: Getting to Know the Pine River-Van Etten Lake Watershed
Pine River-Van Etten Lake Watershed Management Plan 1-14
groundwater to the watershed is in these areas, meaning that these areas have the highest
potential for pollutants to flow through groundwater into the surface water.
H. Land Use/Land Cover
Developing an accurate representation of existing land use conditions within the Pine River-Van
Etten Lake watershed critical area is a crucial step of the land use planning process. The type and
intensity of land use may contribute nonpoint source pollution if adequate prevention measures
are not incorporated during the development phase. Increasing development places higher
demands on the natural resources when forests, riparian lands and open spaces are converted to
homes, roads and commercial centers. For this analysis, we used the 1992 National Land Cover
Data (NLCD) dataset from the United States Geological Survey.
Table 1.3 depicts each land cover classification in the watershed by number of acres and
percentage of the total area.
Table 1.3: Land Cover Classifications
Land Use Acres in Watershed Percentage of Watershed
Water 3,096 1.7%
Residential 2,786 1.5%
Pits/Quarry/Rock 5,677 3.1%
Forest 97,515 53.9%
Pasture/Grassland 22,997 12.7%
Row Crops 9,289 5.1%
Wetlands 39,490 21.8%
Total 180,850 100%
The following definitions describe the land cover classifications (Map 6).
Water: The surface water category includes areas such as lakes, reservoirs, ponds, rivers and
streams. Surface water in the watershed covers 3,096 acres (1.7%) of the total land area.
Residential: Residential land includes residential dwelling structures such as single family or
duplexes, multi‐family residential and mobile home parks. The total residential land use in the
watershed is 2,786 acres (1.5%). The largest concentration of people in the watershed is located
in Oscoda and Greenbush, around Van Etten Lake and scattered residential along the Pine River.
Pits/Quarry/Rock: Pit, quarry and rock land includes both surface and sub-surface mining
operations, such as sand and gravel pits, stone quarries, oil and gas wells, and other mines. These
areas are devoid of vegetation and oftentimes house large processing plants, stockpiles, and
waste dumps. Pits, quarry and rock account for 5,677 acres (3.1%) in the watershed.
Chapter 1: Getting to Know the Pine River-Van Etten Lake Watershed
Pine River-Van Etten Lake Watershed Management Plan 1-15
Forest: Forest land areas are generally at least 10% covered by trees of any size. The forest
category includes upland hardwoods like maple and beech, other upland species like aspen and
birch, species of pine like red, white or jack pine, and other upland conifers like white spruce,
blue spruce, eastern hemlock, and balsam fir. Lowland forest areas are dominated by tree species
that grow in very wet soils. Lowland hardwoods include ash, elm, soft maple, cottonwood and
others. Lowland conifers include cedar, tamarack, black and white spruce, and balsam fir.
Forested areas in the watershed comprise the majority of land cover with a total of 97,515 acres
(53.9%) of the land area.
Pasture, Grassland: Pasture and grasslands include ―open land‖ and rangeland classifications
such as barren land, herbaceous open land, and shrubland. Herbaceous open land is usually
subjected to continuous disturbance such as mowing, grazing, or burning, and typically it can
have a variety of grasses, sedges, and clovers. Shrubland is land in transition from being open to
becoming forested. It contains native shrubs and woody plants like blackberry, dogwood, willow,
sumac, and tag alder. Pasture and grassland account for 22,997 acres (12.7%) of the watershed.
Pasture and grassland are concentrated in the Van Etten Creek subbasin of the watershed.
Row Crops: The agricultural land use category generally includes land that is used for the
production of food and fiber. These classes are cropland, orchards (including vineyards and
ornamental horticulture), confined feeding operations for livestock of any kind, permanent
pasture lands, farmsteads, greenhouse operations, and horse training areas. The total crop land in
the watershed is 9,289 acres (5.1%). Like pasture and grassland, row crops are primarily
concentrated in the Van Etten Creek subwatershed.
Wetlands: Wetlands are those areas where the water table is at or near the land surface for a
significant part of most years. Examples of wetlands are marshes, mudflats, wooded swamps,
shallow areas along rivers, lakes or ponds. Wetlands areas include both non‐vegetated mud flats
and areas of hydrophytic vegetation. Wetlands in the Pine River-Van Etten Lake watershed cover
39,490 acres (21.8%) of the land.

Chapter 1: Getting to Know the Pine River-Van Etten Lake Watershed
Pine River-Van Etten Lake Watershed Management Plan 1-16
Map 6.

Chapter 1: Getting to Know the Pine River-Van Etten Lake Watershed
Pine River-Van Etten Lake Watershed Management Plan 1-17
I. Wildlife Resources
Extensive wildlife populations exist within the Pine River-Van Etten Lake watershed. A
diversity of natural and agricultural ecosystems broadly categorized as wetlands, upland and
lowland forest, and croplands provide wildlife habitat for numerous species within the
watershed.
The greater sandhill crane, great blue heron, red-winged blackbird
and wood duck utilize wetlands, including lakes and streams within
the Pine River-Van Etten Lake watershed. The state threatened
Common Loon (Gavia immer) also finds refuge in this habitat. The
inland-water environment is host to beaver, muskrat, raccoon, otter
and mink. Blanding’s Turtle (Emydoidea blandingii), a Michigan
special concern species (due to its declining population in the state),
is found in the watershed as well.
The upland forest habitat of the Pine River-Van Etten Lake
watershed provides food and shelter for ruffed grouse,
woodcock, white-tailed deer, snowshoe hare, flying squirrel,
porcupine, and black bear. The upland conifer forest provides
excellent nesting habitat for the state threatened Bald eagle
(Haliaeetus leucocephalus), which lives within the watershed.
The federally and state endangered Kirtland’s warbler
(Dendroica kirtlandii) requires as breeding habitat the large
stands of jack pine that are found in the southern range of
the Pine River-Van Etten Lake watershed. Lowland forest areas
within the watershed are home to inhabitants like the bobcat, wild turkey and piliated
woodpecker.
Kestrels, song sparrows, bobolink, and migratory Canada geese all utilize the croplands and open
spaces of the Pine River-Van Etten Lake watershed. The hedgerows, field borders and associated
grasslands provide living space for mourning doves, meadowlarks, gold finches, cottontail
rabbits and woodchucks.
J. Fisheries Resources
The Pine River-Van Etten Lake watershed ecosystem provides
critical habitat to numerous species of fish. In particular, the West
and South Branches of the Pine River and their tributaries provide
quality coldwater fish habitat for brook, brown and rainbow trout
as well as the incidental steelhead, seasonal salmon and unusual
northern hogsucker. The state threatened channel darter (Percina
copelandi) is also thought to exist in the South Branch, as it has
been noted in the eastern portion of the river (USDA Forest
Service, 1992). The riparian corridor within these areas is primarily upland and lowland forest
with the dominant acreage being a portion of the Huron-Manistee National Forest.
Bald Eagle photo courtesy
USF&WS
Brook Trout photo courtesy
USF&WS
Common Loon Photo courtesy US Fish & Wildlife Service
Chapter 1: Getting to Know the Pine River-Van Etten Lake Watershed
Pine River-Van Etten Lake Watershed Management Plan 1-18
The East Branch of the Pine River, which flows through large sections of former and current
agricultural land, has a brook and rainbow trout population and also hosts creek chub and sucker.
This stream is considered mostly warm water habitat except for the headwaters area. A 1992
Michigan Department of Natural Resources (MDNR) biosurvey indicated that stormwater from
the town of Lincoln is a source of chromium, copper, lead, nickel and zinc to the East Branch
(MDEQ, 2000).
Van Etten Creek in Alcona County is characterized by slow moving warm water predominately
influenced by agricultural activity. The riparian corridor consists of extensive tracts of open
grazing land sporadically sheltered by limited stretches of lowland forest. Anecdotal information
from local residents suggests that the headwaters region of Van Etten Creek produced significant
populations of brook trout until about the early 1960s. A 1990 MDNR survey indicates that
mottled sculpin, brook sticklebacks and central mudminnows were found in Van Etten Creek.
However, no brook trout were observed during the 1997 inventory (MDEQ, 2000). Additionally,
in 2002, Huron Pines field staff noted the presence of numerous carp in the creek system. The
Michigan Department of Environmental Quality has rated the habitat quality of Van Etten Creek
as ―Poor‖ and attributes this rating to the dominance of livestock operations, sediment deposition
and a poor benthic invertebrate community (MDEQ, 2000). Subsequently this stream has been
placed on the 1998 Clean Water Act Section 303(d) Non-Attainment list for not meeting State of
Michigan water quality standards. However, in the 2002 biological survey, the DEQ concluded
that the creek appeared to be actually attaining the other indigenous aquatic life and wildlife
designated use and should be removed from the 303(d) list if a 2007 survey listed habitat as
acceptable (MDEQ, 2003). The 2007 survey did list Van Etten Creek habitat as acceptable, but
the 303(d) list continues to list Van Etten Creek (MDEQ, 2008).
The Main Branch of the Pine River is classified as a coldwater
stream. The Michigan Department of Environmental Quality has
rated the Main Branch habitat quality as only ―fair‖ due to lack of
bottom cover, and excessive sediment deposition. Brook, brown and
rainbow trout and yellow perch, have all been observed in the river.
The presence of non-game species such as creek chub, hogsucker
and rock bass have also been recorded (MDEQ, 2000).
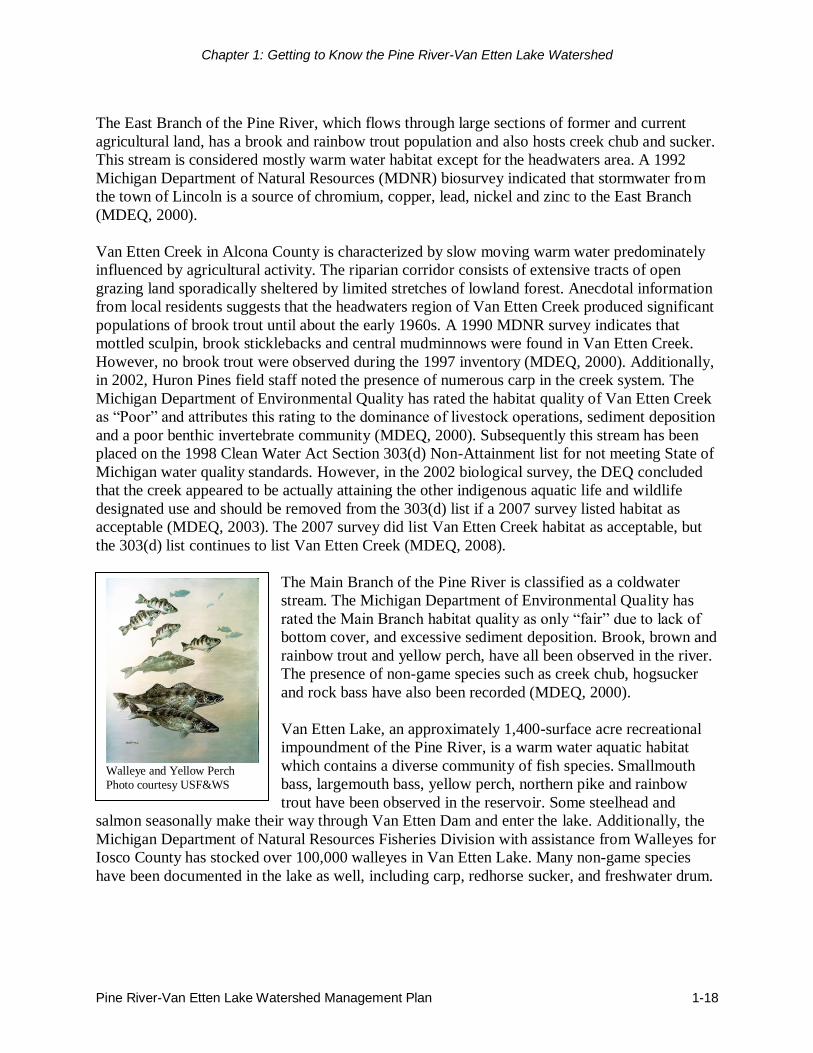
Van Etten Lake, an approximately 1,400-surface acre recreational
impoundment of the Pine River, is a warm water aquatic habitat
which contains a diverse community of fish species. Smallmouth
bass, largemouth bass, yellow perch, northern pike and rainbow
trout have been observed in the reservoir. Some steelhead and
salmon seasonally make their way through Van Etten Dam and enter the lake. Additionally, the
Michigan Department of Natural Resources Fisheries Division with assistance from Walleyes for
Iosco County has stocked over 100,000 walleyes in Van Etten Lake. Many non-game species
have been documented in the lake as well, including carp, redhorse sucker, and freshwater drum.
Walleye and Yellow Perch Photo courtesy USF&WS
Chapter 1: Getting to Know the Pine River-Van Etten Lake Watershed
Pine River-Van Etten Lake Watershed Management Plan 1-19
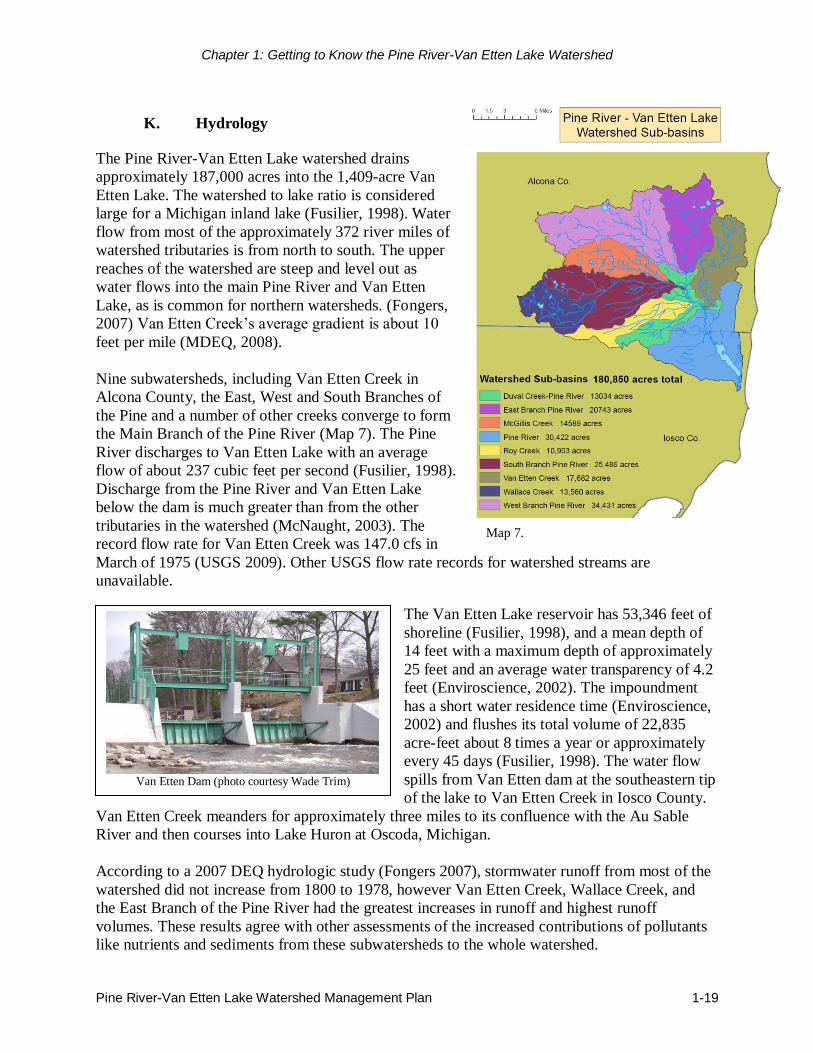
K. Hydrology
The Pine River-Van Etten Lake watershed drains
approximately 187,000 acres into the 1,409-acre Van
Etten Lake. The watershed to lake ratio is considered
large for a Michigan inland lake (Fusilier, 1998). Water
flow from most of the approximately 372 river miles of
watershed tributaries is from north to south. The upper
reaches of the watershed are steep and level out as
water flows into the main Pine River and Van Etten
Lake, as is common for northern watersheds. (Fongers,
2007) Van Etten Creek’s average gradient is about 10
feet per mile (MDEQ, 2008).
Nine subwatersheds, including Van Etten Creek in
Alcona County, the East, West and South Branches of
the Pine and a number of other creeks converge to form
the Main Branch of the Pine River (Map 7). The Pine
River discharges to Van Etten Lake with an average
flow of about 237 cubic feet per second (Fusilier, 1998).
Discharge from the Pine River and Van Etten Lake
below the dam is much greater than from the other
tributaries in the watershed (McNaught, 2003). The
record flow rate for Van Etten Creek was 147.0 cfs in
March of 1975 (USGS 2009). Other USGS flow rate records for watershed streams are
unavailable.
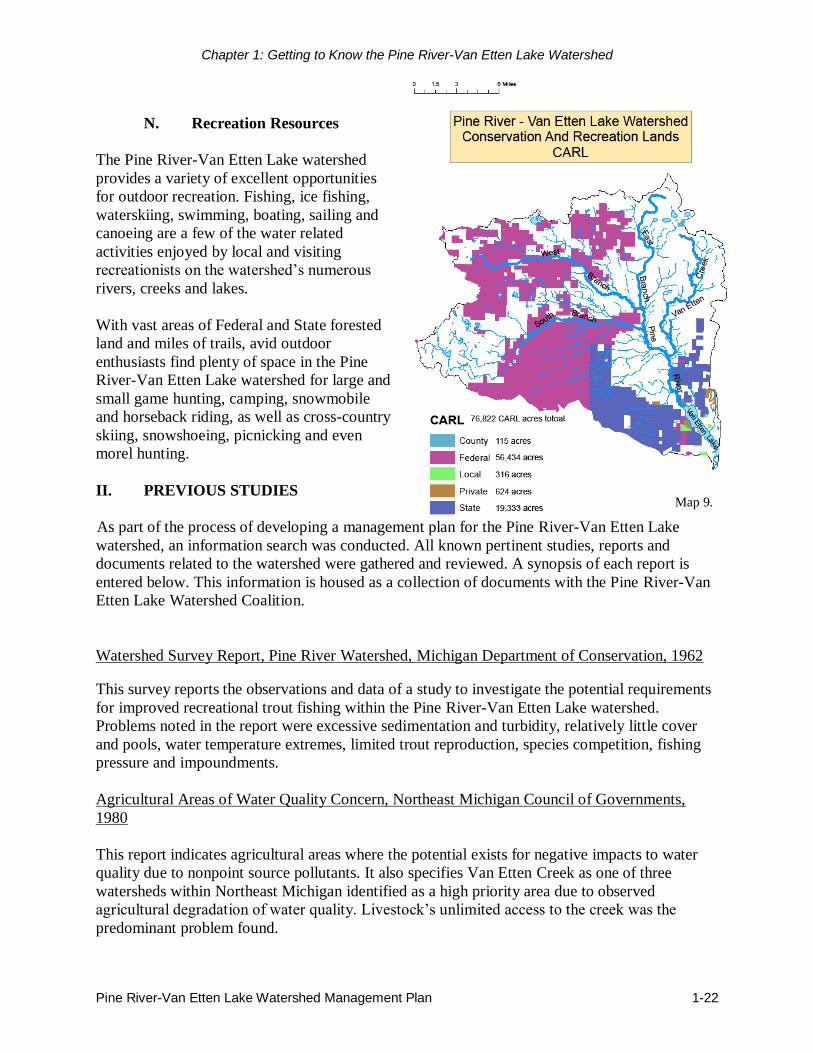
The Van Etten Lake reservoir has 53,346 feet of
shoreline (Fusilier, 1998), and a mean depth of
14 feet with a maximum depth of approximately
25 feet and an average water transparency of 4.2
feet (Enviroscience, 2002). The impoundment
has a short water residence time (Enviroscience,
2002) and flushes its total volume of 22,835
acre-feet about 8 times a year or approximately
every 45 days (Fusilier, 1998). The water flow
spills from Van Etten dam at the southeastern tip
of the lake to Van Etten Creek in Iosco County.
Van Etten Creek meanders for approximately three miles to its confluence with the Au Sable
River and then courses into Lake Huron at Oscoda, Michigan.
According to a 2007 DEQ hydrologic study (Fongers 2007), stormwater runoff from most of the
watershed did not increase from 1800 to 1978, however Van Etten Creek, Wallace Creek, and
the East Branch of the Pine River had the greatest increases in runoff and highest runoff
volumes. These results agree with other assessments of the increased contributions of pollutants
like nutrients and sediments from these subwatersheds to the whole watershed.
Map 7.
Van Etten Dam (photo courtesy Wade Trim)

Chapter 1: Getting to Know the Pine River-Van Etten Lake Watershed
Pine River-Van Etten Lake Watershed Management Plan 1-20
L. Dams
There are 34 known dams in the Pine River-Van
Etten Lake watershed. Of these, almost all are located
in the Pine River system, many in the upper reaches
and on smaller tributary streams. Dams are known to
raise temperatures of coldwater streams and impair
passage for fish like salmon that move upstream to
spawn.
Van Etten Dam, the control structure for Van Etten
Lake, has the most impact on the watershed because
it is at the outlet of the entire watershed into the
greater Au Sable watershed and close to Lake Huron,
where fish would be entering looking for smaller
streams in which to spawn. This dam opens in the
spring and fall to control the level of Van Etten Lake.
It opens at the bottom to allow water to pass through.
There are currently no fish ladders or other structures
to allow passage, although fish may be able to get
through when the dam is open.
M. Water Chemistry
While there are varying fishery types throughout the Pine River-Van Etten Lake watershed, some
parts of the Pine River are designated as a coldwater stream and therefore need to maintain
proper water temperatures, flow, and chemistry to support healthy populations of trout, as well as
providing good recreation opportunities and wildlife habitat. Sampling protocols have changed
over time and the remoteness and general high quality of the majority of this watershed
contribute to inconsistent water quality and chemistry data. However, data collected by state and
federal agencies and local volunteers help to provide a baseline to compare with during future
monitoring activities (see Chapter 7).
The optimal water temperature for rainbow trout is 54–64°F, while it is 52–61°F for brook trout
and 54–66°F for brown trout (Fischenrich, 2000). In the Pine River, water temperatures have
historically fallen within or below these ranges, meaning that the water temperature is sufficient
for good trout habitat. Water that maintains higher temperatures is suited for fish like bass,
walleye, pike, and panfish. Van Etten Creek, the East Branch of the Pine River, and Van Etten
Lake are considered warm water fisheries because of slower flow rates allowing for water to
stand and be heated by the sun.
While dissolved oxygen is difficult to measure in streams because it fluctuates daily and with
temperature, it is important because it also affects the suitability of trout habitat. For rainbow,
brook, and brown trout, the optimal level of dissolved oxygen is above 7 mg/L (Griffith
Foundation, 2002). Turbulence in the upper reaches of the streams and good habitat indicates
adequate oxygen levels in most of the watershed, except for Van Etten Creek where water is
Map 8.

Chapter 1: Getting to Know the Pine River-Van Etten Lake Watershed
Pine River-Van Etten Lake Watershed Management Plan 1-21
warm and more slow moving. Historical data indicate an average of 91.1% saturation of
dissolved oxygen in the downstream portion of the Pine River, which is adequate for fish.
Conductivity measures how well a solution can carry electrical current, but it also indicates the
amount of dissolved solids (including nutrients like nitrogen and phosphorus) in the water. A
constant conductivity indicates a constant amount of dissolved solids, which determines the
amount of water that flows in and out of organisms through osmosis. In the Pine River
watershed, the specific conductance was an average of 400, much higher than other Au Sable
River watershed sites, which indicates that there are more nutrients and other dissolved solids in
the Pine River than other streams.
In the Pine River watershed, the pH levels fluctuate around 8.2 in general, which is at the upper
range of the levels needed by aquatic organisms (Griffith Foundation, 2002). It is also below the
state‐mandated maximum of 9.0 and can therefore be considered appropriate for the quality of
the stream given all the other parameters.
The nutrients nitrogen and phosphorus are good indicators of human activity in a watershed and
accumulations of these nutrients can lead to eutrophication, depleted oxygen, and other problems
in the water. For example, ammonia in the Pine River system in 2002 averaged 3.45 µg/L (for
April through December), while in Van Etten Lake it averaged 9.98 µg/L (McNaught, 2003). Of
the river systems, nitrogen in all forms is highest in the Van Etten Creek subwatershed, probably
due to inputs from the higher concentrations of agricultural practices in that area of the
watershed. In addition, the amount of total phosphorus in the watershed illustrates the
impairment of Van Etten Creek compared to other tributaries: Van Etten Creek averages 95.0
µg/L seasonally, while the West Branch Pine River and main stem Pine River average 25.9 and
26.3 µg/L respectively, indicating that these streams are more typical undeveloped streams
(McNaught, 2003). It will be important in the future to maintain or decrease nutrient input at
upstream sites so that it doesn’t accumulate to dangerous levels lower in the watershed.
The DEQ performed a Biological Survey of the Pine River watershed in 1997 and 1998 and
again in 2002 and 2007 (as part of a larger Au Sable River watershed biological assessment).
The surveys were conducted according to Great Lakes and Environmental Assessment Section
Procedure 51 and overall results indicate that the Pine River and its tributaries are high quality
waters and are meeting water quality standards, with the exception of Van Etten Creek. The
following are conclusions from the 2007 survey that indicate some threats to the water bodies:
Overall, macroinvertebrate community and instream habitat ratings are good or excellent
for most of the watershed, with only Van Etten Creek being rated as acceptable for
macroinvertebrates and ―the lower range of good‖ for habitat.
Excessive quantities of sand sediment are affecting the otherwise excellent fish habitats
in Kurtz Creek and the main stem of the Pine River.
Lack of Large Woody Debris and riparian buffers are impacting habitat especially in the
highly agricultural Van Etten Creek subwatershed.
Future improvement in habitat in Van Etten Creek may be limited due to agricultural
practices and a lack of riparian buffers.
Stream flashiness is an issue in Van Etten Creek.
Chapter 1: Getting to Know the Pine River-Van Etten Lake Watershed
Pine River-Van Etten Lake Watershed Management Plan 1-22
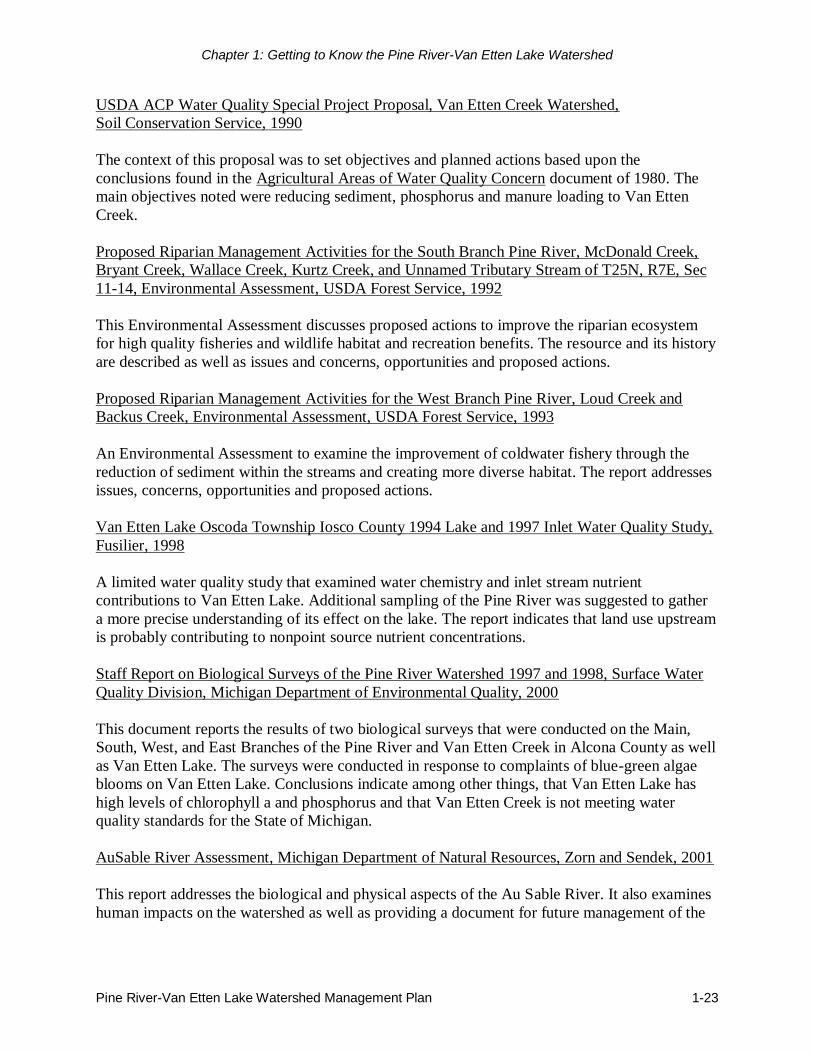
N. Recreation Resources
The Pine River-Van Etten Lake watershed
provides a variety of excellent opportunities
for outdoor recreation. Fishing, ice fishing,
waterskiing, swimming, boating, sailing and
canoeing are a few of the water related
activities enjoyed by local and visiting
recreationists on the watershed’s numerous
rivers, creeks and lakes.
With vast areas of Federal and State forested
land and miles of trails, avid outdoor
enthusiasts find plenty of space in the Pine
River-Van Etten Lake watershed for large and
small game hunting, camping, snowmobile
and horseback riding, as well as cross-country
skiing, snowshoeing, picnicking and even
morel hunting.
II. PREVIOUS STUDIES
As part of the process of developing a management plan for the Pine River-Van Etten Lake
watershed, an information search was conducted. All known pertinent studies, reports and
documents related to the watershed were gathered and reviewed. A synopsis of each report is
entered below. This information is housed as a collection of documents with the Pine River-Van
Etten Lake Watershed Coalition.
Watershed Survey Report, Pine River Watershed, Michigan Department of Conservation, 1962
This survey reports the observations and data of a study to investigate the potential requirements
for improved recreational trout fishing within the Pine River-Van Etten Lake watershed.
Problems noted in the report were excessive sedimentation and turbidity, relatively little cover
and pools, water temperature extremes, limited trout reproduction, species competition, fishing
pressure and impoundments.
Agricultural Areas of Water Quality Concern, Northeast Michigan Council of Governments,
1980
This report indicates agricultural areas where the potential exists for negative impacts to water
quality due to nonpoint source pollutants. It also specifies Van Etten Creek as one of three
watersheds within Northeast Michigan identified as a high priority area due to observed
agricultural degradation of water quality. Livestock’s unlimited access to the creek was the
predominant problem found.
Map 9.
Chapter 1: Getting to Know the Pine River-Van Etten Lake Watershed
Pine River-Van Etten Lake Watershed Management Plan 1-23
USDA ACP Water Quality Special Project Proposal, Van Etten Creek Watershed,
Soil Conservation Service, 1990
The context of this proposal was to set objectives and planned actions based upon the
conclusions found in the Agricultural Areas of Water Quality Concern document of 1980. The
main objectives noted were reducing sediment, phosphorus and manure loading to Van Etten
Creek.
Proposed Riparian Management Activities for the South Branch Pine River, McDonald Creek,
Bryant Creek, Wallace Creek, Kurtz Creek, and Unnamed Tributary Stream of T25N, R7E, Sec
11-14, Environmental Assessment, USDA Forest Service, 1992
This Environmental Assessment discusses proposed actions to improve the riparian ecosystem
for high quality fisheries and wildlife habitat and recreation benefits. The resource and its history
are described as well as issues and concerns, opportunities and proposed actions.
Proposed Riparian Management Activities for the West Branch Pine River, Loud Creek and
Backus Creek, Environmental Assessment, USDA Forest Service, 1993
An Environmental Assessment to examine the improvement of coldwater fishery through the
reduction of sediment within the streams and creating more diverse habitat. The report addresses
issues, concerns, opportunities and proposed actions.
Van Etten Lake Oscoda Township Iosco County 1994 Lake and 1997 Inlet Water Quality Study,
Fusilier, 1998
A limited water quality study that examined water chemistry and inlet stream nutrient
contributions to Van Etten Lake. Additional sampling of the Pine River was suggested to gather
a more precise understanding of its effect on the lake. The report indicates that land use upstream
is probably contributing to nonpoint source nutrient concentrations.
Staff Report on Biological Surveys of the Pine River Watershed 1997 and 1998, Surface Water
Quality Division, Michigan Department of Environmental Quality, 2000
This document reports the results of two biological surveys that were conducted on the Main,
South, West, and East Branches of the Pine River and Van Etten Creek in Alcona County as well
as Van Etten Lake. The surveys were conducted in response to complaints of blue-green algae
blooms on Van Etten Lake. Conclusions indicate among other things, that Van Etten Lake has
high levels of chlorophyll a and phosphorus and that Van Etten Creek is not meeting water
quality standards for the State of Michigan.
AuSable River Assessment, Michigan Department of Natural Resources, Zorn and Sendek, 2001
This report addresses the biological and physical aspects of the Au Sable River. It also examines
human impacts on the watershed as well as providing a document for future management of the
Chapter 1: Getting to Know the Pine River-Van Etten Lake Watershed
Pine River-Van Etten Lake Watershed Management Plan 1-24
river system. As a subwatershed of the Au Sable River watershed, the Pine River system is
described and noted in a number of places in the report.
Fish and Invertebrate Community Composition: A Comparison of Headwater and Adventitious
Streams, Michigan State University, Thesis, Thomas, 2001
A dissertation on stream order designation and its correlation to a watershed’s metabolic,
physical and biotic nature. The Pine River-Van Etten Lake watershed was the study area.
Analyses of the fish and macroinvertebrate communities and habitat as they relate to stream
order are described in the report.
Predicting the Potential Production of Steelhead based on Habitat Conditions in the Pine River,
Alcona County, Annual Study Performance Reports, Michigan State University,
Thompson, 1999- 2002
These reports document an ongoing study to assess the habitat conditions within the Pine River
watershed as a potential annual spawning, growth and sustainable environment for juvenile
steelhead reproduction. The development of a full life history model for steelhead is a
component of this study. Data regarding fish species richness and presence are also noted.
Final Progress Report for the Implementation of the Middfoil Process of Eurasian Watermilfoil
Control to the Van Etten Lake, MI., Enviroscience Inc., 2002
This report documents the process and results of introducing 125,000 aquatic weevils to
biologically control the significant presence of invasive exotic Eurasian Watermilfoil (EWM) in
Van Etten Lake. The two-year program resulted in the disappearance and/or drastic reduction of
Eurasian Watermilfoil within the lake. The stocking has also established a viable weevil
population to continue the control of EWM in Van Etten Lake.
Pine River-Van Etten Lake Watershed Hydrologic Study, Michigan Department of
Environmental Quality, Fongers, 2007
This report provides a baseline of data for local governments to use in their stormwater
management and prioritize areas for conservation. The study, performed by the Hydrologic
Studies Unit of the DEQ, determined that development pressure in the watershed is low and that
runoff volumes are also low, leading to a low risk of stream instability or erosion. In addition,
Van Etten Creek, Wallace Creek, and the East Branch of the Pine River have the most impact on
the watershed’s water quality.
III. DESIGNATED USES AND WATERSHED CONCERNS
A. Designated Uses
Water quality in Michigan is defined by whether the waterbody meets the recognized uses
established by the State and Federal government. Known as designated uses, it is Michigan’s
goal to have the waters of the state meet these criteria.
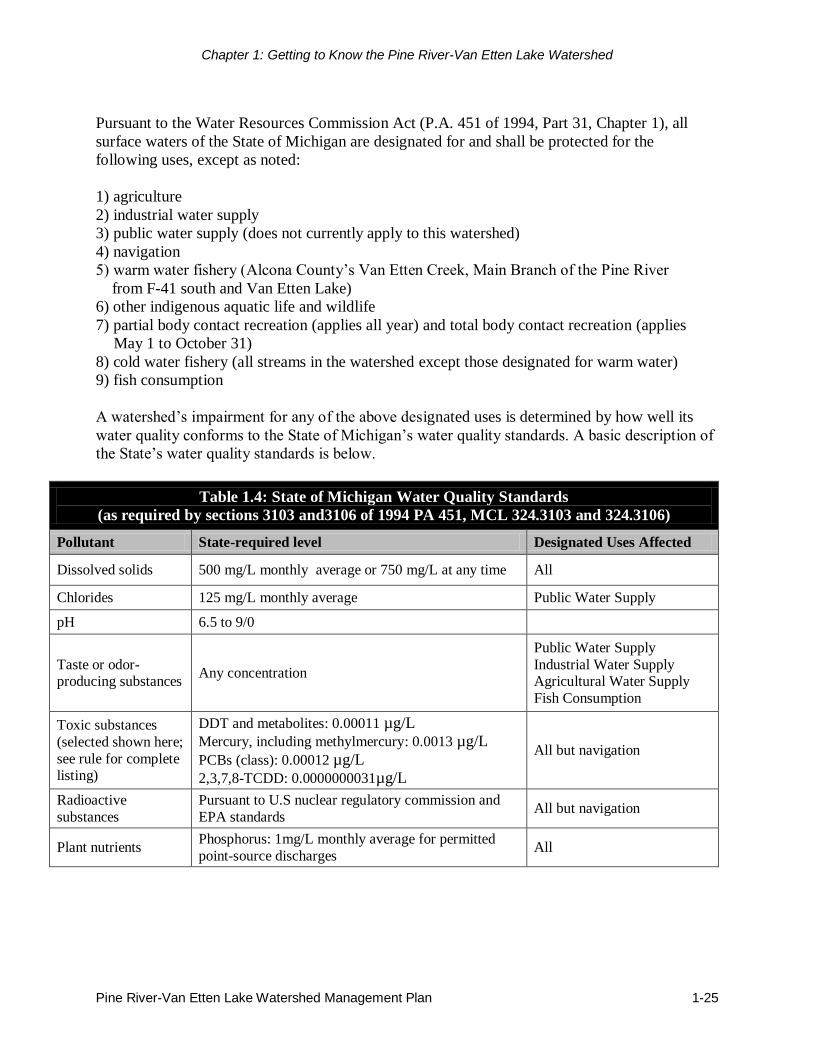
Chapter 1: Getting to Know the Pine River-Van Etten Lake Watershed
Pine River-Van Etten Lake Watershed Management Plan 1-25
Pursuant to the Water Resources Commission Act (P.A. 451 of 1994, Part 31, Chapter 1), all
surface waters of the State of Michigan are designated for and shall be protected for the
following uses, except as noted:
1) agriculture
2) industrial water supply
3) public water supply (does not currently apply to this watershed)
4) navigation
5) warm water fishery (Alcona County’s Van Etten Creek, Main Branch of the Pine River
from F-41 south and Van Etten Lake)
6) other indigenous aquatic life and wildlife
7) partial body contact recreation (applies all year) and total body contact recreation (applies
May 1 to October 31)
8) cold water fishery (all streams in the watershed except those designated for warm water)
9) fish consumption
A watershed’s impairment for any of the above designated uses is determined by how well its
water quality conforms to the State of Michigan’s water quality standards. A basic description of
the State’s water quality standards is below.
Table 1.4: State of Michigan Water Quality Standards
(as required by sections 3103 and3106 of 1994 PA 451, MCL 324.3103 and 324.3106)
Pollutant State-required level Designated Uses Affected
Dissolved solids 500 mg/L monthly average or 750 mg/L at any time All
Chlorides 125 mg/L monthly average Public Water Supply
pH 6.5 to 9/0
Taste or odor-producing substances
Any concentration
Public Water Supply
Industrial Water Supply Agricultural Water Supply
Fish Consumption
Toxic substances
(selected shown here;
see rule for complete listing)
DDT and metabolites: 0.00011 µg/L
Mercury, including methylmercury: 0.0013 µg/L
PCBs (class): 0.00012 µg/L
2,3,7,8-TCDD: 0.0000000031µg/L
All but navigation
Radioactive
substances
Pursuant to U.S nuclear regulatory commission and
EPA standards All but navigation
Plant nutrients Phosphorus: 1mg/L monthly average for permitted
point-source discharges All

Chapter 1: Getting to Know the Pine River-Van Etten Lake Watershed
Pine River-Van Etten Lake Watershed Management Plan 1-26
Microorganisms
130 Escherichia coli per 100 ml 30-day mean of 5 or more sampling events
300 E. coli per 100 ml 30-day mean
1,000 E. coli per 100 ml 30-day mean
Human sewage discharges (treated or untreated) 200
E. coli per 100 ml 30-day mean or 400 E. coli per 100
ml in 7 days or less
All
Total body contact recreation
Partial body contact
recreation
Dissolved oxygen
Minimum 7 mg/L for coldwater designated streams,
inland lakes, and Great Lakes/connecting waters;
minimum 5 mg/L for all other waters
Minimum 5 mg/L daily average
Cold water fishery
Warm water fishery
Temperature
Natural daily and seasonal temperature fluctuations
shall be preserved
Monthly averages for inland lakes: J F M A M J J A S 0 N D 45 45 50 60 70 75 80 85 80 70 60 50
Monthly averages for inland streams in this
watershed: J F M A M J J A S 0 N D 41 40 50 63 76 84 85 85 79 68 55 43
Cold water fishery, other
indigenous aquatic life and
wildlife, warm water fishery
Within the Pine River-Van Etten Lake watershed, the Steering Committee has identified some
specific factors that are threatening five of the nine state designated uses.
The annual blue-green algae bloom on Van Etten Lake is degrading the use of this water body
for partial and/or total body contact recreation due to the thickness of the algae. It impedes
swimming and wading. Additionally, invasive aquatic plants are impeding navigation.
Unrestricted livestock access to a number of streams throughout the watershed (particularly Van
Etten Creek and the East Branch of the Pine River), suggests that cold and warm water fisheries
uses are being degraded by nutrients from animal waste.
Erosion from streambanks and problematic road/stream crossings are adding sediment to
tributaries throughout the watershed and thus are impeding the designated uses for warm and
cold water fisheries as well as navigation and other indigenous aquatic life and wildlife.
It appears that the designated use for industrial water supply is being met within the Pine River-
Van Etten Lake watershed at this time.
Michigan’s inland lakes, including those in the Pine River-Van Etten Lake watershed, are
included on the Section 303(d) list for fish consumption. The DEQ is developing pollution
prevention and abatement strategies for the State of Michigan for mercury contamination and
other related toxins and therefore will not be discussed in the Watershed Management Plan. The
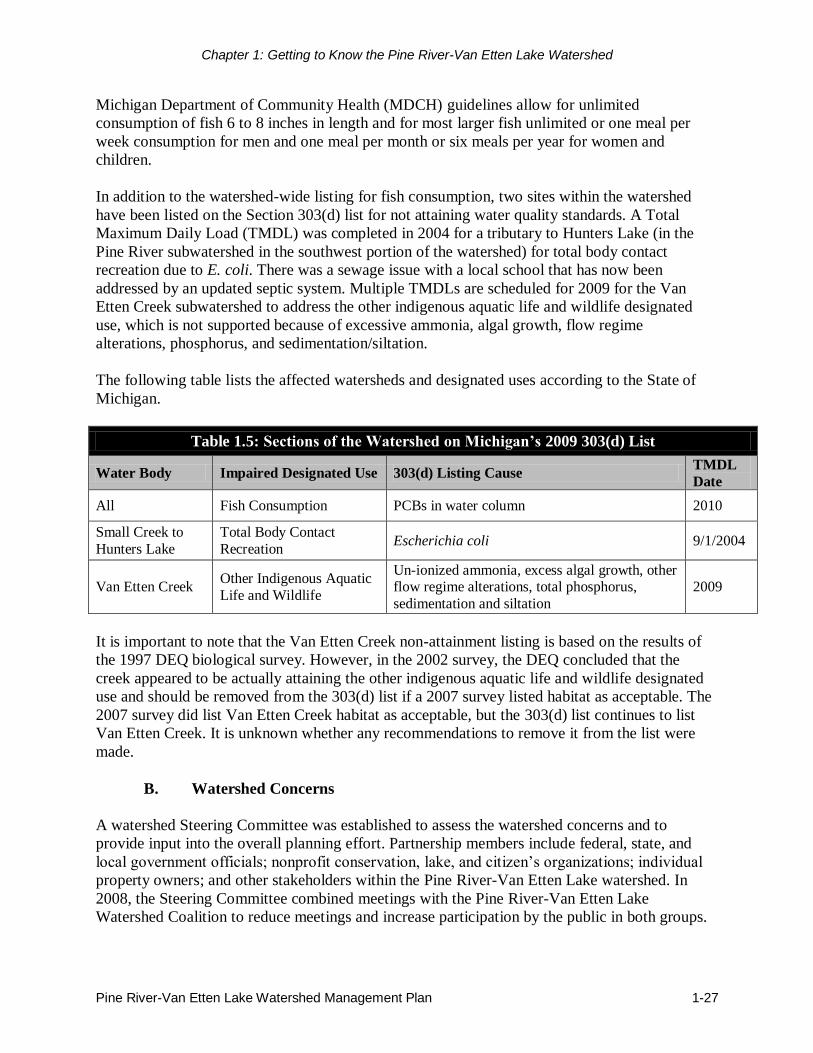
Chapter 1: Getting to Know the Pine River-Van Etten Lake Watershed
Pine River-Van Etten Lake Watershed Management Plan 1-27
Michigan Department of Community Health (MDCH) guidelines allow for unlimited
consumption of fish 6 to 8 inches in length and for most larger fish unlimited or one meal per
week consumption for men and one meal per month or six meals per year for women and
children.
In addition to the watershed-wide listing for fish consumption, two sites within the watershed
have been listed on the Section 303(d) list for not attaining water quality standards. A Total
Maximum Daily Load (TMDL) was completed in 2004 for a tributary to Hunters Lake (in the
Pine River subwatershed in the southwest portion of the watershed) for total body contact
recreation due to E. coli. There was a sewage issue with a local school that has now been
addressed by an updated septic system. Multiple TMDLs are scheduled for 2009 for the Van
Etten Creek subwatershed to address the other indigenous aquatic life and wildlife designated
use, which is not supported because of excessive ammonia, algal growth, flow regime
alterations, phosphorus, and sedimentation/siltation.
The following table lists the affected watersheds and designated uses according to the State of
Michigan.
Table 1.5: Sections of the Watershed on Michigan’s 2009 303(d) List
Water Body Impaired Designated Use 303(d) Listing Cause TMDL
Date
All Fish Consumption PCBs in water column 2010
Small Creek to
Hunters Lake
Total Body Contact
Recreation Escherichia coli 9/1/2004
Van Etten Creek Other Indigenous Aquatic
Life and Wildlife
Un-ionized ammonia, excess algal growth, other flow regime alterations, total phosphorus,
sedimentation and siltation
2009
It is important to note that the Van Etten Creek non-attainment listing is based on the results of
the 1997 DEQ biological survey. However, in the 2002 survey, the DEQ concluded that the
creek appeared to be actually attaining the other indigenous aquatic life and wildlife designated
use and should be removed from the 303(d) list if a 2007 survey listed habitat as acceptable. The
2007 survey did list Van Etten Creek habitat as acceptable, but the 303(d) list continues to list
Van Etten Creek. It is unknown whether any recommendations to remove it from the list were
made.
B. Watershed Concerns
A watershed Steering Committee was established to assess the watershed concerns and to
provide input into the overall planning effort. Partnership members include federal, state, and
local government officials; nonprofit conservation, lake, and citizen’s organizations; individual
property owners; and other stakeholders within the Pine River-Van Etten Lake watershed. In
2008, the Steering Committee combined meetings with the Pine River-Van Etten Lake
Watershed Coalition to reduce meetings and increase participation by the public in both groups.
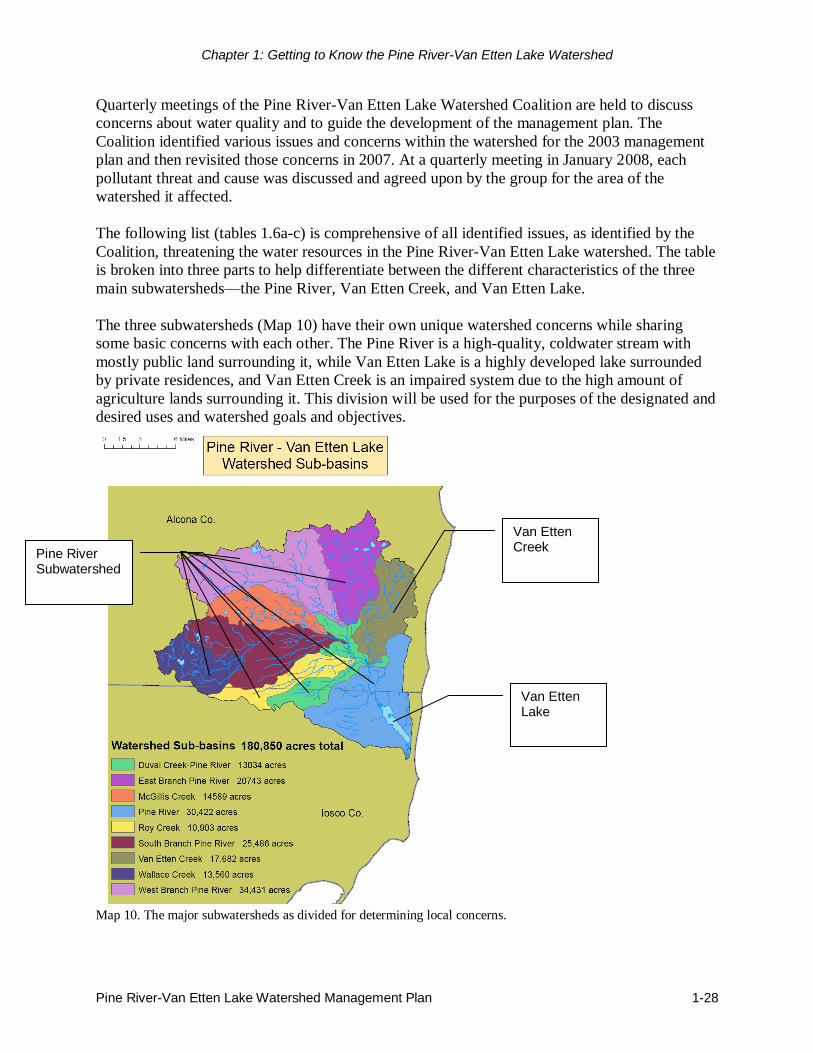
Chapter 1: Getting to Know the Pine River-Van Etten Lake Watershed
Pine River-Van Etten Lake Watershed Management Plan 1-28
Quarterly meetings of the Pine River-Van Etten Lake Watershed Coalition are held to discuss
concerns about water quality and to guide the development of the management plan. The
Coalition identified various issues and concerns within the watershed for the 2003 management
plan and then revisited those concerns in 2007. At a quarterly meeting in January 2008, each
pollutant threat and cause was discussed and agreed upon by the group for the area of the
watershed it affected.
The following list (tables 1.6a-c) is comprehensive of all identified issues, as identified by the
Coalition, threatening the water resources in the Pine River-Van Etten Lake watershed. The table
is broken into three parts to help differentiate between the different characteristics of the three
main subwatersheds—the Pine River, Van Etten Creek, and Van Etten Lake.
The three subwatersheds (Map 10) have their own unique watershed concerns while sharing
some basic concerns with each other. The Pine River is a high-quality, coldwater stream with
mostly public land surrounding it, while Van Etten Lake is a highly developed lake surrounded
by private residences, and Van Etten Creek is an impaired system due to the high amount of
agriculture lands surrounding it. This division will be used for the purposes of the designated and
desired uses and watershed goals and objectives.
Map 10. The major subwatersheds as divided for determining local concerns.
Van Etten Creek
Van Etten Lake
Pine River Subwatershed
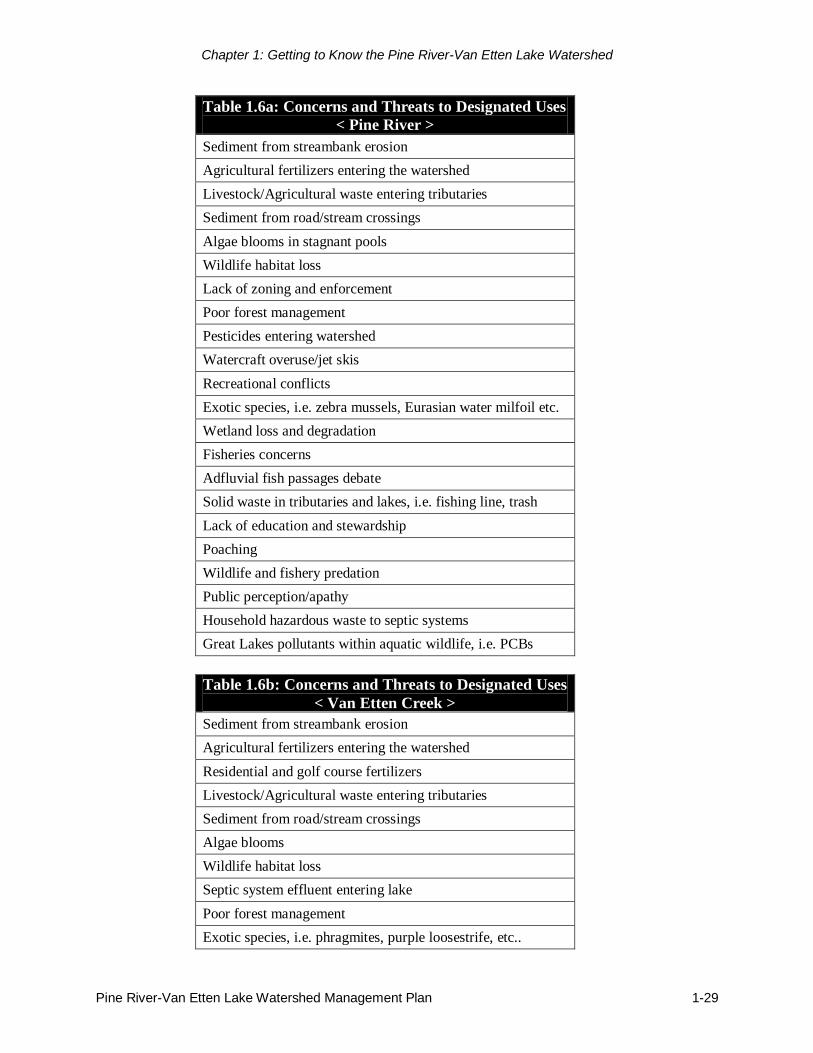
Chapter 1: Getting to Know the Pine River-Van Etten Lake Watershed
Pine River-Van Etten Lake Watershed Management Plan 1-29
Table 1.6a: Concerns and Threats to Designated Uses
< Pine River >
Sediment from streambank erosion
Agricultural fertilizers entering the watershed
Livestock/Agricultural waste entering tributaries
Sediment from road/stream crossings
Algae blooms in stagnant pools
Wildlife habitat loss
Lack of zoning and enforcement
Poor forest management
Pesticides entering watershed
Watercraft overuse/jet skis
Recreational conflicts
Exotic species, i.e. zebra mussels, Eurasian water milfoil etc.
Wetland loss and degradation
Fisheries concerns
Adfluvial fish passages debate
Solid waste in tributaries and lakes, i.e. fishing line, trash
Lack of education and stewardship
Poaching
Wildlife and fishery predation
Public perception/apathy
Household hazardous waste to septic systems
Great Lakes pollutants within aquatic wildlife, i.e. PCBs
Table 1.6b: Concerns and Threats to Designated Uses
< Van Etten Creek >
Sediment from streambank erosion
Agricultural fertilizers entering the watershed
Residential and golf course fertilizers
Livestock/Agricultural waste entering tributaries
Sediment from road/stream crossings
Algae blooms
Wildlife habitat loss
Septic system effluent entering lake
Poor forest management
Exotic species, i.e. phragmites, purple loosestrife, etc..

Chapter 1: Getting to Know the Pine River-Van Etten Lake Watershed
Pine River-Van Etten Lake Watershed Management Plan 1-30
Wetland loss and degradation
Fishery planning concerns
Adfluvial fish passages debate
Solid waste in tributaries and lakes, i.e. fishing line, trash
Lack of education and stewardship
Poaching
Wildlife and fishery predation - overconsumption
Public perception/apathy
Household hazardous waste to septic systems
Great Lakes pollutants within aquatic wildlife, i.e. PCBs
Table 1.6c: Concerns and Threats to Designated Uses
< Van Etten Lake >
Sediment delivery to lake from upstream
Residential and golf course fertilizers
Algae blooms
Aquatic and exotic weeds
Wildlife habitat loss
Septic system effluent entering lake
Chemical treatment of aquatic weeds
Lack of zoning and enforcement
Pesticides entering watershed
Reduction of natural shoreline
Hydrocarbons entering waterbodies from runoff
Watercraft overuse/jet skis
Recreational conflicts
Exotic species, i.e. zebra mussels, Eurasian water milfoil etc.
Wetland loss and degradation
Inadequate fishery planning
Adfluvial fish passages debate
Solid waste in tributaries and lakes, i.e. fishing line, trash
Lack of education and stewardship
Wildlife and fishery predation
Public perception/apathy
Household hazardous waste to septic systems
Great Lakes pollutants within aquatic wildlife, i.e. PCBs

Chapter 1: Getting to Know the Pine River-Van Etten Lake Watershed
Pine River-Van Etten Lake Watershed Management Plan 1-31
C. Known and Suspected Pollutants
Nutrients, sediments, pesticides, exotic species, pathogenic bacteria and viruses, oils and greases,
metals and solid waste were identified as main pollutants of concern that threaten the designated
uses of the Pine River-Van Etten Lake watershed. The following table (Table 1.7) lists these
pollutants:
Table 1.7: Known and Suspected Pollutants that
Threaten the Designated Uses
Designated Use Pollutants Subwatershed Directly Affected
Warm Water Fishery
Nutrients (K)
Sediment (K)
Pesticides (S) Invasive exotic species (K)
Pathogenic bacteria and viruses (S)
Temperature (S)
Van Etten lake
Cold Water Fishery
Nutrients (K)
Sediment (K)
Pesticides (S) Invasive exotic species (K)
Pathogenic bacteria and viruses (S)
Temperature (S)
Pine River, Van Etten Creek
Other indigenous aquatic life/ wildlife
Nutrients (K)
Sediment (K) Pesticides (S)
Invasive exotic species (K)
Pathogenic bacteria and viruses (S) Mercury, PCBs, Metals (S)
Solid waste (S)
Pine River, Van Etten Creek, Van Etten Lake
Note: Van Etten Creek is on the non-
attainment list for this use because of
excessive nutrients, ammonia, algae
flow regime alterations, phosphorus,
and sediment
Partial body contact
recreation
Invasive exotic species (S)
Swimmer’s Itch (S) Van Etten Lake
Total body contact
recreation
Nutrients (K)
Invasive exotic species (S)
Pathogenic bacteria and viruses (S) Swimmer’s Itch (S)
Solid waste (S)
Van Etten Lake
Navigation
Sediment (K)
Nutrients (K)
Exotic Species (K)
Pine River, Van Etten Creek, Van Etten Lake
Known (K) and Suspected (S)

Chapter 1: Getting to Know the Pine River-Van Etten Lake Watershed
Pine River-Van Etten Lake Watershed Management Plan 1-32
D. Sources of Pollutants
To address pollutants within the watershed, it is important to understand their underlying causes.
Land uses within this watershed range from large tracts of federal forest and agricultural
properties to densely developed resort communities and small rural towns. The Pine River-Van
Etten Lake Watershed Coalition Steering Committee identified the annual blue-green algae
bloom on Van Etten Lake as the nexus to addressing pollutants and their sources within the
watershed. Ideally, it is perceived that nutrient reduction through source management will have
the greatest impact on minimizing the algae bloom and thus improve overall water quality within
the watershed and remove the threat to the total body contact recreation designated use for Van
Etten Lake. The primary pollutants of concern within the Pine River-Van Etten Lake watershed,
along with their sources and causes are identified and listed in Table 1.8 below. Pollutants and
their sources are prioritized based on the knowledge and concerns of the Steering Committee, the
results of field inventories and the water quality study.
Table 1.8: Sources of Pollutants in the Pine River-Van Etten Lake Watershed
(in order of priority as discussed by the PRVEL Coalition)
Pollutant Source Cause Nutrients
1. Livestock waste
2. Septic Systems
3. Shoreline practices
by landowners
4. Fertilizer use
5. Construction sites
a. Cattle access to streams b. Stormwater runoff of livestock waste (manure) used
as fertilizer a. Lack of maintenance
b. Poorly sited
c. Undersized d. Density
e. Age of system a. Lack of filter strip
b. Lack of education
c. Excessive development d. Poor shoreline setbacks
e. Yard waste dumped into lake a. Near shore fertilization
b. Overuse
c. Poor timing of application a. Lack of stormwater BMPs
b. Excessive development c. Wetland loss
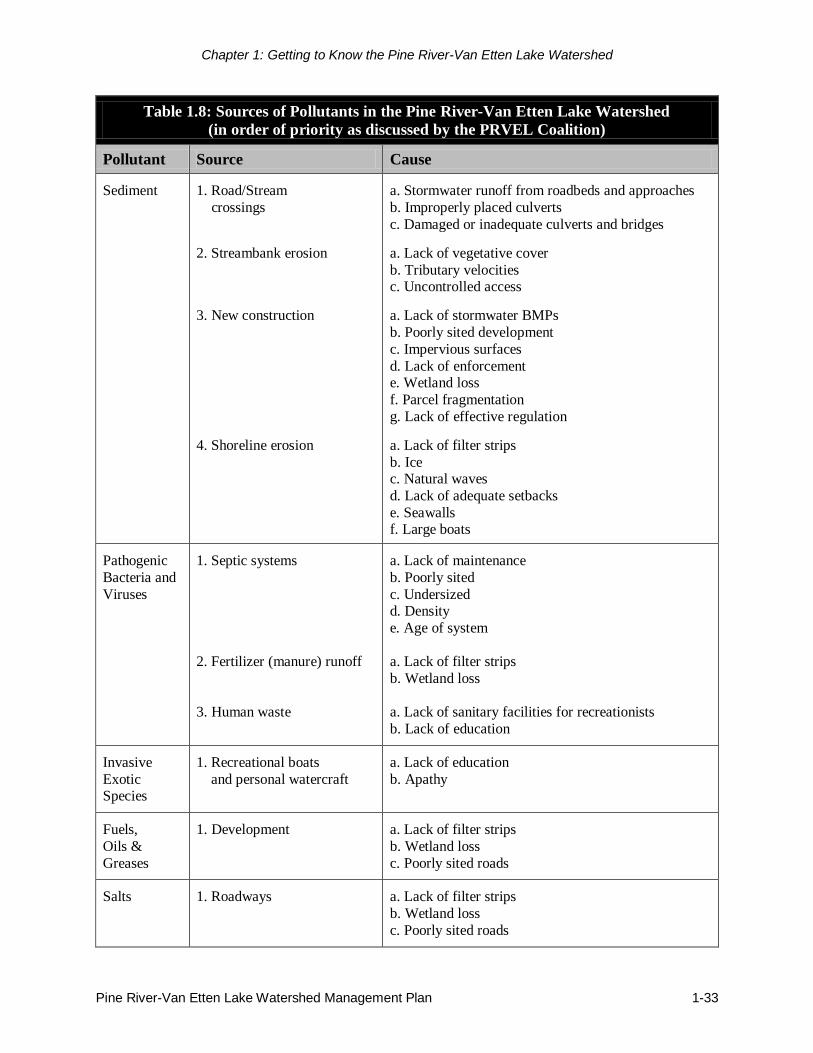
Chapter 1: Getting to Know the Pine River-Van Etten Lake Watershed
Pine River-Van Etten Lake Watershed Management Plan 1-33
Table 1.8: Sources of Pollutants in the Pine River-Van Etten Lake Watershed
(in order of priority as discussed by the PRVEL Coalition)
Pollutant Source Cause Sediment
1. Road/Stream
crossings
2. Streambank erosion
3. New construction
4. Shoreline erosion
a. Stormwater runoff from roadbeds and approaches
b. Improperly placed culverts
c. Damaged or inadequate culverts and bridges a. Lack of vegetative cover
b. Tributary velocities c. Uncontrolled access a. Lack of stormwater BMPs
b. Poorly sited development
c. Impervious surfaces
d. Lack of enforcement e. Wetland loss
f. Parcel fragmentation
g. Lack of effective regulation a. Lack of filter strips
b. Ice c. Natural waves
d. Lack of adequate setbacks
e. Seawalls f. Large boats
Pathogenic
Bacteria and
Viruses
1. Septic systems
2. Fertilizer (manure) runoff
3. Human waste
a. Lack of maintenance
b. Poorly sited
c. Undersized d. Density
e. Age of system
a. Lack of filter strips
b. Wetland loss
a. Lack of sanitary facilities for recreationists
b. Lack of education
Invasive
Exotic Species
1. Recreational boats
and personal watercraft
a. Lack of education
b. Apathy
Fuels,
Oils &
Greases
1. Development
a. Lack of filter strips
b. Wetland loss
c. Poorly sited roads
Salts
1. Roadways
a. Lack of filter strips
b. Wetland loss
c. Poorly sited roads
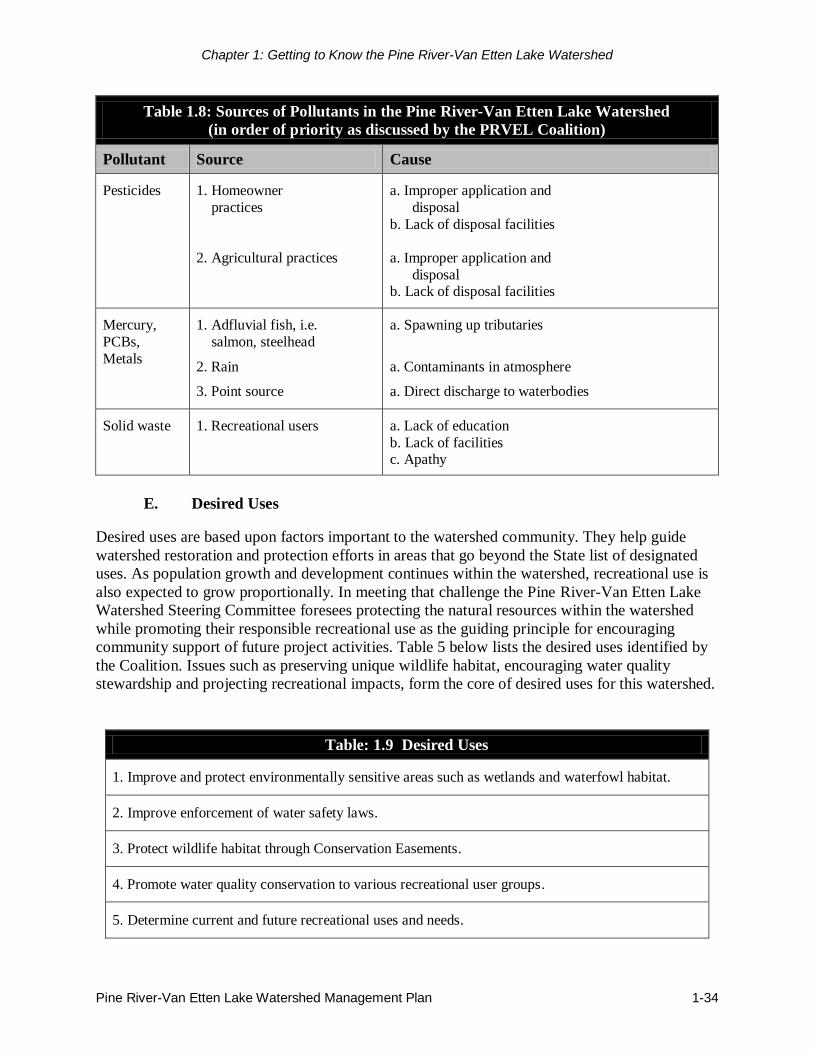
Chapter 1: Getting to Know the Pine River-Van Etten Lake Watershed
Pine River-Van Etten Lake Watershed Management Plan 1-34
Table 1.8: Sources of Pollutants in the Pine River-Van Etten Lake Watershed
(in order of priority as discussed by the PRVEL Coalition)
Pollutant Source Cause Pesticides
1. Homeowner
practices
2. Agricultural practices
a. Improper application and
disposal
b. Lack of disposal facilities
a. Improper application and
disposal b. Lack of disposal facilities
Mercury,
PCBs,
Metals
1. Adfluvial fish, i.e.
salmon, steelhead 2. Rain 3. Point source
a. Spawning up tributaries
a. Contaminants in atmosphere a. Direct discharge to waterbodies
Solid waste
1. Recreational users
a. Lack of education
b. Lack of facilities c. Apathy
E. Desired Uses
Desired uses are based upon factors important to the watershed community. They help guide
watershed restoration and protection efforts in areas that go beyond the State list of designated
uses. As population growth and development continues within the watershed, recreational use is
also expected to grow proportionally. In meeting that challenge the Pine River-Van Etten Lake
Watershed Steering Committee foresees protecting the natural resources within the watershed
while promoting their responsible recreational use as the guiding principle for encouraging
community support of future project activities. Table 5 below lists the desired uses identified by
the Coalition. Issues such as preserving unique wildlife habitat, encouraging water quality
stewardship and projecting recreational impacts, form the core of desired uses for this watershed.
Table: 1.9 Desired Uses
1. Improve and protect environmentally sensitive areas such as wetlands and waterfowl habitat.
2. Improve enforcement of water safety laws.
3. Protect wildlife habitat through Conservation Easements.
4. Promote water quality conservation to various recreational user groups.
5. Determine current and future recreational uses and needs.
Chapter 1: Getting to Know the Pine River-Van Etten Lake Watershed
Pine River-Van Etten Lake Watershed Management Plan 1-35
Although it is a necessary and productive part of the overall planning process to identify desired
uses and envision their community and environmental benefits, the need to address the numerous
water quality impairment issues within the Pine River-Van Etten Lake watershed is primary.
Therefore the overriding focus of the Pine River-Van Etten Lake Watershed Steering Committee
is to concentrate on pollutants; their identification, sources and the restoration activities required
to reduce or eliminate them and eventually meet the State of Michigan designated uses for all
surface waters within the watershed.

Pine River-Van Etten Lake Watershed Management Plan 2-1
I. INTRODUCTION
Areas adjacent to waterbodies are considered important because land uses within this “critical
area” are most likely to have an influence on surface water quality. Defining a critical area also
allows for a focus of the geographic scope of a watershed project, which allows inventory and
restoration efforts to be targeted toward the areas that generally contribute the majority of
nonpoint source pollution.
USDA Natural Resources Conservation Service Soil Surveys and US Geological Survey
topographic maps were utilized to delineate the critical area for the Pine River-Van Etten Lake
watershed. The criteria used to determine the critical area includes
1. All bodies of surface water, including lakes and streams,
2. Intermittent drainages,
3. Priority road/stream crossings, streambank, and agricultural inventory sites,
4. All areas within 1000 feet of surface water, and
5. Urban areas that drain to surface waters.
The critical area for the Pine River-Van Etten Lake watershed is approximately 85,239 acres.
This area served as the focus of the resource inventories for the project. Map 6 on the next page
indicates the critical area shaded in light blue for the Pine River-Van Etten Lake watershed.
There are several areas in the watershed that are particularly critical to monitor and protect
because pollutants could be entering the watershed at these points and affecting water quality
downstream to the Au Sable River and even to Lake Huron. Critical areas of concern are:
1. Van Etten Creek, specifically the reaches identified through the agricultural inventory as
areas where fertilizer from row crops or manure from pasture lands may be entering the
river. There are also two streambank erosion sites that are adding sediment to the stream.
Since most of the agriculture in the Pine River-Van Etten Lake watershed is concentrated
in the Van Etten Creek subwatershed, it has a disproportionate effect on the downstream
water quality and it is therefore important to improve and protect the entire stream.
2. Road/stream crossing sites in the watershed add sediments, oils and greases to streams
from the roadways. In this watershed, there are six priority sites that can be addressed to
remove the majority of the sediment entering the watershed from roadways.
3. Urban and industrial areas can add sediment, salts, oils and greases, and other chemicals
to the watershed. The town of Oscoda is at the southern tip of the watershed but also
borders on Van Etten Lake. Smaller villages like Mikado and Barton City are potential
sources of pollutants much farther upstream and have the capacity to affect large
stretches of the river.
4. All shoreline areas along the rivers and lakes in the watershed are important to protect,
but especially the more densely populated Van Etten Lake, which is a large source of
pollution through septic systems and fertilizers. Much of the shoreline is armored with
seawalls that prevent the lake from cleansing itself of debris and cause erosion on the
unarmored properties.
Chapter Two: Critical Area
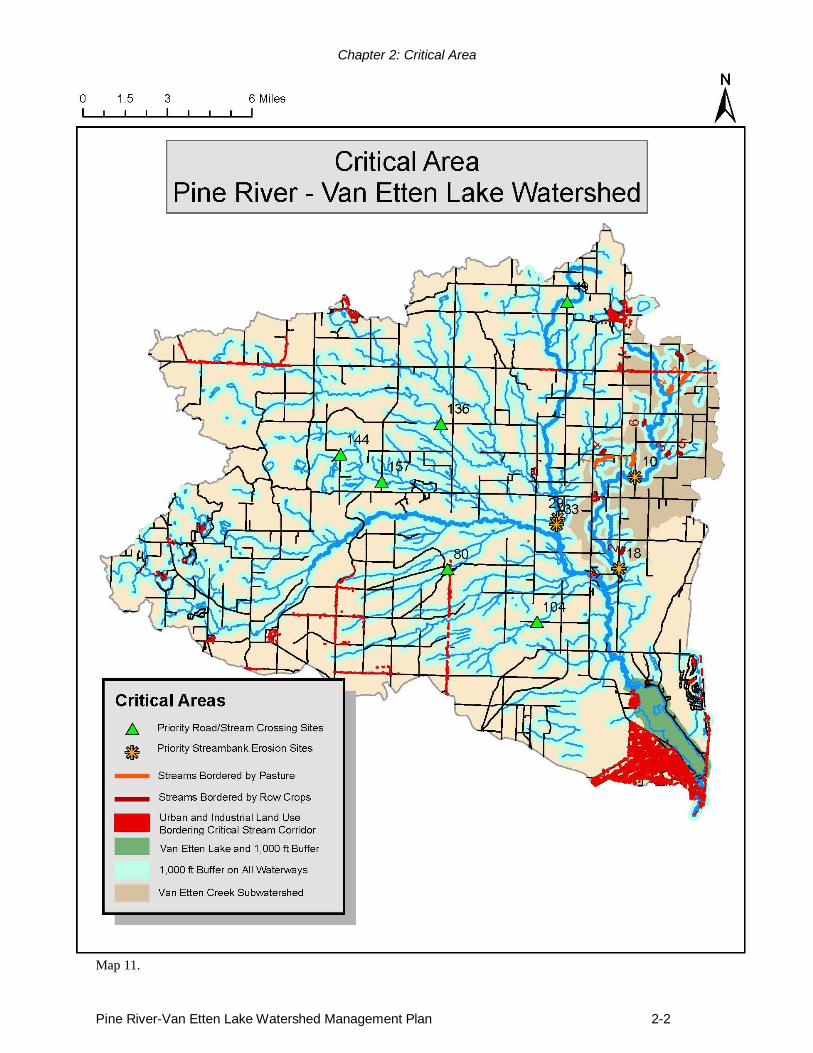
Chapter 2: Critical Area
Pine River-Van Etten Lake Watershed Management Plan 2-2
Map 11.
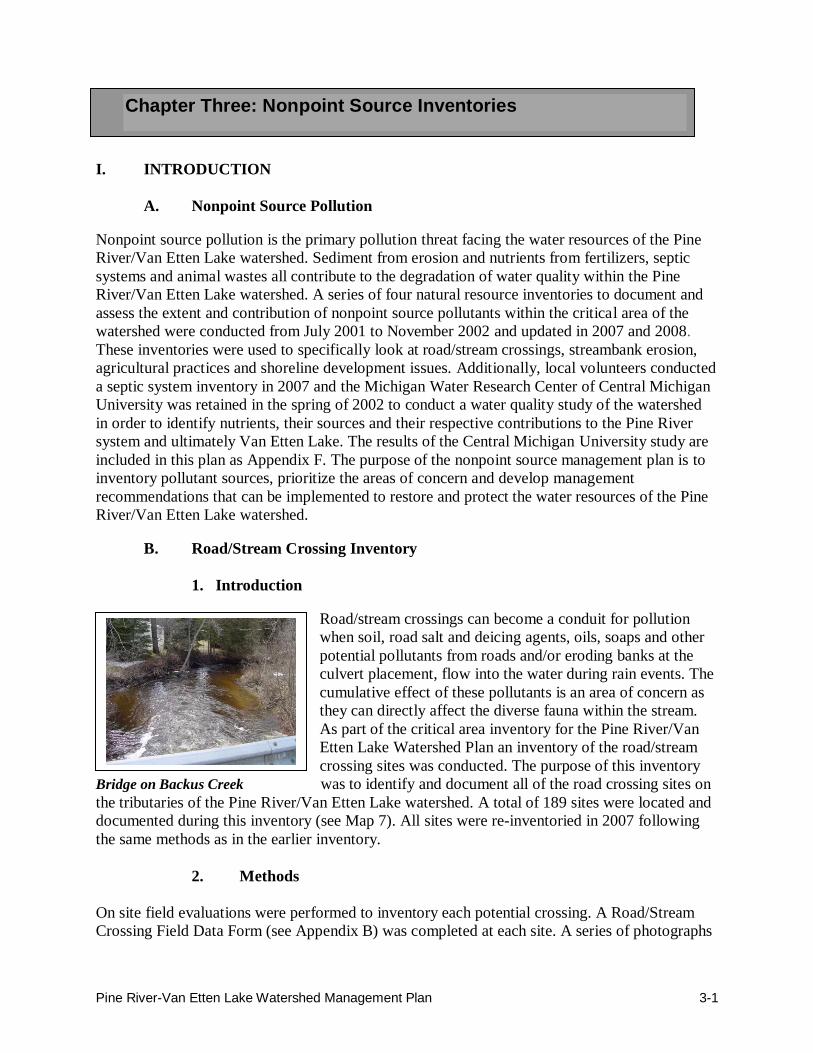
Pine River-Van Etten Lake Watershed Management Plan 3-1
I. INTRODUCTION
A. Nonpoint Source Pollution
Nonpoint source pollution is the primary pollution threat facing the water resources of the Pine
River/Van Etten Lake watershed. Sediment from erosion and nutrients from fertilizers, septic
systems and animal wastes all contribute to the degradation of water quality within the Pine
River/Van Etten Lake watershed. A series of four natural resource inventories to document and
assess the extent and contribution of nonpoint source pollutants within the critical area of the
watershed were conducted from July 2001 to November 2002 and updated in 2007 and 2008.
These inventories were used to specifically look at road/stream crossings, streambank erosion,
agricultural practices and shoreline development issues. Additionally, local volunteers conducted
a septic system inventory in 2007 and the Michigan Water Research Center of Central Michigan
University was retained in the spring of 2002 to conduct a water quality study of the watershed
in order to identify nutrients, their sources and their respective contributions to the Pine River
system and ultimately Van Etten Lake. The results of the Central Michigan University study are
included in this plan as Appendix F. The purpose of the nonpoint source management plan is to
inventory pollutant sources, prioritize the areas of concern and develop management
recommendations that can be implemented to restore and protect the water resources of the Pine
River/Van Etten Lake watershed.
B. Road/Stream Crossing Inventory
1. Introduction
Road/stream crossings can become a conduit for pollution
when soil, road salt and deicing agents, oils, soaps and other
potential pollutants from roads and/or eroding banks at the
culvert placement, flow into the water during rain events. The
cumulative effect of these pollutants is an area of concern as
they can directly affect the diverse fauna within the stream.
As part of the critical area inventory for the Pine River/Van
Etten Lake Watershed Plan an inventory of the road/stream
crossing sites was conducted. The purpose of this inventory
Bridge on Backus Creek was to identify and document all of the road crossing sites on
the tributaries of the Pine River/Van Etten Lake watershed. A total of 189 sites were located and
documented during this inventory (see Map 7). All sites were re-inventoried in 2007 following
the same methods as in the earlier inventory.
2. Methods
On site field evaluations were performed to inventory each potential crossing. A Road/Stream
Crossing Field Data Form (see Appendix B) was completed at each site. A series of photographs
Chapter Three: Nonpoint Source Inventories
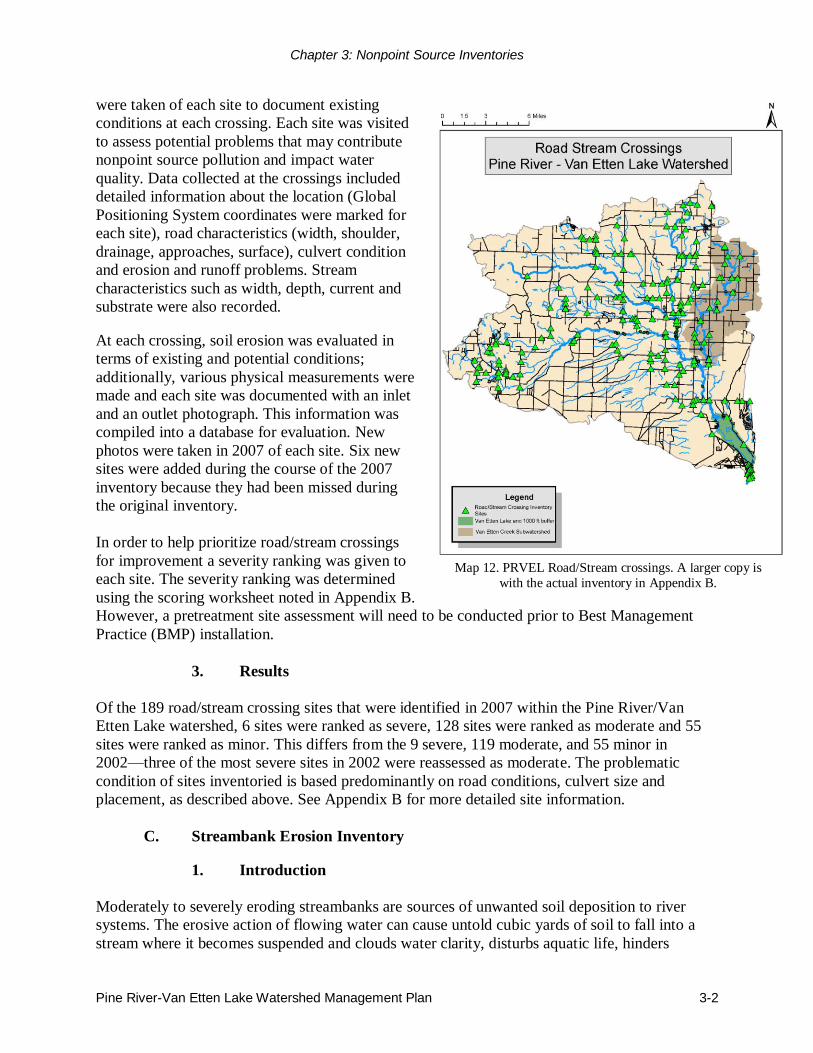
Chapter 3: Nonpoint Source Inventories
Pine River-Van Etten Lake Watershed Management Plan 3-2
were taken of each site to document existing
conditions at each crossing. Each site was visited
to assess potential problems that may contribute
nonpoint source pollution and impact water
quality. Data collected at the crossings included
detailed information about the location (Global
Positioning System coordinates were marked for
each site), road characteristics (width, shoulder,
drainage, approaches, surface), culvert condition
and erosion and runoff problems. Stream
characteristics such as width, depth, current and
substrate were also recorded.
At each crossing, soil erosion was evaluated in
terms of existing and potential conditions;
additionally, various physical measurements were
made and each site was documented with an inlet
and an outlet photograph. This information was
compiled into a database for evaluation. New
photos were taken in 2007 of each site. Six new
sites were added during the course of the 2007
inventory because they had been missed during
the original inventory.
In order to help prioritize road/stream crossings
for improvement a severity ranking was given to
each site. The severity ranking was determined
using the scoring worksheet noted in Appendix B.
However, a pretreatment site assessment will need to be conducted prior to Best Management
Practice (BMP) installation.
3. Results
Of the 189 road/stream crossing sites that were identified in 2007 within the Pine River/Van
Etten Lake watershed, 6 sites were ranked as severe, 128 sites were ranked as moderate and 55
sites were ranked as minor. This differs from the 9 severe, 119 moderate, and 55 minor in
2002—three of the most severe sites in 2002 were reassessed as moderate. The problematic
condition of sites inventoried is based predominantly on road conditions, culvert size and
placement, as described above. See Appendix B for more detailed site information.
C. Streambank Erosion Inventory
1. Introduction
Moderately to severely eroding streambanks are sources of unwanted soil deposition to river
systems. The erosive action of flowing water can cause untold cubic yards of soil to fall into a
stream where it becomes suspended and clouds water clarity, disturbs aquatic life, hinders
Map 12. PRVEL Road/Stream crossings. A larger copy is
with the actual inventory in Appendix B.

Chapter 3: Nonpoint Source Inventories
Pine River-Van Etten Lake Watershed Management Plan 3-3
navigation and may contribute excessive nutrients as they detach from soil particles.
Additionally, severe streambank erosion jeopardizes land integrity and may result in the loss of
residential property.
In order to reevaluate the severity,
quantity and location of streambank
erosion sites within the Pine River/Van
Etten Lake watershed, a field re-
inventory of severe sites was conducted
by Huron Pines during the summer of
2008.
2. Methods
Between October 2001 and September
2002, a field inventory was conducted.
Results from that inventory identified
36 streambank erosion sites. Each site
was cataloged with a Global
Positioning System (GPS) and data was
collected to document site accessibility,
condition of the bank, percent
vegetative cover, apparent cause of the
erosion, bank slope, length and height,
river conditions, soil types, and
recommended treatments. Photographic
records were also made of each site.
Using the data collected in the original
inventory, pollutant loading
calculations were run for each site.
Based on the severity of the erosion
sites listed in the inventory, and using the pollutant loading calculations, the most severe sites
were re-inventoried. This reevaluation focused on assessing the change in erosion severity since
the previous inventory. Revisiting each
severe site also allowed for a ground
truthing of measurements in the previous
inventory form. Using information reflecting any changes in erosion measurements or severity,
the pollutant loading data was updated. The photographic record present on the attached
inventory sheets is the original photo from the streambank evaluation completed in 2001.
3. Results
There were a total of 36 streambank erosion sites identified in the original inventory. Of those,
six sites, listed as severe, were chosen for re-inventorying. For a more detailed survey of the
specific site scores, characteristics and data forms refer to Appendix C.
Map 13. PRVEL streambank inventory sites. A larger copy is
with the actual inventory in Appendix C.
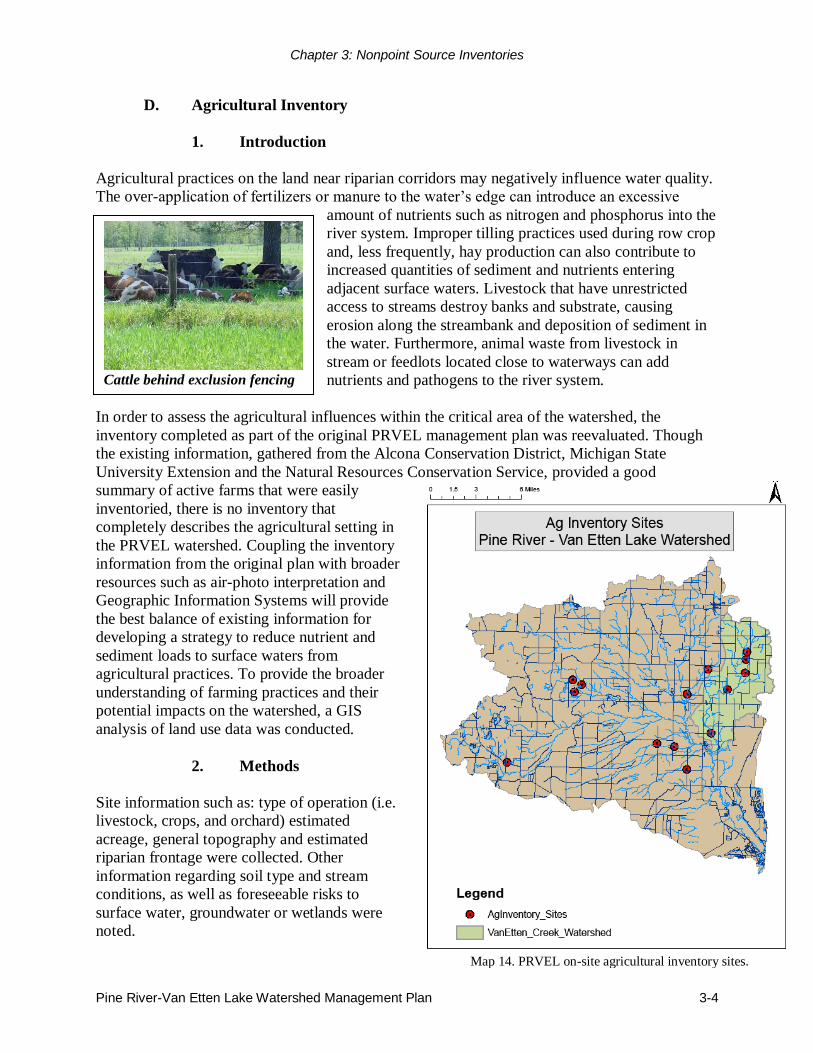
Chapter 3: Nonpoint Source Inventories
Pine River-Van Etten Lake Watershed Management Plan 3-4
Cattle behind exclusion fencing
D. Agricultural Inventory
1. Introduction
Agricultural practices on the land near riparian corridors may negatively influence water quality.
The over-application of fertilizers or manure to the water’s edge can introduce an excessive
amount of nutrients such as nitrogen and phosphorus into the
river system. Improper tilling practices used during row crop
and, less frequently, hay production can also contribute to
increased quantities of sediment and nutrients entering
adjacent surface waters. Livestock that have unrestricted
access to streams destroy banks and substrate, causing
erosion along the streambank and deposition of sediment in
the water. Furthermore, animal waste from livestock in
stream or feedlots located close to waterways can add
nutrients and pathogens to the river system.
In order to assess the agricultural influences within the critical area of the watershed, the
inventory completed as part of the original PRVEL management plan was reevaluated. Though
the existing information, gathered from the Alcona Conservation District, Michigan State
University Extension and the Natural Resources Conservation Service, provided a good
summary of active farms that were easily
inventoried, there is no inventory that
completely describes the agricultural setting in
the PRVEL watershed. Coupling the inventory
information from the original plan with broader
resources such as air-photo interpretation and
Geographic Information Systems will provide
the best balance of existing information for
developing a strategy to reduce nutrient and
sediment loads to surface waters from
agricultural practices. To provide the broader
understanding of farming practices and their
potential impacts on the watershed, a GIS
analysis of land use data was conducted.
2. Methods
Site information such as: type of operation (i.e.
livestock, crops, and orchard) estimated
acreage, general topography and estimated
riparian frontage were collected. Other
information regarding soil type and stream
conditions, as well as foreseeable risks to
surface water, groundwater or wetlands were
noted.
Map 14. PRVEL on-site agricultural inventory sites.
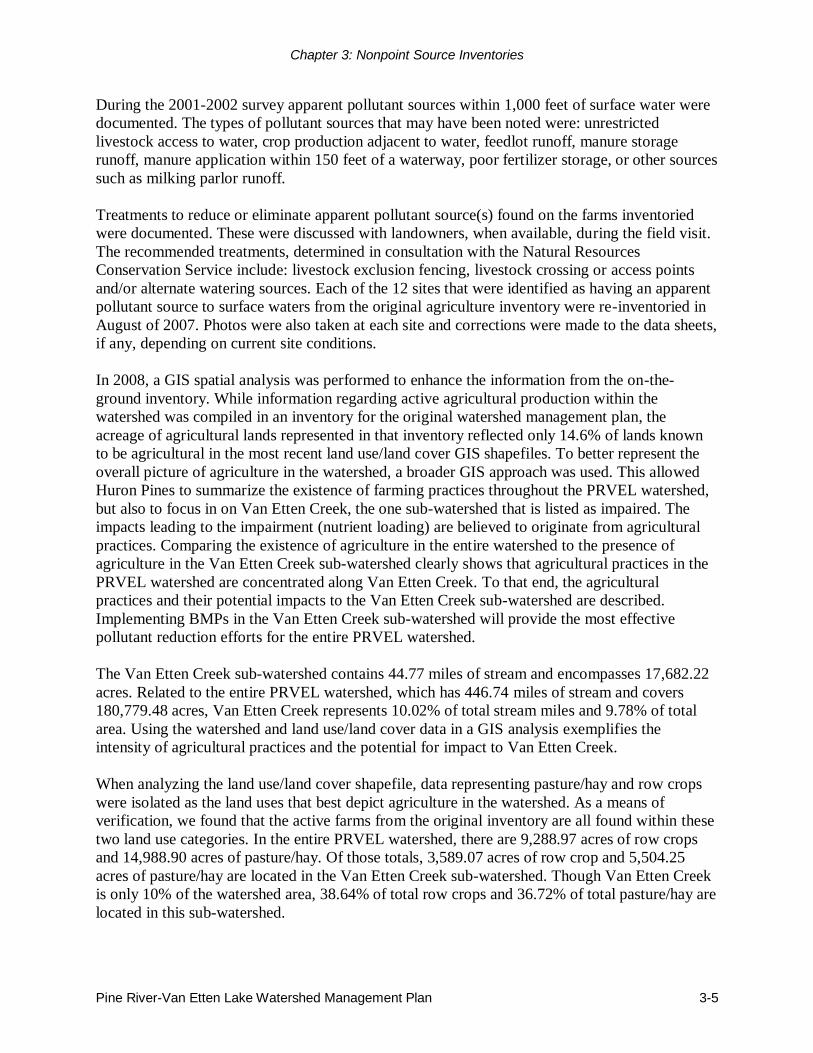
Chapter 3: Nonpoint Source Inventories
Pine River-Van Etten Lake Watershed Management Plan 3-5
During the 2001-2002 survey apparent pollutant sources within 1,000 feet of surface water were
documented. The types of pollutant sources that may have been noted were: unrestricted
livestock access to water, crop production adjacent to water, feedlot runoff, manure storage
runoff, manure application within 150 feet of a waterway, poor fertilizer storage, or other sources
such as milking parlor runoff.
Treatments to reduce or eliminate apparent pollutant source(s) found on the farms inventoried
were documented. These were discussed with landowners, when available, during the field visit.
The recommended treatments, determined in consultation with the Natural Resources
Conservation Service include: livestock exclusion fencing, livestock crossing or access points
and/or alternate watering sources. Each of the 12 sites that were identified as having an apparent
pollutant source to surface waters from the original agriculture inventory were re-inventoried in
August of 2007. Photos were also taken at each site and corrections were made to the data sheets,
if any, depending on current site conditions.
In 2008, a GIS spatial analysis was performed to enhance the information from the on-the-
ground inventory. While information regarding active agricultural production within the
watershed was compiled in an inventory for the original watershed management plan, the
acreage of agricultural lands represented in that inventory reflected only 14.6% of lands known
to be agricultural in the most recent land use/land cover GIS shapefiles. To better represent the
overall picture of agriculture in the watershed, a broader GIS approach was used. This allowed
Huron Pines to summarize the existence of farming practices throughout the PRVEL watershed,
but also to focus in on Van Etten Creek, the one sub-watershed that is listed as impaired. The
impacts leading to the impairment (nutrient loading) are believed to originate from agricultural
practices. Comparing the existence of agriculture in the entire watershed to the presence of
agriculture in the Van Etten Creek sub-watershed clearly shows that agricultural practices in the
PRVEL watershed are concentrated along Van Etten Creek. To that end, the agricultural
practices and their potential impacts to the Van Etten Creek sub-watershed are described.
Implementing BMPs in the Van Etten Creek sub-watershed will provide the most effective
pollutant reduction efforts for the entire PRVEL watershed.
The Van Etten Creek sub-watershed contains 44.77 miles of stream and encompasses 17,682.22
acres. Related to the entire PRVEL watershed, which has 446.74 miles of stream and covers
180,779.48 acres, Van Etten Creek represents 10.02% of total stream miles and 9.78% of total
area. Using the watershed and land use/land cover data in a GIS analysis exemplifies the
intensity of agricultural practices and the potential for impact to Van Etten Creek.
When analyzing the land use/land cover shapefile, data representing pasture/hay and row crops
were isolated as the land uses that best depict agriculture in the watershed. As a means of
verification, we found that the active farms from the original inventory are all found within these
two land use categories. In the entire PRVEL watershed, there are 9,288.97 acres of row crops
and 14,988.90 acres of pasture/hay. Of those totals, 3,589.07 acres of row crop and 5,504.25
acres of pasture/hay are located in the Van Etten Creek sub-watershed. Though Van Etten Creek
is only 10% of the watershed area, 38.64% of total row crops and 36.72% of total pasture/hay are
located in this sub-watershed.
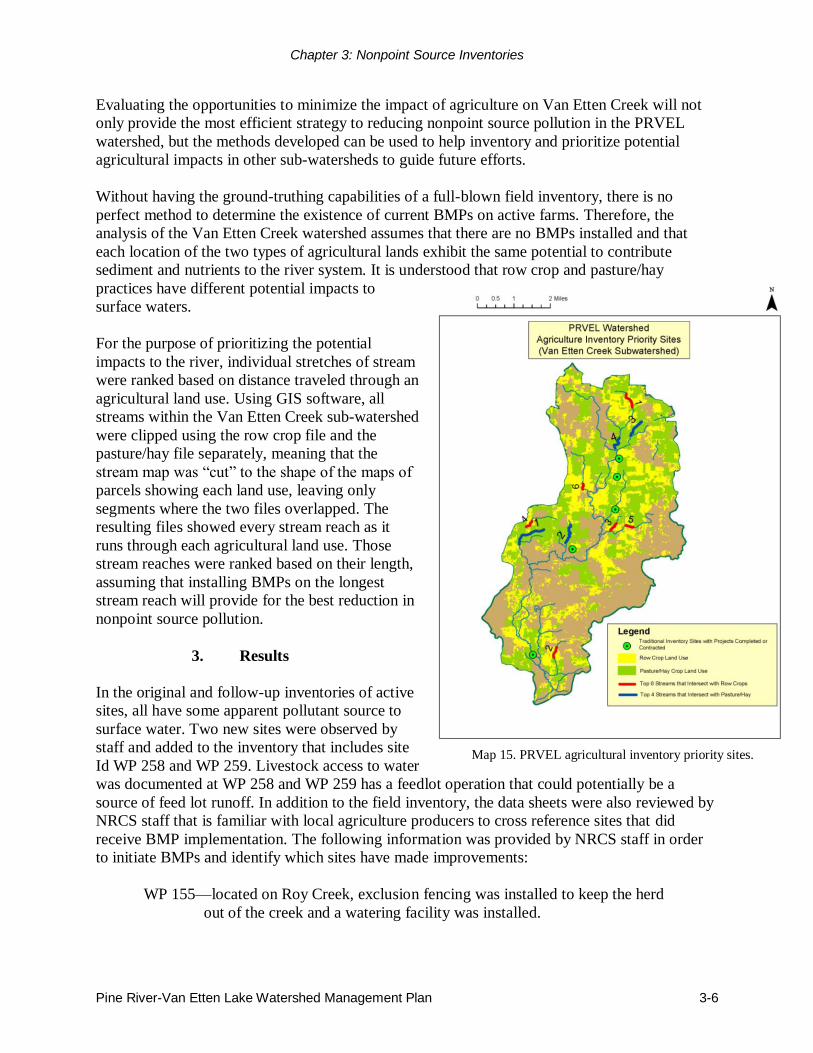
Chapter 3: Nonpoint Source Inventories
Pine River-Van Etten Lake Watershed Management Plan 3-6
Evaluating the opportunities to minimize the impact of agriculture on Van Etten Creek will not
only provide the most efficient strategy to reducing nonpoint source pollution in the PRVEL
watershed, but the methods developed can be used to help inventory and prioritize potential
agricultural impacts in other sub-watersheds to guide future efforts.
Without having the ground-truthing capabilities of a full-blown field inventory, there is no
perfect method to determine the existence of current BMPs on active farms. Therefore, the
analysis of the Van Etten Creek watershed assumes that there are no BMPs installed and that
each location of the two types of agricultural lands exhibit the same potential to contribute
sediment and nutrients to the river system. It is understood that row crop and pasture/hay
practices have different potential impacts to
surface waters.
For the purpose of prioritizing the potential
impacts to the river, individual stretches of stream
were ranked based on distance traveled through an
agricultural land use. Using GIS software, all
streams within the Van Etten Creek sub-watershed
were clipped using the row crop file and the
pasture/hay file separately, meaning that the
stream map was “cut” to the shape of the maps of
parcels showing each land use, leaving only
segments where the two files overlapped. The
resulting files showed every stream reach as it
runs through each agricultural land use. Those
stream reaches were ranked based on their length,
assuming that installing BMPs on the longest
stream reach will provide for the best reduction in
nonpoint source pollution.
3. Results
In the original and follow-up inventories of active
sites, all have some apparent pollutant source to
surface water. Two new sites were observed by
staff and added to the inventory that includes site
Id WP 258 and WP 259. Livestock access to water
was documented at WP 258 and WP 259 has a feedlot operation that could potentially be a
source of feed lot runoff. In addition to the field inventory, the data sheets were also reviewed by
NRCS staff that is familiar with local agriculture producers to cross reference sites that did
receive BMP implementation. The following information was provided by NRCS staff in order
to initiate BMPs and identify which sites have made improvements:
WP 155—located on Roy Creek, exclusion fencing was installed to keep the herd
out of the creek and a watering facility was installed.
Map 15. PRVEL agricultural inventory priority sites.

Chapter 3: Nonpoint Source Inventories
Pine River-Van Etten Lake Watershed Management Plan 3-7
Typical heavy turf management
WP 210—located on Van Etten Creek, the landowner is interested in installing
exclusion fencing that would keep the herd from access of
approximately one mile of the creek. NRCS staff stated this would be
paid through their CCRP Program, however the landowner stated it
would be difficult to complete the project without additional labor
assistance.
WP 220—located on Van Etten Creek, the landowner has a contract to install a
manure storage pit, however the storage facility has not been installed.
WP 227—located on a tributary of the E. Branch of the Pine River, the landowner
plans to install large amounts of exclusion fencing and a pipeline to
water his animals in the paddock. To date no work has been completed.
WP 259—located on Roy Creek, the landowner has a contract through NRCS,
however no work has been completed.
In the spatial analysis, clipping all streams in the Van Etten Creek sub-watershed by the two
agricultural land uses provided data describing the quantity and length of each reach of stream
that travels through row crops or pasture/hay land uses. The total length of stream running
through agricultural lands within the Van Etten Creek sub-watershed is 19.24 miles, representing
43% of all streams in the sub-watershed. Streams running through row crops totaled 7.92 miles,
while streams traveling through pasture/hay summed to 11.32 miles.
Sorting the results of the clipped stream files shows that there are distinct reaches of stream that
rank as higher priority sites. These stream reaches, based on length, run a higher risk of impact
from agriculture due to the greater exposure to agriculture, in terms of distance. When analyzing
the length data for each file, logical breaks in the distribution of length of stream reaches became
evident. For the row crop layer, the six longest reaches totaled 1.64 miles (8679.71 ft), or 20.76%
of the total amount of stream running through row crops. In terms of the pasture/hay land use,
the longest four reaches of stream were found to accomplish 20% coverage of streams affected
by pasture/hay. Those four stream reaches total 2.52 miles (13314.92 ft) to represent 22.28% of
streams traveling through pasture/hay.
E. Shoreline Development Inventory
1. Introduction
Van Etten Lake is a borderline eutrophic, nutrient rich
impoundment, with a shoreline that is nearly all developed.
On such a waterbody, research has shown that excessive
nutrients, often attributable to the activities of homeowners,
are a major pollutant. While nutrients are essential for life,
an overabundance of nutrients can lead to the accelerated
eutrophication (aging) of the lake. An inventory of sites
where nutrient enrichment is occurring makes for a useful
watershed management tool. However, data generated by
this inventory must be carefully interpreted and is intended
only to help guide watershed management efforts.
Chapter 3: Nonpoint Source Inventories
Pine River-Van Etten Lake Watershed Management Plan 3-8
Because the riparian zone plays such an important role, an inventory of the shoreline can assist in
understanding current and future water quality problems. The critical shoreline area can either be
developed in such a way that it is in a near natural state (working to filter nutrients, provide fish
and wildlife habitat, and stabilize the shoreline) or be artificial (seawall with mowed, heavily
fertilized turf grass to the water’s edge). While most parcels may fall somewhere in-between,
developed properties generally have shorelines that resemble the latter option. Loss of natural
habitat and excessive nutrients work together to drastically change the natural condition of the
lake, and while almost everyone wants to improve water resources, few take the relatively easy
steps to do so.
As part of the assessment of the critical area of the Pine River/Van Etten Lake watershed an
inventory of shoreline development was conducted on Van Etten Lake. The inventory began in
August 2001 and was completed in October 2002.
2. Methods
The shoreline inventory was conducted on a parcel by parcel basis. Shoreline property parcels
included developed and undeveloped lots, access sites and easements. Parcel numbers were
assigned to each shoreline property parcel identified. Some of the categories of information
collected for each shoreline property parcel included: substrate of parcel, aquatic plants observed
in the nearshore area, turf management, erosion, structural setback, wetland regions and
greenbelts. By using a small watercraft technicians were able to be near enough to the shoreline
to effectively collect data. Methods for the shoreline inventory were based upon similar studies
conducted by the Tip of the Mitt Watershed Council. See field data sheet in Appendix E for more
details regarding data collection categories.
Turf management status was given a rating such as light, heavy etc. versus just a yes/no status.
Heavy turf management is generally viewed as potentially attributing to water quality
impairment. Greenbelts (or vegetated buffer strips along the shoreline) were rated on a scale of
zero to 3.0 with 3.0 being an undeveloped shoreline with no disturbance of the natural vegetation
and zero being ascribed to a site entirely paved or devoid of vegetation. In terms of water quality
enhancement, a site rated as 2.5 to 3.0 would be considered excellent.
3. Results
The entire shoreline of Van Etten Lake, including Loud Island, was inventoried. Data was
gathered on a total of 486 shoreline property parcels. Listed below are some of the findings noted
in the shoreline inventory.
Turf Management
Number of Parcels rated Heavy 143 or 29%
Number of Parcels rated Moderate 199 or 41%
Number of Parcels rated Light 117 or 24%
Number of Parcels with no management _27 or 6%
Total 486 or 100%
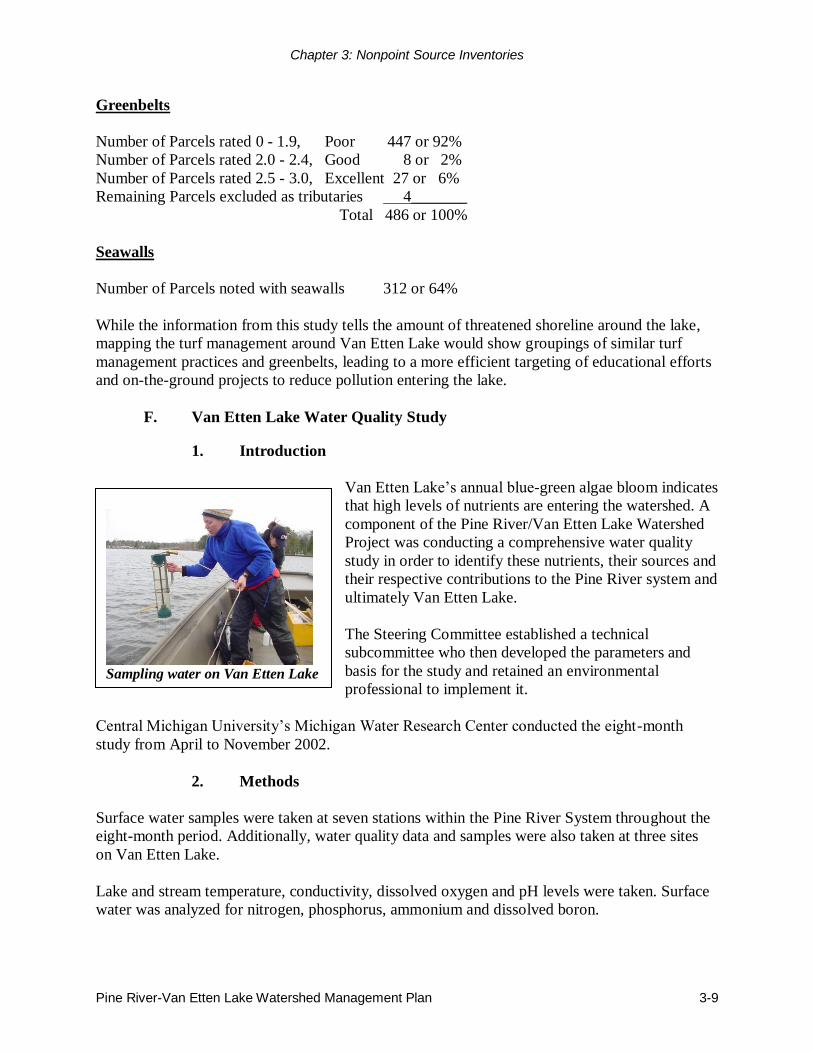
Chapter 3: Nonpoint Source Inventories
Pine River-Van Etten Lake Watershed Management Plan 3-9
Sampling water on Van Etten Lake
Greenbelts
Number of Parcels rated 0 - 1.9, Poor 447 or 92%
Number of Parcels rated 2.0 - 2.4, Good 8 or 2%
Number of Parcels rated 2.5 - 3.0, Excellent 27 or 6%
Remaining Parcels excluded as tributaries 4_______
Total 486 or 100%
Seawalls
Number of Parcels noted with seawalls 312 or 64%
While the information from this study tells the amount of threatened shoreline around the lake,
mapping the turf management around Van Etten Lake would show groupings of similar turf
management practices and greenbelts, leading to a more efficient targeting of educational efforts
and on-the-ground projects to reduce pollution entering the lake.
F. Van Etten Lake Water Quality Study
1. Introduction
Van Etten Lake’s annual blue-green algae bloom indicates
that high levels of nutrients are entering the watershed. A
component of the Pine River/Van Etten Lake Watershed
Project was conducting a comprehensive water quality
study in order to identify these nutrients, their sources and
their respective contributions to the Pine River system and
ultimately Van Etten Lake.
The Steering Committee established a technical
subcommittee who then developed the parameters and
basis for the study and retained an environmental
professional to implement it.
Central Michigan University’s Michigan Water Research Center conducted the eight-month
study from April to November 2002.
2. Methods
Surface water samples were taken at seven stations within the Pine River System throughout the
eight-month period. Additionally, water quality data and samples were also taken at three sites
on Van Etten Lake.
Lake and stream temperature, conductivity, dissolved oxygen and pH levels were taken. Surface
water was analyzed for nitrogen, phosphorus, ammonium and dissolved boron.

Chapter 3: Nonpoint Source Inventories
Pine River-Van Etten Lake Watershed Management Plan 3-10
3. Results
The study revealed an extreme ratio of high levels of phosphorus to low levels of nitrogen within
the lake. It is this nutrient condition that provides excellent growing conditions for blue-green
algae.
The study also indicates that the output levels of dissolved phosphorus are higher in the lake
system than the inputs at the mouth of the Pine River. This indicates that pollutant sources are
being added from around the lake. Suggested sources are groundwater seepage, overland runoff
and or sediment from the bottom of the lake. Septic systems leeching pollutants to the
groundwater can contribute an overabundance of phosphorus. Phosphorus particles attached to
sediment can also be released into the lake. It is noted that if fertilizer were the pollutant source
the ratio would be more balanced.
Tributaries found to be contributing the most dissolved (usable to blue-green algae) phosphorus
within the watershed are Van Etten Creek in Alcona County and the East Branch of the Pine
River. Dissolved phosphorus is generated in animal waste, sewage, and fertilizer. Table 3.1
below describes the results of the different water quality parameters that were measured for
selected streams in the watershed (Van Etten Creek because of the suspected high influence of
agriculture, West Branch Pine River because of lack of agriculture, and Pine River to show
results for lower in the watershed), while Table 3.2 describes the water quality results for Van
Etten Lake. Seasonal averages are for the period of April-September 2002.
Table 3.1: Water Quality Study Results—Pine River and Van Etten Creek
Water Quality
Parameter
Van Etten
Creek
Measurement
West Branch
Pine River
Measurement
Pine River
Measurement Conclusions Drawn
Temperature Average 16.5º C
Average 16.5º C
Average 16.5º C
These temperatures are within the range usable by
trout and other coldwater
fish.
Dissolved Oxygen Average 9.8 mg/L
Average 10.8 mg/L
Average 10.5 mg/L
These DO levels are above the minimum level required
by coldwater fish.
pH Average 8.1
Average 8.3
Average 8.2
Streams in this watershed are moderately basic.
Conductivity Average 574.5 µS/cm
Average 433.0 µS/cm
Average 412.4 µS/cm
These are high concentrations of ions,
particularly in Van Etten
Creek. These ions may be entering the river through
agricultural activity.
Total Dissolved
Solids
Average
365.4 mg/L
Average
282.4 mg/L
Average
252.7 mg/L
These dissolved solid levels
are much higher than in the lake, and Van Etten Creek
is much higher than other
tributaries.
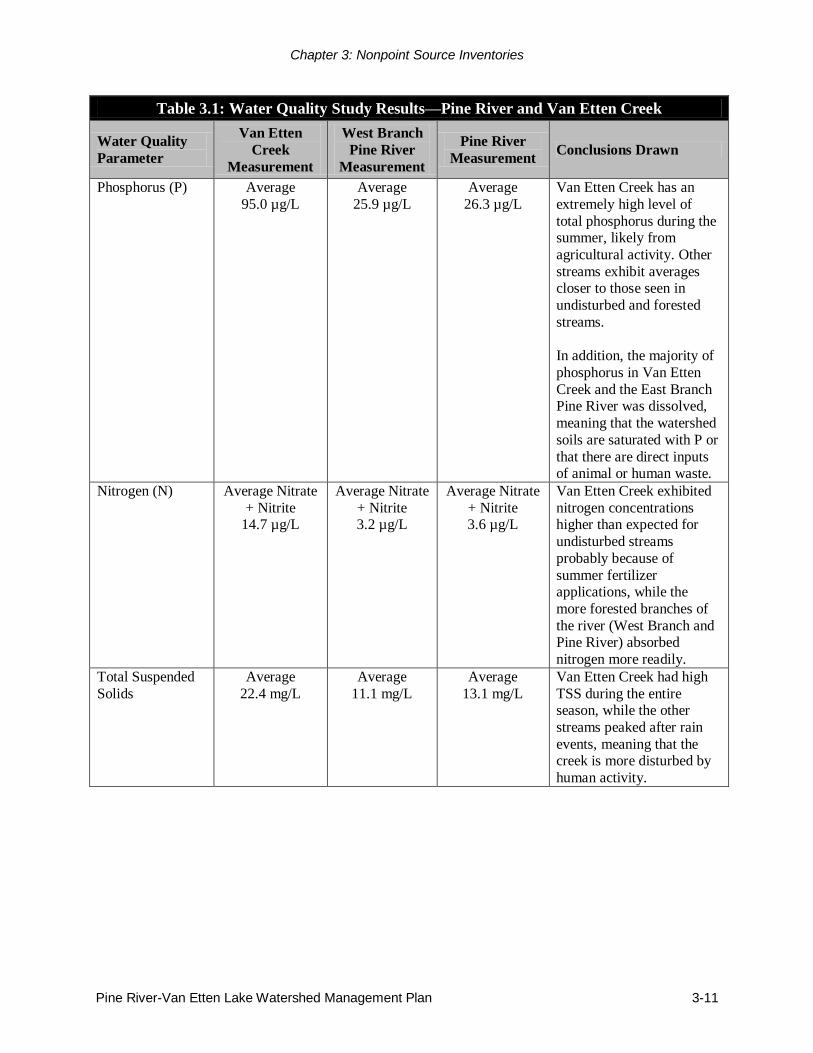
Chapter 3: Nonpoint Source Inventories
Pine River-Van Etten Lake Watershed Management Plan 3-11
Table 3.1: Water Quality Study Results—Pine River and Van Etten Creek
Water Quality
Parameter
Van Etten
Creek
Measurement
West Branch
Pine River
Measurement
Pine River
Measurement Conclusions Drawn
Phosphorus (P) Average
95.0 µg/L
Average
25.9 µg/L
Average
26.3 µg/L
Van Etten Creek has an
extremely high level of
total phosphorus during the summer, likely from
agricultural activity. Other
streams exhibit averages closer to those seen in
undisturbed and forested
streams.
In addition, the majority of
phosphorus in Van Etten
Creek and the East Branch Pine River was dissolved,
meaning that the watershed
soils are saturated with P or
that there are direct inputs of animal or human waste.
Nitrogen (N) Average Nitrate
+ Nitrite 14.7 µg/L
Average Nitrate
+ Nitrite 3.2 µg/L
Average Nitrate
+ Nitrite 3.6 µg/L
Van Etten Creek exhibited
nitrogen concentrations higher than expected for
undisturbed streams
probably because of
summer fertilizer applications, while the
more forested branches of
the river (West Branch and Pine River) absorbed
nitrogen more readily.
Total Suspended
Solids
Average
22.4 mg/L
Average
11.1 mg/L
Average
13.1 mg/L
Van Etten Creek had high
TSS during the entire season, while the other
streams peaked after rain
events, meaning that the creek is more disturbed by
human activity.

Chapter 3: Nonpoint Source Inventories
Pine River-Van Etten Lake Watershed Management Plan 3-12
Table 3.2: Water Quality Study Results—Van Etten Lake Water Quality
Parameter Van Etten Lake Measurement Conclusions Drawn Temperature
Average 19.7º C at surface and deep hole bottom
Van Etten Lake is a warm water lake
Oxygen
Concentration
10.0 ppm at the surface
Van Etten Lake is well-oxygenated,
however measurements at the bottom of the lake during stratification periods
showed low oxygen concentrations. pH
Average 8.0-8.3
Van Etten Lake is moderately basic,
similar to other Michigan Lakes Conductivity
Average 322-342 µS/cm
This is a high concentration of ions.
Total Dissolved
Solids
Average 188-216 mg/L
This is a high concentration of dissolved
solids. Phosphorus (P)
Total P: 27-30 µg/L seasonal surface
average, 38 µg/L average at the deep bottom
Total Dissolved P: 50-60% in June-August
Total P concentrations between 10-35
µg/L mean a lake is mesotrophic. This lake is at the high end of mesotrophic
bordering eutrophic.
Dissolved P is more readily available to algae and bacteria, so a large percentage
can lead to algae blooms like those
experienced on this lake. Nitrogen (N)
Dissolved inorganic nitrogen average
5 µg/L seasonally with spikes up to 11 µg/L in April and June
These low levels may result from actively
growing aquatic plants and the change from mostly nitrate to mostly ammonium
from spring to late summer is common in
undisturbed watersheds as microbes use
nitrate and plants decompose, producing ammonium.
The low ratio of dissolved nitrogen to dissolved phosphorus encourages blue-
green algae blooms, common in eutrophic
lakes. Total Suspended
Solids
4.1-6.0 mg/L seasonal surface
average, 7.8 mg/L at deep bottom
The typical amount in lake systems is less
than 5 mg/L Boron
129-139 µg/L seasonal surface
average, 143 µg/L at deep bottom
High concentrations during dry periods
suggest that the boron is coming from groundwater inputs, most likely from
septic systems (laundry detergent use)
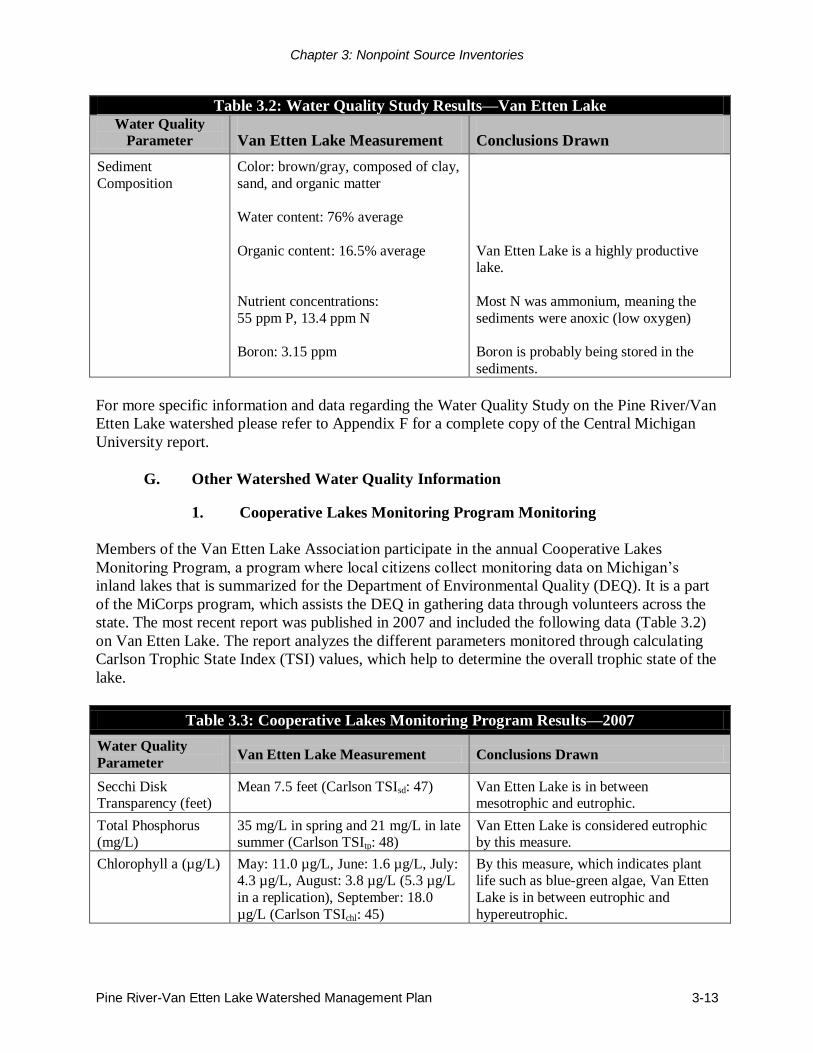
Chapter 3: Nonpoint Source Inventories
Pine River-Van Etten Lake Watershed Management Plan 3-13
Table 3.2: Water Quality Study Results—Van Etten Lake
Water Quality
Parameter Van Etten Lake Measurement Conclusions Drawn Sediment
Composition
Color: brown/gray, composed of clay,
sand, and organic matter
Water content: 76% average
Organic content: 16.5% average
Nutrient concentrations:
55 ppm P, 13.4 ppm N
Boron: 3.15 ppm
Van Etten Lake is a highly productive lake.
Most N was ammonium, meaning the
sediments were anoxic (low oxygen)
Boron is probably being stored in the
sediments.
For more specific information and data regarding the Water Quality Study on the Pine River/Van
Etten Lake watershed please refer to Appendix F for a complete copy of the Central Michigan
University report.
G. Other Watershed Water Quality Information
1. Cooperative Lakes Monitoring Program Monitoring
Members of the Van Etten Lake Association participate in the annual Cooperative Lakes
Monitoring Program, a program where local citizens collect monitoring data on Michigan’s
inland lakes that is summarized for the Department of Environmental Quality (DEQ). It is a part
of the MiCorps program, which assists the DEQ in gathering data through volunteers across the
state. The most recent report was published in 2007 and included the following data (Table 3.2)
on Van Etten Lake. The report analyzes the different parameters monitored through calculating
Carlson Trophic State Index (TSI) values, which help to determine the overall trophic state of the
lake.
Table 3.3: Cooperative Lakes Monitoring Program Results—2007
Water Quality
Parameter Van Etten Lake Measurement Conclusions Drawn
Secchi Disk Transparency (feet)
Mean 7.5 feet (Carlson TSIsd: 47)
Van Etten Lake is in between mesotrophic and eutrophic.
Total Phosphorus (mg/L)
35 mg/L in spring and 21 mg/L in late summer (Carlson TSItp: 48)
Van Etten Lake is considered eutrophic by this measure.
Chlorophyll a (µg/L)
May: 11.0 µg/L, June: 1.6 µg/L, July: 4.3 µg/L, August: 3.8 µg/L (5.3 µg/L
in a replication), September: 18.0
µg/L (Carlson TSIchl: 45)
By this measure, which indicates plant life such as blue-green algae, Van Etten
Lake is in between eutrophic and
hypereutrophic.
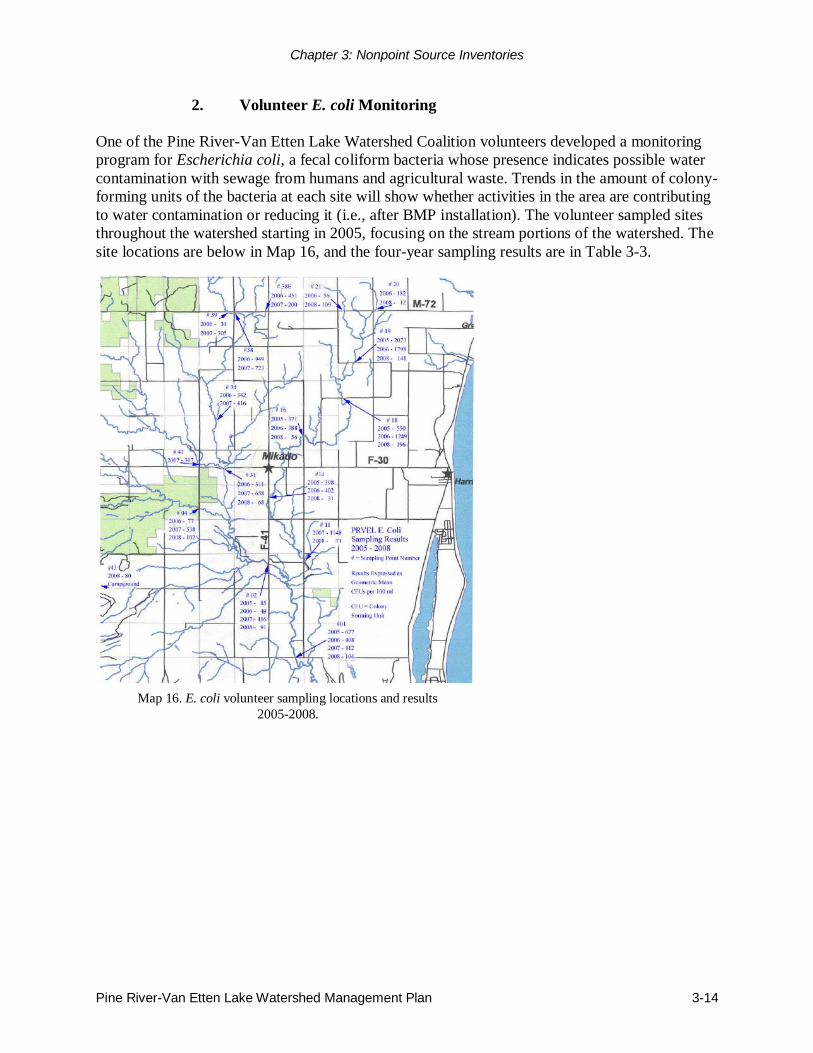
Chapter 3: Nonpoint Source Inventories
Pine River-Van Etten Lake Watershed Management Plan 3-14
2. Volunteer E. coli Monitoring
One of the Pine River-Van Etten Lake Watershed Coalition volunteers developed a monitoring
program for Escherichia coli, a fecal coliform bacteria whose presence indicates possible water
contamination with sewage from humans and agricultural waste. Trends in the amount of colony-
forming units of the bacteria at each site will show whether activities in the area are contributing
to water contamination or reducing it (i.e., after BMP installation). The volunteer sampled sites
throughout the watershed starting in 2005, focusing on the stream portions of the watershed. The
site locations are below in Map 16, and the four-year sampling results are in Table 3-3.
Map 16. E. coli volunteer sampling locations and results
2005-2008.

Chapter 3: Nonpoint Source Inventories
Pine River-Van Etten Lake Watershed Management Plan 3-15
Van Etten Creek and the East Branch of
the Pine River have the sites with the
highest numbers of bacteria, which is
expected since they have the highest
concentration of agriculture in the
watershed. In addition, the site with the
lowest E. coli levels in Van Etten Creek
and the East Branch was at the highest
reach of Van Etten Creek, meaning that
the bacteria is increasing as the water
passes further downstream through
agricultural areas. According to the four-
year results shown on the map, the
numbers of fecal coliform bacteria are
decreasing throughout the watershed,
although this could be because of a change
in media in 2008.
Table 3.4 E. coli volunteer sampling results.
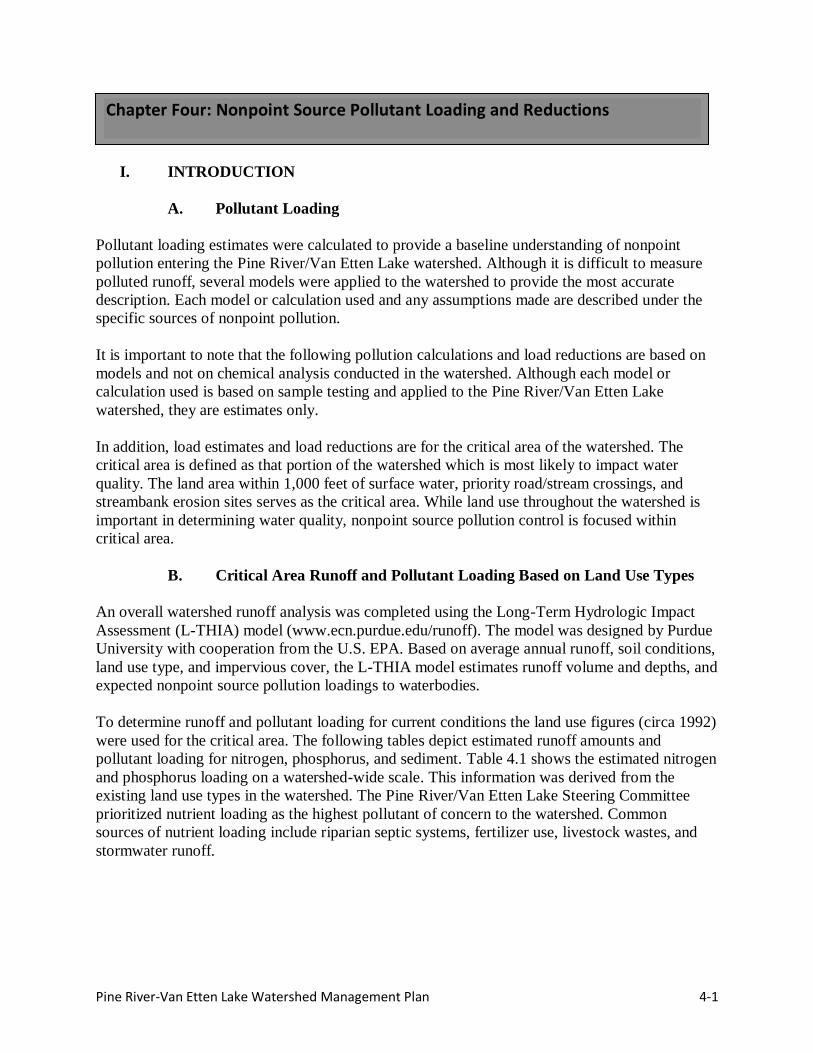
Pine River-Van Etten Lake Watershed Management Plan 4-1
I. INTRODUCTION
A. Pollutant Loading
Pollutant loading estimates were calculated to provide a baseline understanding of nonpoint
pollution entering the Pine River/Van Etten Lake watershed. Although it is difficult to measure
polluted runoff, several models were applied to the watershed to provide the most accurate
description. Each model or calculation used and any assumptions made are described under the
specific sources of nonpoint pollution.
It is important to note that the following pollution calculations and load reductions are based on
models and not on chemical analysis conducted in the watershed. Although each model or
calculation used is based on sample testing and applied to the Pine River/Van Etten Lake
watershed, they are estimates only.
In addition, load estimates and load reductions are for the critical area of the watershed. The
critical area is defined as that portion of the watershed which is most likely to impact water
quality. The land area within 1,000 feet of surface water, priority road/stream crossings, and
streambank erosion sites serves as the critical area. While land use throughout the watershed is
important in determining water quality, nonpoint source pollution control is focused within
critical area.
B. Critical Area Runoff and Pollutant Loading Based on Land Use Types
An overall watershed runoff analysis was completed using the Long-Term Hydrologic Impact
Assessment (L-THIA) model (www.ecn.purdue.edu/runoff). The model was designed by Purdue
University with cooperation from the U.S. EPA. Based on average annual runoff, soil conditions,
land use type, and impervious cover, the L-THIA model estimates runoff volume and depths, and
expected nonpoint source pollution loadings to waterbodies.
To determine runoff and pollutant loading for current conditions the land use figures (circa 1992)
were used for the critical area. The following tables depict estimated runoff amounts and
pollutant loading for nitrogen, phosphorus, and sediment. Table 4.1 shows the estimated nitrogen
and phosphorus loading on a watershed-wide scale. This information was derived from the
existing land use types in the watershed. The Pine River/Van Etten Lake Steering Committee
prioritized nutrient loading as the highest pollutant of concern to the watershed. Common
sources of nutrient loading include riparian septic systems, fertilizer use, livestock wastes, and
stormwater runoff.
Chapter Four: Nonpoint Source Pollutant Loading and Reductions
Watershed
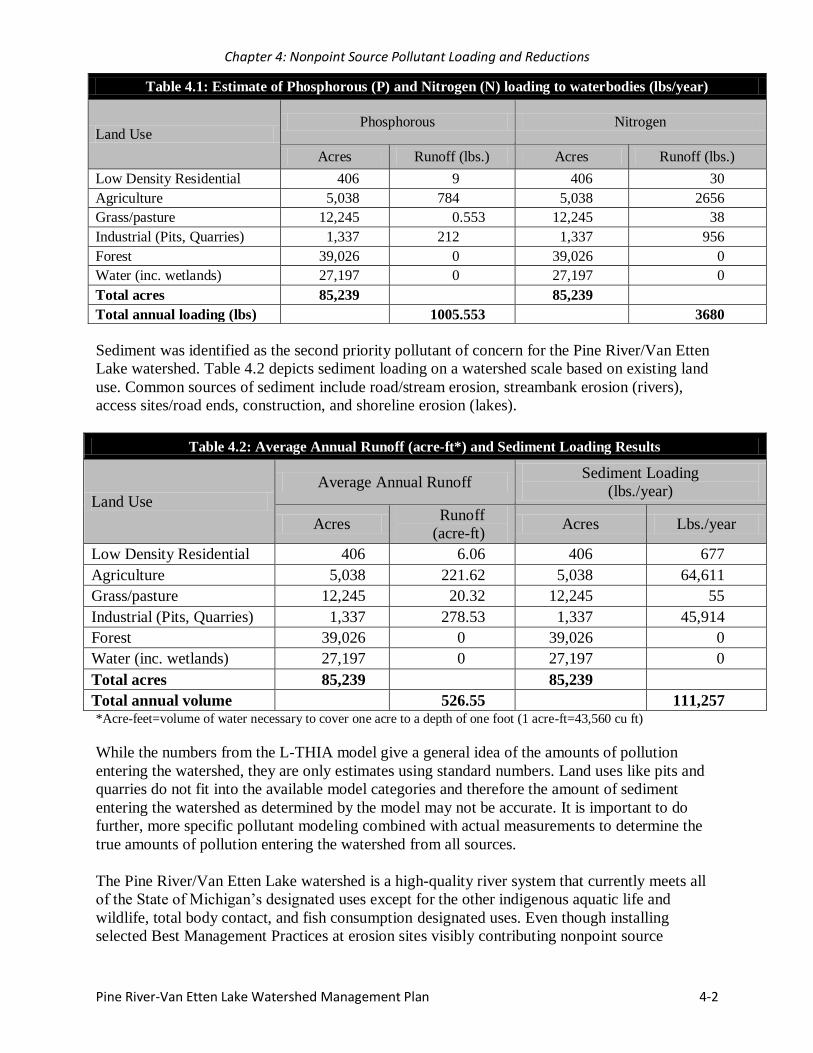
Chapter 4: Nonpoint Source Pollutant Loading and Reductions
Pine River-Van Etten Lake Watershed Management Plan 4-2
Sediment was identified as the second priority pollutant of concern for the Pine River/Van Etten
Lake watershed. Table 4.2 depicts sediment loading on a watershed scale based on existing land
use. Common sources of sediment include road/stream erosion, streambank erosion (rivers),
access sites/road ends, construction, and shoreline erosion (lakes).
Table 4.2: Average Annual Runoff (acre-ft*) and Sediment Loading Results
Land Use
Average Annual Runoff Sediment Loading
(lbs./year)
Acres Runoff
(acre-ft) Acres Lbs./year
Low Density Residential 406 6.06 406 677
Agriculture 5,038 221.62 5,038 64,611
Grass/pasture 12,245 20.32 12,245 55
Industrial (Pits, Quarries) 1,337 278.53 1,337 45,914
Forest 39,026 0.00 39,026 0
Water (inc. wetlands) 27,197 0.00 27,197 0
Total acres 85,239 85,239
Total annual volume 526.55 111,257 *Acre-feet=volume of water necessary to cover one acre to a depth of one foot (1 acre-ft=43,560 cu ft)
While the numbers from the L-THIA model give a general idea of the amounts of pollution
entering the watershed, they are only estimates using standard numbers. Land uses like pits and
quarries do not fit into the available model categories and therefore the amount of sediment
entering the watershed as determined by the model may not be accurate. It is important to do
further, more specific pollutant modeling combined with actual measurements to determine the
true amounts of pollution entering the watershed from all sources.
The Pine River/Van Etten Lake watershed is a high-quality river system that currently meets all
of the State of Michigan’s designated uses except for the other indigenous aquatic life and
wildlife, total body contact, and fish consumption designated uses. Even though installing
selected Best Management Practices at erosion sites visibly contributing nonpoint source
Table 4.1: Estimate of Phosphorous (P) and Nitrogen (N) loading to waterbodies (lbs/year)
Land Use Phosphorous Nitrogen
Acres Runoff (lbs.) Acres Runoff (lbs.)
Low Density Residential 406 9.000 406 30
Agriculture 5,038 784.000 5,038 2656
Grass/pasture 12,245 0.553 12,245 38
Industrial (Pits, Quarries) 1,337 212.000 1,337 956
Forest 39,026 0.000 39,026 0
Water (inc. wetlands) 27,197 0.000 27,197 0
Total acres 85,239 85,239
Total annual loading (lbs) 1005.553 3680

Chapter 4: Nonpoint Source Pollutant Loading and Reductions
Pine River-Van Etten Lake Watershed Management Plan 4-3
pollution will help enhance the watershed and decrease pollution levels, the key to protecting the
watershed will be proactive measures to keep it at the water quality level it currently exhibits.
Increasing development and its associated impervious surfaces and runoff has the potential to
greatly disrupt the system.
Understanding this, community leaders, residents, conservation groups, and other stakeholders
have an opportunity to manage growth in a manner that is beneficial to the community’s needs as
well as protecting their water resources, wildlife habitat, and rural character that are the attraction
for many people who live or recreate in the area.
C. Septic System Effluent
As more development occurs within rural areas that do not have centralized water management
systems, the reliance on on-site wastewater treatment (septic systems) becomes greater. There
also appears to be a greater demand to build vacation and retirement homes along waterbodies or
to convert existing waterfront part-time dwellings to permanent residences. Septic systems can
be very efficient at treating wastewater if they are properly sited, installed correctly, and
maintained regularly. However, the cumulative impact of hundreds or thousands of individual
septic systems within a watershed can lead to increased eutrophication (aging) of the lakes.
Septic systems typically consist of two components: a septic tank designed to intercept and hold
partially treated solids and a drainfield, which disperses wastewater to surrounding soils. Septic
effluent is the substance that passes through the tank to the drainfield and eventually filters
through the soils. The major water quality pollutants from septic effluent are nitrogen and
pathogenic bacteria. Phosphorus is also found in septic effluent but has a tendency to rapidly
adhere to soil particles limiting its ability to move to groundwater or adjacent surface water.
The most common shortcoming of septic systems is their inability to remove significant amounts
of nitrogen. Only 20% of nitrogen that passes through conventional septic systems is effectively
removed, although this number may be influenced by several factors (Siegrist and Janssen, 1989;
Gold et al., 1990). Once in the drainage field, organic nitrogen is easily converted into nitrates,
which are quite soluble and easily mobilized, thus increasing the potential for ground and surface
water contamination (WIDILHR, 1991).
Pathogenic bacteria, parasites, and viruses are also found in septic effluent. Improperly treated
wastewater from septic systems can contain unhealthy concentrations of bacteria and viruses
harmful to many organisms, including humans.
Pollutants not removed by septic systems can migrate into groundwater by leaching through the
soils. Much of the watershed is either excessively drained (sandy soils) which may not have
adequate filtering capacity before pollutants reach ground or surface water; or poorly drained
(clayey soils) soils with restricted permeability resulting in ponding during wet periods, both of
which posing a potential risk for septic effluent to negatively impact water quality. Waterbodies
may also be directly affected if a nearby system fails and the effluent ponds on or just below the
soil surface.
It is difficult to estimate pollutant loading from septic systems. Many factors need to be
considered including soil type, age, condition, use of system, and proximity of system to ground
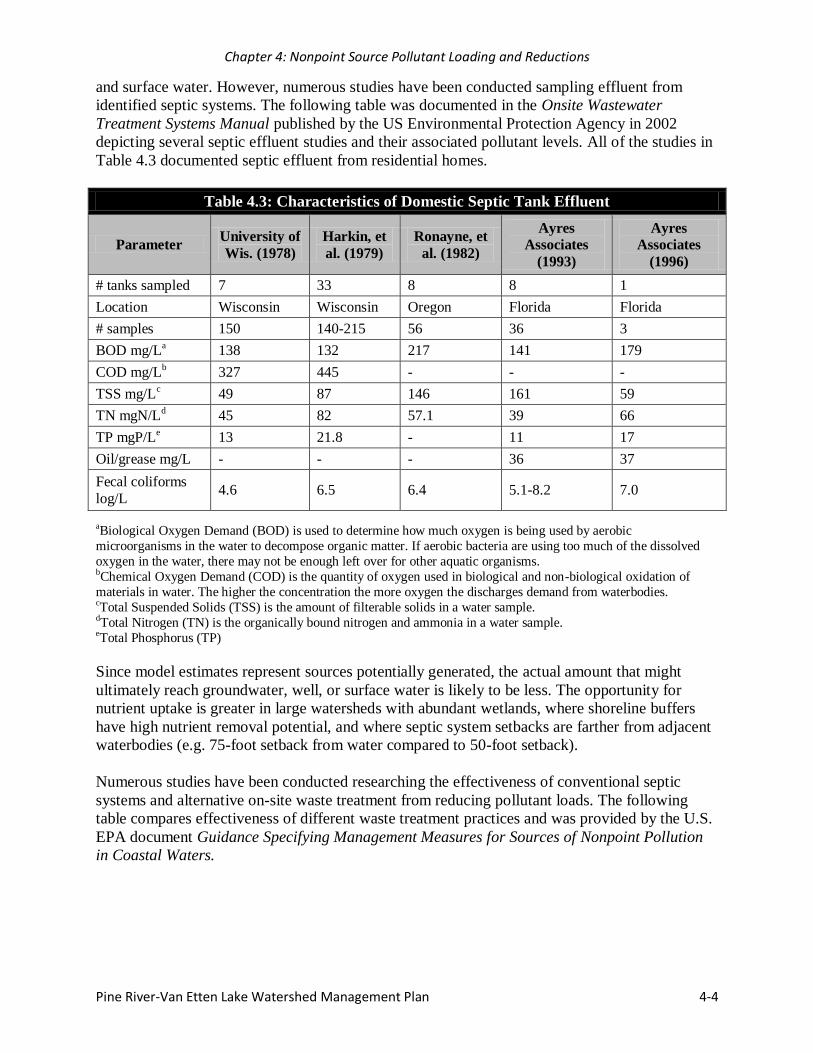
Chapter 4: Nonpoint Source Pollutant Loading and Reductions
Pine River-Van Etten Lake Watershed Management Plan 4-4
and surface water. However, numerous studies have been conducted sampling effluent from
identified septic systems. The following table was documented in the Onsite Wastewater
Treatment Systems Manual published by the US Environmental Protection Agency in 2002
depicting several septic effluent studies and their associated pollutant levels. All of the studies in
Table 4.3 documented septic effluent from residential homes.
Table 4.3: Characteristics of Domestic Septic Tank Effluent
Parameter University of
Wis. (1978)
Harkin, et
al. (1979)
Ronayne, et
al. (1982)
Ayres
Associates
(1993)
Ayres
Associates
(1996)
# tanks sampled 7 33 8 8 1
Location Wisconsin Wisconsin Oregon Florida Florida
# samples 150 140-215 56 36 3
BOD mg/La 138 132 217 141 179
COD mg/Lb 327 445 - - -
TSS mg/Lc 49 87 146 161 59
TN mgN/Ld 45 82 57.1 39 66
TP mgP/Le 13 21.8 - 11 17
Oil/grease mg/L - - - 36 37
Fecal coliforms
log/L 4.6 6.5 6.4 5.1-8.2 7.0
aBiological Oxygen Demand (BOD) is used to determine how much oxygen is being used by aerobic
microorganisms in the water to decompose organic matter. If aerobic bacteria are using too much of the dissolved
oxygen in the water, there may not be enough left over for other aquatic organisms. bChemical Oxygen Demand (COD) is the quantity of oxygen used in biological and non-biological oxidation of
materials in water. The higher the concentration the more oxygen the discharges demand from waterbodies. cTotal Suspended Solids (TSS) is the amount of filterable solids in a water sample. dTotal Nitrogen (TN) is the organically bound nitrogen and ammonia in a water sample. eTotal Phosphorus (TP)
Since model estimates represent sources potentially generated, the actual amount that might
ultimately reach groundwater, well, or surface water is likely to be less. The opportunity for
nutrient uptake is greater in large watersheds with abundant wetlands, where shoreline buffers
have high nutrient removal potential, and where septic system setbacks are farther from adjacent
waterbodies (e.g. 75-foot setback from water compared to 50-foot setback).
Numerous studies have been conducted researching the effectiveness of conventional septic
systems and alternative on-site waste treatment from reducing pollutant loads. The following
table compares effectiveness of different waste treatment practices and was provided by the U.S.
EPA document Guidance Specifying Management Measures for Sources of Nonpoint Pollution
in Coastal Waters.
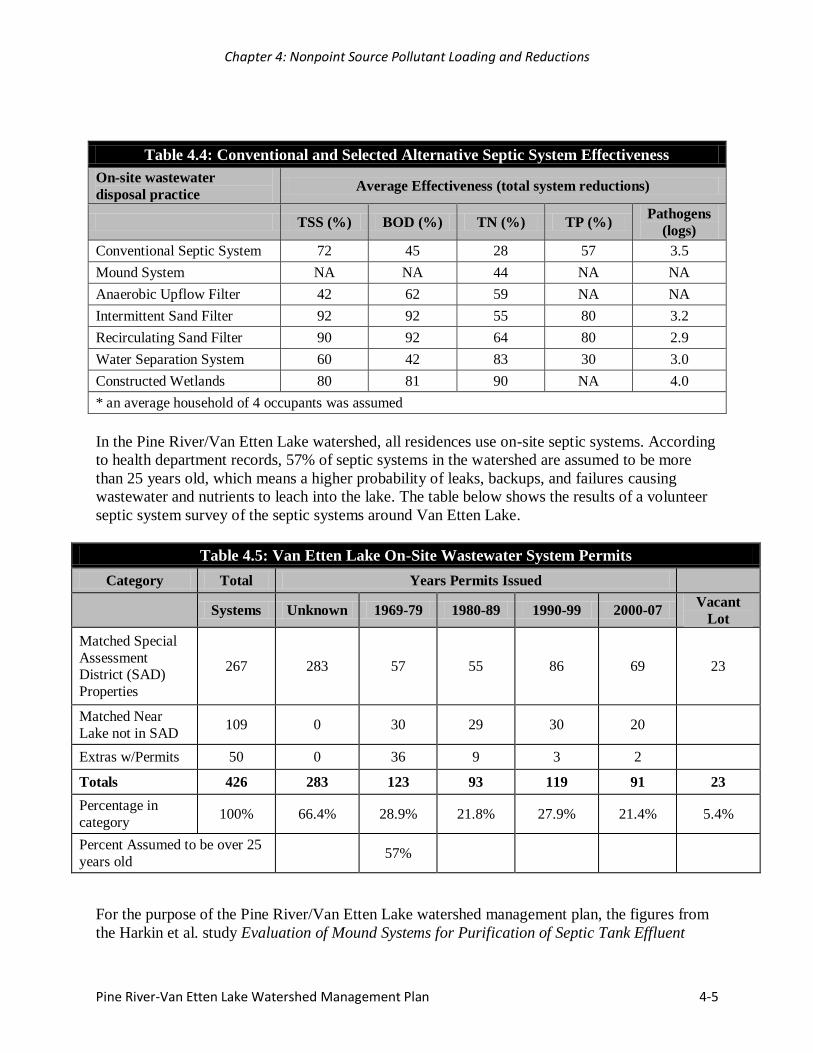
Chapter 4: Nonpoint Source Pollutant Loading and Reductions
Pine River-Van Etten Lake Watershed Management Plan 4-5
Table 4.4: Conventional and Selected Alternative Septic System Effectiveness
On-site wastewater
disposal practice Average Effectiveness (total system reductions)
TSS (%) BOD (%) TN (%) TP (%) Pathogens
(logs)
Conventional Septic System 72 45 28 57 3.5
Mound System NA NA 44 NA NA
Anaerobic Upflow Filter 42 62 59 NA NA
Intermittent Sand Filter 92 92 55 80 3.2
Recirculating Sand Filter 90 92 64 80 2.9
Water Separation System 60 42 83 30 3.0
Constructed Wetlands 80 81 90 NA 4.0
* an average household of 4 occupants was assumed
In the Pine River/Van Etten Lake watershed, all residences use on-site septic systems. According
to health department records, 57% of septic systems in the watershed are assumed to be more
than 25 years old, which means a higher probability of leaks, backups, and failures causing
wastewater and nutrients to leach into the lake. The table below shows the results of a volunteer
septic system survey of the septic systems around Van Etten Lake.
Table 4.5: Van Etten Lake On-Site Wastewater System Permits
Category Total Years Permits Issued
Systems Unknown 1969-79 1980-89 1990-99 2000-07
Vacant
Lot
Matched Special
Assessment District (SAD)
Properties
267 283 57 55 86 69 23
Matched Near
Lake not in SAD 109 0 30 29 30 20
Extras w/Permits 50 0 36 9 3 2
Totals 426 283 123 93 119 91 23
Percentage in
category 100% 66.4% 28.9% 21.8% 27.9% 21.4% 5.4%
Percent Assumed to be over 25
years old 57%
For the purpose of the Pine River/Van Etten Lake watershed management plan, the figures from
the Harkin et al. study Evaluation of Mound Systems for Purification of Septic Tank Effluent

Chapter 4: Nonpoint Source Pollutant Loading and Reductions
Pine River-Van Etten Lake Watershed Management Plan 4-6
were utilized. As documented by the resource inventory 426 septic systems are located within
1,000 feet of Van Etten Lake.
Unfortunately, we were not able to obtain health department records for septic systems located
along the river system. Therefore, we are unable to estimate total watershed pollutant loading
from septic systems. We do know however that all residences within the watershed use an on-site
septic system and based on conditions in northern Michigan it is safe to assume that numerous
systems may be compromised either from sub-standard installation and/or maintenance (placed
too close to waterbodies, not regularly inspected) or are undersized due to conversion from
seasonal use to full-time use. By educating residents about the impacts of old or faulty systems
and encouraging proper maintenance and replacement, the amount of pollution entering the
watershed from septic systems will be greatly reduced.
D. Lawn Care Practices in the Riparian Zone
Lawn care practices by those living along waterbodies can greatly influence the water quality of
the adjacent lake or stream. Maintaining or reestablishing a native vegetative buffer (greenbelt)
along the lake or river provides many benefits to water quality and wildlife habitat. Greenbelts
help prevent shoreline erosion, keep river temperatures cooler, provide important habitat for
aquatic and terrestrial wildlife, help reduce runoff, and filter pollutants before they can reach the
water. The primary nutrient that stimulates excess growth of plants in a lake is phosphorous. One
pound of phosphorous can produce up to 500 pounds of aquatic plant or algae growth once it
washes into a lake (MNDNR, 1999). Common sources of nutrient loading include riparian septic
systems, fertilizer use, livestock wastes, and stormwater runoff.
Results from the shoreline development survey were used to estimate the amount of phosphorus
entering the lakes within the watershed. Estimates were calculated for development along lakes
and do not include phosphorous loading from residential development along the river for two
reasons: phosphorus is typically the pollutant of concern in lake ecosystems and data were not
available for residential development and lot size along the Van Etten Lake shoreline. The total
developed acres for the lake were calculated and adjusted for the assumption that nearly 70% of
riparian landowners fertilize their lawns (Schueler, 2002). This provided the amount of
developed acres receiving fertilizer application.
A study was conducted in Minnesota by Lake Access where six small watersheds were selected
as the study sites. Three of the sites were located in a community where the use of fertilizer that
contained phosphorous was restricted and three were located in a community where there are no
such restrictions. Runoff from each of the study areas flowed to a single outlet pipe and
phosphorous samples were collected there. (There are other sources of phosphorous to aquatic
systems including grass clipping, leaves, and pet waste; however, there are no strong reasons that
these alternate sources differ among the study watersheds.)
The study found that the phosphorous runoff was .22 pounds per acre of land in communities
without fertilizer restrictions, whereas .09 pounds of phosphorous runoff per acre of land was
documented in communities that have phosphorous free fertilizer ordinances. These findings
were applied to the number of developed lake acres within the Van Etten Lake subwatershed to

Chapter 4: Nonpoint Source Pollutant Loading and Reductions
Pine River-Van Etten Lake Watershed Management Plan 4-7
estimate pollutant loading and load reduction if residents used phosphorous-free fertilizers
encouraged through education or forced through ordinances.
In addition, the percent parcels with good greenbelts were also taken into consideration. It is
estimated that a good greenbelt reduces approximately 75% of runoff and associated pollutants
(MDEQ, 1999). A “good” greenbelt is one where minimal vegetation has been removed along
the shoreline providing a buffer between homes or other development and the adjacent
waterbody.
The following is a description of how pollutant loading from fertilizer use was calculated using
shoreline inventory data and phosphorous loading information provided by Lake Access.
Fertilized acres = Developed shoreline 50 feet (depth) 70% (residents that fertilize)
Phosphorous loading = Fertilized acres .22 (P loading) or .09 (P reduction)
P loading: no greenbelt = Phosphorous loading % of no greenbelt
P loading good greenbelt = Phosphorous loading % good greenbelt .25 (adj. for greenbelt
filter capacity)
Total phosphorous loading = P loading no greenbelt + P loading good greenbelt
Table 4.6 estimates pollutant loading from riparian fertilizer use along with the estimated
phosphorous loading if phosphorous free fertilizer is applied in place of conventional fertilizers.
Table 4.6: Phosphorous Loading from Riparian Fertilizer Use (lbs/year)
Developed
Shoreline (miles)
Fertilized
acres
P loading: no
greenbelt
(lb/ac)
P loading: good
greenbelt (lb/ac)
Total
phosphorous
(lb/ac)
Regular residential
fertilizer use
10.1 42.86 8.67 .189 8.86
Residential
use- No
Phosphorus Fertilizer
10.1 42.86 3.548 .077 3.63
Total reduction 5.23
The estimated total phosphorous loading with no restrictions or voluntary use of p-free fertilizer
is 8.86 pounds per year. The estimated total phosphorous loading using P-free fertilizer is 3.63
pounds per year, a load reduction of 5.23 pounds of phosphorous per year (59% reduction).

Chapter 4: Nonpoint Source Pollutant Loading and Reductions
Pine River-Van Etten Lake Watershed Management Plan 4-8
E. Road/Stream Crossing Pollutant Loading and Reduction Estimates
1. Inventory Sites
One hundred eighty-nine road/stream crossing sites were located within the PRVEL Watershed.
The crossings ranged in size from a bridge over one hundred feet long to culverts twelve inches
in diameter. The majority of the crossings were on unpaved roads with one or multiple culverts
controlling the water flow under the road.
2. Road/Stream Crossing Pollutant Loading
Total sediment loading was calculated for each road/stream crossing site inventoried within the
watershed. Two equations were used to calculate sediment loading. First, the Revised Universal
Soil Loss Equation (RUSLE) was used to calculate sediment discharge in tons per year and cubic
yards per year for each approach.
A = R K LS C P
A = average annual soil loss in tons/acre
R = rainfall-runoff erosivity factor
K = soil erodibility factor
LS = slope factor
C = cover management factor
P = support practice factor
For this application we used a cover management value of 1 for unpaved roads and a value of .12
for paved roads. The second method, Lateral Recession Rate (LRR), was used in an attempt to
assess the amount of soil loss occurring at each embankment.
LRR = Height Width Erosion Severity
The following values were used for erosion severity: Slight = .02, Moderate = .14, Severe = .4,
and Very Severe = .5. The total from each equation was added together for a total sediment
loading estimate per site.
Estimated sediment loading for road/stream crossings is 307 tons per year.
In addition to sediment loading, phosphorus and nitrogen loading were calculated. High amounts
of nutrients in a waterbody accelerate vegetation and algae growth thus contributing to
eutrophication of surrounding lakes.
The amount of phosphorus and nitrogen attached to sediment was calculated using information
collected by USDA-ARS researchers. The estimate starts with an overall phosphorus
concentration of 0.0005 lbP/lb of soil and a nitrogen concentration of 0.001 lbN/lb of soil. Soil
texture is determined and a correction factor is used to better estimate nutrient holding capacity
of the soil (MDEQ, 1999). Sand is the dominant soil texture for the PRVEL Watershed, thus a
correction factor of 0.85 was used.
Chapter 4: Nonpoint Source Pollutant Loading and Reductions
Pine River-Van Etten Lake Watershed Management Plan 4-9
Road/stream crossing phosphorus load estimate:
307 tons/yr * 0.0005 lbP/lb soil * 2000 lb/ton * 0.85= 261 pounds of phosphorous per year
Road/stream crossing nitrogen load estimate:
307 tons/yr * 0.0001 lbN/lb soil * 2000 lb/ton * 0.85= 522 pounds of nitrogen per year
3. Road/Stream Crossing Pollutant Load Reductions
a. Priority Sites
A total of nine sites were identified as priorities for future Best Management Practices (BMPs)
installation and improvement projects. The sites were chosen based on their sediment discharge
and their impact on coldwater fisheries. The suggested BMPs are based on the site inventories
and source of nonpoint pollution. Improvement to 5% of the road/stream sites will result in 40%
reduction of sediment loading to the watershed.
When implementing road/stream BMP’s, priority will be given to those sites listed in Table 4.7
because they are contributing significant amounts of sediment to the river system. Although all
of these sites ranked high, additional factors were considered while choosing these sites such as
the type of crossing and feasibility of implementing BMPs. Other factors may be considered
including the amount and availability of funding, location in the watershed, and partner
involvement. These factors may contribute to the selection to a site other than those sites listed
below.
b. Sediment Reduction
The load reduction estimates were made using the same approach for both road stream crossings
and streambank estimates for the embankments. A value of.75 was used in the Load Reduction
Estimate Spreadsheet (MDEQ, 1999) for the BMP efficiency. Vegetative buffers remove 75% of
sediment and this application closely resembles the suggested BMPs for each site.
The load reduction for the approach work was calculated using the RUSLE. The value for the
cover management factor for unpaved roads is 1. The suggested BMP is to pave both approaches
lowering the cover management factor to.12.

Chapter 4: Nonpoint Source Pollutant Loading and Reductions
Pine River-Van Etten Lake Watershed Management Plan 4-10
Table: 4.7 Sediment Load Reduction for Selected Road/Stream Crossing Sites
Site
ID Justification Suggested BMP’s
Current
Loading
tons/year
Estimated
Load
Reduction
tons/year
Estimated
Cost
49
Pool formation at culvert
outlet Poorly aligned culvert
Replace and realign: elliptical
Harden approaches Revegetate
85’x4’
1981’ 600 sq ft
19.45 17.12 $41,312
80
Embankment erosion Poor culvert alignment
Sand/soil over crossing
Replace culvert: timber bridge
Harden approaches
Add rock riprap Revegetate
25’
530’
5 cu yds 200 sq ft
13.93 12.26 $139,177
87
Streambank erosion
Pool formation at culvert
outlet Undersize culvert
Replace culvert: timber bridge
Harden approaches
Add rock riprap Revegetate
25’
686’
5 cu yds 200 sq ft
2.84 2.5 $139,084
100
Embankment erosion
Pool formation at culvert outlet
Sand/soil over crossing
Deteriorating road
Replace culvert: bottomless arch
Harden approaches
Add rock riprap
Revegetate
49’x10’
370’
5 cu yds
800 sq ft
2.69 2.37 $30,122
104
Embankment erosion
Sand/soil over crossing
Damaged culverts
Replace culvert: bottomless arch Harden approaches
Add rock riprap
Install diversion outlets Revegetate
35’x12’ 1,028’
5 cu yds
3 500 sq ft
11.38 10.01 $32,364
113
Sand/soil over crossing
Long steep approaches
Undersize culverts
Replace culvert: bottomless arch
Harden approaches
Revegetate
52’x15’
657’
800 sq ft
5.07 4.46 $36,530
136
Embankment erosion
Pool formation at culvert outlet
Long steep approaches
Replace culvert: timber bridge
Harden approaches
Add rock riprap
Install diversion outlets Revegetate
25’
1083’
8 cu yds
2 300 sq ft
17.19 15.13 $148,986
144
Embankment erosion
Streambank erosion Pool formation at culvert
outlet
Fish passage issue
Cattle in stream
Replace culvert: bottomless arch
Harden approaches
Add rock riprap
Install diversion outlets Revegetate
45’x12’
1,233’
5 cu yds
2 800 sq ft
32.01 28.17 $39,670
157
Embankment erosion
Sand/soil over crossing Long steep approaches
Replace culvert: timber bridge
Harden approaches
Add rock riprap Install sediment basins
Revegetate
35’
1,058’
8 cu yds 2
400 sq ft
35.5 31.24 $149,131
Totals
Replace culverts
Install timber bridges
Install diversion outlets
Install sediment basins
Harden approaches
Revegetation
5
4
7
2
8,626’
4,600 sq ft
140.06 123.26 $756,376
Chapter 4: Nonpoint Source Pollutant Loading and Reductions
Pine River-Van Etten Lake Watershed Management Plan 4-11
F. Streambank Erosion Pollutant Loading and Reduction Estimates
1. Inventory Sites
There were a total of 36 streambank erosion sites identified in the original inventory. All of the
site inventories provided data to be used in the pollution loading calculations. Of the inventoried
erosion sites, six were ranked severe. Those six were revisited, to assess any change that may
have occurred.
Three of the erosions sites were caused by only “natural” activities such as bends in the river and
bank seepage. The other three severe erosion sites were influenced by human activities in
addition to the effects of natural features—all are on the outside bend in the river. The human
activities aggravating the erosion are varying degrees of foot traffic to the river.
2. Streambank Pollutant Loading
The Lateral Recession Rate (LRR) was used to estimate the amount of sediment loading on
identified streambank erosion sites. The following formula was used:
LRR = Height Width Erosion Severity
The following values were used for erosion severity: Slight = .02, Moderate = .14, Severe =
.4, and Very Severe = .5.
The estimated sediment loading for streambank erosion is 1043 tons per year
The same calculations for estimating road stream nutrients were also applied to streambank
nutrient loading.
Streambank phosphorus load estimate:
1043 tons/yr 0.0005 lbP/lb soil 2000 lb/ton 0.85 = 1774 pounds phosphorus per year
Streambank nitrogen load estimate:
1043 tons/yr 0.001 lbN/lb soil 2000 lb/ton 0.85 = 887 pounds of nitrogen per year
3. Streambank Pollutant Load Reductions
a. Priority Sites
Load reductions were calculated for the four most severe sites. Best Management Practices were
identified for each site reflecting the source and cause of sediment. Improvement to these four
severe sites, or 11% of the eroding streambanks, will address 55%, or 577 tons, of the sediment
load.
When implementing streambank BMPs, priority will be given to the sites listed in Table 4.8
because they are contributing the majority of sediment to the river. However, other factors
including landowner willingness, availability of funding, site location and accessibility, and
partner involvement may contribute to the selection of installing BMPs at erosion sites not listed
below.
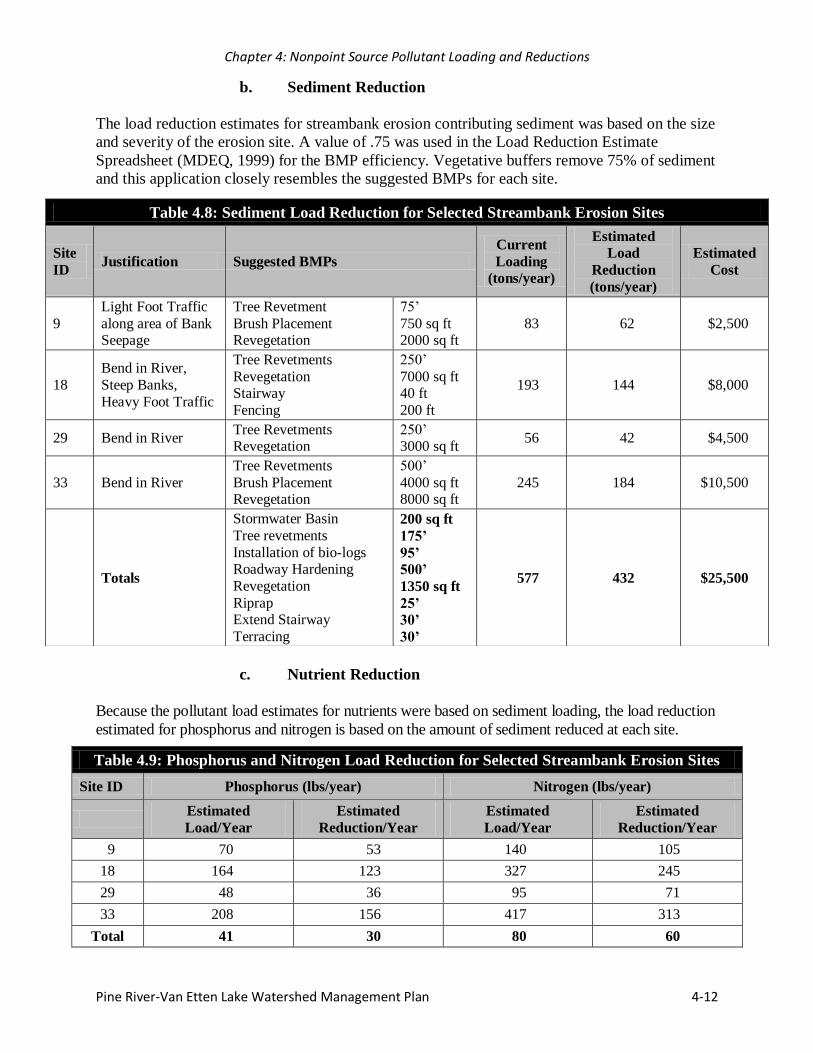
Chapter 4: Nonpoint Source Pollutant Loading and Reductions
Pine River-Van Etten Lake Watershed Management Plan 4-12
b. Sediment Reduction
The load reduction estimates for streambank erosion contributing sediment was based on the size
and severity of the erosion site. A value of .75 was used in the Load Reduction Estimate
Spreadsheet (MDEQ, 1999) for the BMP efficiency. Vegetative buffers remove 75% of sediment
and this application closely resembles the suggested BMPs for each site.
c. Nutrient Reduction
Because the pollutant load estimates for nutrients were based on sediment loading, the load reduction
estimated for phosphorus and nitrogen is based on the amount of sediment reduced at each site.
Table 4.9: Phosphorus and Nitrogen Load Reduction for Selected Streambank Erosion Sites
Site ID Phosphorus (lbs/year) Nitrogen (lbs/year)
Estimated
Load/Year
Estimated
Reduction/Year
Estimated
Load/Year
Estimated
Reduction/Year
9 70 53 140 105
18 164 123 327 245
29 48 36 95 71
33 208 156 417 313
Total 41 30 80 60
Table 4.8: Sediment Load Reduction for Selected Streambank Erosion Sites
Site
ID Justification Suggested BMPs
Current
Loading
(tons/year)
Estimated
Load
Reduction
(tons/year)
Estimated
Cost
9
Light Foot Traffic
along area of Bank Seepage
Tree Revetment
Brush Placement Revegetation
75’
750 sq ft 2000 sq ft
83 62 $2,500
18
Bend in River,
Steep Banks,
Heavy Foot Traffic
Tree Revetments
Revegetation Stairway
Fencing
250’
7000 sq ft 40 ft
200 ft
193 144 $8,000
29 Bend in River Tree Revetments Revegetation
250’ 3000 sq ft
56 42 $4,500
33 Bend in River
Tree Revetments
Brush Placement Revegetation
500’
4000 sq ft 8000 sq ft
245 184 $10,500
Totals
Stormwater Basin
Tree revetments
Installation of bio-logs Roadway Hardening
Revegetation
Riprap Extend Stairway
Terracing
200 sq ft
175’
95’
500’
1350 sq ft
25’
30’
30’
577 432 $25,500
Chapter 4: Nonpoint Source Pollutant Loading and Reductions
Pine River-Van Etten Lake Watershed Management Plan 4-13
G. Agriculture Pollutant Loading and Reduction Estimates
1. Pollutant Loading
The most comprehensive method for determining the amount of pollution entering the watershed
from all agriculture as opposed to the few sites represented in the 2002 inventory is to use GIS.
Sorting the results of the GIS agriculture analysis shows that there are distinct reaches of stream
that rank as higher priority sites of pollution entering streams. These stream reaches, based on
length, run a higher risk of impact from agriculture due to the greater exposure to agriculture, in
terms of distance. When analyzing the length data for each file, logical breaks in the distribution
of length of stream reaches became evident. For the row crop layer, the six longest reaches
totaled 1.64 miles (8679.71 ft), or 20.76% of the total amount of stream running through row
crops. In terms of the pasture/hay land use, the longest four reaches of stream were found to
accomplish 20% coverage of streams affected by pasture/hay. Those four stream reaches total
2.52 miles (13314.92 ft) to represent 22.28% of streams traveling through pasture/hay.
Using the 1,000 ft buffer as a means to determine the level of impact on the stream by these two
agricultural land uses lends a strategy to calculate pollutant loading and potential reduction of
nonpoint pollution sources in the watershed. Calculating the amount of sediment and nutrients
from the acreage of farmland adjacent to the ten stream reaches identified above was done using
the Long-Term Hydrologic Impact Assessment (L-THIA) model (www.ecn.purdue.edu/runoff).
Within the 1,000 ft buffer, there are 398.49 acres of row crops through which the 6 longest
segments of stream run. The potential input of sediment and nutrients along those 6 reaches,
based on the L-THIA model and assuming there are no BMPs in existence, is 5,110 lbs of
sediment, 210 lbs of N, and 62 lbs of P. The four longest segments of stream running through
pasture/hay are bordered by 611.34 acres of that land use. The potential input of nonpoint source
pollution to the streams from that acreage of pasture/hay is 2 lbs of sediment, 1 lb of N, and
0.027 lbs of P. The low amounts of potential sediment and nutrient loads are under the auspice
that there are no cattle pastured on this land use within the L-THIA model. Overlaying the GPS
locations of known cattle operations in the watershed shows that many are located on lands
classified as pasture/hay. Therefore, caution needs to be used when proceeding with values set
forth in the above calculations.
One site from the original inventory of active farms provides the best opportunity to begin the
further investigation of possible BMP installation needs. That farm, found downstream of the
outlet of Sprinkler Lake, can be seen from the road where Adams Rd. crosses the stream. That
farm has direct access for the cattle to the stream as a watering source. This farm would be a
good starting point for working with the agricultural community to reduce nonpoint pollution to
the stream.
2. Load Reductions
Using the GIS methodology set forth above provides a result that should be used to guide the
next level of investigation. When approaching residents of the agricultural community, the
landowners that are in the proximity of the six longest reaches of stream flowing through row
crops should be approached with a list of BMP recommendations. With the assumption that the
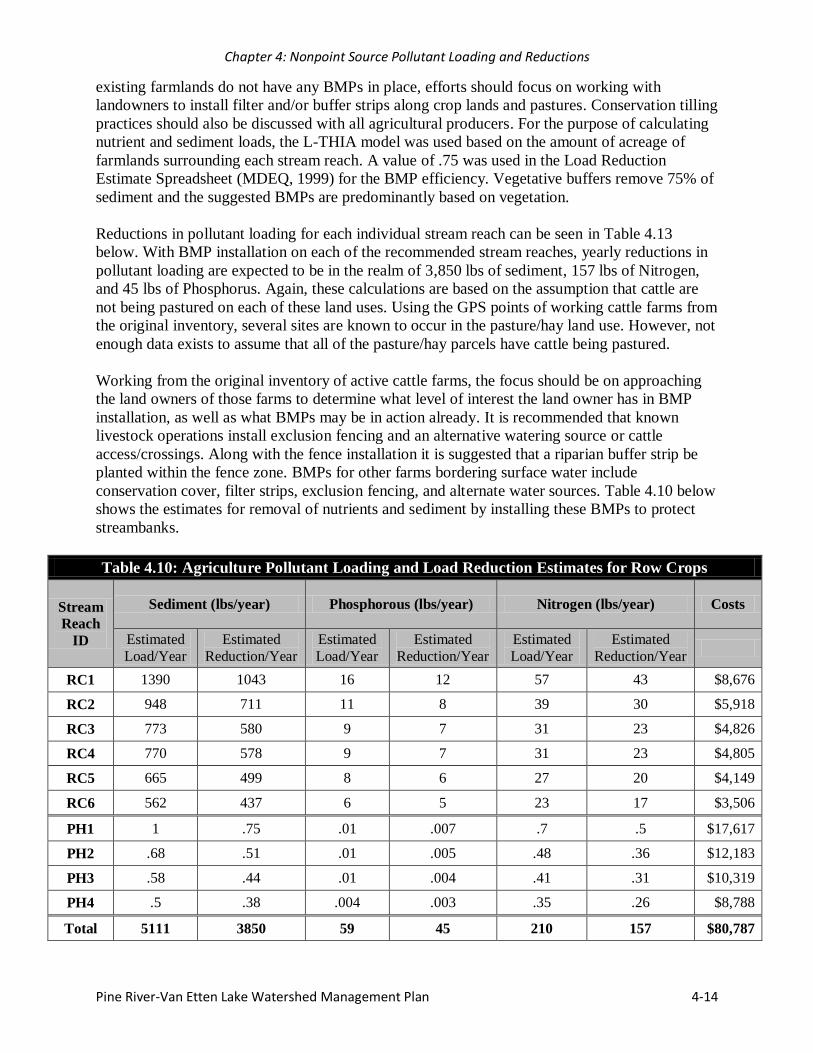
Chapter 4: Nonpoint Source Pollutant Loading and Reductions
Pine River-Van Etten Lake Watershed Management Plan 4-14
existing farmlands do not have any BMPs in place, efforts should focus on working with
landowners to install filter and/or buffer strips along crop lands and pastures. Conservation tilling
practices should also be discussed with all agricultural producers. For the purpose of calculating
nutrient and sediment loads, the L-THIA model was used based on the amount of acreage of
farmlands surrounding each stream reach. A value of .75 was used in the Load Reduction
Estimate Spreadsheet (MDEQ, 1999) for the BMP efficiency. Vegetative buffers remove 75% of
sediment and the suggested BMPs are predominantly based on vegetation.
Reductions in pollutant loading for each individual stream reach can be seen in Table 4.13
below. With BMP installation on each of the recommended stream reaches, yearly reductions in
pollutant loading are expected to be in the realm of 3,850 lbs of sediment, 157 lbs of Nitrogen,
and 45 lbs of Phosphorus. Again, these calculations are based on the assumption that cattle are
not being pastured on each of these land uses. Using the GPS points of working cattle farms from
the original inventory, several sites are known to occur in the pasture/hay land use. However, not
enough data exists to assume that all of the pasture/hay parcels have cattle being pastured.
Working from the original inventory of active cattle farms, the focus should be on approaching
the land owners of those farms to determine what level of interest the land owner has in BMP
installation, as well as what BMPs may be in action already. It is recommended that known
livestock operations install exclusion fencing and an alternative watering source or cattle
access/crossings. Along with the fence installation it is suggested that a riparian buffer strip be
planted within the fence zone. BMPs for other farms bordering surface water include
conservation cover, filter strips, exclusion fencing, and alternate water sources. Table 4.10 below
shows the estimates for removal of nutrients and sediment by installing these BMPs to protect
streambanks.
Table 4.10: Agriculture Pollutant Loading and Load Reduction Estimates for Row Crops
Stream
Reach
ID
Sediment (lbs/year) Phosphorous (lbs/year) Nitrogen (lbs/year) Costs
Estimated
Load/Year
Estimated
Reduction/Year
Estimated
Load/Year
Estimated
Reduction/Year
Estimated
Load/Year
Estimated
Reduction/Year
RC1 1390 1043 16 12 57 43 $8,676
RC2 948 711 11 8 39 30 $5,918
RC3 773 580 9 7 31 23 $4,826
RC4 770 578 9 7 31 23 $4,805
RC5 665 499 8 6 27 20 $4,149
RC6 562 437 6 5 23 17 $3,506
PH1 1 .75 .01 .007 .7 .5 $17,617
PH2 .68 .51 .01 .005 .48 .36 $12,183
PH3 .58 .44 .01 .004 .41 .31 $10,319
PH4 .5 .38 .004 .003 .35 .26 $8,788
Total 5111 3850 59 45 210 157 $80,787

Chapter 4: Nonpoint Source Pollutant Loading and Reductions
Pine River-Van Etten Lake Watershed Management Plan 4-15
H. Total Watershed Pollutant Loading and Reduction Estimates
The following table is a summary of the pollutant loading and reduction results in the preceding
sections of this chapter. Comparing the L-THIA model to the RUSLE and BMP calculations for
the inventories provides significantly different numbers for pollutant loading. The amounts of
sediment and phosphorus being added to the watershed are lower in the L-THIA model, while
the amount of nitrogen entering the watershed is much higher in that model than the other
calculations. While the actual reasons that the models are different are unknown, it appears that
the road/stream crossing and streambank erosion sites are adding much more sediment than a
general model would suggest. Treating the most severe sites of each type would prevent large
amounts of pollution from entering the system. In addition, treating severe streambank erosion
sites first would remove a greater percentage of pollutants from the system than any other
treatment. Using these models to help prioritize the sources of pollution to the watershed
informed the goals and objectives of this watershed plan, contained in Chapter 5.
Table 4.11: Total Watershed Pollutant Loading and Reduction Estimates
Pollution
Source Sediment (lbs/year) Phosphorous (lbs/year) Nitrogen (lbs/year)
Estimated
Load/Year
Estimated
Reduction/Year
Estimated
Load/Year
Estimated
Reduction/Year
Estimated
Load/Year
Estimated
Reduction/Year
All Watershed
(L-THIA) 111,257 1,005.553 3,680
Lawn Care
Practices 8.860 5.23
Road/Stream
Crossings 614,000 460,500 261.000 195.75 522 391.5o
Streambank
Erosion Sites 2,086,000 1,564,500 1,774.000 1,330.50 887 665.25
Agriculture 5,111 3,850 59.000 45.00 210 157.00
Total 2,705,111 2,028,850 2,102.860 1,576.48 1,619 1,213.75

Pine River-Van Etten Lake Watershed Management Plan 5-1
I. INTRODUCTION
A. Implementation
The goals for the Pine River-Van Etten Lake watershed were developed by the Steering
Committee to protect the designated and desired uses of the watershed. The goals are
recommendations for implementation efforts within the watershed. Each goal has multiple
objectives that outline how the goal can be reached. Tasks were identified for each objective
indicating steps needed to reach the objective. Implementing most objectives requires a
combination of four types of activities, each with associated tasks. These include:
1. Implementing Best Management Practices (BMPs), 2. Reviewing and modifying existing
projects, programs and ordinances, 3. Designating and implementing education and information
activities, and 4. Evaluating the effectiveness of planned activities.
For each objective the Steering Committee has identified the subwatersheds for which the goal is
a priority, the organizations that are best suited to implement the tasks, an estimated timeline for
completion, estimated costs for implementation, and signs of success to evaluate the status of
implementation efforts. This information is found in subsection C. Goals and Objectives.
B. Priority Method
Prioritization of the goals for the Pine River-Van Etten Lake watershed was completed by the
Steering Committee. Each Steering Committee member present for the June 2002 meeting was
given the opportunity to vote on chart-sized listings of the goals. Each member was given
priority stickers to post on the charts to record their preference for the identified goals. The votes
were tallied and the goals prioritized based upon the final count for each. In 2008, the goals were
revisited by the Steering Committee and updated to include more information and current status
reports. These are the goals and objectives for the Pine River-Van Etten Lake watershed
generated and prioritized by the Steering Committee:
Chapter Five: Goals and Objectives

Chapter 5: Goals and Objectives
Pine River-Van Etten Lake Watershed Management Plan 5-2
C. Goals and Objectives
1. Project Goals
Each project goal addresses an overall improvement in the watershed and contains objectives
with specific tasks and details as organized below. The milestones for each objective are set on a
10-year implementation schedule, which will begin once funding to achieve each objective is
obtained. The goals for the Pine River-Van Etten Lake watershed are
Goal 1: Improve and protect the coldwater fishery of Pine River and its tributaries.
Goal 2: Ensure that the total/partial body contact designated use for Van Etten Lake is
met.
Goal 3: Restore Van Etten Creek of Alcona County to levels that will ensure it is removed
from the State's non-attainment list.
Goal 4: Improve and protect the aquatic habitat within the watershed.
Goal 5: Protect critical wildlife habitat areas within the watershed.
Goal 6: Sustain the Pine River-Van Etten Lake Watershed Management Process.
2. Objectives
Under each objective are the following categories:
Milestones needed to execute this strategy: Sub-tasks to ensure the overall strategy is
being implemented (signs of success)
Task Products: General water quality goals for objective Typical System of BMPs: BMPs that may be used to accomplish the water quality benefits
Water Quality Benefits: Load reductions or other water quality or habitat benefits
Evaluation Methods: Methods to determine if the tasks are being implemented and
whether they are effective at reducing nonpoint pollution
Lead Organization(s) for ensuring this project is implemented: Group(s) responsible
for each strategy
Technical assistance: Support from experts other than the lead organization needed to
properly implement the strategy
Timeline: Number of years needed to complete the strategy (overall total is 10 years for
the management plan)
Cost: Funding needed to implement each strategy
Funding Sources: The partners, programs, foundations, and grants where funding might
be sought
Level of Effort: Specific details related to successfully initiating each strategy
Priority: Level of importance given to each strategy
2008 status: Review of projects completed during 2006–2008

Chapter 5: Goals and Objectives
Pine River-Van Etten Lake Watershed Management Plan 5-3
Goal 1: Improve and protect the coldwater fishery of Pine River and its tributaries.
Subwatershed: Pine River, Van Etten Creek
Objective 1.1: Reduce sediment at the 9 priority road/stream crossings that have been ranked
as severe.
Milestones:
Conduct analysis of sites (including stream geomorphology) for appropriate treatment
and develop engineering designs by year one.
Stabilize eroding road/stream crossings needing culvert replacement or culvert
extensions by implementing BMPs by years two through five.
Conduct post-BMP stream geomorphology survey at each site in years two through
five.
Task Products: Completion of BMP installation at the nine priority eroding road/stream
crossings as specified in chapter 4 (2,800 sq feet of revegetation, 31 cubic yards of
rock riprap, 2 sediment basins, 7 diversion outlets, 6,383 linear feet of pavement, 5
culvert replacements).
Typical System of BMPs: Replace culverts with single span bridge or new culverts or
extend culverts. Then reshape and vegetate side slopes, install water turnouts with
stabilized outlets, rock at abutment. Some paving of approaches; some detention or
infiltration for treatment of runoff may be necessary.
Water Quality Benefits: Reduction of sediment and nutrients entering the watershed
from these sites by 75%.
Evaluation Methods: Before and after photos, stream geomorphology assessment,
calculate BMP load reduction
Lead Organization: Huron Pines
Partners: Alcona and Iosco Road Commissions, USDA Forest Service, Natural
Resources Conservation Service
Technical Assistance: Engineering services
Timeline: 5 years
Cost: $115,000/site (total: $1.033 million)
Funding Sources: 319 and CMI programs, County Road Commissions, US Fish &
Wildlife Service, USDA Forest Service
Level of Effort: Two severe sites completed per year.
Priority: High
2008 Status: The USDA Forest Service has two agreements in place with the Alcona
County Road Commission to replace a number of road stream crossings within the
proclamation boundary of the Huron National Forest. The following sites were
reported to be on the Forest Service‘s priority list for replacement as of 2006: Stout
Road at McGillis Creek, F-30 at a Kurtz Creek tributary, and F-30 at the North Lake
outlet. In 2007, Alcona County Road Commission crews revamped the stream
crossing at Buhl Road and Gimlet Creek south of F-30 replacing existing culverts
with a retired railroad tanker car. All road/stream crossings in the watershed were
reinventoried in 2007.
Chapter 5: Goals and Objectives
Pine River-Van Etten Lake Watershed Management Plan 5-4
Objective 1.2: Provide one-on-one technical assistance with agriculture producers to utilize
exclusion fencing/buffer strips along the entire riparian corridor.
Milestones: Identify current agricultural practices in year one
Distribute educational materials in year one
Encourage participation in USDA matching funds programs in years one through five
Conduct seminars on BMPs in year two
Task Products: Educational materials and seminars
Typical System of BMPs: Livestock exclusion fence and filter strip installation,
educational and managerial efforts to change operating procedures
Water Quality Benefits: Reduction of pollution entering the watershed from agricultural
lands through increased awareness of agricultural producers to implement water
quality conservation practices
Evaluation Methods: Before and after photos, stream geomorphology assessment,
calculate BMP load reduction
Lead Organization: Natural Resources Conservation Service
Partners: Alcona and Iosco Conservation Districts, Michigan State University
Extension, Huron Pines
Technical Assistance: Engineering services
Timeline: 5 years
Cost: $10,000/year (total: $50,000)
Funding Sources: 319 and CMI programs, Natural Resources Conservation Service-
Wildlife Habitat Incentives Program and other agricultural cost-share programs
Level of Effort: Conduct one BMP seminar and actively promote livestock exclusion
fencing/buffer strips one-on-one to 15 riparian agricultural producers in the first year.
Priority: High
2008 Status: In 2006, the Natural Resources Conservation Service installed a Heavy Use
Protection Area which is the first step in a 3 year project to reduce feedlot run off into
Roy Creek. This project will significantly reduce the amount of organic waste
deposited into this creek. An animal crossing was planned for 2007 at a third location
which will keep a buffalo herd out of a small creek that drains into the Pine River. In
2007, Huron Pines and US Fish & Wildlife Service teamed up to install several
measures of biotechnical erosion control. Techniques ranging from bank re-sloping,
to native plantings, to coir log installations were employed to slow the rate of erosion,
while still providing a natural stream bank environment. Biotechnical erosion control
methods focus on using live and dead plants and inorganic materials such as field
stone to reduce the erosion of a particular stream bank. Huron Pines installed Large
Woody Debris as fish habitat and a means to buffer erosive water energy in the
summer of 2008.
Objective 1.3: Reduce sediment at the 6 eroding streambank sites ranked as severe and the
17 ranked as moderate.
Milestones: Conduct analysis of site (including stream geomorphology survey) for appropriate
treatment by year two.
Obtain Permits by year three.
Chapter 5: Goals and Objectives
Pine River-Van Etten Lake Watershed Management Plan 5-5
Develop engineering designs in years three through six.
Stabilize eroding stream bank sites identified as severe and moderate during years
three through ten.
Conduct post-BMP stream geomorphology surveys on all sites by year ten.
Task Products: Completion of 20,000 sq ft. of revegetation, 355 linear feet of
streambank stabilization structures.
Typical System of BMPs: Stabilize eroding streambanks with rock riprap, whole tree
revetment, biotechnical engineered revegetation or log terracing or a combination of
these BMPs. Sites may require treated stairways and/or lunker structures in the case
of prescribed rock riprap placement.
Water Quality Benefits: Reduction of nutrients and sediments entering the watershed by
75%.
Evaluation Methods: Before and after photos, stream geomorphology assessment,
calculate BMP load reduction
Lead Organization: Huron Pines
Partners: USDA Forest Service, riparian property owners, Natural Resources
Conservation Service
Technical Assistance: Engineering services
Timeline: 10 years
Cost: $20,000/site (total: $120,000)
Funding Sources: 319 and CMI programs, County Road Commissions, US Fish &
Wildlife Service, USDA Forest Service
Level of Effort: Three severe sites completed first year.
Priority: High
2008 Status: In 2007, Huron Pines and US Fish & Wildlife Service teamed up to install
several measures of biotechnical erosion control at the Joslin property in Alcona
County. The East Branch of the Pine River runs through their farm and has been
removing large chunks of stream bank during the past few years. Techniques ranging
from bank re-sloping, to native plantings, to coir log installations were employed to
slow the rate of erosion, while still providing a natural stream bank environment.
Biotechnical erosion control methods focus on using live and dead plants and
inorganic materials such as field stone to reduce the erosion of a particular stream
bank. Huron Pines also installed Large Woody Debris as fish habitat and a means to
buffer erosive water energy in the summer of 2008 as part of a workshop on stream
stewardship for agricultural landowners.
Objective 1.4: Provide educational programs to riparian property owners on topics such as
erosion control, forest stewardship, wetlands and vegetative buffer strips.
Milestones:
Identify specific riparian target audiences by year one.
Design Power Point® presentations and online content in year one.
Develop and distribute educational materials in years two and three.
Conduct educational workshops in conjunction with volunteer workdays in years two
and three.
Task Products: Increased awareness of riparian property owners to implement erosion
control practices on their property to protect water quality.
Chapter 5: Goals and Objectives
Pine River-Van Etten Lake Watershed Management Plan 5-6
Typical System of BMPs: Forest road planning with buffer strips and livestock
exclusion from forested areas, streambanks, and wetlands if necessary. Educational
and managerial efforts to change operating procedures.
Water Quality Benefits: Reduction of 34 lbs/year phosphorous, reduced runoff and
sediment input, increased wildlife habitat
Evaluation Methods: Attendees at workshops, post workshop survey
Lead Organization: Huron Pines
Partners: Alcona and Iosco Conservation Districts, Michigan State University
Extension, Van Etten Lake Association
Technical Assistance: Experts on watershed topics as speakers, engineering services on
any volunteer erosion sites
Timeline: 3 years
Cost: $10,000/year (total: $30,000)
Funding Sources: Private foundations, 319 and CMI programs
Level of Effort: Conduct 2 training workshops within first year.
Priority: Medium
2008 Status: Huron Pines held one workshop on lakeshore greenbelts in June of 2008
that included a presentation on greenbelts and lakeshore stewardship as well as a visit
to a greenbelt that had been installed in 2007 as a volunteer project for the PRVEL
Coalition. In August 2008, Huron Pines held a workshop on river stewardship for
farmers that included a presentation by Natural Resources Conservation Service staff
on river stewardship and programs available to farmers along with a Large Woody
Debris demonstration by Huron Pines staff. These events were actively promoted by
the PRVEL Coalition through fliers, newspaper articles, and a booth at the Alcona
County Fair.
Objective 1.5: Present local units of government with information on the importance of
vegetative buffer strips along streams, including a model ordinance (see section E of this
chapter for specific townships to target).
Milestones:
Develop a model ordinance in year one.
Present model ordinance to all townships and counties within watershed in year two.
Task Products: Increased awareness of local government officials of the importance of
water quality protection measures and implemented ordinances.
Water Quality Benefits: Reduced runoff and sediment input, increased wildlife habitat
Evaluation Methods: Adoption of buffer strips in zoning ordinances, review building
permits to assess whether the buffer strips are being implemented.
Lead Organization: Huron Pines
Partners: Local Townships, Northeast Michigan Council of Governments
Technical Assistance: Land use planning professional
Timeline: 2 years
Cost: $5,000/ year (total: $10,000)
Funding Sources: Local government
Level of Effort: Model ordinance applied at the township level.
Priority: High
2008 Status: No work done in 2007.

Chapter 5: Goals and Objectives
Pine River-Van Etten Lake Watershed Management Plan 5-7
Objective 1.6: Develop and implement a stormwater management ordinance for new
developments and adopt stormwater management practices and policies at existing
communities.
Milestones:
Develop a model ordinance by year one.
Implement BMPs at stormwater runoff areas in years two through five.
Conduct pre- and post-installation water quality monitoring at each site in years two
through five.
Task Products: Adoption of stormwater management practices by local communities.
Typical System of BMPs: May include the creation of infiltration trenches and basins,
native plant detention basin landscaping or rain gardens. Other measures include
storm drain stenciling, reduction of impervious surfaces and proper disposal of
hazardous substances.
Water Quality Benefits: Reduced runoff and sediment input, increased wildlife habitat
Evaluation Methods: Adoption of stormwater management ordinances, review building
permits to assess whether the management practices are being implemented.
Lead Organization: Huron Pines
Partners: Alcona and Iosco Road Commissions, Northeast Michigan Council of
Governments, MDEQ Water Division, MDNR Fisheries Division, Oscoda Township,
Village of Lincoln, City of Harrisville, Alcona and Iosco County Commissioners
Technical Assistance: Land use planning professional
Timeline: 5 years
Cost: 10,000/year (total: $50,000)
Funding Sources: Local government
Level of Effort: Application of model ordinance and implementation of BMPs at
problem sites.
Priority: High
2008 Status: No work done in 2007.
Objective 1.7: Create a subcommittee to explore with the MDNR Fisheries Division the
issue of adfluvial fish passage above Van Etten Dam and the impacts of impoundments.
Milestones:
Review previous and current studies concerning fish passage in year one.
Conduct public input and informational meetings in year one.
Prepare a document of findings in year two.
Consider the options and come to a decision by year two.
Task Products: The compilation of scientific materials to initiate informed public
participation in the recommendations regarding fish passage at Van Etten dam
Water Quality Benefits: Increased fish habitat
Lead Organization: MDNR Fisheries Division
Partners: Iosco County Commissioners, Iosco County Drain Commission, Oscoda
Township, Van Etten Lake Association, USDA Forest Service, US Fish & Wildlife
Service, Michigan State University Department of Fish and Wildlife, Huron Pines
Technical Assistance: Not applicable
Timeline: 2 years
Cost: $8,000
Chapter 5: Goals and Objectives
Pine River-Van Etten Lake Watershed Management Plan 5-8
Funding Sources: MDNR Fisheries Division, US Fish & Wildlife Service
Level of Effort: The publication of an interdisciplinary, multi agency document of
findings with conclusions and recommendations within 2 years.
Priority: Medium
2008 Status: Steve Sendek, fisheries biologist, collected preliminary information in
2006. Funding has also been approved for the DNR to conduct an engineering study
for the fish passage over the dam at Van Etten Lake. This project will produce a
design and an estimated cost for a fish passage structure for review and comment so
that a determination of the feasibility of the project can be made.
Goal 2: Ensure that the total/partial body contact designated use for Van Etten Lake is met
Subwatershed: Van Etten Lake
Objective 2.1: Provide educational programs and materials to property owners on actions
they can take to reduce their nutrient contribution.
Milestones:
Distribute water quality stewardship information packets to property owners in year
one.
Conduct seminars for property owners in year two.
Develop a system to track new property owners and insure they receive water quality
stewardship information in year one.
Involve real estate agencies in the distribution process in year one.
Educate property owners on proper disposal of hazardous waste and promote
hazardous waste collection opportunities in years two and three.
Promote water quality stewardship practices in local newspaper in years one and two.
Task Products: Landowner perceptions and attitudes incorporate water quality
awareness into their property management practices.
Water Quality Benefits: Reduced runoff and sediment input to Van Etten Lake.
Evaluation Methods: Property owner survey
Lead Organization: Michigan State University Extension
Partners: Michigan Groundwater Stewardship Program, Iosco Conservation District,
Van Etten Lake Association, Michigan Lakes and Streams Association, Oscoda
Township Office of Economic Development, Oscoda High School, Local
newspapers, Huron Pines
Technical Assistance: Not applicable
Timeline: 3 years
Cost: $5,000/year (total: $15,000)
Funding Sources: 319 and CMI programs Level of Effort: One seminar completed, information packets distributed and tracking
system developed in the first year.
Priority: Medium
2008 Status: The landowner stewardship toolkits have been designed and will be
disseminated at workshops and meetings, as well as libraries and other places. A
realtor on the watershed Steering Committee distributed copies to other local realtors
for them to use and share with new potential landowners in the watershed.

Chapter 5: Goals and Objectives
Pine River-Van Etten Lake Watershed Management Plan 5-9
Objective 2.2: Continue yearly volunteer Michigan Cooperative Lakes Monitoring Program.
Milestones:
Collect and submit sampling data yearly.
Task Products: Sampling report is generated.
Water Quality Benefits: An established library of results will help show trends and
enable stakeholders to make better decisions addressing water quality concerns.
Evaluation Methods: Use of the data in local decision making and project planning
Lead Organization: Van Etten Lake Association
Partners: Michigan Lakes and Streams Association, Oscoda Township
Technical Assistance: Sampling training and equipment
Timeline: 10 years
Cost: Volunteer
Funding Sources: Not applicable
Level of Effort: Sampling data published in Cooperative Lakes Monitoring Program
Annual Report.
Priority: High
2008 Status: The Van Etten Lake Association is continuing to participate annually in the
Cooperative Lakes Monitoring Program for Secchi Disk Clarity, Chlorophyll a, and
spring and summer Phosphorous sampling. Beach sampling for E-coli was conducted
by both Van Etten Lake Association volunteers and District Health Department #2
over the summer of 2006.
Objective 2.3: Use a shoreline technician to work one-on-one with property owners to
voluntarily re-establish shoreline vegetative buffers.
Milestones:
Find a source of matching funds (as an incentive) for property owners interested in
implementing biotechnical erosion control methods by year one.
Provide training for contractors/landscapers to ensure they have the knowledge to
implement BMPs for protecting water quality along the shoreline by year two.
Involve lawn maintenance service providers.
Identify potential sites for vegetative buffers by year two.
One-on-one meetings with property owners and technicians.
Secure funding for staff technician by year three.
Find sources for native plant purchases by year six.
Task Products: Prioritize project selection, seeking funding, implement projects.
Typical System of BMPs: Shoreline reestablished by utilizing biotechnical erosion
control practices including native plantings and/or tree revetments, rock revetments
and bulkheads.
Water Quality Benefits: Natural shoreline protective measures increased. Native
plantings produce subsequent benefits to fish and wildlife in increased habitat.
Evaluation Methods: Number of visits, number of projects completed
Lead Organization: Huron Pines
Partners: Van Etten Lake Association, Michigan Lakes and Streams Association,
Natural Resources Conservation Service, Iosco Conservation District
Technical Assistance: Not needed
Timeline: 6 years
Chapter 5: Goals and Objectives
Pine River-Van Etten Lake Watershed Management Plan 5-10
Cost: $12,000/year (total: $72,000)
Funding Sources: Private foundations, 319 and CMI programs
Level of Effort: Shoreline technician hired; 35 one-on-one property owner contacts
completed and three sites reestablished w/vegetative buffers in the first year.
Priority: Medium
2008 Status: A shoreline improvement demonstration project was completed on the
property of long time Van Etten Lake resident, Marilyn Forrest and her son in 2007.
With the combined efforts of Huron Pines ecologists and PRVEL volunteers, Mrs.
Forrest now has a new rock riprap and fiber-log buffered shoreline to help stabilize
the previously eroding bank. In addition, over 100 native plants, shrubs, and grasses
were planted to help filter out any pollutants/contaminants that might otherwise flow
directly into the lake.
Objective 2.4: Educate shoreline landowners about septic system inputs of pollution into
Van Etten Lake and reduce the impact of those inputs.
Milestones:
Create landowner packets about shoreline stewardship and septic maintenance in year
one.
Hold workshops to discuss septic system pollutants in year two.
Work with septic inspectors to provide information on proper septic maintenance and
impacts on the lake in year two.
Task Products: Residents are made aware of a potential correctable source of pollution
that may be causing the blue-green algae blooms each summer on the lake.
Water Quality Benefits: Reduced phosphorus entering Van Etten Lake from faulty or
aged septic systems.
Evaluation Methods: Before and after surveys, researched alternatives installed
Lead Organization: Huron Pines
Partners: Michigan State University Extension, Van Etten Lake Association, Michigan
Lakes and Streams Association, Natural Resources Conservation Service, Iosco
Conservation District
Technical Assistance: Wastewater management expert/engineering services
Timeline: 2 years
Cost: $2,000/year (total: $4,000)
Funding Sources: Pine River-Van Etten Lake Watershed Coalition, local foundations
Level of Effort: one presentation in the first year
Priority: Medium
2008 Status: A survey of septic permits in the Van Etten Lake tax assessment area was
completed by a Coalition volunteer in 2007. Results are shown in Chapter 4.
Objective 2.5: Present local officials with information on the significance of vegetative
buffer strips and assist them in adopting effective, consistent standards.
Milestones:
Develop model ordinance in year one.
Present model ordinance to local officials in year one.
Provide training to local officials in year one.
Assist with publicizing ordinance in year one.
Chapter 5: Goals and Objectives
Pine River-Van Etten Lake Watershed Management Plan 5-11
Task Products: Adopted vegetated buffer strip ordinances implemented.
Water Quality Benefits: Reduced runoff and sediment input
Evaluation Methods: Model ordinance approved as actual ordinance, enforcement of
ordinance
Lead Organization: Huron Pines
Partners: Van Etten Lake Association, Oscoda Township, Oscoda Township Office of
Economic Development, Northeast Michigan Council of Governments
Technical Assistance: Not applicable
Timeline: 1 year
Cost: $5,000
Funding Sources: 319 and CMI programs
Level of Effort: Model ordinance adopted and applied at the local level.
Priority: Medium
2008 Status: The landowner stewardship toolkits have been designed with a section
focusing on resources for officials (including sample ordinances) and will be
disseminated at workshops and meetings, as well as libraries and other places.
Goal 3: Restore Van Etten Creek of Alcona County to levels that will ensure it is removed
from the State's non-attainment list
Subwatershed: Van Etten Creek
Objective 3.1: Implement exclusion fencing/buffer strips at priority agriculture sites within
riparian corridor to improve nutrient management.
Milestones:
Continue to seek out grant sources to provide matching funds to agricultural
producers to assist with implementing agricultural BMPs in years one through five.
Revise agricultural inventory annually to verify active livestock operations.
Technically assist with the implementation of exclusion fencing/buffer strips on
private land in years two through five, including pre- and post-installation water
quality monitoring and stream geomorphology surveys.
Task Products: BMPs installed.
Typical System of BMPs: Installation of livestock exclusion fencing with filter strips.
Water Quality Benefits: Increased revegetation of streambanks, exclusion fencing,
watering stations and other alternative feeding/watering methods. Nutrient
contribution reduced at agricultural sites with unrestricted livestock access to streams.
Evaluation Methods: Before and after photos, stream geomorphology assessment,
calculate BMP load reduction
Lead Organization: Natural Resources Conservation Service
Partners: Huron Pines, Alcona Conservation District, Farm Services Agency
Technical Assistance: Natural Resources Conservation Service District
Conservationists, Farm Services Agency staff, Huron Pines
Timeline: 5 years
Cost: $20,000/year (total: $100,000)
Funding Sources: 319 and CMI programs, Natural Resources Conservation Service-
Wildlife Habitat Incentives Program and other agricultural cost-share programs

Chapter 5: Goals and Objectives
Pine River-Van Etten Lake Watershed Management Plan 5-12
Level of Effort: Implement exclusion fencing/buffer strips at two priority sites per year
within the Van Etten Creek subwatershed.
Priority: High
2008 Status: In 2006, the Natural Resources Conservation Service installed a Heavy Use
Protection Area which is the first step in a 3 year project to reduce feedlot run off into
Roy Creek. This project will significantly reduce the amount of organic waste
deposited into this creek. An animal crossing was planned for 2007 at a third location
which will keep a buffalo herd out of a small creek that drains into the Pine River. In
2007, Huron Pines and US Fish & Wildlife Service teamed up to install several
measures of biotechnical erosion control. Techniques ranging from bank re-sloping,
to native plantings, to coir log installations were employed to slow the rate of erosion,
while still providing a natural stream bank environment. Beyond the techniques used
to date, Huron Pines intends to also install Large Woody Debris as fish habitat and a
means to buffer erosive water energy in the spring of 2008.
Fecal Coliform Sampling was conducted monthly at one site on Van Etten Creek and
at several other sites on the Pine River and its tributaries in 2007. The intent of this
sampling is to inexpensively screen sites to help identify potential sources of
contamination by animals and humans.
Objective 3.2: Continue to provide one-on-one technical assistance with agricultural
producers to encourage the use of BMPs.
Milestones:
Identify current agricultural producers and their management practices in years one
and two.
Distribute educational materials in years two and three.
Encourage participation in USDA matching funds programs in years three through
ten.
Technically assist in the implementation of BMPs on private lands in years three
through ten.
Task Products: BMPs installed on private agricultural lands.
Typical System of BMPs: Proper manure storage, manure testing, well protection and
livestock exclusion fencing with filter strips. Educational and managerial efforts to
change operating procedures.
Water Quality Benefits: Increased vegetated buffers and alternative cattle
feeding/watering processes
Evaluation Methods: Before and after photos, stream geomorphology assessment,
calculate BMP load reduction
Lead Organization: Natural Resources Conservation Service
Partners: Huron Pines, Alcona Conservation District
Technical Assistance: Not applicable
Timeline: 10 years
Cost: $5,000/year (total: $50,000)
Funding Sources: 319 and CMI programs, Natural Resources Conservation Service-
Wildlife Habitat Incentives Program and other agricultural cost-share programs
Chapter 5: Goals and Objectives
Pine River-Van Etten Lake Watershed Management Plan 5-13
Level of Effort: Meet one-on-one with 10 agricultural producers within the Van Etten
Creek subwatershed to actively encourage the use of BMPs to promote water quality
and offer technical assistance within in the first year.
Priority: High
2008 Status: The Natural Resources Conservation Service District Conservationist in the
area continues to meet with local agricultural producers and promote funding
programs.
Objective 3.3: Highlight local examples of agricultural BMPs.
Milestones:
Identify producers utilizing BMPs in year one.
Promote local farms using BMPs through coordinated cooperative tours and news
releases in years one and two.
Provide additional local agency awards, recognition and incentives to innovative
producers in year two.
Task Products: Enthusiasm and awareness of the soil and water conservation practices
being successfully implemented in the local agricultural community is created.
Typical System of BMPs: Planned grazing systems, livestock exclusion fencing with
filter strips, contour buffer strips and alternate livestock water supplies.
Water Quality Benefits: Increased awareness leads to BMPs implemented and reduced
pollutants entering the watershed.
Evaluation Methods: Attendance, survey attendees
Lead Organization: Alcona Conservation District
Partners: Natural Resources Conservation Service, Michigan State University
Extension, Huron Pines
Technical Assistance: Not applicable
Timeline: 2 years
Cost: $3,000/year (total: $6,000)
Funding Sources: Local sponsors
Level of Effort: One BMP auto tour and recognition event each summer.
Priority: Medium
2008 Status: No known work completed on this objective.
Goal 4: Improve and protect the aquatic habitat within the watershed
Subwatershed: Van Etten Creek, Pine River, Van Etten Lake
Objective 4.1: Support local enforcement officials to ensure that rules pertaining to the
watershed are consistently followed.
Milestone:
Publicize local and state regulations and ensure that information on adopted standards
is clear, concise and available to the public in years one through three.
Task Products: Public is better informed and their awareness of watershed related rules
is raised.
Water Quality Benefits: Not applicable
Lead Organization: Van Etten Lake Association
Chapter 5: Goals and Objectives
Pine River-Van Etten Lake Watershed Management Plan 5-14
Partners: Northeast Michigan Council of Governments, Local Townships, Alcona and
Iosco County Building and Zoning Departments
Technical Assistance: Land use planner
Timeline: 3 years
Cost: $5,000
Funding Sources: Local governments, community foundations
Level of Effort: Conduct awareness surveys of watershed residents before and after
publicizing information.
Priority: Medium
2008 Status: See section E of this chapter for specific recommendations and analysis of
local zoning ordinances and master plans.
Objective 4.2: Develop shoreline erosion control demonstration sites.
Milestones:
Evaluate potential site locations in year one.
Evaluate site to determine appropriate BMPs in year one.
Secure funding for implementation in year two.
Coordinate design and installation with local landscaping companies in year two.
Publicize and promote project to encourage use of erosion control practices in year
three.
Conduct tours of demonstration sites for local officials and interested public in year
three.
Task Products: Community enthusiasm and awareness is created regarding shoreline
erosion control practices within the context of landscaping for improved aquatic
habitat.
Water Quality Benefits: Reduced sediment and runoff input.
Lead Organization: Huron Pines
Partners: Alcona and Iosco Conservation Districts, local landscaping companies, Alcona
and Iosco Road Commissions, Van Etten Lake Association, Natural Resources
Conservation Service, Local Townships, Cities and Villages
Technical Assistance: Engineering and installation
Timeline: 3 years
Cost: $10,000/site (total of $20,000 in the first year)
Funding Sources: Local landowners, PRVEL Coalition, Van Etten Lake Association,
CMI and 319 programs.
Level of Effort: Development of two demonstration sites in the first year.
Priority: Medium
2008 Status: In 2007, volunteers from the PRVEL Coalition and Huron Pines staff
installed a demonstration greenbelt at a property on Van Etten Lake that had been
experiencing erosion (over 110 feet of coir logs were installed along with 12 cubic
yards of rock riprap and 500 square feet of native plants). The event was publicized
on the Huron Pines website and in the Oscoda Press and will be used as a teaching
site and example for future projects. Erosion control work also continued at the Joslin
streambank site, with the final installation of Large Woody Debris in August 2008.
Chapter 5: Goals and Objectives
Pine River-Van Etten Lake Watershed Management Plan 5-15
Objective 4.3: Conduct a county-level soil erosion workshop yearly.
Milestones:
Identify potential target audiences in year one.
Promote and publicize workshop to those target audiences in year two.
Conduct training on soil erosion issues particularly as related to water quality in year
three.
Task Products: A trained target audience with knowledge to make informed decisions
regarding soil erosion control practices
Water Quality Benefits: Reduction in sediment and runoff input to the watershed;
increased reporting and maintenance of road/stream crossings to prevent future
failures
Lead Organization: Alcona and Iosco County Soil Erosion and Sedimentation Control
Officers
Partners: Alcona and Iosco County Building and Zoning Departments, Natural
Resources Conservation Service, Alcona and Iosco Conservation Districts, Michigan
State University Extension, Huron Pines, DEQ Water Division
Technical Assistance: Soil erosion expert, engineer, or other speakers
Timeline: 3 years
Cost: $3,000/year (total: $9,000)
Funding Sources: Natural Resources Conservation Service, CMI and 319 programs,
local foundations
Level of Effort: County-level soil erosion workshop conducted in the first year.
Priority: Medium
2008 Status: No activity on this objective.
Objective 4.4: Conduct yearly Invasive Exotic Species monitoring program.
Milestones:
Review current and previous studies and inventories in year one.
Cooperatively develop a basic program that that can be incorporated into ongoing
statewide data collection and that includes citizen participation in year two.
Collect, record and summarize findings in years two through 10.
Task Products: The possession of current information to assist in taking proactive
measures to prevent introduction or reduce or eliminate exotic species presence in the
watershed
Water Quality Benefits: Reduce the amount of invasive species threatening the
watershed.
Lead Organization: Van Etten Lake Association
Partners: Riparian property owners, Oscoda Township, Michigan Lakes and Streams
Association, local high schools, USDA Forest Service, MDNR Fisheries Division,
DEQ Water Division
Technical Assistance: Botanist or certified pest manager
Timeline: 10 years
Cost: $2,000
Funding Sources: CMI and 319 programs, volunteers, MDNR, US Fish & Wildlife
Service, USDA Forest Service.

Chapter 5: Goals and Objectives
Pine River-Van Etten Lake Watershed Management Plan 5-16
Level of Effort: Program developed and data recorded and summarized.
Priority: High
2008 Status: No action taken.
Objective 4.5: Create a watershed-wide monitoring program to observe trends in water
quality and provide a baseline of data for directing future efforts (see chapter 7).
Milestones:
Coordinate volunteer Cooperative Lakes Monitoring Program (lake) E. coli and
stream macroinvertebrate sampling yearly.
Obtain funding for a continuing water quality monitoring program by year two.
Train technical staff and volunteers to conduct monitoring by year three.
Conduct biological habitat and water quality monitoring (at sites described in chapter
7) yearly (DEQ biological surveys continue on a 5-year cycle).
Prepare and present periodical reports for the public to explain changes in the
watershed.
Conduct Bank Erosion Hazard Index monitoring throughout the watershed (repeat
every 5 years)
Task Products: Data about water quality in lakes and streams, educated volunteers, and
public awareness
Water Quality Benefits: Not applicable
Lead Organization: PRVEL Coalition, Michigan DEQ
Partners: United States Geological Survey, Van Etten Lake Association, USDA Forest
Service, US Fish & Wildlife Service, Michigan State University Department of Fish
and Wildlife, Huron Pines
Technical Assistance: Michigan DEQ
Timeline: 10 years
Cost: $10,000/year (total: $100,000)
Funding Sources: MDNR Fisheries Division, US Fish & Wildlife Service
Level of Effort: The publication of an interdisciplinary, multi-agency document of
findings with conclusions and recommendations within 2 years.
Priority: High
2008 Status: Local volunteers are conducting Cooperative Lakes Monitoring Program
monitoring on Van Etten Lake and E. coli and MiCorps macroinvertebrate monitoring
on the watershed‘s streams. For details of other monitoring, see chapter 7. In July
2008, MDEQ staff trained Huron Pines staff and watershed volunteers to conduct
BEHI analysis, which is a good tool for determining erosion trends across a
watershed.
Goal 5: Protect critical wildlife habitat areas within the watershed
Subwatershed: Van Etten Creek, Pine River, Van Etten Lake
Objective 5.1: Coordinate master planning efforts among local units of government.
Milestones:
Chapter 5: Goals and Objectives
Pine River-Van Etten Lake Watershed Management Plan 5-17
Address watershed management practices within master plans for all townships by
year five.
Update and/or revise master plans for all townships by year ten.
Promote consistency of master plans for all townships in years one through ten.
Task Products: Master planning efforts among local units of government are
coordinated to include provisions that promote watershed protection and water quality
restoration.
Water Quality Benefits: Reduced sediment and runoff, increase in wildlife habitat
Lead Organization: Northeast Michigan Council of Governments
Partners: Alcona County Commissioners, local Townships, USDA Forest Service,
Huron Pines
Technical Assistance: Habitat specialist, land use planner
Timeline: 10 years
Cost: $15,000/year (total: $150,000)
Funding Sources: Local governments
Level of Effort: One township master plan updated and watershed management practices
addressed within each one per year.
Priority: Medium
2008 Status: Although NEMCOG has not been directly involved in any partnership
activities related to the watershed plan, they have been working with Mikado
Township to update their Zoning Ordinance and working with Curtis Township and
Hawes to update their master plans. All three of these activities indirectly address
water quality.
Objective 5.2: Promote riparian landscaping for wildlife and water quality through
educational presentations to professional landscapers and waterfront owners.
Milestones:
Develop and distribute educational materials specific to riparian wildlife habitat by
year two.
Conduct workshops focusing on riparian property enhancement for wildlife in year
three.
Promote innovative practices and native species utilization in year two.
Provide one-on-one technical assistance to riparian property owners interested in
wildlife habitat improvements in years two through five.
Secure funding to staff technician in year one.
Task Products: Staff technician hired, increased awareness and knowledge of
professional landscapers and waterfront owners to implement landscaping for wildlife
and water quality
Water Quality Benefits: Increased wildlife habitat, reduced erosion and runoff
Lead Organization: Huron Pines
Partners: Alcona and Iosco Conservation Districts, MDNR Wildlife Division, MDNR
Forest, Fire and Mineral Division, local Lake Associations, USDA Forest Service,
local landscaping companies, Michigan State University Extension, Michigan
Groundwater Stewardship Program, US Fish & Wildlife Service, Village of Lincoln
Technical Assistance: Not applicable
Timeline: 5 years
Chapter 5: Goals and Objectives
Pine River-Van Etten Lake Watershed Management Plan 5-18
Cost: $20,000/year (total: $100,000)
Funding Sources: 319 and CMI programs, PRVEL Coalition, DNR, US Fish & Wildlife
Service
Level of Effort: Conduct one workshop and visit 15 riparian property owners in first
year.
Priority: Medium
2008 Status: Huron Pines has developed a riparian stewardship toolkit that will be
distributed in 2008. Staff organized and held two workshops in the summer of 2008,
one with a focus on riparian property owners on the lake and the other with a focus on
agricultural landowners.
Objective 5.3: Work to make a voluntary Conservation Easement program more readily
available to property owners within the watershed.
Milestones:
Identify environmentally sensitive parcels by year five.
Identify large privately owned contiguous tracts of land within the critical riparian
zone by year six.
Initiate and promote conservation easements to potential candidates in years seven
through ten.
Task Products: Privately owned environmentally sensitive parcels identified and
landowners made more aware of the benefits of conservation easements.
Water Quality Benefits: Increased wildlife habitat and undeveloped riparian areas
Lead Organization: HeadWaters Land Conservancy
Partners: Alcona and Iosco Conservation Districts, Natural Resources Conservation
Service, Huron Pines
Timeline: 10 years
Cost: $3,000/easement (total: $30,000)
Funding Sources: Natural Resources Conservation Service, HeadWaters Land
Conservancy, local foundations
Level of Effort: One conservation easement established in the watershed per year.
Priority: Medium
2008 Status: The HeadWaters Land Conservancy is currently working with Arnot Heller
to protect his 360 acres with a conservation easement. His property is in Reno Twp.,
Iosco Co. T22N, R5E, Section 17. This is a great parcel with extensive frontage on
Hope Creek.
Objective 5.4: Provide training opportunities for planning and zoning commissioners.
Milestones:
Coordinate training seminars for local planning and zoning personnel in years one
and two.
Conduct follow-up seminars regarding new planning topics and issues in year three.
Task Products: Increased training opportunities for planning and zoning commissioners
to assist them with making current and informed decisions.
Water Quality Benefits: Not applicable
Lead Organization: Michigan State University Extension
Chapter 5: Goals and Objectives
Pine River-Van Etten Lake Watershed Management Plan 5-19
Partners: Local Townships, Alcona and Iosco County Building and Zoning
Departments, Planning Commissions, Recreation Commissions, Michigan
Association of Planning Officials, Alcona and Iosco County Commissioners,
Community Foundation for Northeast Michigan
Technical Assistance: Land use planner
Timeline: 3 years
Cost: $5,000/year (total: $15,000)
Funding Sources: Local foundations and governments
Level of Effort: Completion of Citizen Planner program for Alcona and Iosco Counties.
Priority: Medium
2008 Status: No action taken.
Objective 5.5: Develop and distribute education packets that promote the conservation of
aquatic and terrestrial organisms and their habitats to real estate agents, developers and
contractors.
Milestones:
Design written materials specific to the land sales industry regarding fish and wildlife
concerns with respect to development issues in year one.
Meet with local agents to introduce concept in year one.
Publish and distribute education packets in year two.
Design Power Point ® presentation in year two.
Promote wildlife habitat awareness through presentations in year three.
Task Products: Real estate agents, developers and contractors perceptions and attitudes
incorporate wildlife habitat awareness into their property sales and development
practices.
Water Quality Benefits: Increased wildlife habitat
Lead Organization: Huron Pines
Partners: MDNR Fisheries Division, MDNR Wildlife Division, DEQ Water Division,
Michigan Association of Realtors, Local Real Estate Agencies, Developers and
Contractors, Michigan State University Extension, HeadWaters Land Conservancy
Technical Assistance: Not applicable
Timeline: 3 years
Cost: $5,000/year (total: $15,000)
Funding Sources: 319 and CMI programs, local foundations, PRVEL Coalition
Level of Effort: Education packets developed and distributed the first year. Two
speaking engagements conducted in the first year.
Priority: Medium
2008 Status: No action taken.
Objective 5.6: Produce and distribute GIS maps to landowners and local units of
government.
Milestones:
Secure funding for implementation in year one.
Identify and map the distribution of aquatic and near shore terrestrial species diversity
within the watershed in year two.
Chapter 5: Goals and Objectives
Pine River-Van Etten Lake Watershed Management Plan 5-20
Develop future land use maps for the watershed, showing projected development
patterns 10, 20, and 50 years into the future and track trends (development or
conservation) in sensitive areas in year three.
Identify and map environmentally sensitive parcels and ecological corridors
throughout the watershed in years four and five.
Task Products: A series of GIS maps produced identifying aquatic and wildlife diversity
within the watershed to help guide land development, zoning and conservation
efforts.
Water Quality Benefits: Increase in protection of habitat
Lead Organization: Northeast Michigan Council of Governments
Partners: USDA Forest Service, MNDR Fisheries Division, MDNR Wildlife Division,
US Fish & Wildlife Service, Alcona County Commissioners, Iosco County Planning
Commission
Technical Assistance: Land use planner, GIS specialist
Timeline: 5 years
Cost: $5,000/year (total: $25,000)
Funding Sources: Local governments, foundations
Level of Effort: Secure funding within the first year and completion of one task per/year
thereafter.
Priority: Medium
2008 Status: No action taken.
Goal 6: Sustain the Pine River-Van Etten Lake Watershed Management Process
Subwatershed: Pine River, Van Etten Creek, Van Etten Lake
Objective 6.1: Continually seek funding sources to carry out the objectives.
Milestones:
Seek out grant funding opportunities from public and private sources each year.
Write and apply for grants that are applicable to the goals and objectives of the
watershed management plan yearly.
Task Products: Funding secured to implement the goals and objectives of the watershed
management plan.
Water Quality Benefits: Increase in projects that reduce sediment and nutrient input and
increase habitat protection
Lead Organization: Huron Pines
Partners: Alcona and Iosco Conservation Districts
Technical Assistance: Not applicable
Timeline: 5 years
Cost: $1,000/grant (total: $5,000)
Funding Sources: Not applicable
Level of Effort: One $100,000 or more grant applied for annually.
Priority: High
2008 Status: In 2006, Huron Pines sought and received a grant from the Community
Foundation for Northeast Michigan, which was used to develop educational materials
and mail packets out to watershed residents. As a part of this effort, the current

Chapter 5: Goals and Objectives
Pine River-Van Etten Lake Watershed Management Plan 5-21
watershed mailing list was expanded to include riparian property owners in Alcona
County. This allowed for a mailing to promote Coalition efforts and will allow for
future mailing to promote riparian landscaping for wildlife and water quality.
Objective 6.2: Revisit Watershed Management Plan yearly and update as needed.
Milestones:
Convene a series of sessions of the Technical Subcommittee to review the
implementation and management progress of the project each year.
Technical Subcommittee then provides report and recommendations to the Full
Steering Committee annually regarding the management plan each year.
Task Products: Watershed management plan implemented and monitored with technical
oversight and guidance.
Water Quality Benefits: Not applicable
Lead Organization: Huron Pines
Partners: PRVEL Coalition
Technical Assistance: Watershed Management Plan (DEQ) technical assistance
Timeline: 5 years
Cost: $2,000
Funding Source: Not applicable
Level of Effort: Technical Subcommittee written report and recommendations provided
to the Steering Committee annually.
Priority: High
2008 Status: The goals and strategies of the watershed management plan are reviewed
every year and progress is monitored by the Steering Committee.
Objective 6.3: Promote the efforts of the Watershed Coalition through ongoing public
relations and marketing campaigns.
Milestones:
Develop short version of the watershed plan to share with the public and local units of
government in year one.
Continue to publish and distribute Coalition newsletter yearly.
Continue to provide news releases and interview opportunities to local news
Media yearly.
Continue to integrate cooperative public relations and informational programs with
other agencies and organizations yearly.
Task Products: Public enthusiasm and awareness of the PRVEL Coalition and their
mission enhances support of the restoration and conservation efforts and opportunities
within the watershed.
Water Quality Benefits: Not applicable
Lead Organization: Huron Pines
Partners: Alcona and Iosco Conservation Districts, Van Etten Lake Association,
Natural Resources Conservation Service, USDA Forest Service
Technical Assistance: Not applicable
Timeline: 5 years
Cost: $5,000/year (total: $25,000)
Chapter 5: Goals and Objectives
Pine River-Van Etten Lake Watershed Management Plan 5-22
Funding Sources: PRVEL Coalition, local foundations
Level of Effort: Short version of watershed plan developed and professionally printed in
the first year.
Priority: High
2008 Status: Huron Pines and the Steering Committee arranged for news articles, posted
press releases on the web and sent update letters to donors relating PRVEL Coalition
activities in 2007. A semiannual newsletter will be published in 2008. In addition,
PRVEL Coalition activities will be highlighted on the Huron Pines website and press
coverage will continue to be sought. Huron Pines has developed a watershed plan
summary, which will be distributed in 2009.
D. Implementation Costs
Table 5.1 below indicates the total estimated costs associated with implementing the Pine River-
Van Etten Lake watershed management plan goals and objectives. These costs cover different
items for each project, but include educational materials, construction materials, staff time,
meeting locations and publicity, printing and postage, and other costs necessary for completing
each objective. Each objective‘s timeline is shown in the table to optimize its effects in
conjunction with other objectives and to capitalize on the enthusiasm of the local partners that
will be generated at the start of the 10-year project timeline.

Chapter 5: Goals and Objectives
Pine River-Van Etten Lake Watershed Management Plan 5-23
Table 5.1: Timeline and Cost of Implementation Efforts
Objective Title Objective Cost
(total for 10 years)
2
0
0
9
2
0
1
0
2
0
1
1
2
0
1
2
2
0
1
3
2
0
1
4
2
0
1
5
2
0
1
6
2
0
1
7
2
0
1
8
1.1 Road/Stream Crossing BMPs $1,033,000
1.2 Ag BMPs $50,000
1.3 Streambank BMPs $120,000
1.4 Education of Riverfront Property Owners $30,000
1.5 Model greenbelt ordinance $10,000
1.6 Stormwater ordinance $50,000
1.7 Fish Passage Committee $8,000
2.1 Van Etten Lake Property Owner Education Program $15,000
2.2 Volunteer Lake Monitoring No cost—volunteers
2.3 Re-establish shoreline buffers $72,000
2.4 Septic inputs education for lake residents $4,000
2.5 Improved greenbelt ordinance for the lake $5,000
3.1 Exclusion fencing along Van Etten Creek $100,000
3.2 One on one technical assistance $50,000
3.3 Highlight local Ag examples $6,000
4.1 Support local enforcement of zoning $5,000
4.2 Shoreline erosion demo sites $20,000
4.3 Soil Erosion Control Workshop $9,000
4.4 Monitoring of exotic species $2,000
4.5 Water quality monitoring $100,000
5.1 Master Plan Coordination $150,000
5.2 Lakescaping Workshops $100,000
5.3 Conservation Easements $30,000
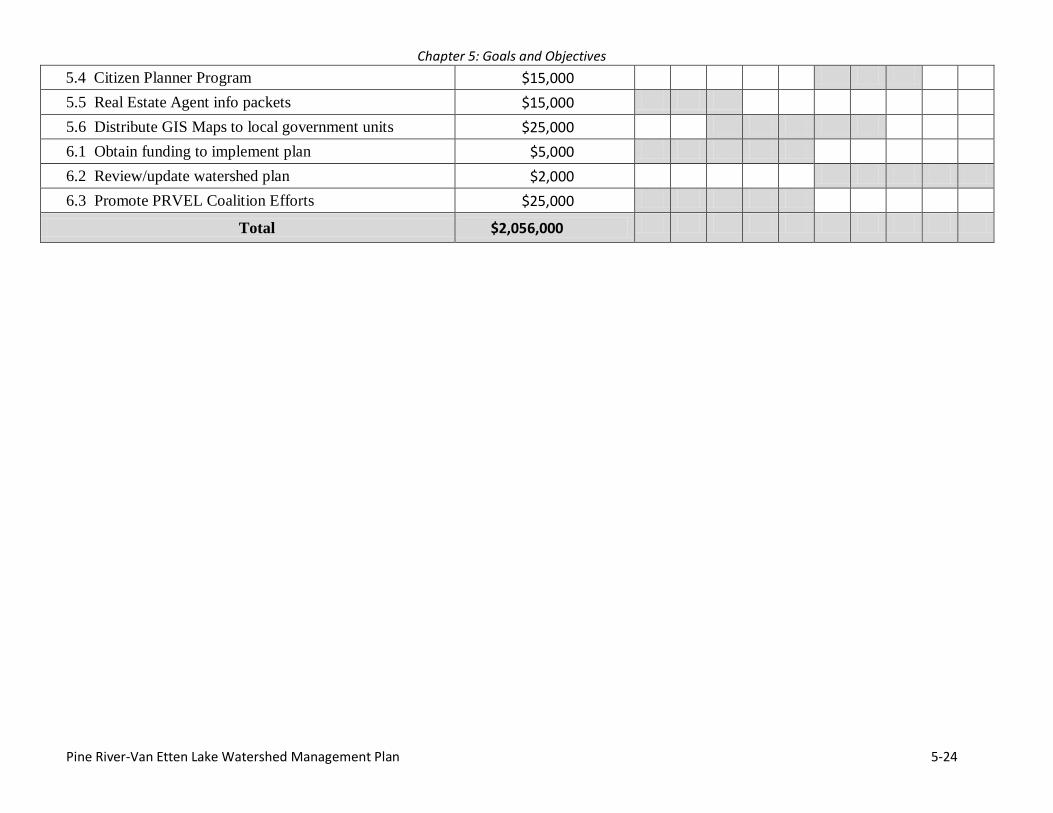
Chapter 5: Goals and Objectives
Pine River-Van Etten Lake Watershed Management Plan 5-24
5.4 Citizen Planner Program $15,000
5.5 Real Estate Agent info packets $15,000
5.6 Distribute GIS Maps to local government units $25,000
6.1 Obtain funding to implement plan $5,000
6.2 Review/update watershed plan $2,000
6.3 Promote PRVEL Coalition Efforts $25,000
Total $2,056,000
Chapter 5: Goals and Objectives
Pine River-Van Etten Lake Watershed Management Plan 5-25
E. Recommendations for Effectively Using Planning and Zoning Policies for
Water Resource Protection
1. General Recommendations for Alcona County
Most townships within Alcona generally do not include specific requirements that are helpful for
protecting water quality. For those that do have some, the lack of coordination among townships
results in different standards for each. The result of this is that, even if one township were to be
vigilant about protecting water quality, the approach taken in another township may translate into
headaches for them (water does not ―stay‖ in one township). The most significant thing the
townships could do is work together to consolidate local zoning under one county ordinance.
Under a county system, policies would be coordinated and resources (financial, people, time)
could be better utilized. For such a change to work at this point in time, the townships
themselves would have to lead the effort to work together.
A review of township planning and zoning programs in the watershed uncovered what appeared
to be general resistance to a countywide program. While steps could possibly be taken to make
that a viable program, it will not likely occur in either the short- or mid-term. In lieu of county
zoning, it would still be beneficial for the county to once again activate a planning commission,
which could provide guidance and technical assistance to the townships, as well as review and
comment upon proposed planning and zoning decisions. Currently, copies of most township
zoning ordinances are available at the county building, although many of the master plans are not
and much of the material is out of date. Other Michigan counties have begun providing their
zoning ordinance on a web site, which makes it easy to access, reproduce, and amend the
document, with little cost. Alcona could lead such an effort and host a site for all of the
townships.
In addition to the involvement of the county, the following general suggestions are offered for
townships within the watershed:
Training is essential to ensure that planning commission members are able to carry out
their jobs. These volunteer members are often put in a decision-making position without
understanding all of the issues involved with their new role. The Watershed Partnership
(or perhaps the county) should ensure that these training workshops are made available
(either freely or at a low cost) at least every other year. As there is no county zoning,
there are many planning commission members (every township), most of these members
would benefit from annual training programs.
Recent changes in the state of Michigan's planning and zoning enabling legislation, such
as requirements for open space and conservation planning, mandatory review of plans
every five years, and involving adjacent units of government in planning process, must be
incorporated by local government units. Local units of government may not be aware of
these changes or how to incorporate them. The Watershed Partnership should contact
each planning commission to make sure they are aware of the legislative changes and
how to incorporate them.

Chapter 5: Goals and Objectives
Pine River-Van Etten Lake Watershed Management Plan 5-26
There is a regional planning and zoning council that is available to provide assistance to
local government units (the Northeast Michigan Council of Governments). Townships
contemplating updating their master plan or revising their zoning ordinance should
contact NEMCOG as a first step in the process.
Because local communities have different goals, resources, and socio-economic status,
local communities often differ in the types of regulations they utilize. Generally, within a
given watershed there are enough similarities that the same standards could be used
throughout the watershed. Where one unit of government works to manage resources
wisely and the adjoining unit does not, resources impacts cross the line on the map. If
there is to be no county zoning, the townships should at least work more closely together
to better coordinate zoning districts and standards.
2. Specific Notes for Individual Townships
Curtis Township
Curtis Township makes up a relatively small amount of the acreage within the PRVEL
watershed. The zoning ordinance, while not outdated, generally has no provisions that help to
protect water resources. Within the Site Plan Review section of the ordinance, Curtis Township
has some provisions that would allow the zoning board to require control of stormwater runoff,
although this could be strengthened. The major zoning districts also require only a 25-foot
setback of structures from surface water (50 feet for industrial buildings), which does not do
much to prevent many of the problems in this watershed (such as excess runoff, streambank
erosion, and riparian corridor habitat loss). The recently updated master plan includes future land
use recommendations.
Greenbush Township
Both the Zoning ordinance (1997) and the Master Plan (2008) need to be reviewed and updated
regularly by the Planning Commission. The Master Plan was based (in part) on a 2005 township
opinion survey, this should be repeated (or a similar method used for getting public input) as a
first step in updating the master plan. In updating their master plan, the township should be more
specific in outlining goals they would like to accomplish, include a future land use plan, and
outline a capital improvements program to provide a realistic look at how they will fund future
community improvements.
Greenbush does have a ―shoreline protection district.‖ This is a step in the right direction for
protecting water resources, but is not relevant to the PRVEL watershed project, as it applies only
to the Lake Huron shoreline. The ordinance also mentions soil erosion control, has good
guidelines for the procedure of dealing with variances (always a source of confusion), and
specifies a maximum amount of lot coverage for riparian lots (35%). The last standard could be
improved by changing the wording for the impervious cover section, which now reads, ―The part
or percent of the lot occupied by buildings, including accessory buildings.‖ From a watershed
management perspective, the text would be better if the provision also included driveways,
patios, decks, walkways, etc., when determining what constitutes impervious cover.
Chapter 5: Goals and Objectives
Pine River-Van Etten Lake Watershed Management Plan 5-27
Harrisville Township
Shoreline Protection District is a good start for Lake Huron (50-foot setback, 20-foot greenbelt,
30% max lot coverage). The standards for maintaining a greenbelt and the setback requirement
should both be strengthened. Most of the PRVEL watershed, however, is zoned agriculture. For
the PRVEL watershed, Van Etten Creek runs through this zoning district and could benefit from
improved zoning regulations. In addition, while Harrisville Township does have a Planned Unit
Development section that can help to maintain open space the language needs to be improved
(see the definitions section of environmental provisions: open space).
Hawes Township
The township zoning ordinance was amended in 2008. Much of the land is zoned forest-
recreation, which requires a minimum width of 200 feet (minimum lot size of one acre).
Residentially zoned areas have a minimum lot width of 80 feet and require only a 40-foot
setback from the water. Hawes includes some headwaters areas of streams in the PRVEL
watershed. Due to the importance of managing the upper reaches of streams in order to
effectively maintain water quality in the entire watershed, the township should place more
emphasis on water resources when they update their master plan and zoning ordinance.
Haynes Township
Haynes has a very minor amount of acreage within the PRVEL watershed. Their zoning
ordinance (1972, amended 2008) is very brief and in need of review and update by the planning
commission. In the Haynes file at the County Building, a handwritten note is attached to the
zoning ordinance which reads, ―Lakefront setback now depends on the ‗soil erosion act.‘‖ This
provision is not sufficient for water resource protection and is misleading. One hopes that
someone attempting to develop their property would contact the County Soil Erosion Officer
who could not only outline the soil erosion control requirements but also make sure they return
to the township for appropriate guidance regarding zoning standards (the soil erosion program is
not intended to replace a well thought out zoning ordinance).
Mikado Township
Mikado Township‘s 2007 zoning ordinance now includes sections on shoreline greenbelts and
setbacks. The greenbelt section requires 70% of the lot width at the water line to remain in its
natural vegetated state (excepting boat launches, docks, etc.), no burning or composting in the
greenbelt, and no dredging or filling except with a permit. The setback section sets a 75-foot
setback for all main buildings and covered decks, 25 feet for patios and ground decking, and no
dredging or filling in floodplains. In July 2002 Mikado Township adopted a new comprehensive
master plan. Within that document are many recommendations (based on input from township
residents) that have implications for the watershed. Perhaps most notably are the
recommendations that the township do the following:
Develop a waterfront overlay district in the zoning ordinance that will set forth
special requirements and standards for development in these sensitive areas adjacent
to streams.
Implement groundwater protection and stormwater management regulations in the
zoning ordinance, while encouraging the continued natural use of wetlands as
groundwater recharge, stormwater filtering and stormwater holding areas.
Chapter 5: Goals and Objectives
Pine River-Van Etten Lake Watershed Management Plan 5-28
Maintain greenbelt areas adjacent to lakes, ponds, streams, and wetlands through
development of a greenbelt section in the zoning ordinance.
Consider the adoption of a septic system maintenance ordinance to protect and
improve water quality.
Work cooperatively with adjacent townships in providing guidance and input on
zoning decisions that impact the township.
Utilize the proactive master planning process as a check and balance on decision
making.
Develop open space residential and commercial development design standards to
preserve scenic views, rural character, farmland, meadows, woodlands, steep slopes
and wetlands with a target of preserving 50% of the land within a development.
Additionally, comments from the September 25, 2001 township input-gathering workshop
indicate a need for consistent enforcement and better local support for zoning (Mikado Township
Master Plan, 6-1, 2002).
From a watershed management perspective, if Mikado Township has successfully implemented
their own recommendations from the master plan into guidelines within the zoning ordinance
(which is how the process should work), they have taken a big step in protecting resources for
the future.
Millen Township
The current Millen Township Zoning Ordinance was adopted in 2008. The current ordinance
does emphasize water resource protection within its Resort-Residential Zone, with adequate
standards for maintaining a greenbelt zone. Millen‘s ordinance does put a 30% maximum on lot
coverage (impervious surfaces), although this standard is short and does not include
requirements for vegetation. Improving the text within this section would be a pro-active move
for accomplishing the goals in their master plan.
Gustin Township
The two-page master plan for Gustin Township should be updated to better represent the needs
of the region, input from residents, documentation of current conditions, present a future land use
plan, and outline clear goals for the township. The zoning ordinance (1982) also needs to be
updated by the township planning commission. Along the waterfront, Gustin requires a 40-foot
setback and a minimum lot width of 100 feet.
Village of Lincoln
The zoning ordinance for the village was adopted in 1996. Occupying very little acreage in the
PRVEL watershed, Lincoln nevertheless does include two small lakes. These lakes are zoned
residential use (although the zoning ordinance unfortunately does not include a copy of the
zoning map), with a shoreline setback of 25 feet for homes and a minimum lot size of 65 feet.
The Village also has a requirement on amount of impervious surface (25%) for the ―building
area.‖ One is left to assume that this does not include walkways, driveways, etc.
Oscoda Township

Chapter 5: Goals and Objectives
Pine River-Van Etten Lake Watershed Management Plan 5-29
Within the PRVEL watershed, Oscoda has some of the most up-to-date information and has
made protection of water resources a priority. The ordinance has an adequate section on
managing stormwater runoff, a comprehensive section on the natural rivers program for the
Au Sable part of the township, and is currently incorporating provisions for open space
preservation.
Ordinance language should be improved for the section on vegetative buffers, which currently
states, ―No more than 25% of the vegetation and tree cover can be removed in the thinning
process.‖ While the intent of a greenbelt ordinance is obvious, the specific language is vague
enough that one could ask of the above statement: is that each year, or every time there is a
thinning, or every time the property changes hands, or total? Someone not following the intent of
this section could degrade their greenbelt to next to nothing. In addition, the greenbelt section
currently allows the zoning board to approve cutting in excess of 25%, provided two conditions
are met: 1) It will not cause erosion, and 2) It will not adversely affect the neighbors. The intent
of the greenbelt section, however, is not only to reduce erosion and please the neighbors, but to
provide natural habitat, slow runoff, and filter nutrients. The conditions for getting around the
ordinance should be changed to ensure that runoff control and nutrient filtration are still provided
for and are addressed by the property owner proposing to exceed the maximum amount of
thinning. In addition, the current waterfront building setback requirement of 25 feet essentially
leads to the situation whereby the home is located within the greenbelt. By the time construction
of the home is complete, the greenbelt is generally destroyed. (It is much easier to maintain in
the first place than restore.) Beyond simply the loss of natural vegetation, the shoreline zone is
important for the infiltration capacity the ground provides. This capacity is severely degraded
(particularly on a lakeside lot that is only 80 feet wide to begin with) when a structure is so close
to shore.
Oscoda is the one township in the watershed that is not a part of Alcona County, but it would
most certainly benefit from other townships in the PRVEL watershed doing a more effective job
of using zoning to protect water resources, since all of the land in this watershed eventually
drains to Van Etten Lake in Oscoda Township.
Pine River-Van Etten Lake Watershed Management Plan 6-1
I. INTRODUCTION
A. In General
The long-term protection of the Pine River-Van Etten Lake watershed will depend on the values
and actions of future generations. Educating the residents and riparian property owners of the
Pine River-Van Etten Lake watershed about how their actions influence water quality is a high
priority with the Pine River-Van Etten Lake Steering Committee. Increasing awareness and
ultimately changing behaviors is a long-term strategy for restoring and protecting water quality.
An information and education (I&E) strategy is a tool that informs the public and motivates them
to take action. It is a coordinated strategy tailored to both the specific water quality concerns and
the people who live in the watershed.
An I&E strategy is effective because most behavioral changes that are required to minimize or
eliminate pollution in the watershed will be voluntary—rather than required by law. Before
individuals will consider changing their behavior, they need to understand the concerns for the
watershed and how their individual activities can help protect the quality of water in the region.
The (I&E) activities will involve a variety of approaches including installing demonstration sites,
building partnerships, sponsoring seminars and distributing education materials.
B. Summary of Outreach Activities
Some of the information and education activities that have already been implemented as part of
the watershed planning efforts include:
Presentations of the Pine River-Van Etten Lake watershed project to Alcona Elementary
School, Glennie Elementary School, Oscoda High School, Spring Arbor University, Van
Etten Lake Association, the Michigan Lakes and Streams Association, Alcona Conservation
District, and Iosco Conservation District.
Promotion of the Pine River-Van Etten Lake watershed project at the Alcona County Fair
and the Oscoda Home and Garden Show.
Participation in the Michigan Lakes and Streams Association High School Macroinvertebrate
Stream Survey Project with Oscoda High School.
Publication and distribution of a Pine River-Van Etten Lake watershed project brochure.
Watershed Interpretive Signs placed throughout the Huron National Forest part of the
watershed in cooperation with the USDA Forest Service.
Chapter Six: Information and Education Strategy

Chapter 6: Information and Education Strategy
Pine River-Van Etten Lake Watershed Management Plan 6-2
A distinctive Pine River-Van Etten Lake Watershed Coalition logo design and use.
Publication of quarterly newsletter Watershed World.
Purchase of a tabletop display and replaceable panels with general watershed and water
quality information on them.
Bulk mailing to all Van Etten Lake property owners regarding watershed and shoreline
stewardship.
Numerous articles regarding the watershed project in the Alpena News, Alcona County
Review and the Oscoda Press.
A dedicated web page on Huron Pines website (www.huronpines.org).
Two watershed seminars—one on shoreline stewardship for lakefront landowners, and one
focused on river stewardship for agricultural landowners. Both workshops included
demonstrations of on-the-ground projects to protect the watershed.
C. Community Education
After review of the goals and objectives, resource inventories and water quality study, as well as
the prioritized list of pollutants and sources, the Pine River-Van Etten Lake Watershed Steering
Committee identified a number of groups whose active support will be important in addressing
watershed implementation and restoration activities. The Watershed Target Audiences were
prioritized based upon the impact of the pollution source and the relative acceptance of the
message by the proposed target audience. Table 6.1 lists the specific target audiences identified
by the Steering Committee.
Agricultural owners with livestock, particularly those within the Van Etten Creek subwatershed,
should be made aware of the impact unrestricted livestock have on the creek’s water quality. As
this stream is on the Department of Environmental Quality’s Non Attainment list, the message of
reduction of nutrient loading to the water by limiting cattle access to it has been given first
priority. Additionally, the agricultural inventory results and staff discussions with members of
the agricultural community indicate that not all livestock producers readily embrace this
message.
The results of the water quality study on the watershed revealed that the output of dissolved
phosphorus levels in Van Etten Lake are higher than the inputs at the mouth of the Pine River.
This indicates that pollutant sources are being added from around the lake. Septic systems
leeching pollutants to the groundwater can contribute to an overabundance of phosphorus in the
lake. Information and education regarding the negative impact riparian septic systems have on
water quality and the actions by lakefront owners that can reduce that impact need to be
introduced. Public participation in Steering Committee meetings suggests that lakefront owners
are willing to be proactive in protecting water quality, but need specific guidance to make
informed “lake friendly” decisions.
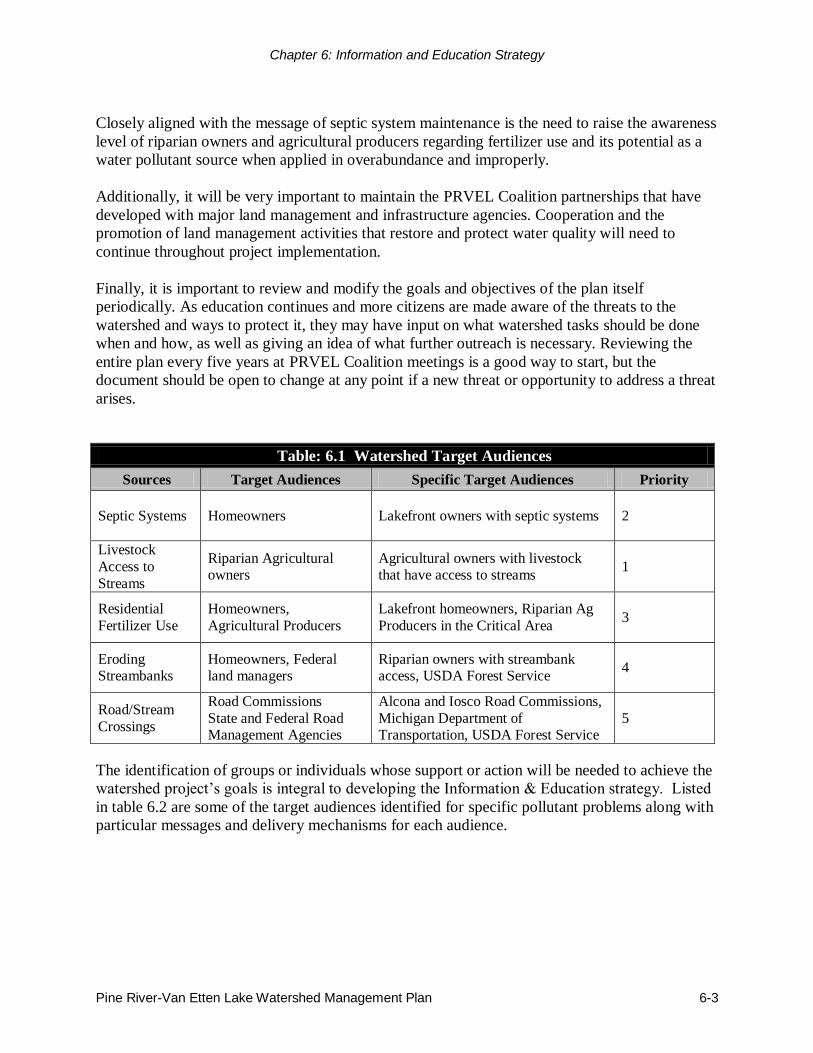
Chapter 6: Information and Education Strategy
Pine River-Van Etten Lake Watershed Management Plan 6-3
Closely aligned with the message of septic system maintenance is the need to raise the awareness
level of riparian owners and agricultural producers regarding fertilizer use and its potential as a
water pollutant source when applied in overabundance and improperly.
Additionally, it will be very important to maintain the PRVEL Coalition partnerships that have
developed with major land management and infrastructure agencies. Cooperation and the
promotion of land management activities that restore and protect water quality will need to
continue throughout project implementation.
Finally, it is important to review and modify the goals and objectives of the plan itself
periodically. As education continues and more citizens are made aware of the threats to the
watershed and ways to protect it, they may have input on what watershed tasks should be done
when and how, as well as giving an idea of what further outreach is necessary. Reviewing the
entire plan every five years at PRVEL Coalition meetings is a good way to start, but the
document should be open to change at any point if a new threat or opportunity to address a threat
arises.
Table: 6.1 Watershed Target Audiences
Sources Target Audiences Specific Target Audiences Priority
Septic Systems Homeowners Lakefront owners with septic systems 2
Livestock
Access to
Streams
Riparian Agricultural owners
Agricultural owners with livestock that have access to streams
1
Residential
Fertilizer Use
Homeowners,
Agricultural Producers
Lakefront homeowners, Riparian Ag
Producers in the Critical Area 3
Eroding Streambanks
Homeowners, Federal land managers
Riparian owners with streambank access, USDA Forest Service
4
Road/Stream
Crossings
Road Commissions
State and Federal Road Management Agencies
Alcona and Iosco Road Commissions,
Michigan Department of Transportation, USDA Forest Service
5
The identification of groups or individuals whose support or action will be needed to achieve the
watershed project’s goals is integral to developing the Information & Education strategy. Listed
in table 6.2 are some of the target audiences identified for specific pollutant problems along with
particular messages and delivery mechanisms for each audience.
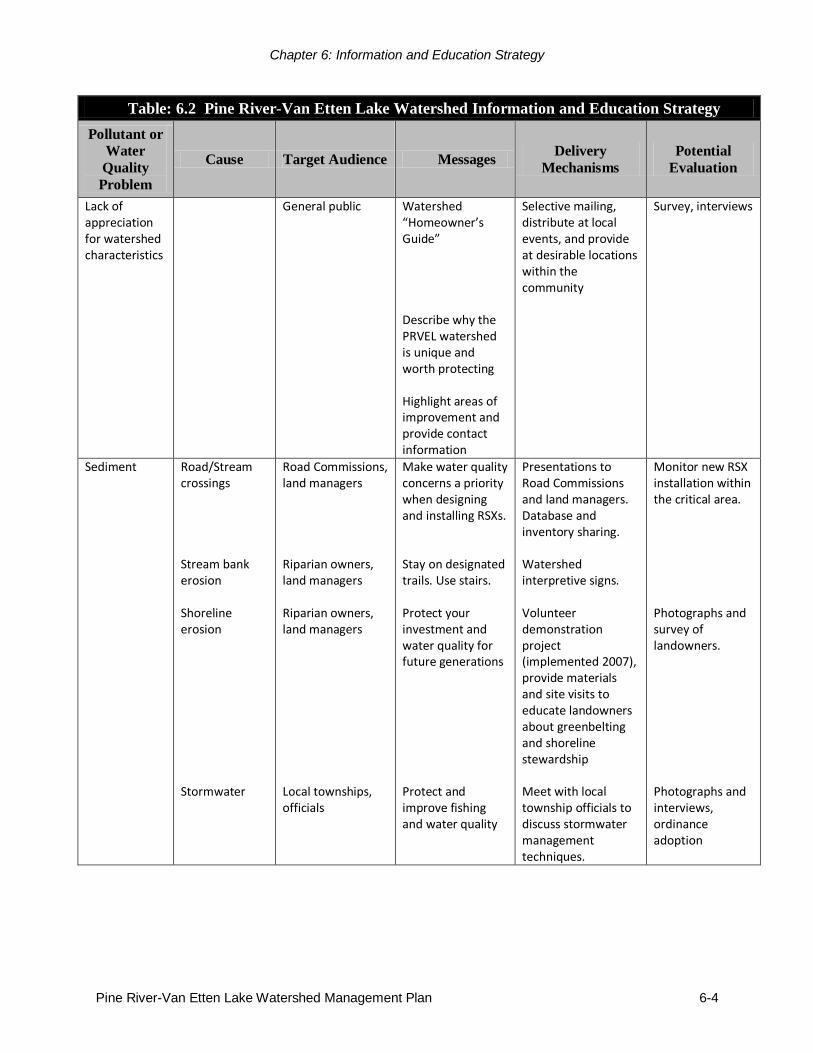
Chapter 6: Information and Education Strategy
Pine River-Van Etten Lake Watershed Management Plan 6-4
Table: 6.2 Pine River-Van Etten Lake Watershed Information and Education Strategy
Pollutant or
Water
Quality
Problem
Cause Target Audience Messages Delivery
Mechanisms
Potential
Evaluation
Lack of appreciation for watershed characteristics
General public Watershed “Homeowner’s Guide” Describe why the PRVEL watershed is unique and worth protecting Highlight areas of improvement and provide contact information
Selective mailing, distribute at local events, and provide at desirable locations within the community
Survey, interviews
Sediment Road/Stream crossings Stream bank erosion Shoreline erosion Stormwater
Road Commissions, land managers Riparian owners, land managers Riparian owners, land managers Local townships, officials
Make water quality concerns a priority when designing and installing RSXs. Stay on designated trails. Use stairs. Protect your investment and water quality for future generations Protect and improve fishing and water quality
Presentations to Road Commissions and land managers. Database and inventory sharing. Watershed interpretive signs. Volunteer demonstration project (implemented 2007), provide materials and site visits to educate landowners about greenbelting and shoreline stewardship Meet with local township officials to discuss stormwater management techniques.
Monitor new RSX installation within the critical area. Photographs and survey of landowners. Photographs and interviews, ordinance adoption
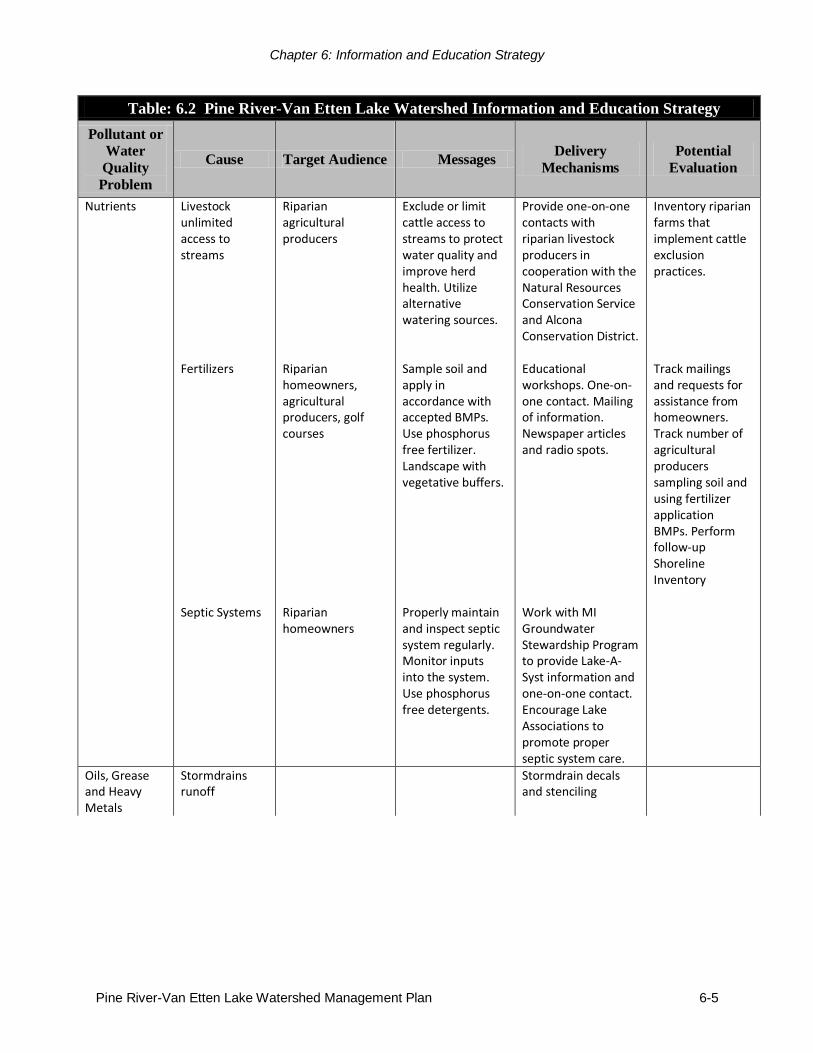
Chapter 6: Information and Education Strategy
Pine River-Van Etten Lake Watershed Management Plan 6-5
Table: 6.2 Pine River-Van Etten Lake Watershed Information and Education Strategy
Pollutant or
Water
Quality
Problem
Cause Target Audience Messages Delivery
Mechanisms
Potential
Evaluation
Nutrients
Livestock unlimited access to streams Fertilizers Septic Systems
Septic
Riparian agricultural producers Riparian homeowners, agricultural producers, golf courses Riparian homeowners
Exclude or limit cattle access to streams to protect water quality and improve herd health. Utilize alternative watering sources. Sample soil and apply in accordance with accepted BMPs. Use phosphorus free fertilizer. Landscape with vegetative buffers. Properly maintain and inspect septic system regularly. Monitor inputs into the system. Use phosphorus free detergents.
Provide one-on-one contacts with riparian livestock producers in cooperation with the Natural Resources Conservation Service and Alcona Conservation District. Educational workshops. One-on-one contact. Mailing of information. Newspaper articles and radio spots. Work with MI Groundwater Stewardship Program to provide Lake-A-Syst information and one-on-one contact. Encourage Lake Associations to promote proper septic system care.
Inventory riparian farms that implement cattle exclusion practices. Track mailings and requests for assistance from homeowners. Track number of agricultural producers sampling soil and using fertilizer application BMPs. Perform follow-up Shoreline Inventory
Oils, Grease and Heavy Metals
Stormdrains runoff
Stormdrain decals and stenciling
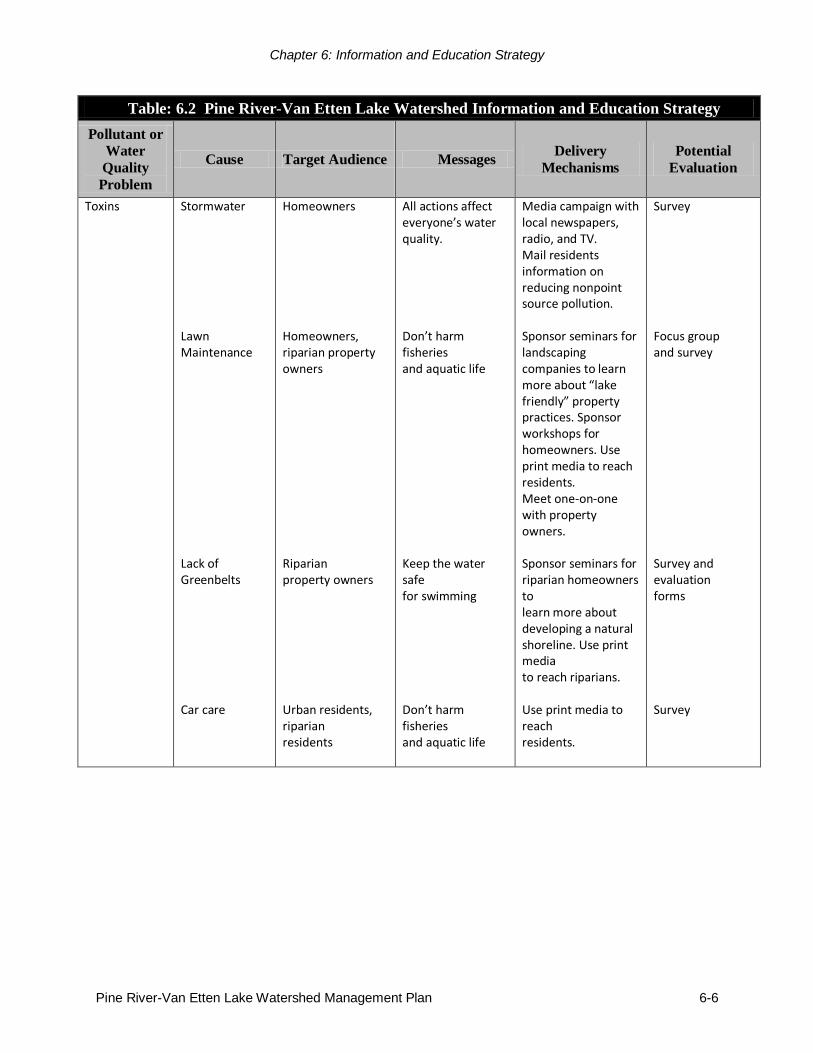
Chapter 6: Information and Education Strategy
Pine River-Van Etten Lake Watershed Management Plan 6-6
Table: 6.2 Pine River-Van Etten Lake Watershed Information and Education Strategy
Pollutant or
Water
Quality
Problem
Cause Target Audience Messages Delivery
Mechanisms
Potential
Evaluation
Toxins
Stormwater Lawn Maintenance Lack of Greenbelts Car care
Homeowners Homeowners, riparian property owners Riparian property owners Urban residents, riparian residents
All actions affect everyone’s water quality. Don’t harm fisheries and aquatic life Keep the water safe for swimming Don’t harm fisheries and aquatic life
Media campaign with local newspapers, radio, and TV. Mail residents information on reducing nonpoint source pollution. Sponsor seminars for landscaping companies to learn more about “lake friendly” property practices. Sponsor workshops for homeowners. Use print media to reach residents. Meet one-on-one with property owners. Sponsor seminars for riparian homeowners to learn more about developing a natural shoreline. Use print media to reach riparians. Use print media to reach residents.
Survey Focus group and survey Survey and evaluation forms Survey
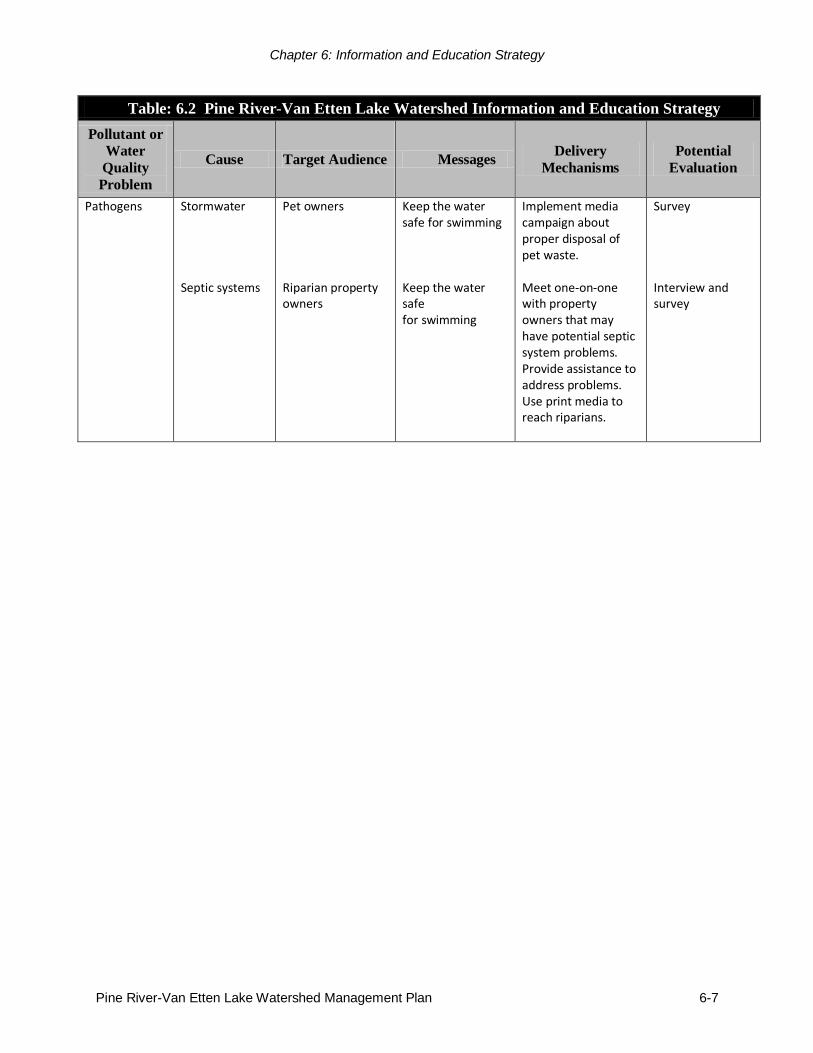
Chapter 6: Information and Education Strategy
Pine River-Van Etten Lake Watershed Management Plan 6-7
Table: 6.2 Pine River-Van Etten Lake Watershed Information and Education Strategy
Pollutant or
Water
Quality
Problem
Cause Target Audience Messages Delivery
Mechanisms
Potential
Evaluation
Pathogens
Stormwater Septic systems
Pet owners Riparian property owners
Keep the water safe for swimming Keep the water safe for swimming
Implement media campaign about proper disposal of pet waste. Meet one-on-one with property owners that may have potential septic system problems. Provide assistance to address problems. Use print media to reach riparians.
Survey Interview and survey

Pine River-Van Etten Lake Watershed Management Plan 7-1
A. Evaluating the Success of the Watershed Planning Project
The Pine River-Van Etten Lake watershed management plan is intended to set forth the strategies
and actions to restore and protect the integrity of the river system and it is important to
periodically evaluate the implementation efforts to determine 1) whether the project is on track
and the tasks are implemented in a timely manner and 2) whether the projects are successful in
restoring and protecting water resources and that funds are spent wisely. A focus group
comprised of PRVEL Coalition members will meet once a year to discuss whether or not the
plan is being implemented and determine what can be done to improve the implementation
process.
Possible methods of evaluating whether a strategy is actually successful are such things as before
and after photographs, fish surveys, a before and after survey of property owner awareness,
before and after water quality testing, documentation of water quality trends through a long‐term
monitoring program, and replicating the field inventories several years from the initial inventory.
The majority of the Pine River-Van Etten Lake watershed is considered “high quality,” meaning
that all of the designated uses are being met. The one exception to that high quality is the
tributary Van Etten Creek. Van Etten Creek is listed as an impaired watershed based on its
nutrient load. The strategies are, therefore, based on the aspects of watershed management that
protect and preserve the resource where it is in good condition and to focus on cleaning and
restoring the water quality in Van Etten Creek.
In cases where erosion has been identified, monitoring the water quality benefits can be fairly
easy. It is known how much nonpoint pollution is entering the river at each site and the
effectiveness of the chosen best management practices to reduce the pollution. Huron Pines staff
conducted before and after stream assessments and photographs to document the reduction of
pollution from the site. However, when managerial and educational practices are implemented
measuring the water quality benefits becomes much more difficult, even though in the long term
they are the solution to protecting water quality in a more cost‐effective manner. It is difficult to
identify changes in behavior, but indicators like increased volunteerism and attendance at
workshops would indicate a higher level of interest in the watershed, hopefully equating to
changing behaviors. Improvements in land use policies such as increasing setbacks, mandatory
greenbelt ordinances and septic inspections also indicate a higher level of interest in protecting
the water resources.
Finally, the ultimate measure of success of the water quality strategies set forth in the plan would
be achieved when Van Etten Creek is removed from the 303(d) list. By meeting the goals of
attainment, Van Etten Creek would prove to have been restored to water quality levels approved
by the state for all designated uses.
B. Monitoring Programs
1. Current Monitoring and Watershed Needs
Chapter Seven: Evaluation of Implementation Strategies
Chapter 7: Evaluation of Implementation Strategies
Pine River-Van Etten Lake Watershed Management Plan 7-2
Monitoring change in the condition of streams can be done both on a point/site basis as well as
more of a watershed-wide approach. As mentioned above, the point/site monitoring can be done
easily with before and after stream assessments, loading calculations with new measurements,
and photographs. In addition to evaluating these point/site implementation efforts, it is also
important to monitor conditions over the whole watershed to determine the effectiveness of
implementation over time.
Several efforts currently exist to monitor the condition of the Pine River-Van Etten Lake
watershed. Fisheries surveys, performed by the Michigan Department of Natural Resources,
document the condition of the river system and the fishery it supports. The Michigan Department
of Environment Quality continues to monitor the watershed for changes in biological and
chemical conditions throughout the watershed on their 5-year rotating schedule. As the DEQ
replicates the biological and chemical surveys, results will be compared to the previous study to
determine if water quality has improved, remained the same, or declined. Comparing data
collected in past studies to data from future studies will provide an overall watershed indicator of
water quality.
Unique to the Pine River-Van Etten Lake watershed is that the active volunteers and members of
the PRVEL Coalition have been continuing to make progress on developing and implementing
their own watershed-wide monitoring programs. One active coalition volunteer, who also serves
as the Lake Monitor for Van Etten Lake for the Cooperative Lakes Monitoring Program, has
been collecting data on E. coli, Escherichia coli, throughout the watershed. His goal is to create a
collection of baseline data, against which changes in the condition of the watershed can be
compared.
Most recently, the PRVEL Coalition, in partnership with Huron Pines, has been awarded a full
grant, by the Michigan Clean Water Corps (MiCorps), to begin assessing water quality through a
volunteer-based aquatic macroinvertebrate sampling program. This program will focus on
collecting aquatic macroinvertebrates and capturing data on the species present and their
abundance and the habitat type. That data will be entered into a state-wide database of volunteer
stream monitoring results. Changes in water quality will be reflected in the aquatic
macroinvertebrate communities at each site. Those changes will become evident as species
presence and abundance change. At that time, volunteers have the ability to compare new data to
previous sampling events. In the case of the aquatic macroinvertebrate community reflecting a
change towards decreasing water quality, volunteers will notify state government agencies,
which can look into possible causes of that change. As sampling events continue, volunteers will
be able to maintain an awareness of the water quality and assess improvements and/or the
preservation of current levels.
Finally, another method for involving volunteers in the monitoring process, the DEQ provided
training to begin the monitoring strategy of the Bank Erosion Hazard Index, or BEHI. As more
volunteers are trained to implement the BEHI monitoring strategy, watershed-wide inventories
can be completed, as well as regular site-specific measurements, such as during each MiCorps
sampling event.
Chapter 7: Evaluation of Implementation Strategies
Pine River-Van Etten Lake Watershed Management Plan 7-3
The purpose of the watershed management plan is to maintain and enhance the water quality of
the river system. In order to evaluate the effectiveness of implementation measures over time
watershed partners will compare the results of the fishery and biological surveys as they are
repeated. The recently started volunteer-based stream monitoring will establish baseline data of
water quality, based on aquatic macroinvertebrate communities, in the watershed. Other types of
monitoring that will be coupled with the MiCorps and/or BEHI sampling events include
temperature loggers, periodic grab samples, routine sampling at identified areas of concern, and
groundwater monitoring.
Other indicators of overall watershed improvement would be to re‐inventory nonpoint erosion
sites. If there are fewer moderate and severe sites in 5 or 10 years, it would indicate that the
number one pollutant, sediment, is decreasing over time.
Sediment and nutrient input have been identified as the top pollutants of concern for the Pine
River-Van Etten Lake watershed. In order to maintain the areas of high quality, and restore the
impaired waters, implementation strategies were developed to reduce and prevent these
pollutants from entering the watershed. Monitoring procedures are also designed to evaluate
whether or not these pollutants are increasing, decreasing or remaining the same.
There are several different monitoring procedures that are useful in determining watershed health
over time. Stream geomorphology assessments, water chemistry sampling, invasive species
monitoring, social evaluation and biological sampling are the different surveys that will be used
to monitor whether the implementation strategies are protecting water quality.
2. Continuing Watershed Monitoring Efforts
a. Biological Assessment and MiCorps
Biological assessments of each watershed are completed on a five‐year cycle by the DEQ. The
objective of biological surveys is to evaluate the existing conditions of the watershed including
habitat availability and the impact on the fish and macroinvertebrate communities. Information is
gathered about the macroinvertebrate community and integrity of instream habitat conditions
according to Procedure 51 protocol methods. In addition, MiCorps sampling done yearly by
volunteers shows more nuanced trends in the populations of macroinvertebrates at the different
watershed sites. Additional biological sampling, or an increase in sampling frequency, may be
requested if changes in conditions are observed by volunteers through their monitoring
programs.
The following is a map of DEQ sampling sites and a list of sampling stations identified for the
MiCorps volunteer-based stream monitoring program. Several of these sites overlap with DEQ
sampling locations.
Pine River (South Branch)—Pine River Campground: N 44o 33’ 55” W 83
o 35’ 50”
o The reason for monitoring this site is that upstream from this site, the majority of
the river and its tributaries flow through National Forest. It is important to ensure
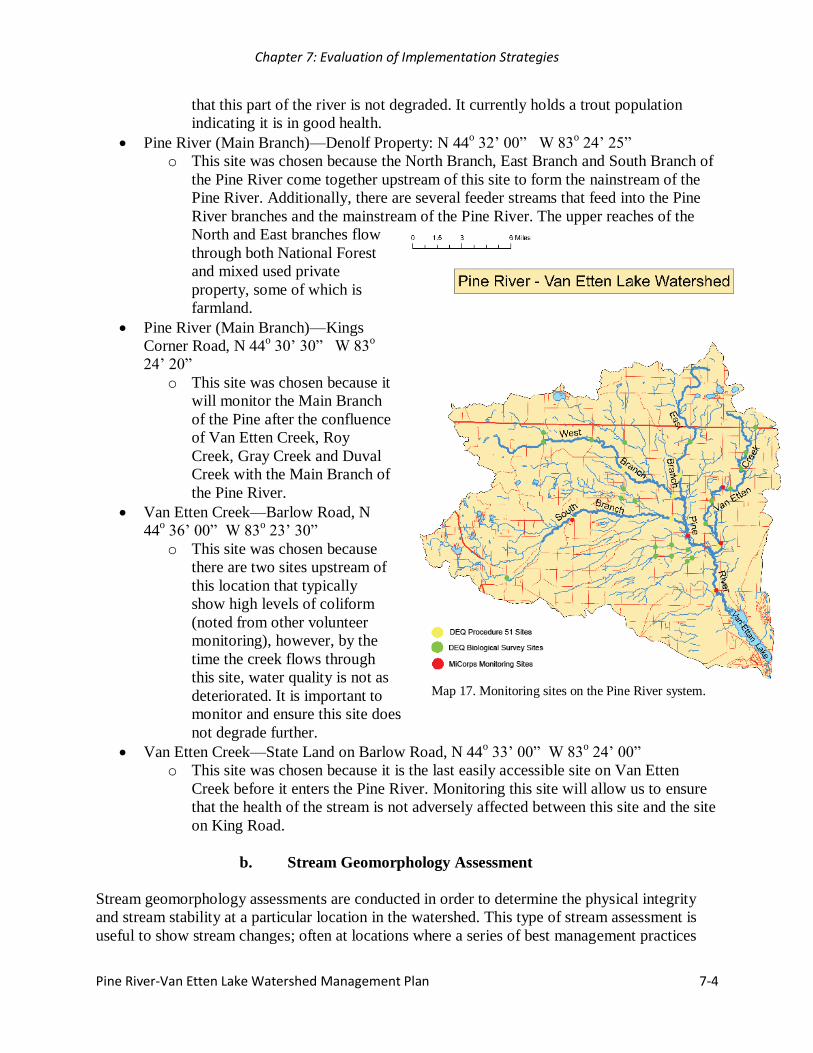
Chapter 7: Evaluation of Implementation Strategies
Pine River-Van Etten Lake Watershed Management Plan 7-4
that this part of the river is not degraded. It currently holds a trout population
indicating it is in good health.
Pine River (Main Branch)—Denolf Property: N 44o 32’ 00” W 83
o 24’ 25”
o This site was chosen because the North Branch, East Branch and South Branch of
the Pine River come together upstream of this site to form the nainstream of the
Pine River. Additionally, there are several feeder streams that feed into the Pine
River branches and the mainstream of the Pine River. The upper reaches of the
North and East branches flow
through both National Forest
and mixed used private
property, some of which is
farmland.
Pine River (Main Branch)—Kings
Corner Road, N 44o 30’ 30” W 83
o
24’ 20”
o This site was chosen because it
will monitor the Main Branch
of the Pine after the confluence
of Van Etten Creek, Roy
Creek, Gray Creek and Duval
Creek with the Main Branch of
the Pine River.
Van Etten Creek—Barlow Road, N
44o 36’ 00” W 83
o 23’ 30”
o This site was chosen because
there are two sites upstream of
this location that typically
show high levels of coliform
(noted from other volunteer
monitoring), however, by the
time the creek flows through
this site, water quality is not as
deteriorated. It is important to
monitor and ensure this site does
not degrade further.
Van Etten Creek—State Land on Barlow Road, N 44o 33’ 00” W 83
o 24’ 00”
o This site was chosen because it is the last easily accessible site on Van Etten
Creek before it enters the Pine River. Monitoring this site will allow us to ensure
that the health of the stream is not adversely affected between this site and the site
on King Road.
b. Stream Geomorphology Assessment
Stream geomorphology assessments are conducted in order to determine the physical integrity
and stream stability at a particular location in the watershed. This type of stream assessment is
useful to show stream changes; often at locations where a series of best management practices
Map 17. Monitoring sites on the Pine River system.

Chapter 7: Evaluation of Implementation Strategies
Pine River-Van Etten Lake Watershed Management Plan 7-5
have been implemented. Stream assessments should be performed by trained professionals and
can cost between $500 and $700 per site.
Parameters measured include stream dimension, channel pattern, stream profile, and bed
material. This will give a “picture” of the stream channel and help determine changes after BMPs
have been installed.
It is recommended that a stream geomorphology assessment be conducted before and after any
major road/stream or streambank improvement projects. Though not every improvement project
will have a profound impact on the physical characteristics of the stream, the stream assessments
provide another avenue to monitor the condition of the river. Other projects will have exhibited a
measurable impact on the stream after BMP installation. For example, at a poor road/stream
crossing, one would typically see an increase in sand-sized sediments in the bed material; the
river will be straightened going through the culvert; the outlet may have a plunge pool; and the
stream channel may be constricted through the culverts. Once proper BMPs are installed, a
follow‐up assessment should show a more natural stream flow through the culvert and reduced
amounts of sand-sized sediments in the bed load downstream of the crossing, indicating a
reduction in sediment-laden runoff entering the river from the approaches.
c. Chemical Water Quality Sampling
In order to determine if water quality in the Pine River-Van Etten Lake watershed is being
protected, and/or improved, it is recommended that at the very least a volunteer water quality
monitoring program be established in addition to the current volunteer programs. To do this,
specific criteria need to be established such as determining the parameters the volunteers will
test, selecting sampling location, and frequency of sampling. It has been recommended by DEQ
Water Bureau staff that parameters including chlorophyll a, total suspended solids, water
temperature, dissolved oxygen, phosphorous, and nitrates be sampled.
Chlorophyll a is a pigment that allows plants to convert sunlight into organic compounds
through the photosynthesis process. High levels of chlorophyll a typically indicate poor water
quality because it is the predominant pigment found in algae and cyanobacteria and typically
indicates the presence of algae bloom (New Chesapeake, 2006).
Total Suspended Solids (TSS) are solids in the water column that will not pass through a filter.
High levels of TSS can increase water temperatures, decrease dissolved oxygen levels and water
clarity, interfere with photosynthesis and cover gravel substrate, which is necessary for certain
species to spawn.
Water temperature often determines what type of animals live in certain waters. Trout and
stoneflies are very sensitive to high or fluctuating temperatures. Higher water temperature also
decreases the amount of dissolved oxygen in a water body; warmer water holds less oxygen than
cooler water.
Dissolved oxygen is the amount of gaseous oxygen (O2) dissolved in water. Oxygen gets into
water by diffusion from the surrounding air, by aeration (rapid movement), and as a waste

Chapter 7: Evaluation of Implementation Strategies
Pine River-Van Etten Lake Watershed Management Plan 7-6
product of photosynthesis. Adequate levels of dissolved oxygen are vital to maintaining a healthy
lake and stream ecosystem.
Phosphorous is a nutrient found in fertilizers, human and animal waste, and stormwater runoff.
It is typically the limiting nutrient in lake ecosystems. Excess phosphorous can cause algae
blooms and increased weed growth, which can choke waterways and use up large amounts of
oxygen once the plant material decomposes.
Nitrogen compounds, such as nitrates, also act as nutrients in a waterbody. As with
phosphorous, too much nitrogen can accelerate eutrophication (aging) of a waterbody. Nitrate
reactions in fresh water systems can cause oxygen depletion and possibly lead to fish kills. In
addition, high levels of nitrates in drinking water (from wells of public water supplies) can
decrease the blood’s ability to carry oxygen.
Sampling procedures vary depending on the type of information which needs to be gathered. The
following is a list of recommendations for sampling location and frequency based on the current
conditions of the watershed.
Volunteer water quality sampling should take place at least twice a year, once after spring
runoff and once during low‐flow in August. It is important that volunteers work with the
DEQ and DNR to develop a monitoring program. Water quality sampling by volunteers is
used as a screening tool for the DEQ to identify sites where more detailed sampling should
take place. It also establishes a water quality baseline for the watershed and helps promote
water resources awareness among the community.
Equipment and data would be housed by the PRVEL Coalition or Huron Pines along with the
equipment for the MiCorps program.
Regular sampling of the parameters identified above should occur at the sites selected in the
table below. Having data collected in consistent locations enables those evaluating the data to
compare results across the different monitoring programs and perhaps derive cause and affect
relationships to better guide restoration or remediation efforts. In addition to the five sites
currently used for MiCorps monitoring, to gain a better representation of the watershed
monitoring will be conducted at existing DEQ sampling stations, volunteer E. coli
monitoring sites, and the sites used during the 2002 CMU Van Etten Lake study.
d. Fecal Coliform Sampling
Fecal coliform are bacteria found in the digestive system of warm‐blooded animals, the most
common species being Escherichia coli (E. coli). The presence of fecal coliform in water
typically indicates fecal waste from humans, livestock, pets, and birds and can cause health
problems in high concentrations. It is recommended that fecal coliform be tested at least once a
year at the already-sampled 13 river system sites and 3 lake tributary sites. If levels are found
above 130 units/100 ml then more regular testing should take place and in different locations in
order to pinpoint the cause of the bacteria. There is currently a volunteer-based program focused
on measuring levels of coliform throughout the watershed. Results from the sampling efforts, or
Chapter 7: Evaluation of Implementation Strategies
Pine River-Van Etten Lake Watershed Management Plan 7-7
changes in baseline data, will drive increased involvement by state agencies to increase state
monitoring of the site.
e. Invasive Species Monitoring
Invasive species are an emerging problem in northern Michigan, brought to inland rivers, lakes
and wetlands through development and recreation. Plants like phragmites, purple loosestrife, and
buckthorn threaten wetlands while Eurasian water milfoil and hydrilla threaten aquatic systems.
Zebra and quagga mussels and a host of other invasive animals have been introduced to the Great
Lakes and are spreading inland. Because of its proximity to Lake Huron and the town of Oscoda,
the Pine River/Van Etten Lake watershed is vulnerable, but early detection and response could
mean that the watershed will have a better chance of maintaining its high quality. Monitoring for
invasives in the watershed will be easily combined with other watershed-wide monitoring like
BEHI, E. coli and water quality.
f. Social Evaluation
There are several different strategies to evaluate the effectiveness of information and education
programs. Focus groups and surveys are the primary social evaluation tools which will be
utilized. The PRVEL Coalition should serve as a focus group to analyze the effectiveness of
outreach programs. The coalition will be made up of watershed residents active in the
community. They are familiar with watershed attitudes and are getting better at understanding
how to deliver conservation messages. This is extremely important in a watershed so dominated
by a closely-knit agricultural community. Surveys will also be used to gather information about
social behaviors. Event participants and volunteers will be asked to complete a short survey
about the activity they attended. Results of these surveys will identify strengths and weaknesses
of the program and help guide future events.
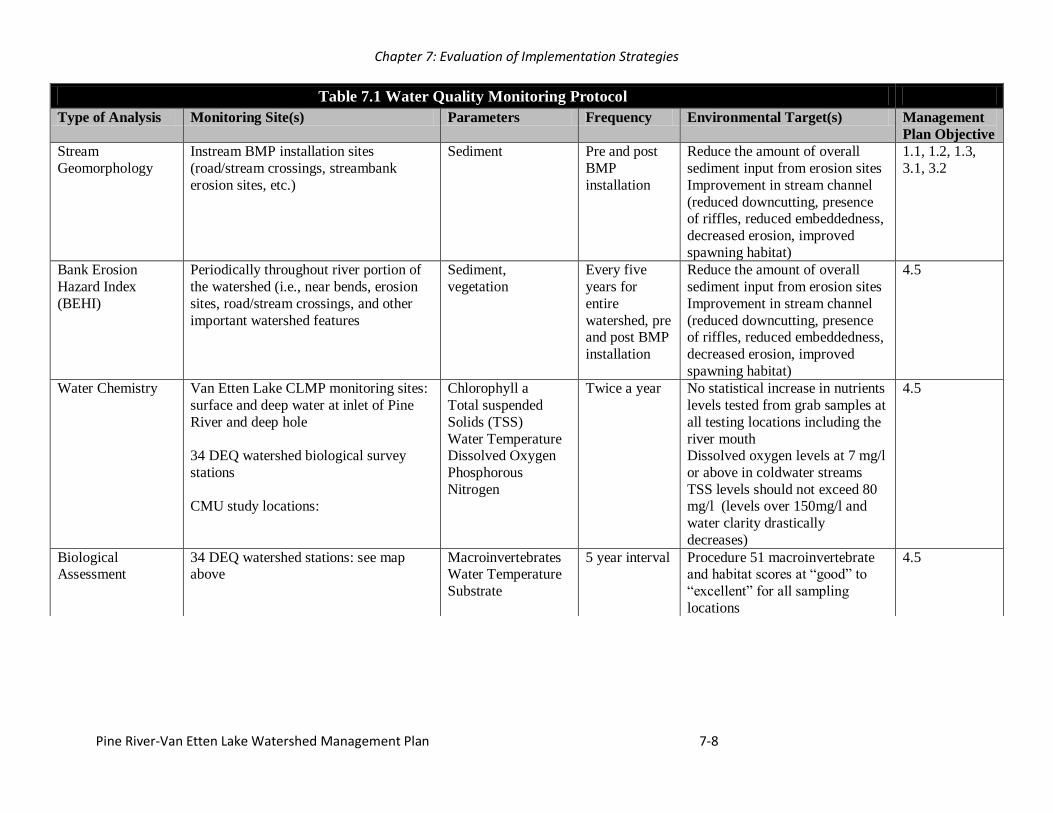
Chapter 7: Evaluation of Implementation Strategies
Pine River-Van Etten Lake Watershed Management Plan 7-8
Table 7.1 Water Quality Monitoring Protocol
Type of Analysis Monitoring Site(s) Parameters Frequency Environmental Target(s) Management
Plan Objective
Stream
Geomorphology
Instream BMP installation sites
(road/stream crossings, streambank
erosion sites, etc.)
Sediment Pre and post
BMP
installation
Reduce the amount of overall
sediment input from erosion sites
Improvement in stream channel
(reduced downcutting, presence of riffles, reduced embeddedness,
decreased erosion, improved
spawning habitat)
1.1, 1.2, 1.3,
3.1, 3.2
Bank Erosion
Hazard Index
(BEHI)
Periodically throughout river portion of
the watershed (i.e., near bends, erosion
sites, road/stream crossings, and other
important watershed features
Sediment,
vegetation
Every five
years for
entire
watershed, pre and post BMP
installation
Reduce the amount of overall
sediment input from erosion sites
Improvement in stream channel
(reduced downcutting, presence of riffles, reduced embeddedness,
decreased erosion, improved
spawning habitat)
4.5
Water Chemistry Van Etten Lake CLMP monitoring sites:
surface and deep water at inlet of Pine
River and deep hole
34 DEQ watershed biological survey
stations
CMU study locations:
Chlorophyll a
Total suspended
Solids (TSS)
Water Temperature Dissolved Oxygen
Phosphorous
Nitrogen
Twice a year No statistical increase in nutrients
levels tested from grab samples at
all testing locations including the
river mouth Dissolved oxygen levels at 7 mg/l
or above in coldwater streams
TSS levels should not exceed 80 mg/l (levels over 150mg/l and
water clarity drastically
decreases)
4.5
Biological Assessment
34 DEQ watershed stations: see map above
Macroinvertebrates Water Temperature
Substrate
5 year interval Procedure 51 macroinvertebrate and habitat scores at “good” to
“excellent” for all sampling
locations
4.5
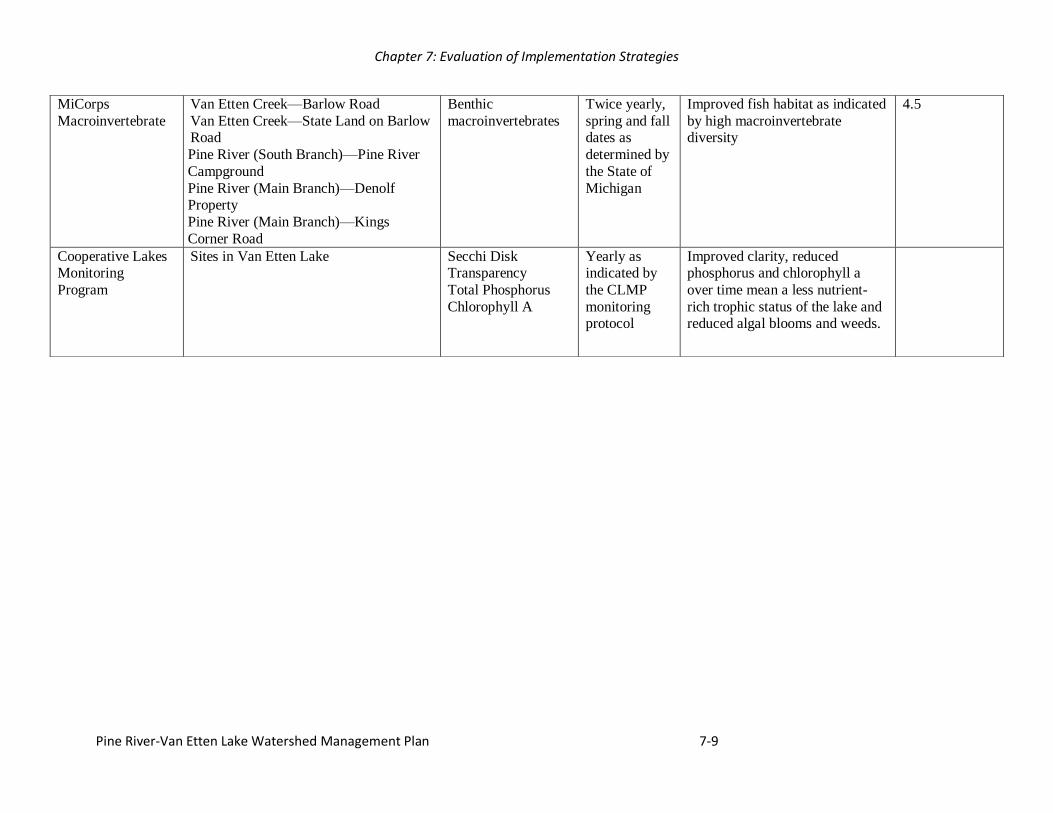
Chapter 7: Evaluation of Implementation Strategies
Pine River-Van Etten Lake Watershed Management Plan 7-9
MiCorps
Macroinvertebrate
Van Etten Creek—Barlow Road
Van Etten Creek—State Land on Barlow Road
Pine River (South Branch)—Pine River
Campground
Pine River (Main Branch)—Denolf Property
Pine River (Main Branch)—Kings
Corner Road
Benthic
macroinvertebrates
Twice yearly,
spring and fall dates as
determined by
the State of
Michigan
Improved fish habitat as indicated
by high macroinvertebrate diversity
4.5
Cooperative Lakes Monitoring
Program
Sites in Van Etten Lake Secchi Disk Transparency
Total Phosphorus
Chlorophyll A
Yearly as indicated by
the CLMP
monitoring protocol
Improved clarity, reduced phosphorus and chlorophyll a
over time mean a less nutrient-
rich trophic status of the lake and reduced algal blooms and weeds.

Chapter 7: Evaluation of Implementation Strategies
Pine River-Van Etten Lake Watershed Management Plan 7-10
Fecal Coliform River sites
Pine River @ County Line Pine River @ F-41
Pine River @ Andrews Rd.
Pine River @ Cruzen Rd.
Van Etten Crk @ Barlow Rd S Van Etten Crk @ F-41 N
Van Etten Crk @ Barlow Rd N
Van Etten Crk @ Dellar Rd. Van Etten Crk @ Clemens
Rd.
Van Etten Crk @ M-72 & McGregor
Van Etten Crk @ M-72 & Colville East Br Pine River @ F-30 East Br Pine
River @ Procunier
East Br Pine River @ M-72 & F-41 East Br Pine River @ M-72 E
East Br Pine River @ M-72 W
West Br Pine River @ Cruzen Rd.
South Br. Pine River @ campground
Lake sites
Phalen Creek @ Loud Dr. Phalen Creek @ Loud Dr.
Dry Creek @ Shoreline
E. Coli bacteria Once a year
(More frequent
testing if
levels exceed
130 units/100 ml)
Not to exceed 130 units/100 ml
over a 30 day average Note: Levels above 300 units/100
ml impair total body contact
4.5
Invasive Species Throughout watershed, in conjunction with BEHI, MiCorps, biological surveys,
and BMP installations
Invasive plants and animals
Yearly Reduce the spread of invasive aquatic and terrestrial plants and
animals
4.4
Pine River-Van Etten Lake Watershed Management Plan R-1
REFERENCES
Albert, Dennis A., Shirley R. Denton, and Burton V. Barnes. (1986) Regional Landscape
Ecosystems of Michigan. School of Natural Resources, University of Michigan.
Alcona Conservation District. (2001). Resource Assessment of the Alcona Conservation District.
Harrisville, Michigan: Author.
Beyer, A., Contant, C., & Donahue, M. (2001). Seeking Signs of Success. Boyne City,
Michigan: Harbor House.
Enviroscience, Inc. (2002). Final Progress Report for the Implementation of the Middfoil Process
of Eurasian Watermilfoil Control to the Van Etten Lake, MI. [Report]. Stow, Ohio: Author.
Fischenrich, J.C. and H.A. Allen. 2000. Stream Management. U.S. Army Corps of Engineers
Engineer Research and Development Center, Environmental Laboratory, Water Operations
Technical Support Program Special Report ERDC/EL SR-W-00-1. Vicksburg, MS.
Fusilier,W.E. (1998). Van Etten Lake Oscoda Township Iosco County 1994 Lake and 1997
Inlet Water Quality Study. [Report]. Dexter, Michigan: Author.
Griffith Foundation. 2002. Au Sable River Baseline Assessment of Urban Stormwater and
Snowmelt. Phase III. Collection, Display and Analysis of Baseline Data. Tetra Tech MPS.
Iosco Conservation District. (2001). Resource Assessment of Iosco County. Tawas City,
Michigan: Author.
Michigan Department of Natural Resources. (1992). A Biological, Sediment, and Water
Chemistry Survey of Van Etten Lake and the Au Sable River in the Vicinity of Wurtsmith
AFB Iosco County, Michigan, June 5-6, 1990. [Staff Report].
Surface Water Quality Division, Lansing, Michigan: Author.
Michigan Department of Environmental Quality. (2000). Biological Survey of the Pine River
Watershed, Alcona County, Michigan, July 14, 1997 and August 31, 1998. [Staff Report].
Surface Water Quality Division, Lansing, Michigan: Author.
Michigan Department of Environmental Quality. (2003). Biological Survey of the Pine River
Watershed, Alcona County, Michigan, July 17-18, 2002. [Staff Report].
Surface Water Quality Division, Lansing, Michigan: Author.
Michigan Department of Environmental Quality. (2008). Biological Survey of the Au Sable
River Watershed and Selected Tributaries in Crawford, Iosco, Montmorency, Oscoda,
Otsego, and Roscommon Counties, Michigan, June 11-20, 2007. [Staff Report].
Water Bureau, Lansing, Michigan: Author.

Pine River-Van Etten Lake Watershed Management Plan R-2
Michigan Department of Environmental Quality. (2003). Wellogic, the Michigan Department of
Environmental Quality Statewide Groundwater Database. [GIS Shapefile] Downloaded
5/24/05
US Census Bureau. (2002). State and County Quick Facts [On-line]. Available: Internet:
http://quickfacts.census.gov
USDA Forest Service. (1992). Proposed Riparian Management Activities for the South
Branch Pine River, McDonald Creek, Bryant Creek, Wallace Creek, Kurtz Creek, and
Unnamed Tributary Stream of T25N, R7E, Sec 11-14. Environmental Assessment, Huron-
Manistee National Forest, Michigan: Author.
USDA Natural Resources Conservation Service. (1998). Soil Survey of Alcona County,
Michigan. Washington, DC: Government Printing Office.
USDA Natural Resources Conservation Service. (2002). Soil Survey of Iosco County, Michigan.
Washington, DC: Government Printing Office
USGS National Water Information System: Web Interface U.S. Department of the Interior | U.S.
Geological Survey Title: NWIS Site Information for USA: Site Inventory URL:
http://waterdata.usgs.gov/nwis/inventory? Page Contact Information: NWISWeb Support
Team Page Last Modified: 2009-02-18 14:06:43 EST

Pine River-Van Etten Lake Watershed Management Plan a-1
ATTACHMENT 1
Watershed Partnership Agreement
Pine River-Van Etten Lake Watershed Management Plan b-1
ATTACHMENT 2
Typical Nonpoint Source Pollutants
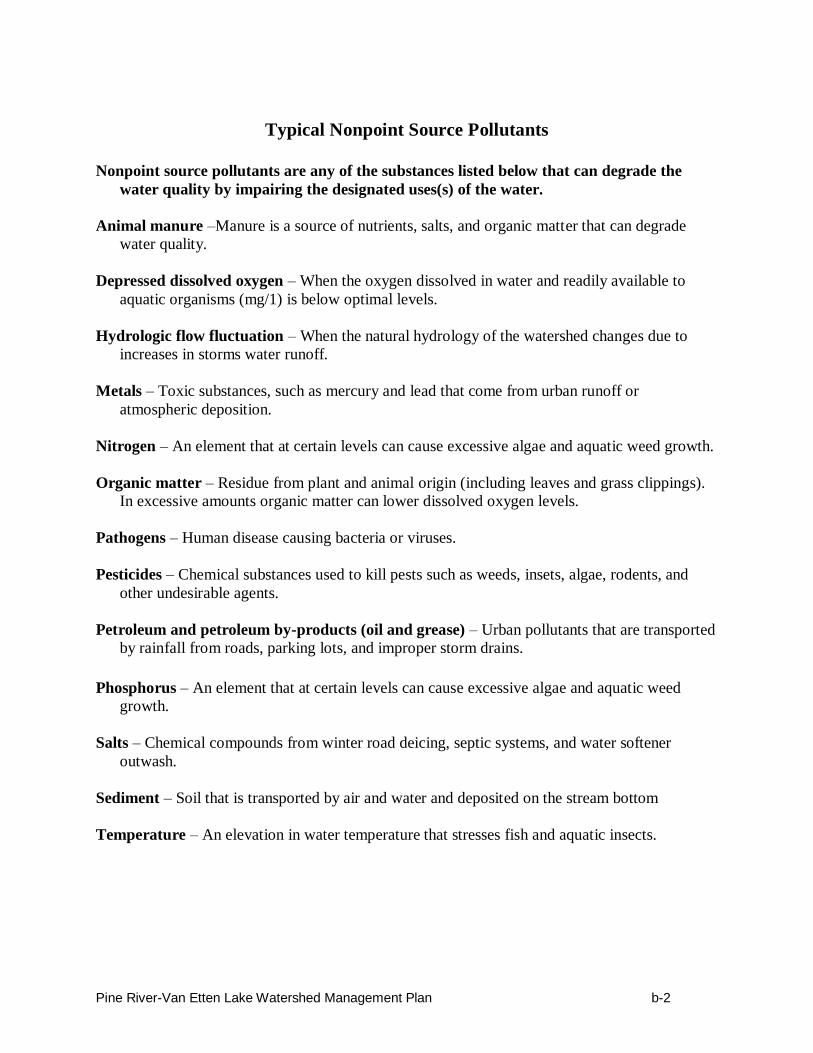
Pine River-Van Etten Lake Watershed Management Plan b-2
Typical Nonpoint Source Pollutants
Nonpoint source pollutants are any of the substances listed below that can degrade the
water quality by impairing the designated uses(s) of the water.
Animal manure –Manure is a source of nutrients, salts, and organic matter that can degrade
water quality.
Depressed dissolved oxygen – When the oxygen dissolved in water and readily available to
aquatic organisms (mg/1) is below optimal levels.
Hydrologic flow fluctuation – When the natural hydrology of the watershed changes due to
increases in storms water runoff.
Metals – Toxic substances, such as mercury and lead that come from urban runoff or
atmospheric deposition.
Nitrogen – An element that at certain levels can cause excessive algae and aquatic weed growth.
Organic matter – Residue from plant and animal origin (including leaves and grass clippings).
In excessive amounts organic matter can lower dissolved oxygen levels.
Pathogens – Human disease causing bacteria or viruses.
Pesticides – Chemical substances used to kill pests such as weeds, insets, algae, rodents, and
other undesirable agents.
Petroleum and petroleum by-products (oil and grease) – Urban pollutants that are transported
by rainfall from roads, parking lots, and improper storm drains.
Phosphorus – An element that at certain levels can cause excessive algae and aquatic weed
growth.
Salts – Chemical compounds from winter road deicing, septic systems, and water softener
outwash.
Sediment – Soil that is transported by air and water and deposited on the stream bottom
Temperature – An elevation in water temperature that stresses fish and aquatic insects.

Pine River-Van Etten Lake Watershed Management Plan A-1
APPENDIX A
Glossary of Terms
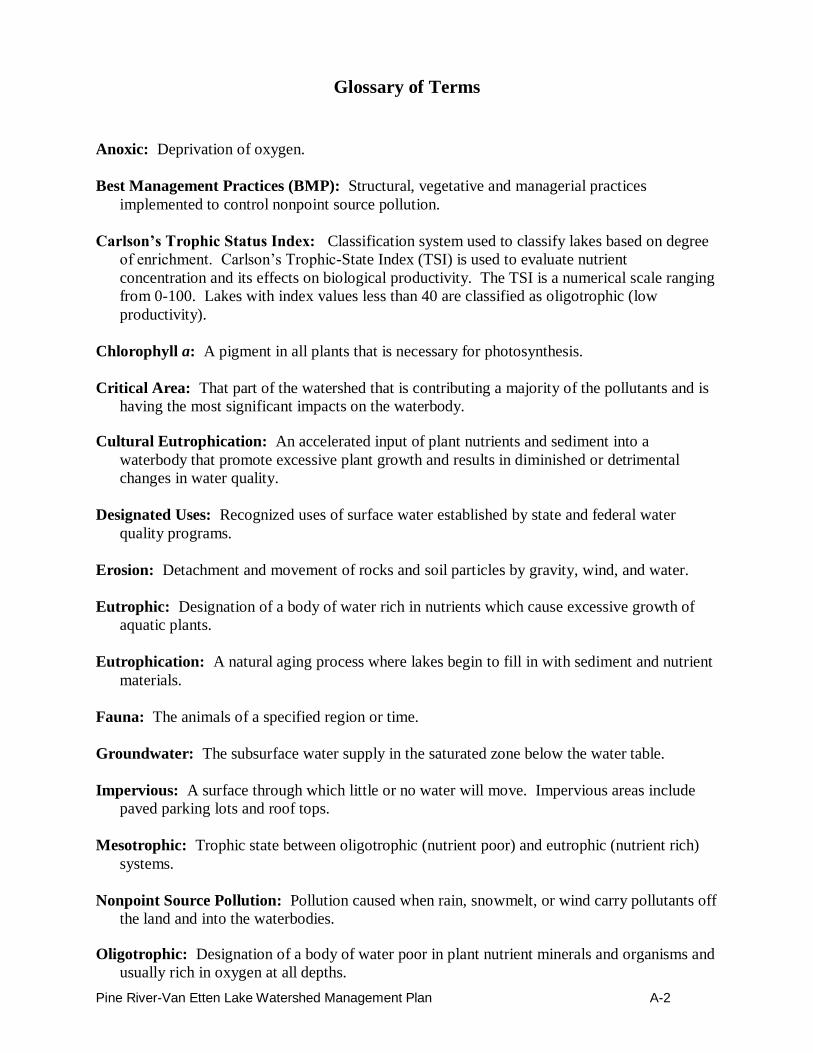
Pine River-Van Etten Lake Watershed Management Plan A-2
Glossary of Terms
Anoxic: Deprivation of oxygen.
Best Management Practices (BMP): Structural, vegetative and managerial practices
implemented to control nonpoint source pollution.
Carlson’s Trophic Status Index: Classification system used to classify lakes based on degree
of enrichment. Carlson’s Trophic-State Index (TSI) is used to evaluate nutrient
concentration and its effects on biological productivity. The TSI is a numerical scale ranging
from 0-100. Lakes with index values less than 40 are classified as oligotrophic (low
productivity).
Chlorophyll a: A pigment in all plants that is necessary for photosynthesis.
Critical Area: That part of the watershed that is contributing a majority of the pollutants and is
having the most significant impacts on the waterbody.
Cultural Eutrophication: An accelerated input of plant nutrients and sediment into a
waterbody that promote excessive plant growth and results in diminished or detrimental
changes in water quality.
Designated Uses: Recognized uses of surface water established by state and federal water
quality programs.
Erosion: Detachment and movement of rocks and soil particles by gravity, wind, and water.
Eutrophic: Designation of a body of water rich in nutrients which cause excessive growth of
aquatic plants.
Eutrophication: A natural aging process where lakes begin to fill in with sediment and nutrient
materials.
Fauna: The animals of a specified region or time.
Groundwater: The subsurface water supply in the saturated zone below the water table.
Impervious: A surface through which little or no water will move. Impervious areas include
paved parking lots and roof tops.
Mesotrophic: Trophic state between oligotrophic (nutrient poor) and eutrophic (nutrient rich)
systems.
Nonpoint Source Pollution: Pollution caused when rain, snowmelt, or wind carry pollutants off
the land and into the waterbodies.
Oligotrophic: Designation of a body of water poor in plant nutrient minerals and organisms and
usually rich in oxygen at all depths.

Pine River-Van Etten Lake Watershed Management Plan A-3
Pathogens: Human disease causing bacteria or viruses.
Pollutant: Any substance of such character and in such quantities that when it reaches a body of
water, soil, or air, it contributes to the degradation or impairment of its usefulness or renders
it offensive.
Phosphorus: A plant nutrient that is needed for processes such as growth and photosynthesis.
Increased levels can cause excessive growth of aquatic plants.
Riparian: Person who lives along or hold title to the shore area of a lake or bank of a river or
stream.
Riparian corridor: Area bordering streams, lakes, rivers, and other water courses. These areas
have high water tables and support plants requiring saturated soils during all or part of the
year.
Runoff: That portion of the precipitation or irrigation water that travels over the land surface
and ends up in surface streams or water bodies.
Secchi disk: A circular disk that can be lowered into the water to obtain an estimate of light
penetration.
Sediment: Soil, sand, and minerals which can take the form of bedload, suspended, or dissolved
material.
Slope: Ground that is not flat or level; measured as deviation from the horizontal.
Soil Erosion: The wearing away of land surface by wind or water. Erosion occurs naturally
from weather or runoff but can be intensified by land-clearing practices related to farming,
residential or industrial development, road building, or timber cutting.
Stakeholder: Any organization, governmental entity, or individual that has a stake in or may be
affected by a given approach to environmental regulation, pollution prevention, or energy
conservation.
Storm Drain (Storm Sewer): A slotted opening leading to an underground pipe or an open
ditch that carries surface runoff.
Stormwater: Runoff from a storm, snow melt runoff, and surface runoff and drainage.
Succession: The slow, regular sequence of changes in the regional development of communities
of plants and associated animals.
Surface Water: All water naturally open to the atmosphere (rivers, lakes, reservoirs, streams,
wetlands, impoundment, and seas).
Topographic Map: Land map that display elevation along with natural and man-made features.
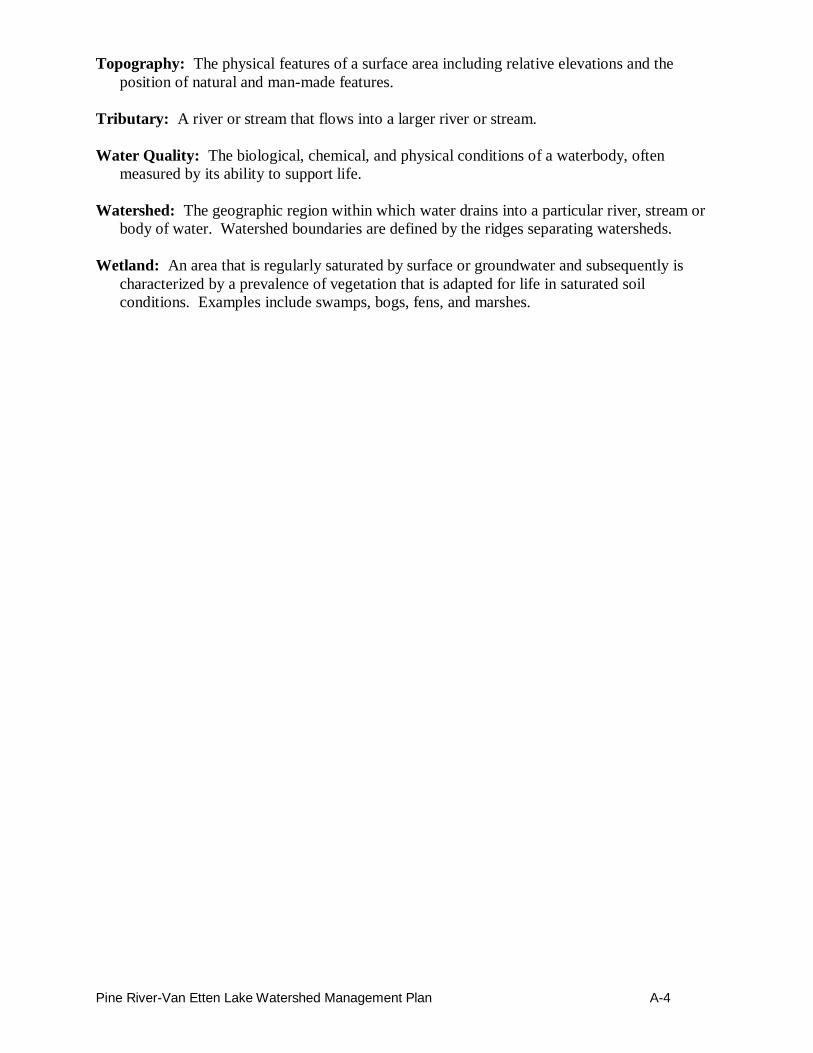
Pine River-Van Etten Lake Watershed Management Plan A-4
Topography: The physical features of a surface area including relative elevations and the
position of natural and man-made features.
Tributary: A river or stream that flows into a larger river or stream.
Water Quality: The biological, chemical, and physical conditions of a waterbody, often
measured by its ability to support life.
Watershed: The geographic region within which water drains into a particular river, stream or
body of water. Watershed boundaries are defined by the ridges separating watersheds.
Wetland: An area that is regularly saturated by surface or groundwater and subsequently is
characterized by a prevalence of vegetation that is adapted for life in saturated soil
conditions. Examples include swamps, bogs, fens, and marshes.

Pine River-Van Etten Lake Watershed Management Plan B-1
APPENDIX B
Road/Stream Crossing Inventory
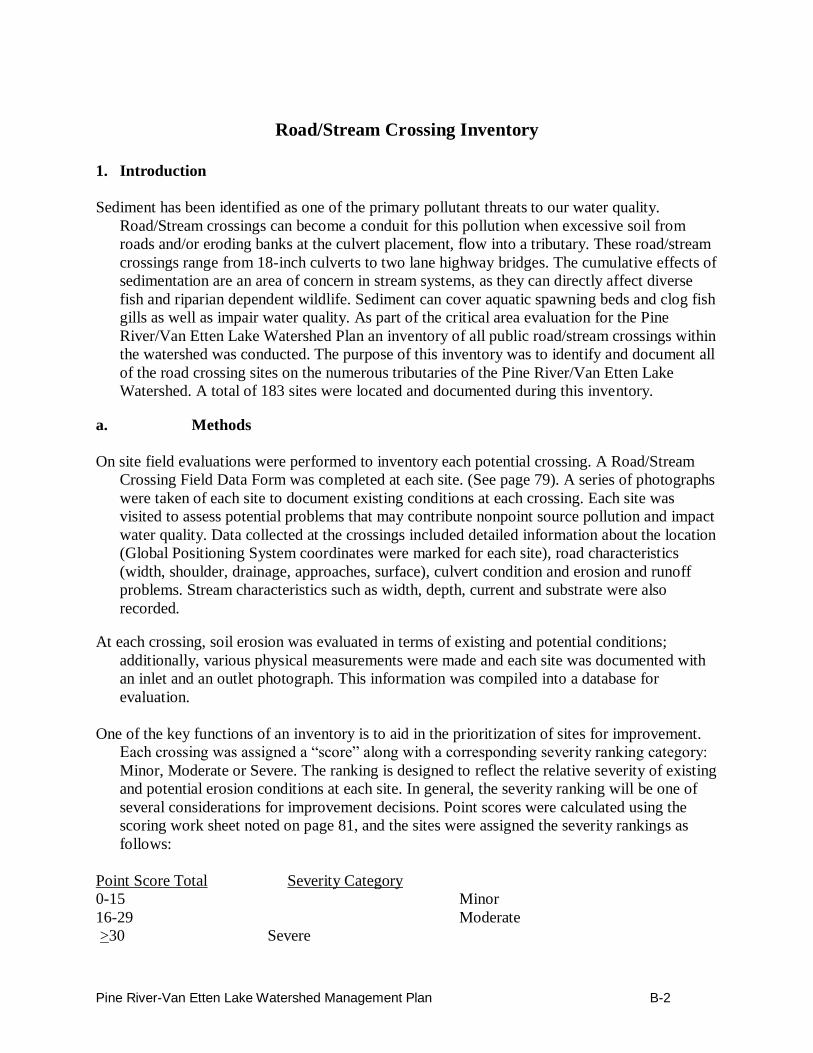
Pine River-Van Etten Lake Watershed Management Plan B-2
Road/Stream Crossing Inventory
1. Introduction
Sediment has been identified as one of the primary pollutant threats to our water quality.
Road/Stream crossings can become a conduit for this pollution when excessive soil from
roads and/or eroding banks at the culvert placement, flow into a tributary. These road/stream
crossings range from 18-inch culverts to two lane highway bridges. The cumulative effects of
sedimentation are an area of concern in stream systems, as they can directly affect diverse
fish and riparian dependent wildlife. Sediment can cover aquatic spawning beds and clog fish
gills as well as impair water quality. As part of the critical area evaluation for the Pine
River/Van Etten Lake Watershed Plan an inventory of all public road/stream crossings within
the watershed was conducted. The purpose of this inventory was to identify and document all
of the road crossing sites on the numerous tributaries of the Pine River/Van Etten Lake
Watershed. A total of 183 sites were located and documented during this inventory.
a. Methods
On site field evaluations were performed to inventory each potential crossing. A Road/Stream
Crossing Field Data Form was completed at each site. (See page 79). A series of photographs
were taken of each site to document existing conditions at each crossing. Each site was
visited to assess potential problems that may contribute nonpoint source pollution and impact
water quality. Data collected at the crossings included detailed information about the location
(Global Positioning System coordinates were marked for each site), road characteristics
(width, shoulder, drainage, approaches, surface), culvert condition and erosion and runoff
problems. Stream characteristics such as width, depth, current and substrate were also
recorded.
At each crossing, soil erosion was evaluated in terms of existing and potential conditions;
additionally, various physical measurements were made and each site was documented with
an inlet and an outlet photograph. This information was compiled into a database for
evaluation.
One of the key functions of an inventory is to aid in the prioritization of sites for improvement.
Each crossing was assigned a “score” along with a corresponding severity ranking category:
Minor, Moderate or Severe. The ranking is designed to reflect the relative severity of existing
and potential erosion conditions at each site. In general, the severity ranking will be one of
several considerations for improvement decisions. Point scores were calculated using the
scoring work sheet noted on page 81, and the sites were assigned the severity rankings as
follows:
Point Score Total Severity Category
0-15 Minor
16-29 Moderate
>30 Severe
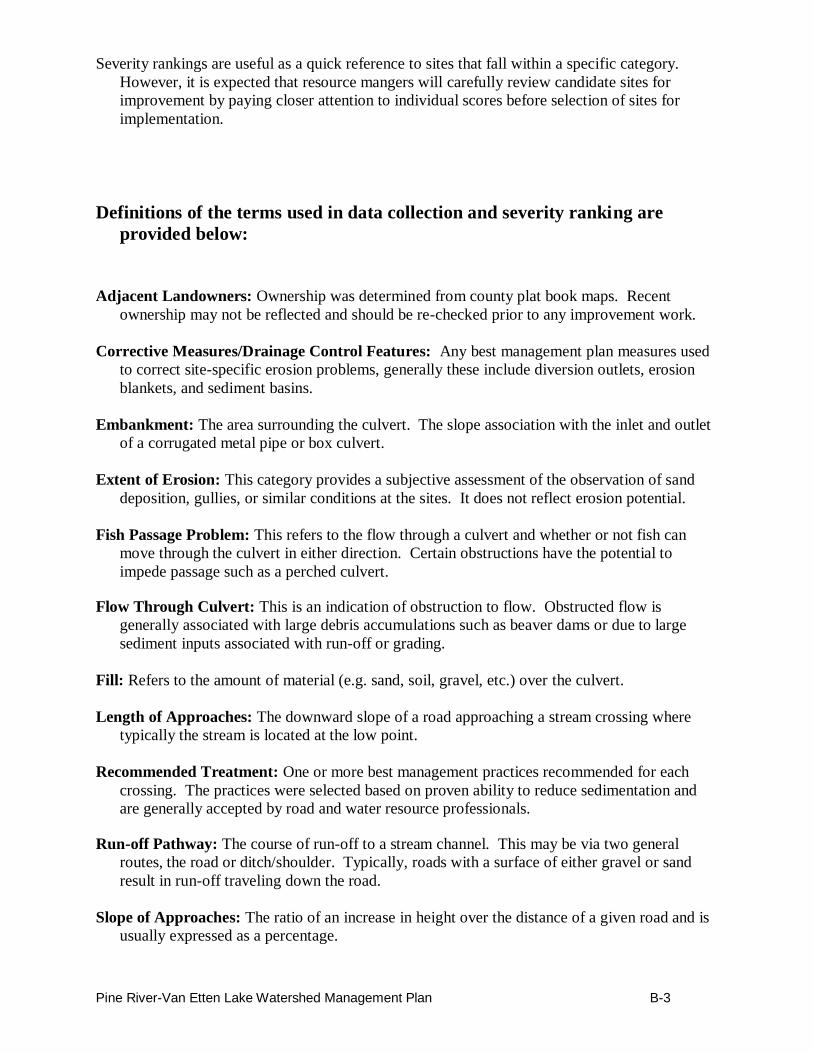
Pine River-Van Etten Lake Watershed Management Plan B-3
Severity rankings are useful as a quick reference to sites that fall within a specific category.
However, it is expected that resource mangers will carefully review candidate sites for
improvement by paying closer attention to individual scores before selection of sites for
implementation.
Definitions of the terms used in data collection and severity ranking are
provided below:
Adjacent Landowners: Ownership was determined from county plat book maps. Recent
ownership may not be reflected and should be re-checked prior to any improvement work.
Corrective Measures/Drainage Control Features: Any best management plan measures used
to correct site-specific erosion problems, generally these include diversion outlets, erosion
blankets, and sediment basins.
Embankment: The area surrounding the culvert. The slope association with the inlet and outlet
of a corrugated metal pipe or box culvert.
Extent of Erosion: This category provides a subjective assessment of the observation of sand
deposition, gullies, or similar conditions at the sites. It does not reflect erosion potential.
Fish Passage Problem: This refers to the flow through a culvert and whether or not fish can
move through the culvert in either direction. Certain obstructions have the potential to
impede passage such as a perched culvert.
Flow Through Culvert: This is an indication of obstruction to flow. Obstructed flow is
generally associated with large debris accumulations such as beaver dams or due to large
sediment inputs associated with run-off or grading.
Fill: Refers to the amount of material (e.g. sand, soil, gravel, etc.) over the culvert.
Length of Approaches: The downward slope of a road approaching a stream crossing where
typically the stream is located at the low point.
Recommended Treatment: One or more best management practices recommended for each
crossing. The practices were selected based on proven ability to reduce sedimentation and
are generally accepted by road and water resource professionals.
Run-off Pathway: The course of run-off to a stream channel. This may be via two general
routes, the road or ditch/shoulder. Typically, roads with a surface of either gravel or sand
result in run-off traveling down the road.
Slope of Approaches: The ratio of an increase in height over the distance of a given road and is
usually expressed as a percentage.
Pine River-Van Etten Lake Watershed Management Plan B-4
Stream Current: Average upstream and downstream current was observed and classified as
slow, medium, or fast.
Vegetation: Defines the presence, absence, and relative abundance/condition of existing
vegetation on the embankments of a given crossing. Generally, vegetation that is at all
disturbed by access or road grading is considered to be partial.
Wetlands: Any stand of vegetation that is typical of an area of land that is at least partially
inundated by water for part of the year.
Visible Down Cutting: This indicates the distance or drop from the base of the culvert outlet to
the surface of water.
b. Results
Of the 183-road stream crossing sites that were identified within the Pine River/Van Etten Lake
Watershed, 9 sites ranked as severe, 119 sites were ranked as moderate and 55 sites ranked as
minor. A number of common factors contributed to the severity of those sites scoring 30 or
more points. Most of the severe sites were located on relatively narrow sand roads with
lengthy and steep approaches of 6-10% slopes and vertical embankments. A number of the
sites exhibited pool formations at the culvert outlets. This pooling is attributable to flash
events of high velocity streams flows coursing through the culverts with intense erosive
power and undercutting the banks. These problem sites were found on Duval, Backus,
Gimlet, McGillis and Vandercook Creeks, as well as one site on the West Branch and two
near Sprinkler Lake. The problematic condition of sites inventoried is based predominately
on road conditions, culvert size and placement, as described above. Individual sites data may be found starting on page 82.
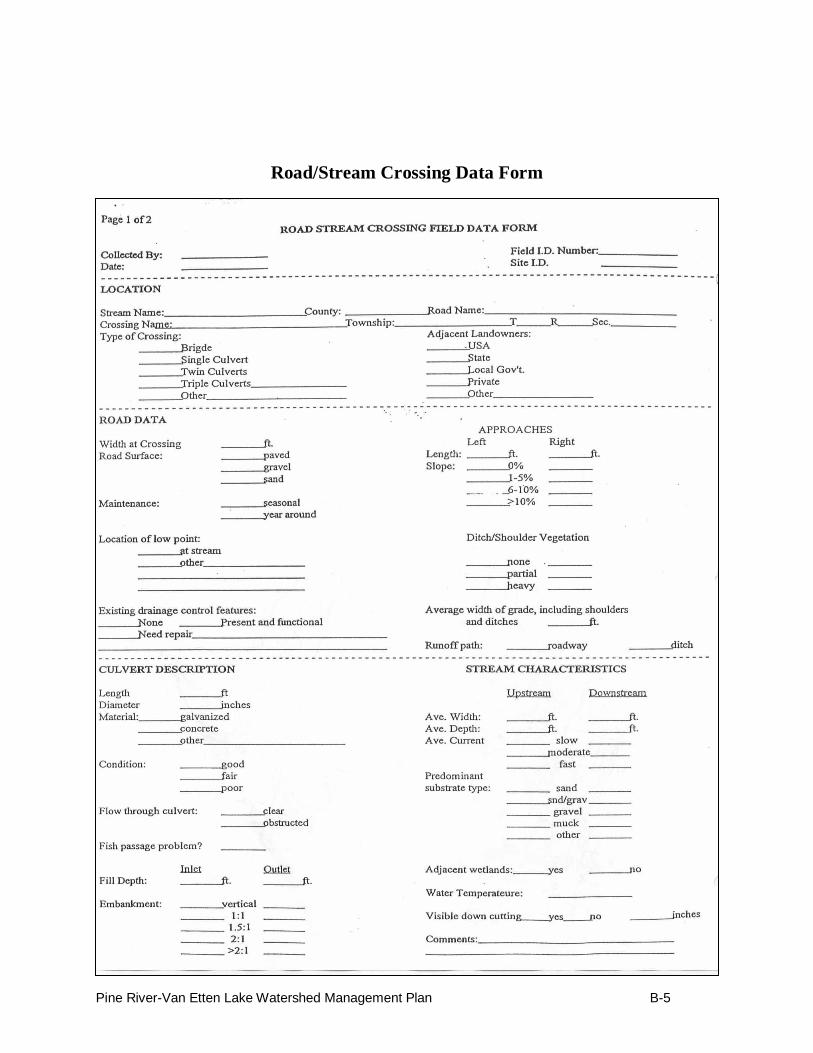
Pine River-Van Etten Lake Watershed Management Plan B-5
Road/Stream Crossing Data Form
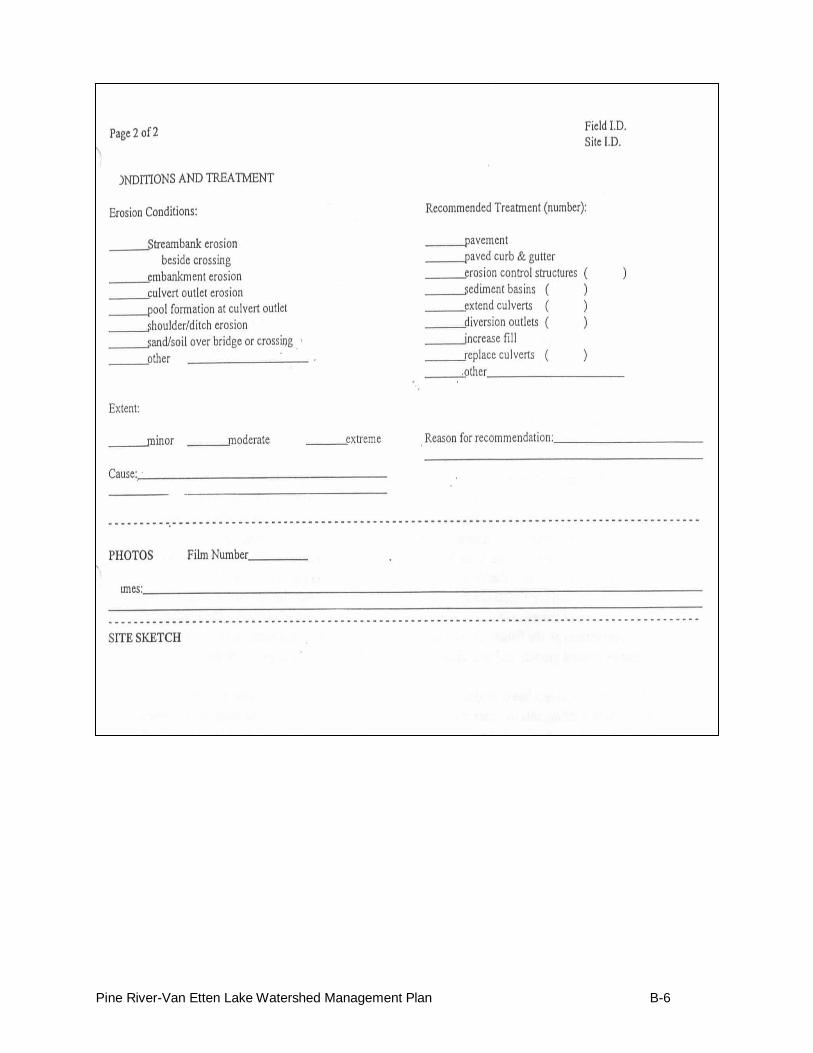
Pine River-Van Etten Lake Watershed Management Plan B-6

Pine River-Van Etten Lake Watershed Management Plan B-7
Road/Stream Crossing Severity Scoring Sheet

Pine River-Van Etten Lake Watershed Management Plan B-8
Road/Stream Crossing Individual Sites Data

Pine River-Van Etten Lake Watershed Management Plan C-1
APPENDIX C
Streambank Erosion Inventory
Pine River-Van Etten Lake Watershed Management Plan C-2
Stream Bank Erosion Inventory
1. Introduction
Severe to moderately eroding streambanks are a source of unwanted soil deposition to river
systems. The erosive action of flowing water can cause untold cubic yards of soil to fall into
a stream where it becomes suspended and clouds water clarity, disturbs gill breathing aquatic
life and eventually settles over critical gravel spawning beds. Soils that may contain
excessive nutrients from historic fertilizer application, can over enrich the water system, and
negatively change its trophic state. Sediment choked rivers run slower and hence potentially
warmer, which then adversely effects cold water dependent species. Sediment can hinder
navigation and contribute to the over abundance of aquatic vegetation. Additionally, severe
streambank erosion jeopardizes land integrity and may result in the loss of residential
property.
An integral part of any watershed planning initiative is to find and document sites of streambank
erosion. In order to gain an overall indication of the severity, quantity and location of
streambank erosion sites within the Pine River/Van Etten Lake Watershed, a field inventory
was conducted from October 2001 to September 2002. During that time 36-streambank
erosion sites were identified.
a. Methods
Using US Geological Survey topographic maps and aerial photographs an initial evaluation was
performed to determine those areas that could be inventoried using personal watercraft to
float tributaries of the Pine River system. Based upon the evaluation and field scoping, the
entire Main Branch and approximately seven river miles of the South Branch of the Pine
River were determined to be navigable. The remaining rivers and tributaries within the
watershed were inventoried by automobile travel, to crossing or access locations and
observing on foot, portions of the streambank corridor. Each site location was cataloged with
Global Positioning System (GPS) technology to accurately record its position along the
stream. Data was collected to document site accessibility, condition of the bank, percent of
vegetative cover, apparent cause of the erosion, bank slope, length and height, river
conditions, soil types and recommended treatments. (See field data form on page 86). A
photographic record was also made of each site. Sites were then scored using a standard
streambank erosion severity index. Scores of less than 30 points were ranked as minor, with
30- 36 points determined as moderate and scores of more than 36 points indicating severe
streambank erosion. A site scoring work sheet is on page 88.
b. Results
During the field collection of data it was noted that most of the watershed area from the
headwaters regions within the subwatersheds ranging down to within approximately five

Pine River-Van Etten Lake Watershed Management Plan C-3
miles from their confluence’s with the Main Branch of the Pine River, where relatively free
of identifiable streambank erosion sites. Particularly, small creeks such as Gimlet, Backus,
Roy Grey and Duval had very little topographic relief and could be generally characterized as
relatively narrow, highly vegetated unnavigable waterways with low banks. Within about
five miles of the confluence of the Pine River, the topography surrounding the major
tributaries begins to rise and contributes to the presence of the majority of streambank
erosion sites within the watershed.
The West Branch follows this pattern with no sites noted in the headwaters, however; the second
highest-ranking severe site was identified close to where it crosses the Cruzen Road Bridge,
approximately one mile from its confluence with the Main Branch. Fast flowing water taking
a bend along tall steep banks of stratified sandy soils all contribute to the high score of this
site.
The South Branch is a predominately clay substrate, fast flowing narrow stream. This river
contains large amounts of woody debris tangled over gravel beds, with an abundance of tag
alder and cedar corridors. It exhibits few erosion problems until it reaches the Buhl tract area
of the Huron-Manistee National Forest. The riverbanks then become high vertical sand walls.
The serpentine flow pattern exacerbates the numerous streambank erosion sites that were
documented along this stretch of river. A total of 11 sites were recorded on this tributary.
Only a couple of sites were identified along the banks of the East Branch. Again, these locations
were found close to its confluence with the Pine River.
Van Etten Creek of Alcona County begins to exhibit taller erosive banks south of Mikado and
near to its crossing at Barlow Road. Relatively few major sites, however, were identified
along this stream system.
The Main Branch of the Pine River begins at the confluence of the West and East Branches,
which meet at the F-30 (Mikado-Glennie Road) Bridge, located 1.5 miles west of Mikado. 19
streambank erosion sites were identified on the Main Branch with the last significant site
noted just north of King’s Corner Road Bridge. The highest scoring site in the watershed is
found on the Main Branch along with two other severely eroding locations. Large stretches
of this river run wide and shallow. After it receives the outflows of Van Etten Creek and the
South Branch it begins to take on more depth. However, the large volume of sediment that
has settled throughout the last one third of the river diminishes its depth once again. Much of
the Main Branch is checkered with scatterings of deadfalls and woody debris. In a few
places, great thick log jams, some piled as high as eight feet above the water, stretch across
the width of the river. Powerful flash events appear to have heaved smaller upstream jams
onto these jumbled masses. Although a hindrance to navigation, the presence of these
logjams is assisting with preserving the riverbank from the water’s erosive energy. These
logjams also serve as natural structures that slow sediment migration to downstream areas.
The woody debris is also providing critical habitat to aquatic and near-shore terrestrial
wildlife.
Of the 36 identified streambank erosion sites, 4 were ranked as severe. These are three on the
Pine River, one on the West Branch. 17 sites were ranked as moderate. Two of the moderate
sites scored right at 36 points and are located on the South Branch of the Pine River. 15 sites
were ranked as minor. See page 89 for a more detailed survey of the specific site scores and
characteristics etc.
Pine River-Van Etten Lake Watershed Management Plan C-4
Streambank Erosion Inventory Data Collection Sheet

Pine River-Van Etten Lake Watershed Management Plan C-5
Pine River-Van Etten Lake Watershed Management Plan C-6
Streambank Erosion Severity Ranking Score Sheet
Pine River-Van Etten Lake Watershed Management Plan C-7
Streambank Erosion Inventory Individual Sites Data
Pine River-Van Etten Lake Watershed Management Plan D-1
APPENDIX D
Agricultural Inventory

Pine River-Van Etten Lake Watershed Management Plan D-2
Agricultural Inventory
1. Introduction
Agricultural practices on the land near riparian corridors may negatively influence water quality.
The over application of fertilizers or manure to the water's edge can introduce an over
abundance of nutrients such as nitrogen and phosphorus, into the river system. Livestock that
have unrestricted access to streams destroy banks and substrate, causing erosion and
sediment deposits in the water. Unrestricted livestock also add unwanted nutrients to the
streams by urinating and defecating in them. Feedlots located close to waterways can
contribute livestock waste to the watershed as well. In order to assess the agricultural
influences within the critical area of the watershed, an inventory was conducted from August
2001 to November 2002. During that time 24 active farms were inventoried. Of those, 12
were noted as having an apparent pollutant source to surface water.
a. Methods
Information regarding active agricultural production within the critical area was gathered from
the Alcona Conservation District, Michigan State University Extension and the Natural
Resources Conservation Service. Aerial photographs and field observations were used to
determine inventory sites. The majority of the sites identified were located within the Van
Etten Creek subwatershed.
Site information such as: type of operation (i.e. livestock, crops, and orchard) estimated acreage,
general topography and estimated riparian frontage were collected. Other information
regarding soil type and stream conditions, as well as foreseeable risks to surface water,
groundwater or wetlands were noted.
During the survey apparent pollutant sources within 1000 feet of surface water were
documented. The types of pollutant sources that may have been noted were: unrestricted
livestock access to water, crop production adjacent to water, feedlot runoff, manure storage
runoff, manure application within 150 feet of a waterway, poor fertilizer storage, or other
sources such as milking parlor runoff.
Treatments to reduce or eliminate apparent pollutant source(s) found on the farms inventoried
were documented and discussed with landowners, when available, during the field visit. These
recommended treatments, determined in consultation with the Natural Resources
Conservation
Pine River-Van Etten Lake Watershed Management Plan D-3
Service may have included: livestock exclusion fencing, livestock crossing or access points,
alternate watering sources, riparian buffer strips, fertilizer and pesticide storage, animal waste
facilities or feedlot diversions.
b. Results
Twelve sites were found to have some apparent pollutant source to surface water. All of these
farms are livestock operations. Predominately beef cattle. The overall problem observed on
approximately 85% of these sites, was unrestricted livestock access to streams. Van Etten
Creek has the majority of livestock operations allowing cattle unrestricted access to it.
However, McGillis, Duval, Roy and Wallace Creeks were all found to have at least one farm
with cattle having open access to them. Two beef operations on tributaries of the East Branch
of the Pine were observed with cattle having unlimited access. It is recommended that these
livestock operations install exclusion fencing and an alternative watering source or cattle
access/crossings. Along with the fence installation it is suggested that a riparian buffer strip
be planted within the fence zone. Other problems encountered were feedlot runoff, milk
parlor runoff, field tile runoff to a tributary, and cattle access to a ditch dug from a creek. A
copy of the agricultural inventory form and individual sites data may be found starting on
page 93.

Pine River-Van Etten Lake Watershed Management Plan D-4
Agricultural Inventory Data Collection Sheet

Pine River-Van Etten Lake Watershed Management Plan D-5

Pine River-Van Etten Lake Watershed Management Plan D-6
Agricultural Inventory Individual Sites Data
Pine River-Van Etten Lake Watershed Management Plan E-1
APPENDIX E
Shoreline Development Inventory
Pine River-Van Etten Lake Watershed Management Plan E-2
Shoreline Development Inventory
1. Introduction
Van Etten Lake is a borderline eutrophic lake with a shoreline that is nearly all developed. In
recent years there have been many complaints regarding substantial growths of blue-green
algae and the spread of Eurasian Water Milfoil. These conditions are indicative of elevated
nutrient levels and the nuisance impairs both swimming and boating uses of the lake. While
nutrients are essential for life, excessive amounts can lead to accelerated eutrophication
(premature aging) of the lake. An inventory of sites where nutrient enrichment is occurring
makes for a useful watershed management tool, although data generated by this inventory
must be carefully interpreted and is intended only to help guide watershed management
efforts. Through the collection of data on all parcels of property along the shore, and the
subsequent sharing of information with property owners, improved shoreline stewardship
practices are more likely to be implemented.
Because the management of the riparian zone plays such an important role in water quality, an
inventory of the shoreline can serve as a useful tool for understanding current and future
water quality problems. While the owner of a small lakefront lot may feel insignificant in
terms of the impact they may have, shoreline stewardship practices, one small parcel at a
time, cumulatively equal a shoreline that will ultimately either help or hurt water resources.
This critical area can either be developed in such a way that it is in a near-natural state
(working to filter nutrients, provide habitat, and stabilize the shoreline) or be nearly
completely artificial (seawall with mowed, heavily fertilized grass to the water’s edge).
While most parcels may fall somewhere in-between, developed parcels generally have
shorelines that resemble the second option. Loss of natural habitat and excess nutrients work
together to drastically change the natural condition of the lake, and, while nearly everyone
wants to improve water resources, few take the relatively easy steps to do so.
a. Methods
As part of the critical area inventory for the Pine River/Van Etten Lake Watershed Plan, an
inventory of the shoreline of Van Etten Lake was conducted. The inventory began in August
2001 and was completed in October 2002. A shoreline inventory form (See page 100) was
used to collect data for each property parcel. The following is a brief description of each
category of information collected for this inventory:
Pine River-Van Etten Lake Watershed Management Plan E-3
Shoreline property parcels include developed and undeveloped lots, access sites, road ends,
etc. These are identified by order, map number, address, and last name. Order is simply the
numbering system given to the parcels by the technician. Some sort of easily identifiable
landmark serves as site one, with the other parcels numbered in order around the lake. Map
number refers to the tax ID number and is helpful for tying our database into other maps
from local governmental units. Address and name are completed if known; this category will
typically be completed at a later time.
Property description is a few abbreviated words that could be useful in later attempts to
identify the property.
Developed property parcels refers to whether a significant permanent structure is present.
Generally this would be a home, although in park areas a boat launch or pavilion are also
counted as developed. Road ends were also considered to be developed parcels for this
inventory.
Parcel width is an estimate of how may feet wide the lot is. This is particularly important
when summarizing shoreline data.
Access site includes any parcel open to public use (boat launches, road-ends, parks, etc.)
Substrate will be completed where the bottom is visible and will note what is typically
within 40 feet of the shore.
Aquatic weeds are observed in the nearshore area where the bottom was visible such as
pondweed, chara, Eurasian watermilfoil, etc.
Turf management is for classifying the apparent intensity of lawn management. This would
either be heavy use of fertilizer and watering, moderate, or light. Along lakes, turf
management plays an important role in the quality of water resources. Lawns that are
managed like a golf course can contribute to the water looking more like a golf course water
hazard than a pristine lake.
Setback distance is the number of feet that the dwelling is set back from the shore. The
farther back the structure, the better the opportunity for maintaining a natural buffer area
along the shoreline.
Erosion for the purposes of this survey, will include those obvious areas of the accelerated
wearing away of land (observed by gullies, slumping banks, bare soil on steep banks, and
undercut banks). These will be ranked as severe, moderate, or slight. Erosion can result in
both property damage and environmental problems. Perhaps even more problematic is the
commonly used method of controlling shoreline erosion along lakes – seawalls. Such a
practice leads to a total loss of natural shoreline habitat. Erosion control structures will be
noted when observed.
Wetland is a note on whether such an ecosystem was observed from shore, as indicated by
vegetation or hydrology. (Obviously, this does not replace the need for more detailed onsite
delineation).
Greenbelts will be scored by the shoreline technician on a scale ranging from 1 to 3 (i.e., a 1
being a greenbelt with sparse vegetation and 3 being a nearly undeveloped shoreline). A zero
would indicate a paved shoreline, devoid of any vegetation and a .5 would generally be
mowed turf-grass along the shore, with most other vegetation removed. Depth of the
greenbelt, type of plants, and slope of the parcel will also be considered. Although this is a
more subjective category than many of the others, the same shoreline technician collected the
data throughout the process for consistency. Utilization of greenbelts has been proven to be
one of the most effective shoreline practices for protecting water quality and lots that do not
have them often end up developing other associated problems (such as algae growth, erosion,
or runoff).
Pine River-Van Etten Lake Watershed Management Plan E-4
Tributary streams will be noted when present, as they are an important part of the
watershed.
Priority to protect includes such areas as large undeveloped parcels, unique habitats, or
sensitive areas with tributaries or wetlands. A yes response might indicate a potential parcel
for voluntary land protection, such as a conservation easement. This is simply a suggestion
for perhaps pursuing the issue further, possibly through a land conservancy.
Comment is a space for any additional items that could help for clarification or note
something that space is not already provided for.
Considerations such as time, funding, technical expertise and expected project benefits were all
used to evaluate which items to study as part of the shoreline inventory. To determine which
data should be collected and the best method of doing so for Van Etten Lake, other shoreline
surveys on similar lakes in northern Michigan were carefully reviewed. Those sample
shoreline inventories were designed by the Tip of the Mitt Watershed Council and conducted
through out the Elk River Chain of Lakes as well as on Walloon Lake. Huron Pines RC&D
also successfully conducted a similar shoreline inventory on Higgins Lake.
The Van Etten Lake shoreline inventory was conducted on a parcel by parcel basis. Shoreline
property parcels included developed and undeveloped lots, access sites and easements. Parcel
numbers were assigned to each shoreline property parcel identified Some of the categories of
information collected for each shoreline property parcel included: substrate of parcel, aquatic
plants observed in the nearshore area, turf management, erosion, structural setback, wetland
regions and greenbelts. By using a small watercraft technicians were able to be near enough
to the shoreline to effectively collect data. Methods for the shoreline inventory were based
upon similar studies conducted by the Tip of the Mitt Watershed Council. See field data sheet
on page 100 for more details regarding data collection categories.
Turf management and erosion status were given a rating such as light, heavy etc. versus just a
yes/no status. Greenbelts (or vegetated buffer strips along the shoreline) were rated on a scale
of zero to 3.0 with 3.0 being an undeveloped shoreline with no disturbance of the natural
vegetation and zero being ascribed to a site entirely paved or devoid of vegetation.
While the shoreline inventory does not replace the need for more detailed follow-up work at
some locations, it is a good starting point and a useful management tool for future watershed
restoration and protection efforts. Through a confidential follow-up with property owners and
an on-site visit, practical recommendations can be offered which are often simple and
relatively inexpensive. This sort of educational outreach effort connects with a target
audience that can have a significant influence on water quality.
b. Results
The entire shoreline of Van Etten Lake, including Loud Island, was inventoried. Data was
gathered on a total of 486 shoreline property parcels. A complete table of results can be
found starting on page 101.

Pine River-Van Etten Lake Watershed Management Plan E-5
Shoreline Development Inventory Data Collection Sheet
Pine River-Van Etten Lake Watershed Management Plan E-6
Shoreline Development Data Table

Pine River-Van Etten Lake Watershed Management Plan F-1
APPENDIX F
Central Michigan University Water Quality Study