Embed Size (px)
Citation preview
1
Pinto Valley Mine Analyst & Investor Tour - April 2014
2 2
This presentation, and the documents incorporated by reference herein, may contain “forward-looking information” within the meaning of Canadian securities legislation and “forward-looking
statements” within the meaning of the United States Private Securities Litigation Reform Act of 1995 (collectively, “forward-looking statements”). These forward-looking statements are made as of
the date of this document and Capstone does not intend, and does not assume any obligation, to update these forward-looking statements, except as required under applicable securities
legislation.
Forward-looking statements relate to future events or future performance and reflect our expectations or beliefs regarding future events. Forward-looking statements include, but are not limited
to, statements with respect to the estimation of Mineral Resources and Mineral Reserves, the realization of Mineral Reserve Estimates, the timing and amount of estimated future production,
costs of production and capital expenditures, the success of our mining operations, environmental risks, unanticipated reclamation expenses and title disputes. In certain cases, forward-looking
statements can be identified by the use of words such as “plans”, “expects”, “budget”, “scheduled”, “estimates”, “forecasts”, “intends”, “anticipates”, “believes” or variations of such words and
phrases, or statements that certain actions, events or results “may”, “could”, “would”, “might” or “will be taken”, “occur” or “be achieved” or the negative of these terms or comparable
terminology. By their very nature, forward-looking statements involve known and unknown risks, uncertainties and other factors that may cause our actual results, performance or achievements
to be materially different from any future results, performance or achievements expressed or implied by the forward-looking statements. Such factors include, among others, risks related to:
inherent hazards associated with mining operations; future prices of copper and other metals; counterparty risks associated with sales of our metals; our ability to raise capital; foreign currency
exchange rate fluctuations; accuracy of Mineral resource and Mineral Reserve Estimates; changes in general economic conditions; increased operating and capital costs; challenges to title to our
mineral properties; operating in foreign jurisdictions with risk of changes to governmental regulation; compliance with governmental regulations; dependence on key management personnel;
compliance with environmental laws and regulations; reliance on approvals, licenses and permits from governmental authorities; impact of climatic conditions on our Pinto Valley operation;
potential conflicts of interest involving our directors and officers; aboriginal title claims and rights to consultation and accommodation; limitations inherent in our insurance coverage; land
reclamation and mine closure obligations; labour relations; increasing energy prices; competition in the mining industry; risks associated with joint venture partners; and our ability to integrate
new acquisitions into our operations.
Although we have attempted to identify important factors that could cause our actual results, performance or achievements to differ materially from those described in our forward-looking
statements, there may be other factors that cause our results, performance or achievements not to be as anticipated, estimated or intended. There can be no assurance that our forward-looking
statements will prove to be accurate, as our actual results, performance or achievements could differ materially from those anticipated in such statements. Accordingly, readers should not place
undue reliance on our forward-looking statements.
Alternative Performance Measures “C1 Cash Cost”, “Cash Cost” and “Adjusted Net Earnings” are Alternative Performance Measures. Alternative performance measures are furnished to provide additional information. These
performance measures are used by management to monitor performance, to plan and to assess the overall effectiveness and efficiency of mining operations. These performance measures may
not be comparable to similar data presented by other mining companies. These performance measures should not be considered in isolation as a substitute for measures of performance included
in the Company’s unaudited condensed interim consolidated financial statements prepared in accordance with IFRS.
Currency All amounts are in US$ unless otherwise specified.
Cautionary Note Forward Looking Information
3 3
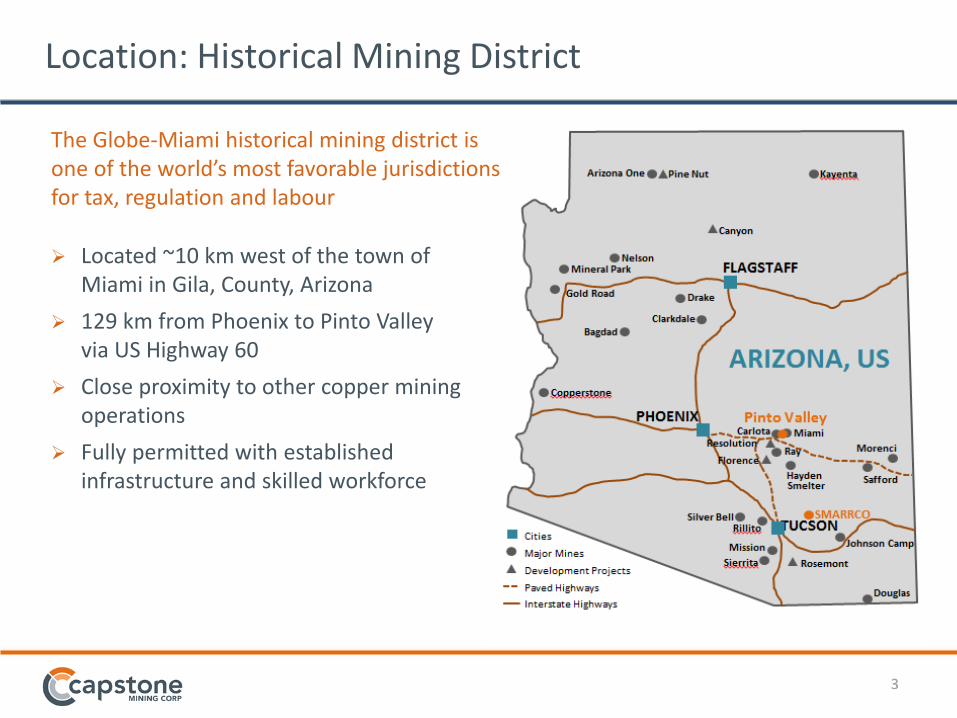
Located ~10 km west of the town of Miami in Gila, County, Arizona
129 km from Phoenix to Pinto Valley via US Highway 60
Close proximity to other copper mining operations
Fully permitted with established infrastructure and skilled workforce
Location: Historical Mining District
The Globe-Miami historical mining district is one of the world’s most favorable jurisdictions for tax, regulation and labour
4
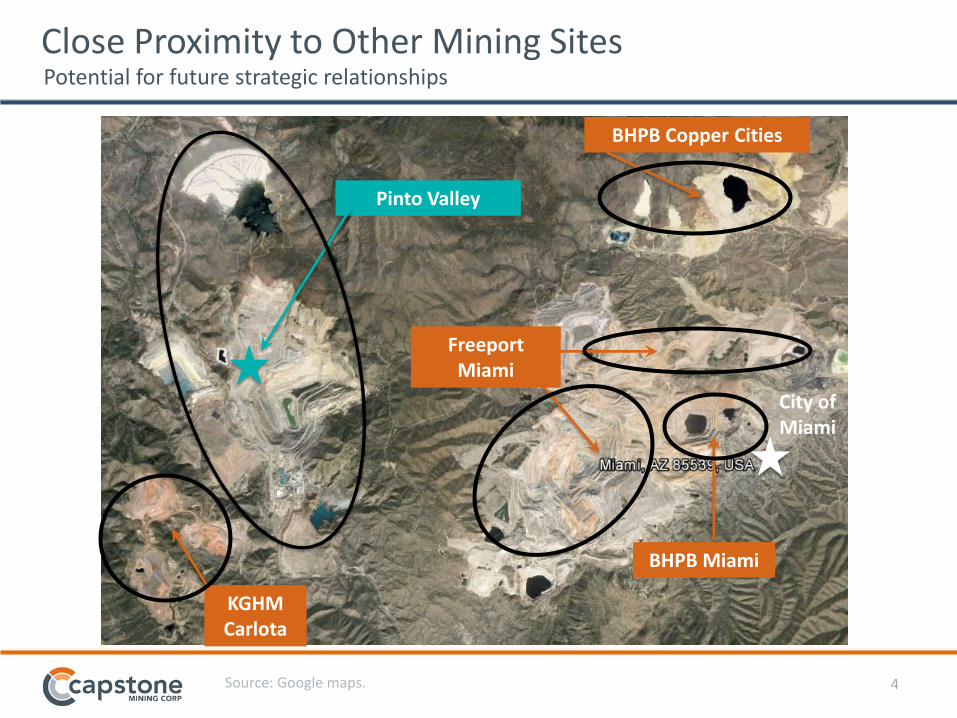
Close Proximity to Other Mining Sites
Source: Google maps.
City of Miami
Pinto Valley
Freeport Miami
KGHM Carlota
BHPB Copper Cities
BHPB Miami
Potential for future strategic relationships
5 5
Summary of Pinto Valley’s community involvement over the past five months. Donations
Education & Training
Community Support/Capacity Building
Health
Sports & Recreation
Arts
Employee Involvement United Fund of Globe-Miami – Employees donated over $20k for 2014
Pinto Valley Road Cleanup – Two events to clean up the Pinto Valley entrance road
March of Dimes – Pinto Valley team participated and raised over $2k
Adopt-a-Senior – Employees adopted 26 local senior citizens for Christmas
Adopt-a-Family – Departments adopted six families from Globe, Miami and San Manuel
Community Relations
6 6
Geology
7 7
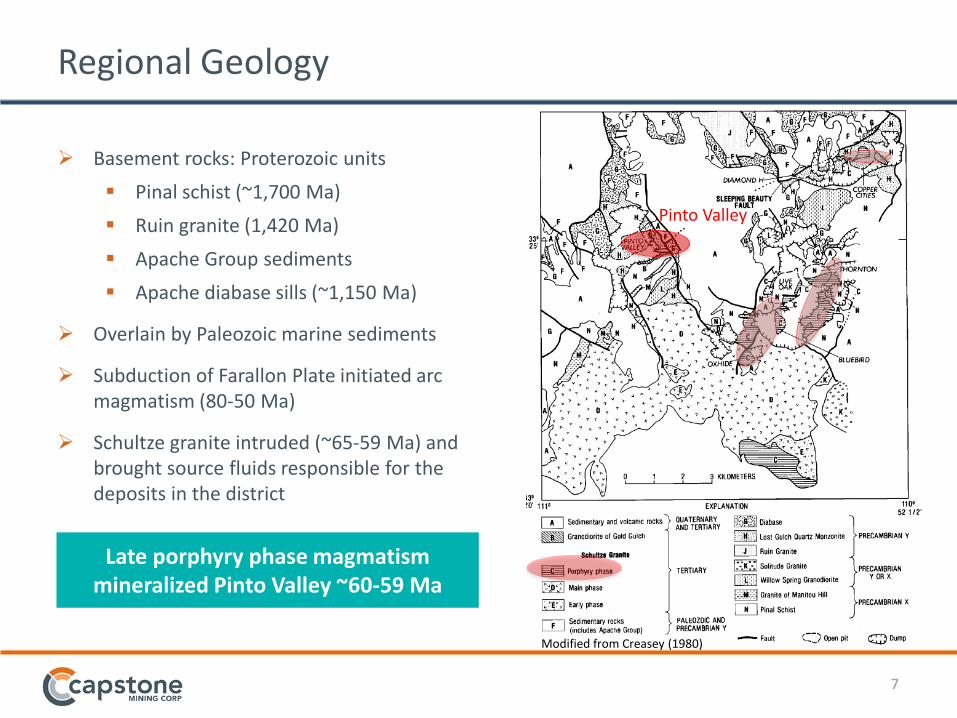
Regional Geology
Basement rocks: Proterozoic units
Pinal schist (~1,700 Ma)
Ruin granite (1,420 Ma)
Apache Group sediments
Apache diabase sills (~1,150 Ma)
Overlain by Paleozoic marine sediments
Subduction of Farallon Plate initiated arc magmatism (80-50 Ma)
Schultze granite intruded (~65-59 Ma) and brought source fluids responsible for the deposits in the district s
Pinto Valley
Modified from Creasey (1980)
Late porphyry phase magmatism mineralized Pinto Valley ~60-59 Ma
8 8
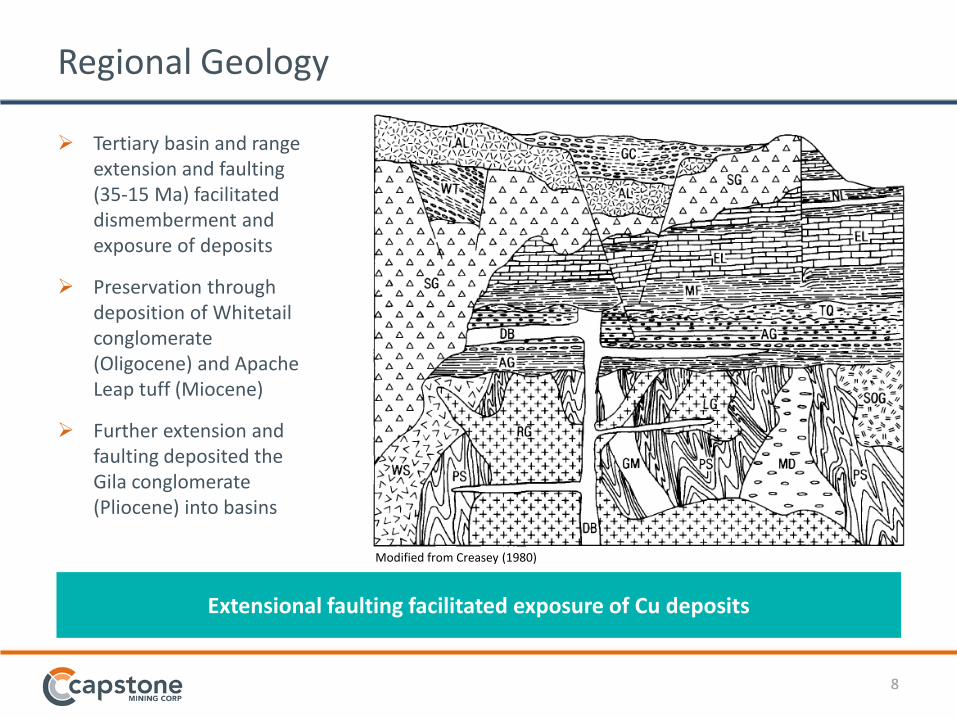
Regional Geology
Extensional faulting facilitated exposure of Cu deposits
Tertiary basin and range extension and faulting (35-15 Ma) facilitated dismemberment and exposure of deposits
Preservation through deposition of Whitetail conglomerate (Oligocene) and Apache Leap tuff (Miocene)
Further extension and faulting deposited the Gila conglomerate (Pliocene) into basins
Modified from Creasey (1980)
9 9
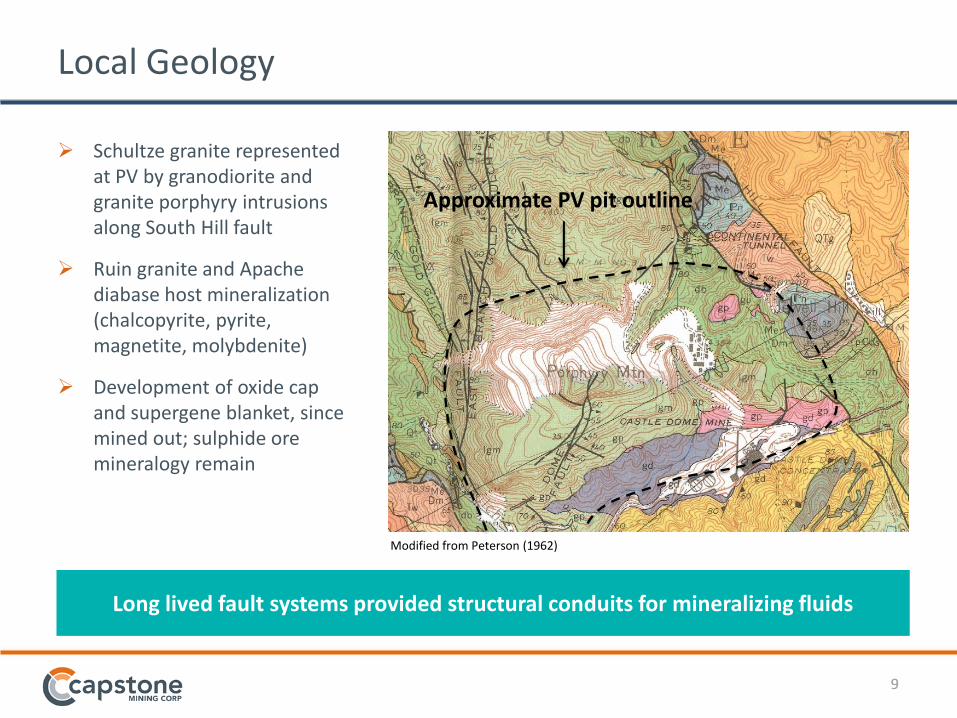
Local Geology
Schultze granite represented at PV by granodiorite and granite porphyry intrusions along South Hill fault
Ruin granite and Apache diabase host mineralization (chalcopyrite, pyrite, magnetite, molybdenite)
Development of oxide cap and supergene blanket, since mined out; sulphide ore mineralogy remain
Approximate PV pit outline
Modified from Peterson (1962)
Long lived fault systems provided structural conduits for mineralizing fluids
10 10
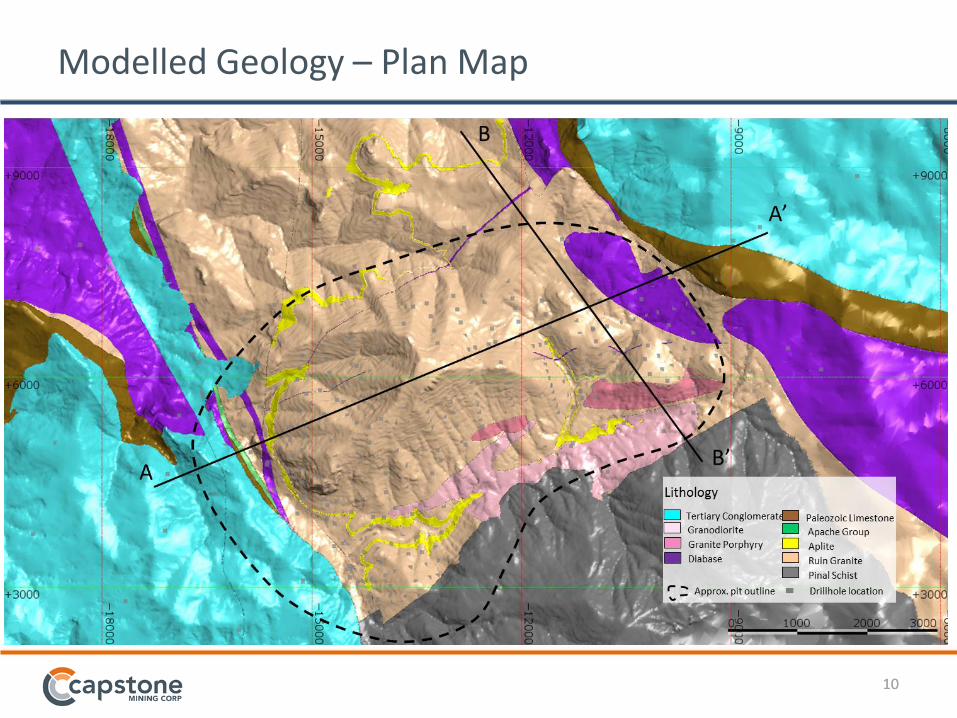
Modelled Geology – Plan Map
11 11
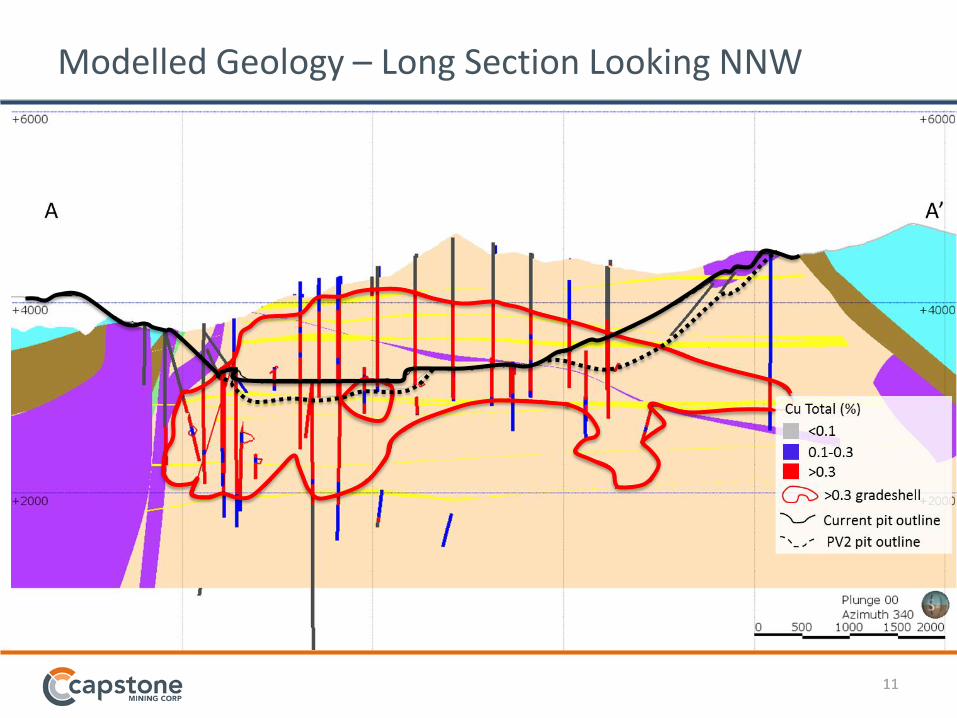
Modelled Geology – Long Section Looking NNW
12 12
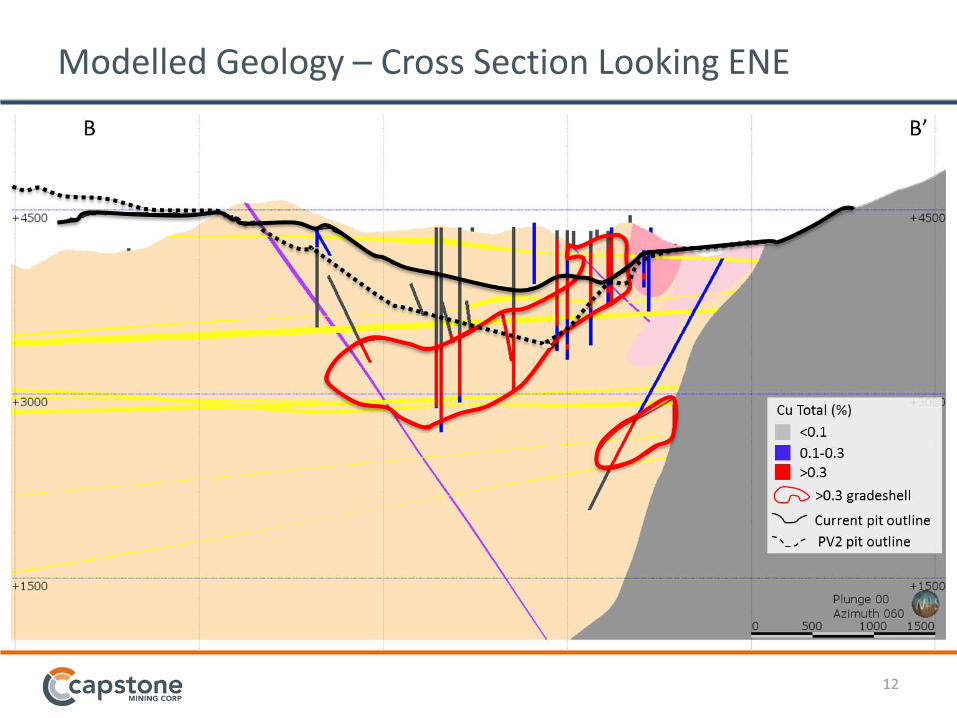
Modelled Geology – Cross Section Looking ENE
13
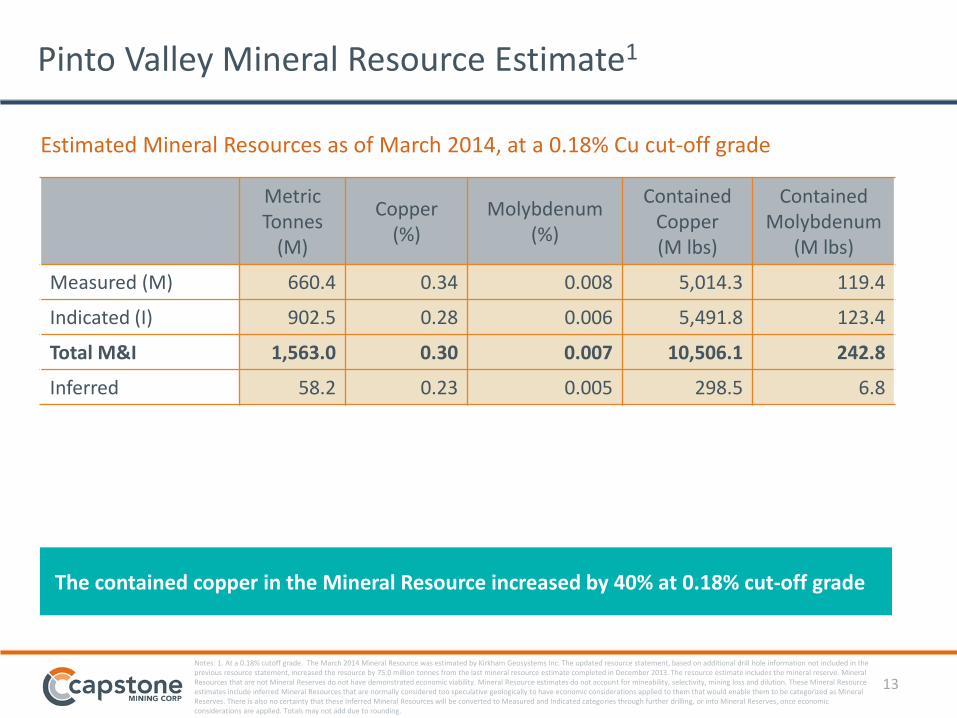
Notes: 1. At a 0.18% cutoff grade. The March 2014 Mineral Resource was estimated by Kirkham Geosystems Inc. The updated resource statement, based on additional drill hole information not included in the previous resource statement, increased the resource by 75.0 million tonnes from the last mineral resource estimate completed in December 2013. The resource estimate includes the mineral reserve. Mineral Resources that are not Mineral Reserves do not have demonstrated economic viability. Mineral Resource estimates do not account for mineability, selectivity, mining loss and dilution. These Mineral Resource estimates include inferred Mineral Resources that are normally considered too speculative geologically to have economic considerations applied to them that would enable them to be categorized as Mineral Reserves. There is also no certainty that these Inferred Mineral Resources will be converted to Measured and Indicated categories through further drilling, or into Mineral Reserves, once economic considerations are applied. Totals may not add due to rounding.
Metric Tonnes
(M)
Copper (%)
Molybdenum (%)
Contained Copper (M lbs)
Contained Molybdenum
(M lbs)
Measured (M) 660.4 0.34 0.008 5,014.3 119.4
Indicated (I) 902.5 0.28 0.006 5,491.8 123.4
Total M&I 1,563.0 0.30 0.007 10,506.1 242.8
Inferred 58.2 0.23 0.005 298.5 6.8
Pinto Valley Mineral Resource Estimate1
Estimated Mineral Resources as of March 2014, at a 0.18% Cu cut-off grade
The contained copper in the Mineral Resource increased by 40% at 0.18% cut-off grade
14 14
Operations
15 15
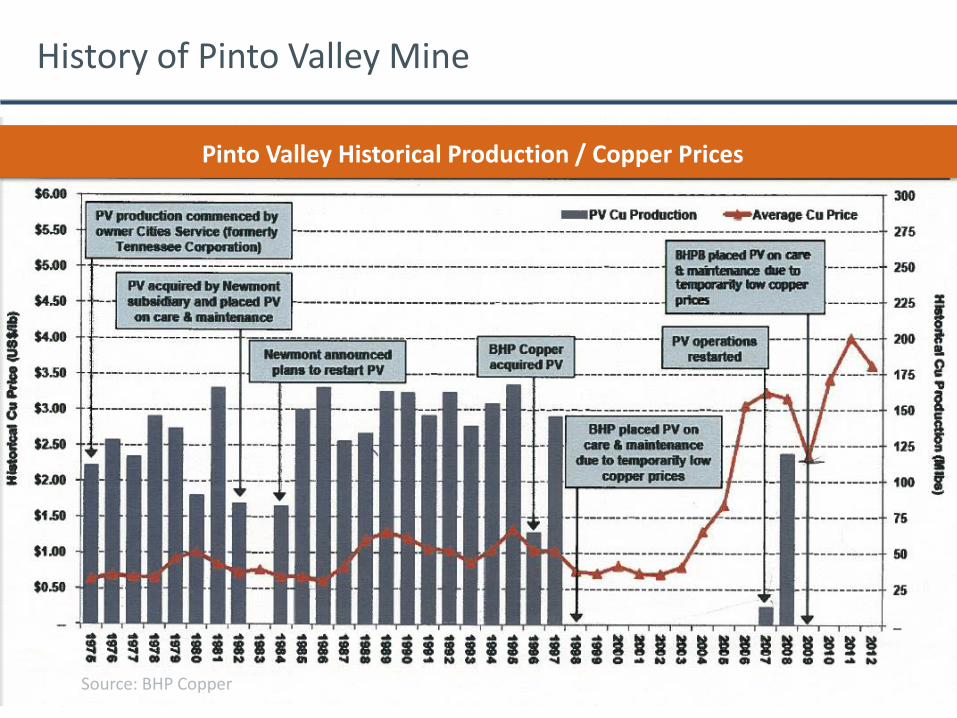
History of Pinto Valley Mine
Pinto Valley Historical Production / Copper Prices
Source: BHP Copper
16 16
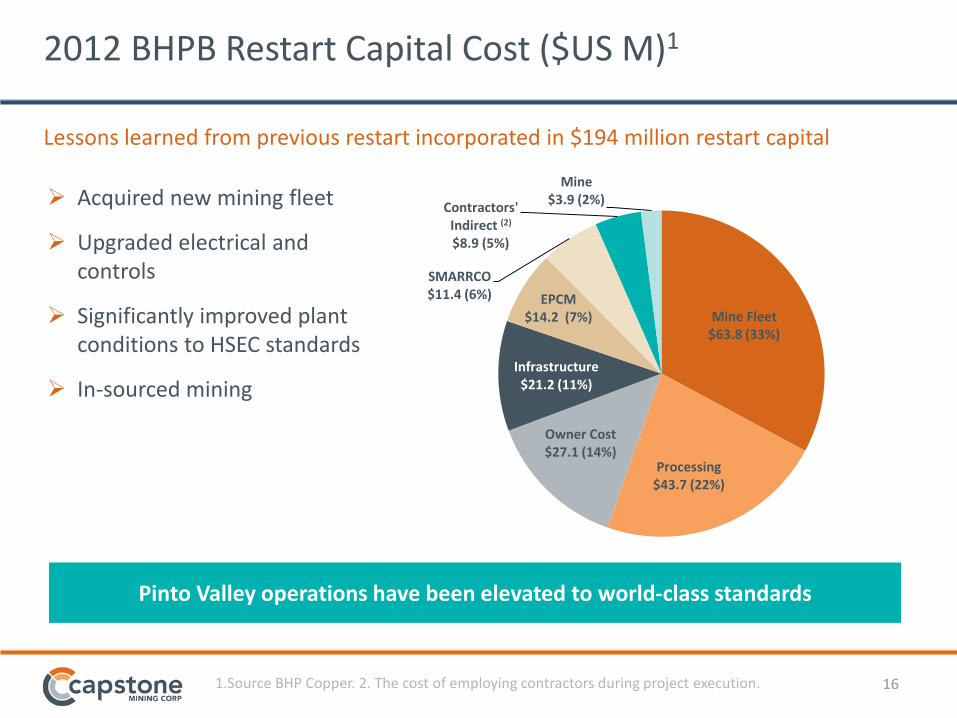
2012 BHPB Restart Capital Cost ($US M)1
Mine Fleet $63.8 (33%)
Processing $43.7 (22%)
Owner Cost $27.1 (14%)
Infrastructure $21.2 (11%)
EPCM $14.2 (7%)
SMARRCO $11.4 (6%)
Contractors' Indirect (2) $8.9 (5%)
Mine $3.9 (2%)
1.Source BHP Copper. 2. The cost of employing contractors during project execution.
Lessons learned from previous restart incorporated in $194 million restart capital
Acquired new mining fleet
Upgraded electrical and controls
Significantly improved plant conditions to HSEC standards
In-sourced mining
Pinto Valley operations have been elevated to world-class standards
17 17
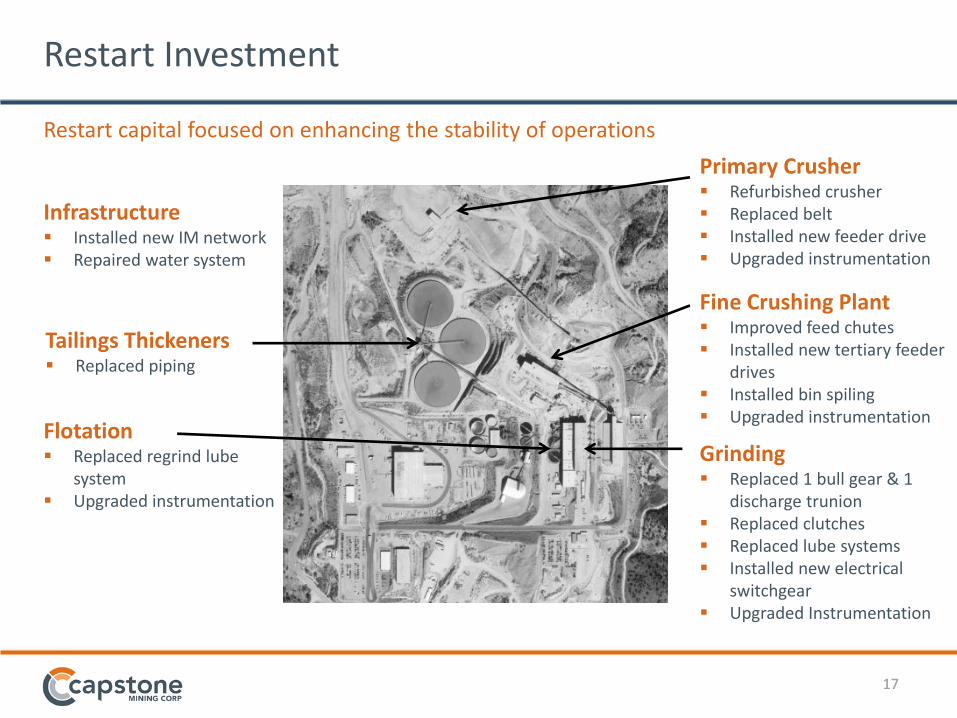
Restart Investment
Restart capital focused on enhancing the stability of operations
Infrastructure Installed new IM network Repaired water system
Tailings Thickeners Replaced piping
Flotation Replaced regrind lube
system Upgraded instrumentation
Primary Crusher Refurbished crusher Replaced belt Installed new feeder drive Upgraded instrumentation
Fine Crushing Plant Improved feed chutes Installed new tertiary feeder
drives Installed bin spiling Upgraded instrumentation
Grinding Replaced 1 bull gear & 1
discharge trunion Replaced clutches Replaced lube systems Installed new electrical
switchgear Upgraded Instrumentation
18 18
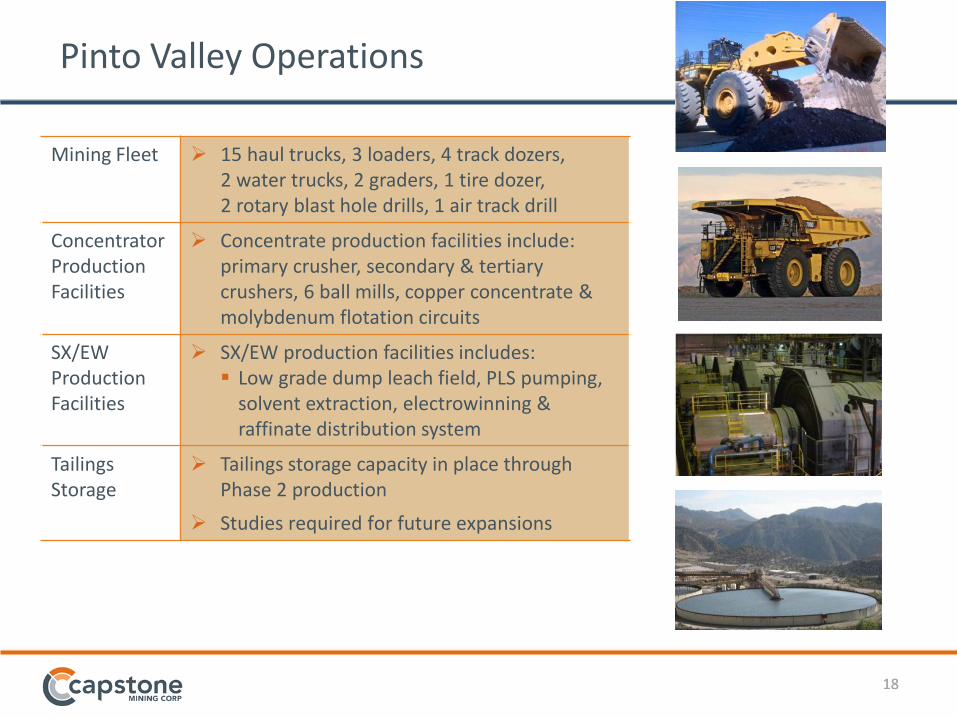
Mining Fleet 15 haul trucks, 3 loaders, 4 track dozers, 2 water trucks, 2 graders, 1 tire dozer, 2 rotary blast hole drills, 1 air track drill
Concentrator Production Facilities
Concentrate production facilities include: primary crusher, secondary & tertiary crushers, 6 ball mills, copper concentrate & molybdenum flotation circuits
SX/EW Production Facilities
SX/EW production facilities includes: Low grade dump leach field, PLS pumping,
solvent extraction, electrowinning & raffinate distribution system
Tailings Storage
Tailings storage capacity in place through Phase 2 production
Studies required for future expansions
Pinto Valley Operations
19 19
Processing
20 20
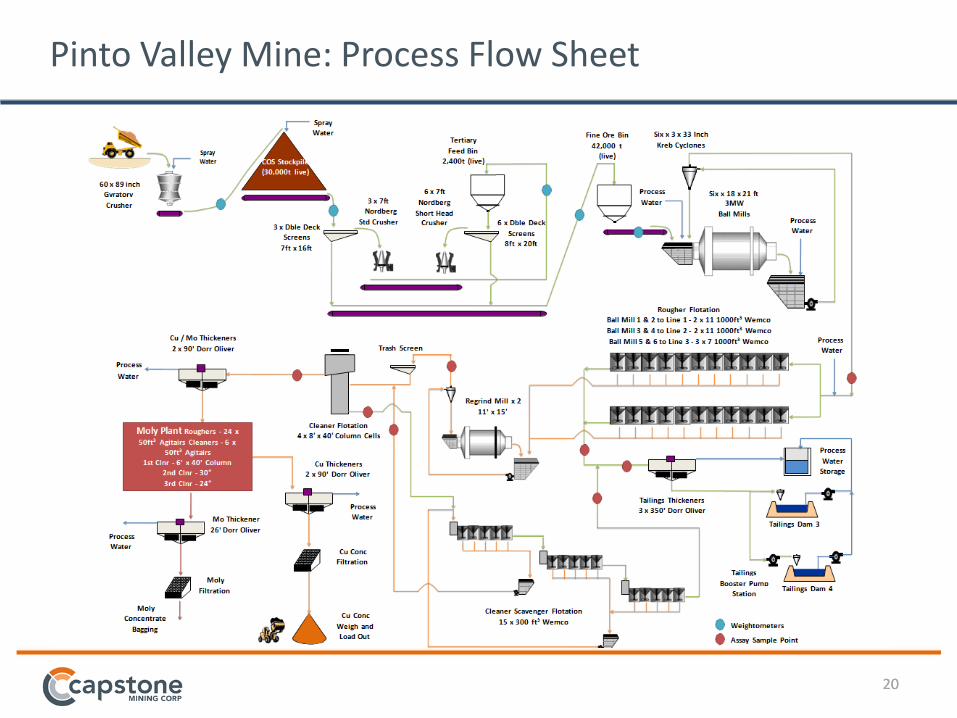
Pinto Valley Mine: Process Flow Sheet
21 21
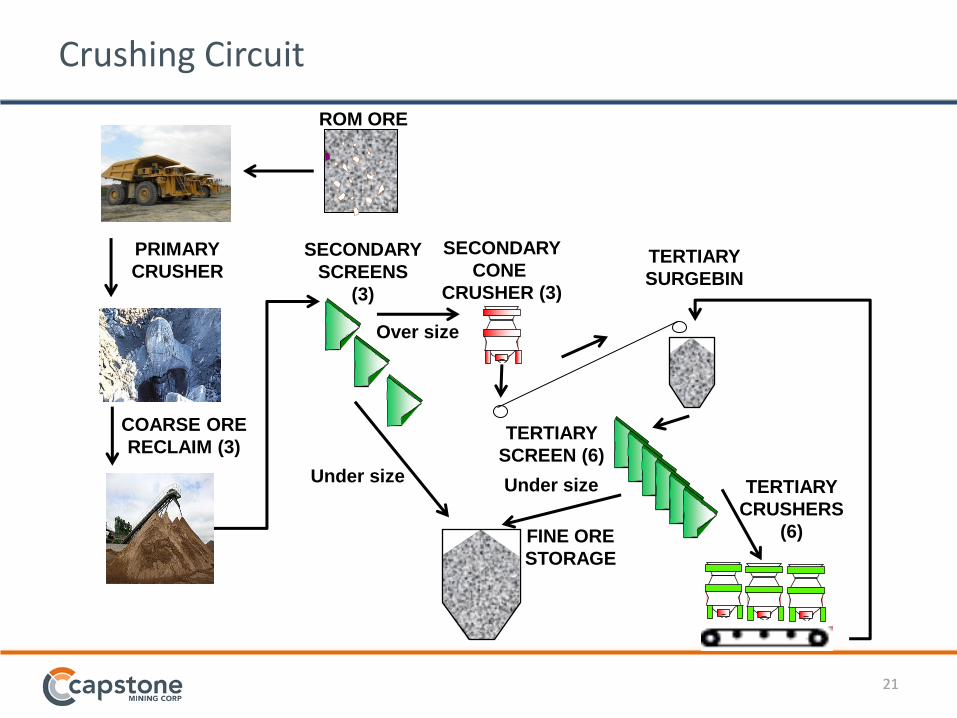
Crushing Circuit
Under size Under size
Over size
ROM ORE
PRIMARY
CRUSHER
SECONDARY
CONE
CRUSHER (3)
FINE ORE
STORAGE
TERTIARY
SCREEN (6)
TERTIARY
SURGEBIN
COARSE ORE
RECLAIM (3)
SECONDARY
SCREENS
(3)
TERTIARY
CRUSHERS
(6)
22
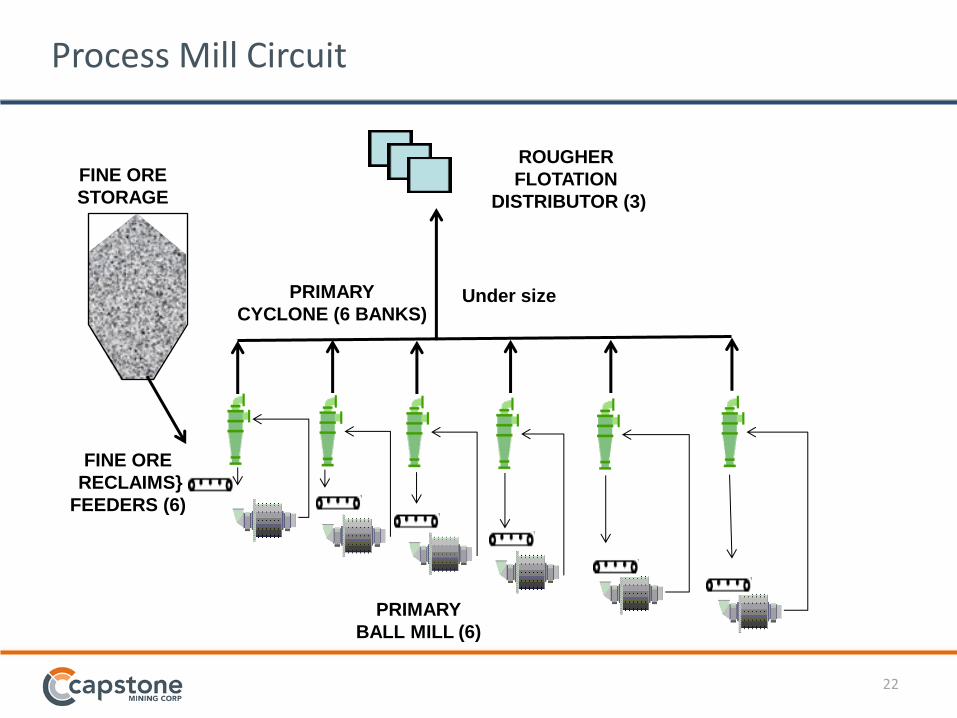
Process Mill Circuit
PRIMARY
CYCLONE (6 BANKS)
FINE ORE
RECLAIMS}
FEEDERS (6)
FINE ORE
STORAGE
Under size
ROUGHER
FLOTATION
DISTRIBUTOR (3)
PRIMARY
BALL MILL (6)
23
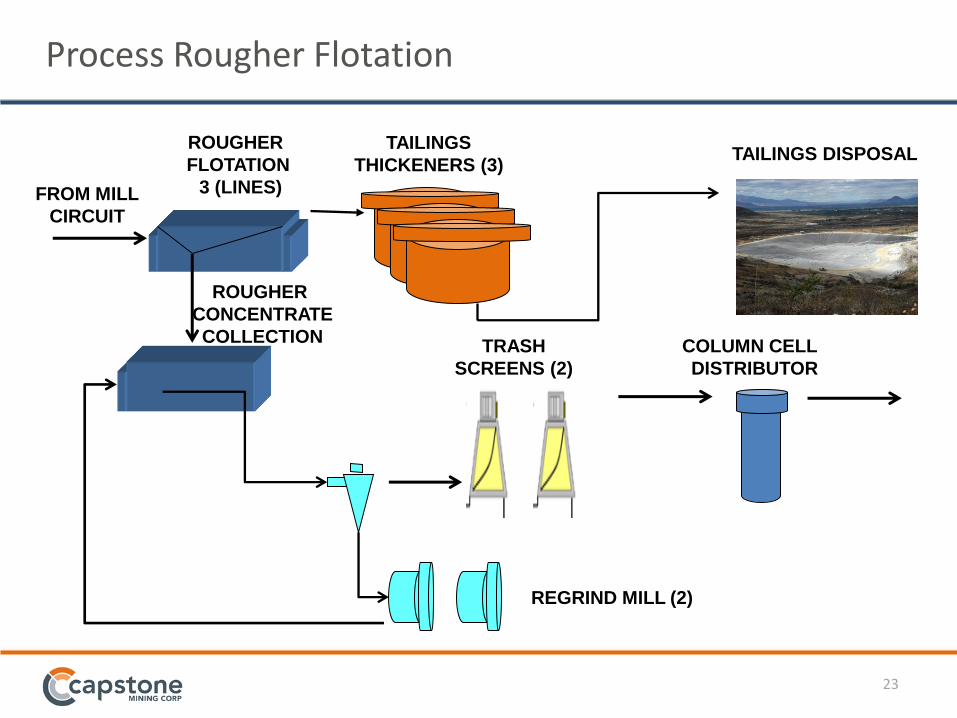
FROM MILL
CIRCUIT
ROUGHER
FLOTATION
3 (LINES)
ROUGHER
CONCENTRATE
COLLECTION TRASH
SCREENS (2)
COLUMN CELL
DISTRIBUTOR
REGRIND MILL (2)
TAILINGS
THICKENERS (3) TAILINGS DISPOSAL
Process Rougher Flotation
24
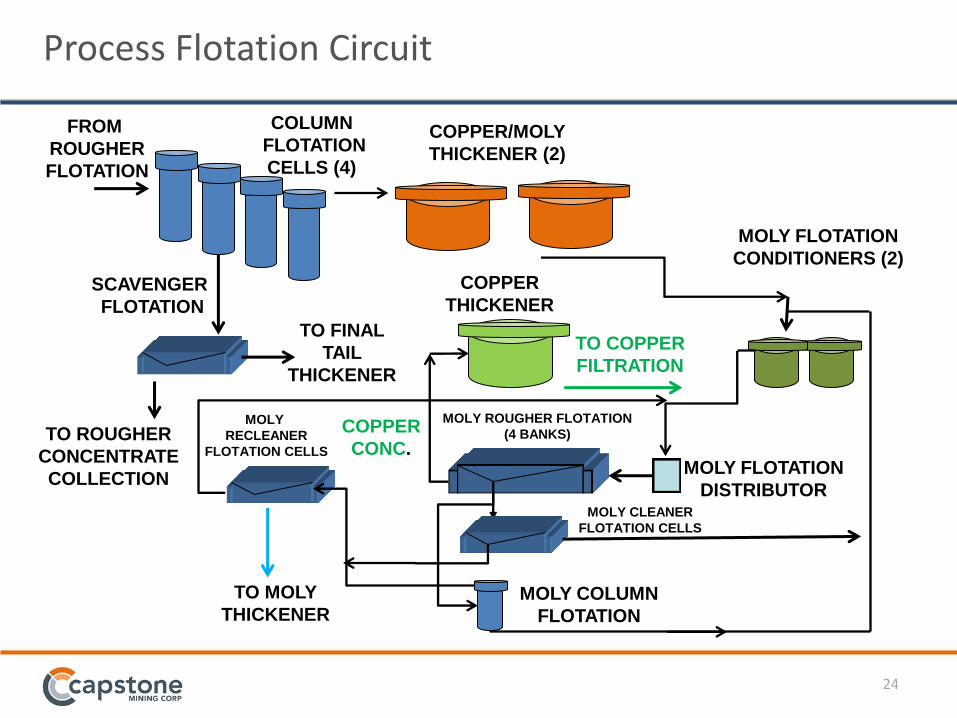
Process Flotation Circuit
TO COPPER
FILTRATION
COPPER
CONC.
COPPER
THICKENER
FROM
ROUGHER
FLOTATION
SCAVENGER
FLOTATION
MOLY FLOTATION
CONDITIONERS (2)
MOLY ROUGHER FLOTATION
(4 BANKS)
MOLY COLUMN
FLOTATION
MOLY
RECLEANER
FLOTATION CELLS
MOLY FLOTATION
DISTRIBUTOR
COPPER/MOLY
THICKENER (2)
COLUMN
FLOTATION
CELLS (4)
TO ROUGHER
CONCENTRATE
COLLECTION
TO FINAL
TAIL
THICKENER
MOLY CLEANER
FLOTATION CELLS
TO MOLY
THICKENER
25
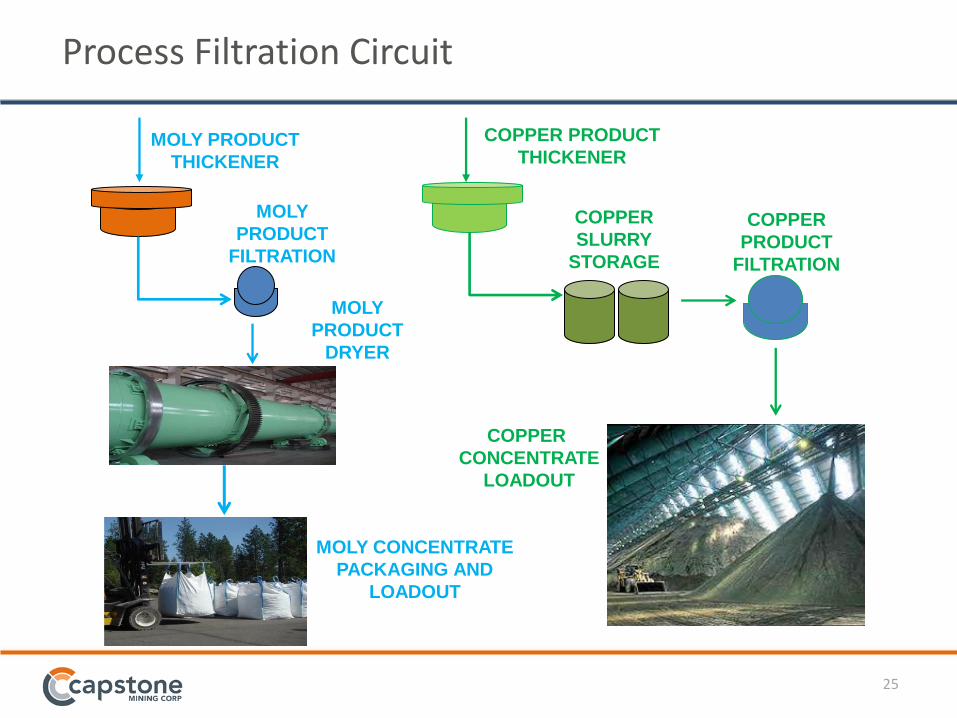
MOLY CONCENTRATE
PACKAGING AND
LOADOUT
COPPER PRODUCT
THICKENER
COPPER
PRODUCT
FILTRATION
COPPER
SLURRY
STORAGE
MOLY PRODUCT
THICKENER
MOLY
PRODUCT
FILTRATION
MOLY
PRODUCT
DRYER
COPPER
CONCENTRATE
LOADOUT
Process Filtration Circuit
26 26
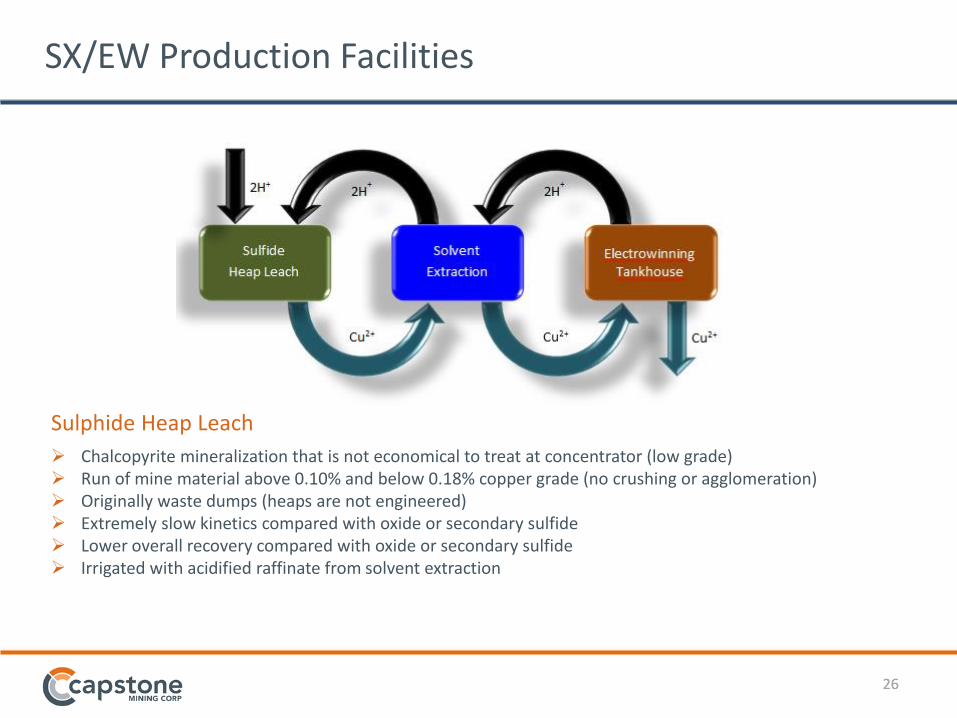
SX/EW Production Facilities
Sulphide Heap Leach
Chalcopyrite mineralization that is not economical to treat at concentrator (low grade) Run of mine material above 0.10% and below 0.18% copper grade (no crushing or agglomeration) Originally waste dumps (heaps are not engineered) Extremely slow kinetics compared with oxide or secondary sulfide Lower overall recovery compared with oxide or secondary sulfide Irrigated with acidified raffinate from solvent extraction
27 27
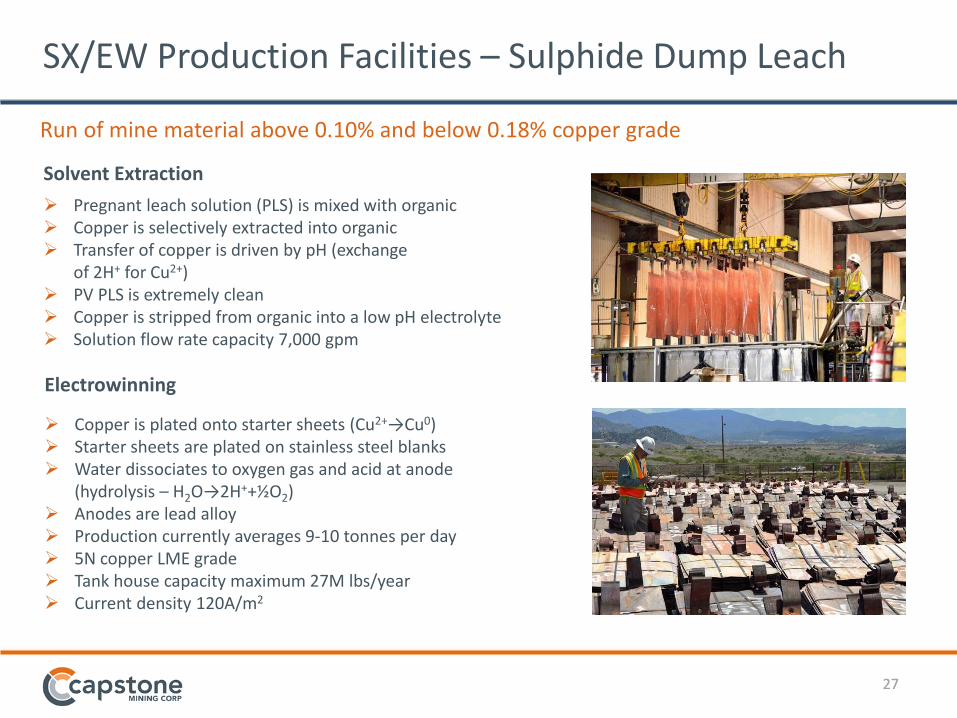
SX/EW Production Facilities – Sulphide Dump Leach
Electrowinning
Copper is plated onto starter sheets (Cu2+→Cu0) Starter sheets are plated on stainless steel blanks Water dissociates to oxygen gas and acid at anode
(hydrolysis – H2O→2H++½O2) Anodes are lead alloy Production currently averages 9-10 tonnes per day 5N copper LME grade Tank house capacity maximum 27M lbs/year Current density 120A/m2
Solvent Extraction
Pregnant leach solution (PLS) is mixed with organic Copper is selectively extracted into organic Transfer of copper is driven by pH (exchange
of 2H+ for Cu2+) PV PLS is extremely clean Copper is stripped from organic into a low pH electrolyte Solution flow rate capacity 7,000 gpm
Run of mine material above 0.10% and below 0.18% copper grade
28 28
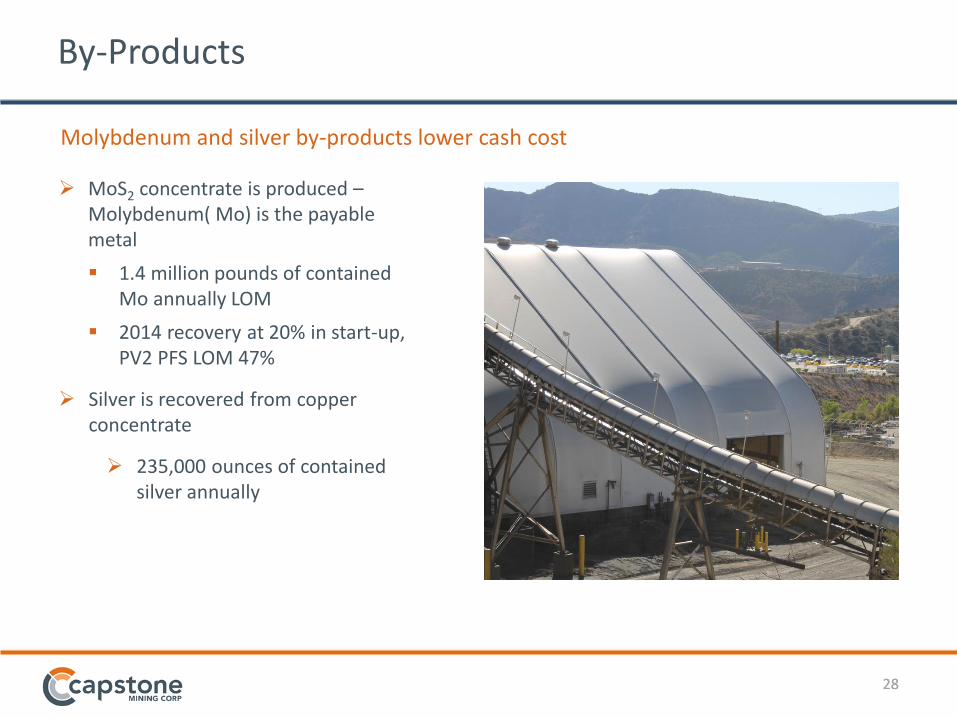
By-Products
Molybdenum and silver by-products lower cash cost
MoS2 concentrate is produced – Molybdenum( Mo) is the payable metal
1.4 million pounds of contained Mo annually LOM
2014 recovery at 20% in start-up, PV2 PFS LOM 47%
Silver is recovered from copper concentrate
235,000 ounces of contained silver annually
29 29
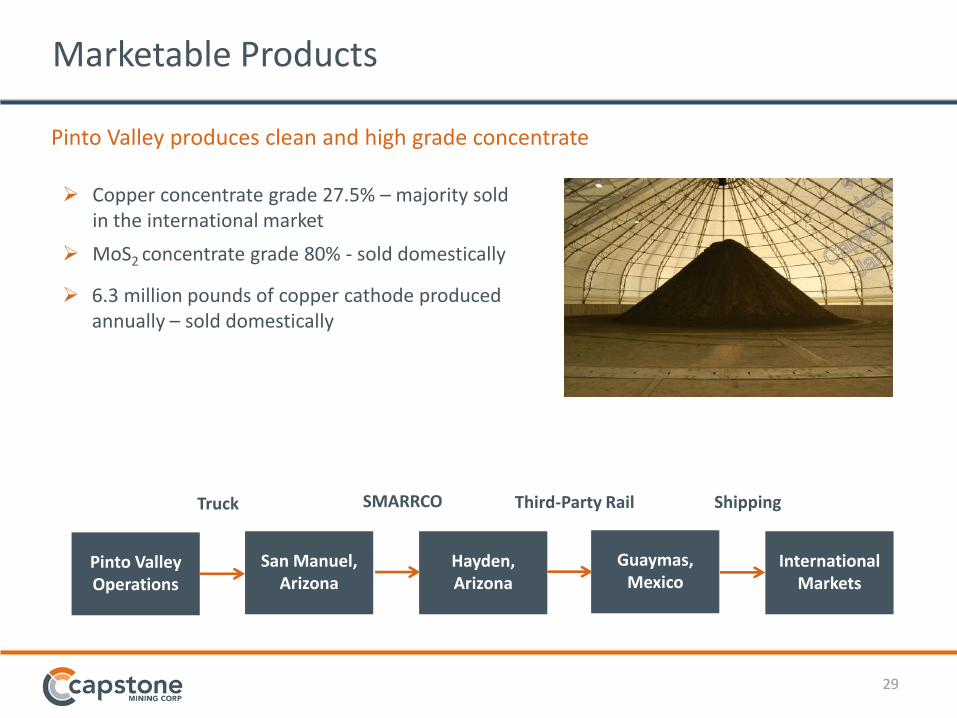
Marketable Products
Copper concentrate grade 27.5% – majority sold in the international market
MoS2 concentrate grade 80% - sold domestically
6.3 million pounds of copper cathode produced annually – sold domestically
Pinto Valley produces clean and high grade concentrate
Truck
Pinto Valley Operations
San Manuel, Arizona
Hayden, Arizona
Guaymas, Mexico
International Markets
SMARRCO Third-Party Rail Shipping
30 30
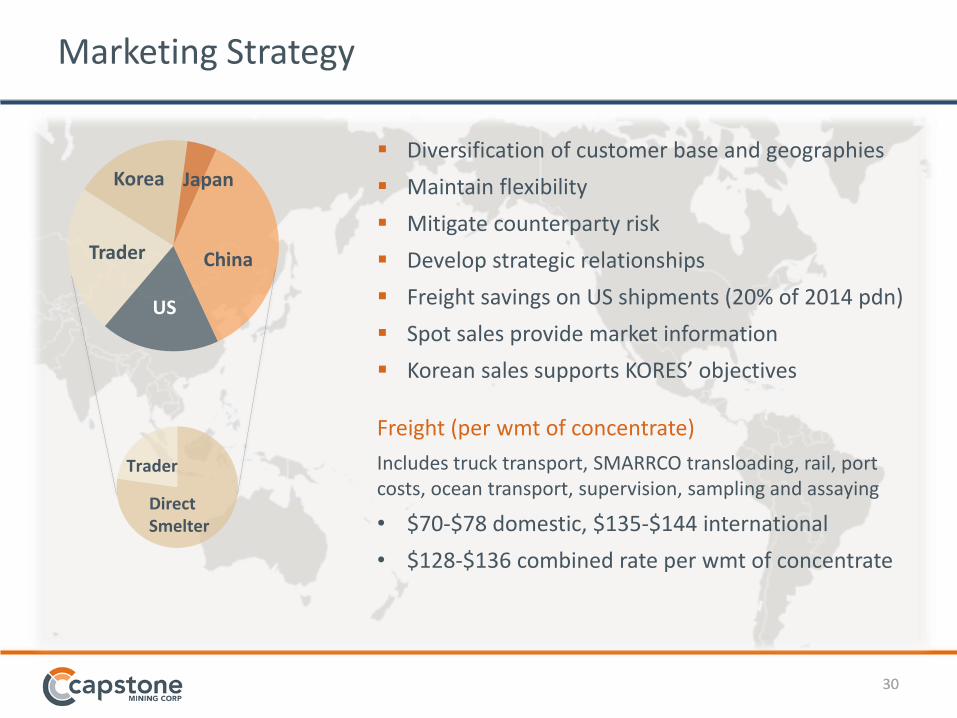
Marketing Strategy
US
Trader
Korea Japan
China
Direct Smelter
Trader
Diversification of customer base and geographies
Maintain flexibility
Mitigate counterparty risk
Develop strategic relationships
Freight savings on US shipments (20% of 2014 pdn)
Spot sales provide market information
Korean sales supports KORES’ objectives Freight (per wmt of concentrate)
Includes truck transport, SMARRCO transloading, rail, port costs, ocean transport, supervision, sampling and assaying
• $70-$78 domestic, $135-$144 international
• $128-$136 combined rate per wmt of concentrate
31 31
Improvement Initiative: Standing on Stable Ground
32
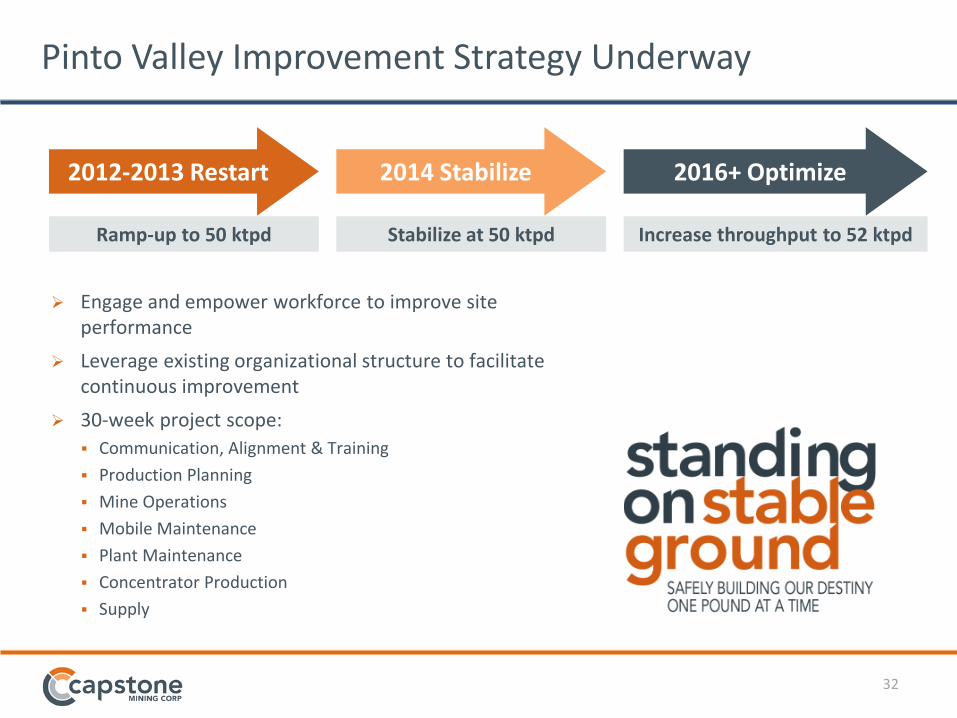
Ramp-up to 50 ktpd Stabilize at 50 ktpd
2012-2013 Restart 2014 Stabilize
Increase throughput to 52 ktpd
2016+ Optimize
Pinto Valley Improvement Strategy Underway
Engage and empower workforce to improve site performance
Leverage existing organizational structure to facilitate continuous improvement
30-week project scope:
Communication, Alignment & Training
Production Planning
Mine Operations
Mobile Maintenance
Plant Maintenance
Concentrator Production
Supply
33
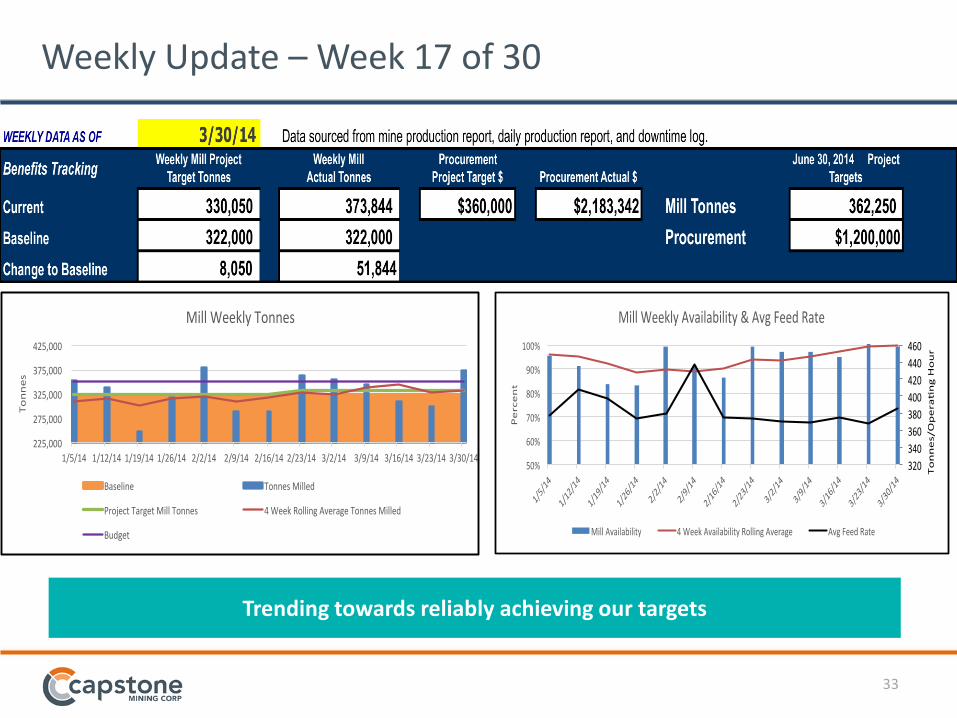
Weekly Update – Week 17 of 30
Trending towards reliably achieving our targets
225,000
275,000
325,000
375,000
425,000
1/5/14 1/12/141/19/141/26/142/2/14 2/9/14 2/16/142/23/143/2/14 3/9/143/16/143/23/143/30/14
Tonnes
MillWeeklyTonnes
Baseline TonnesMilled
ProjectTargetMillTonnes 4WeekRollingAverageTonnesMilled
Budget
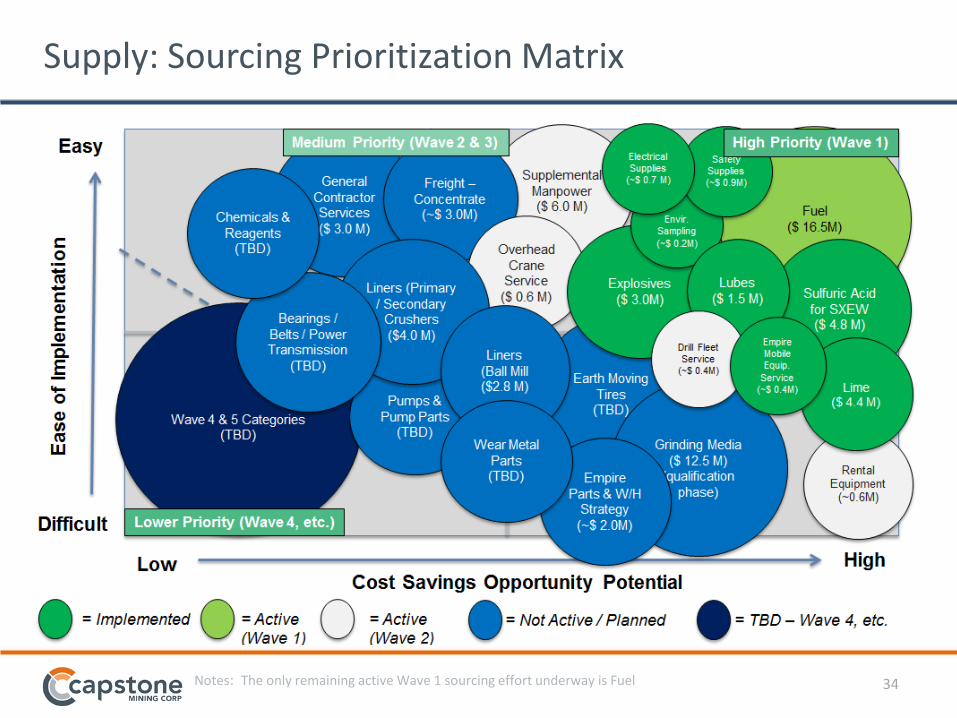
34 Notes: The only remaining active Wave 1 sourcing effort underway is Fuel
Supply: Sourcing Prioritization Matrix
35
Change Management & Improvement
Approach
Active Supervision,
Variance Management, “To Be” SFM
Effective Communication,
Management Styles, Conflict Management
Leadership, Effective
Execution, Sustainability,
Team Work
Session 1
Session 2
Session 3
Session 4
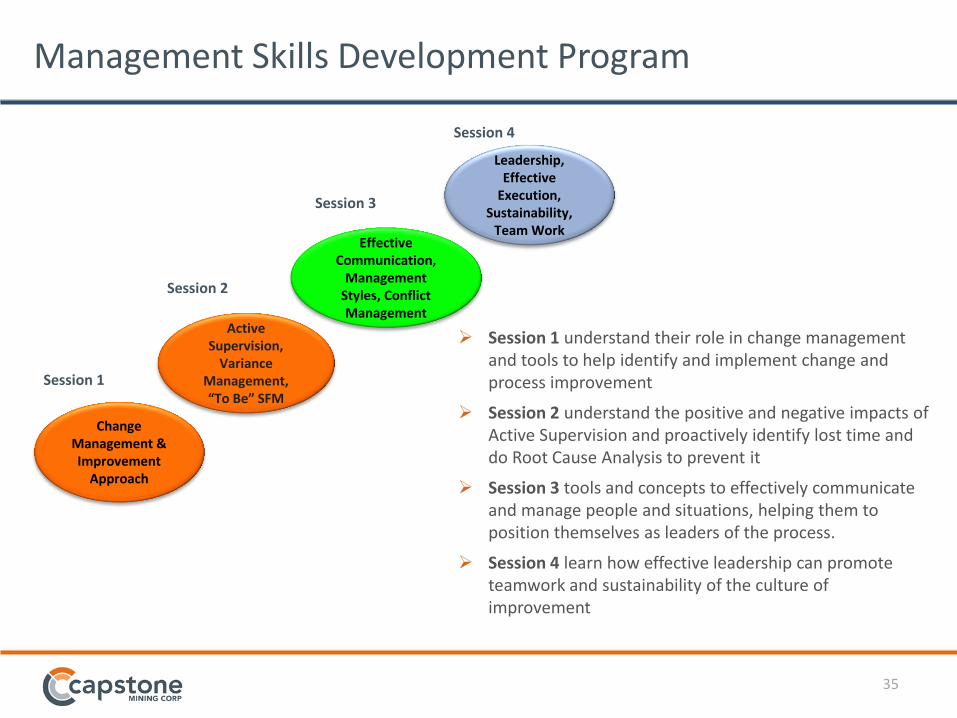
Management Skills Development Program
Session 1 understand their role in change management and tools to help identify and implement change and process improvement
Session 2 understand the positive and negative impacts of Active Supervision and proactively identify lost time and do Root Cause Analysis to prevent it
Session 3 tools and concepts to effectively communicate and manage people and situations, helping them to position themselves as leaders of the process.
Session 4 learn how effective leadership can promote teamwork and sustainability of the culture of improvement
36 36
Infrastructure
37 37
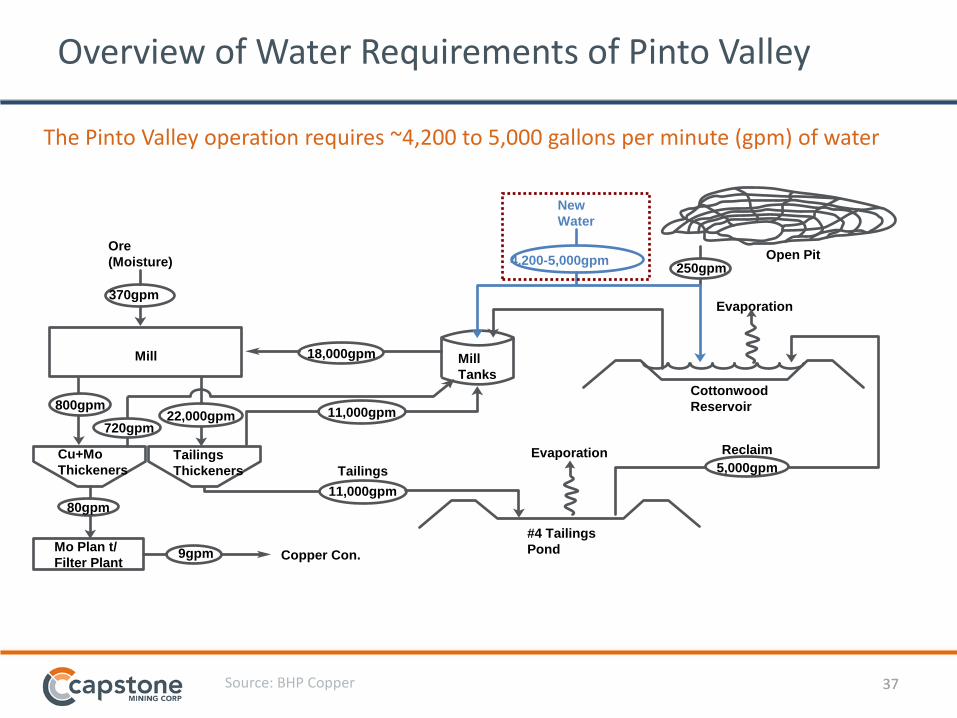
Overview of Water Requirements of Pinto Valley
The Pinto Valley operation requires ~4,200 to 5,000 gallons per minute (gpm) of water
Source: BHP Copper
Ore
(Moisture)
New
Water
370gpm
Mill
800gpm
Tailings
18,000gpm
22,000gpm
Mo Plan t/
Filter Plant Copper Con.
#4 Tailings
Pond
Evaporation
Mill
Tanks
Evaporation
250gpm Open Pit
Reclaim
370gpm
4,200-5,000gpm
Mill
800gpm
80gpm
Cu+Mo
Thickeners
11,000gpm
18,000gpm
22,000gpm
9gpm
Mill
Tanks
Cottonwood
Reservoir
250gpm
5,000gpm
11,000gpm
720gpm
Tailings
Thickeners
38 38
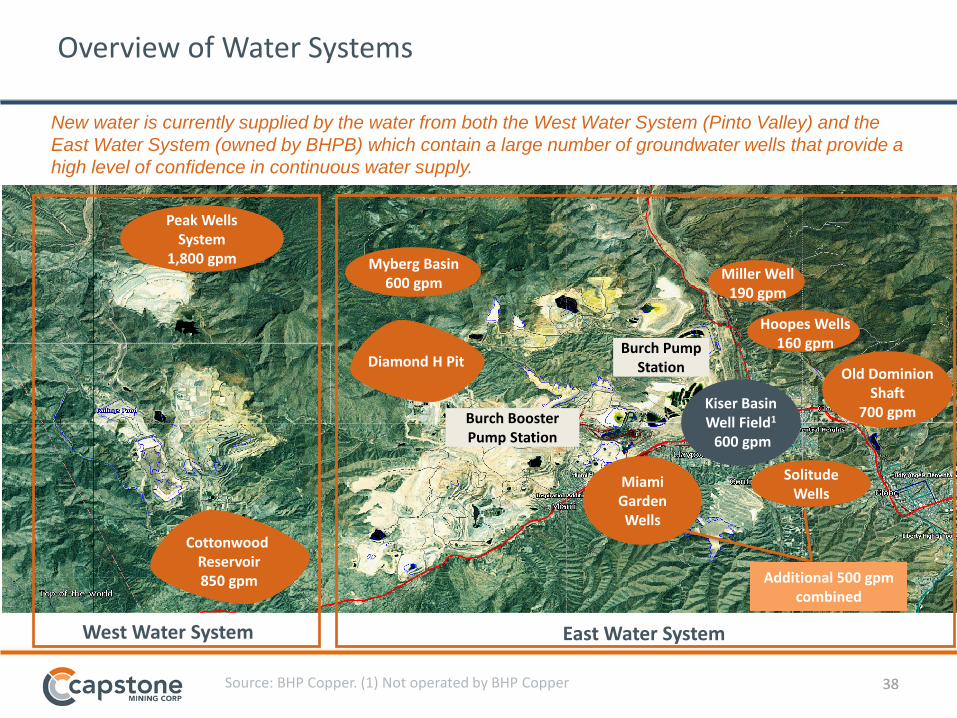
Overview of Water Systems
Burch Pump Station
Burch Booster Pump Station
New water is currently supplied by the water from both the West Water System (Pinto Valley) and the
East Water System (owned by BHPB) which contain a large number of groundwater wells that provide a
high level of confidence in continuous water supply.
East Water System West Water System
Solitude Wells
Miami Garden Wells
Peak Wells System
1,800 gpm
Cottonwood Reservoir 850 gpm
Diamond H Pit
Myberg Basin 600 gpm
Old Dominion Shaft
700 gpm
Source: BHP Copper. (1) Not operated by BHP Copper
Kiser Basin Well Field1 600 gpm
Miller Well 190 gpm
Hoopes Wells 160 gpm
Additional 500 gpm combined
39 39
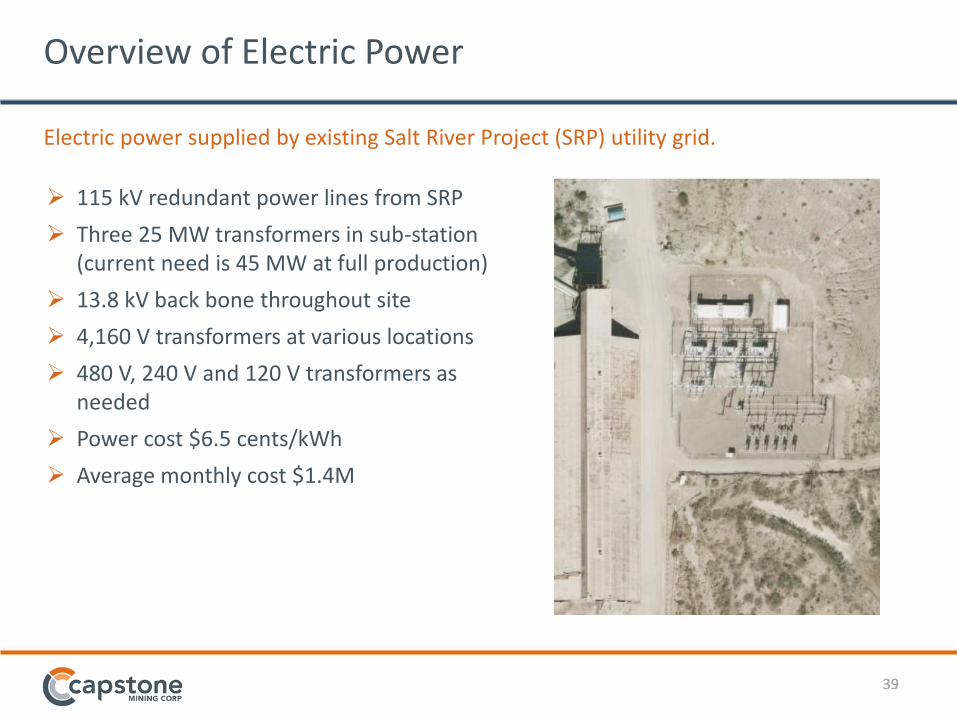
Overview of Electric Power
115 kV redundant power lines from SRP
Three 25 MW transformers in sub-station (current need is 45 MW at full production)
13.8 kV back bone throughout site
4,160 V transformers at various locations
480 V, 240 V and 120 V transformers as needed
Power cost $6.5 cents/kWh
Average monthly cost $1.4M
Electric power supplied by existing Salt River Project (SRP) utility grid.
40 40
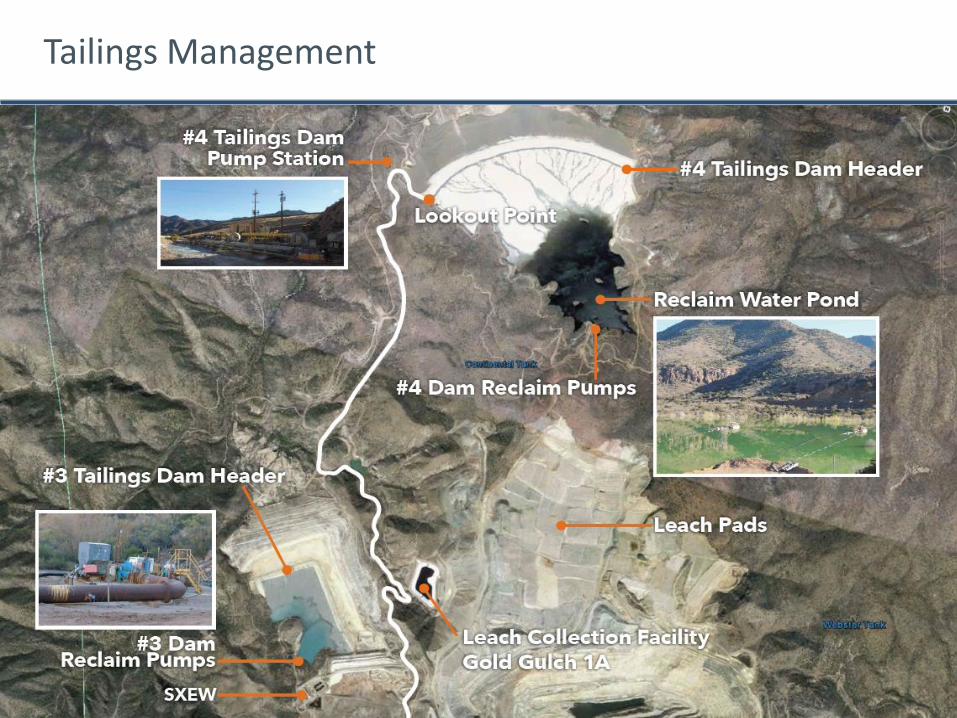
Tailings Management
41 41
People
42 42
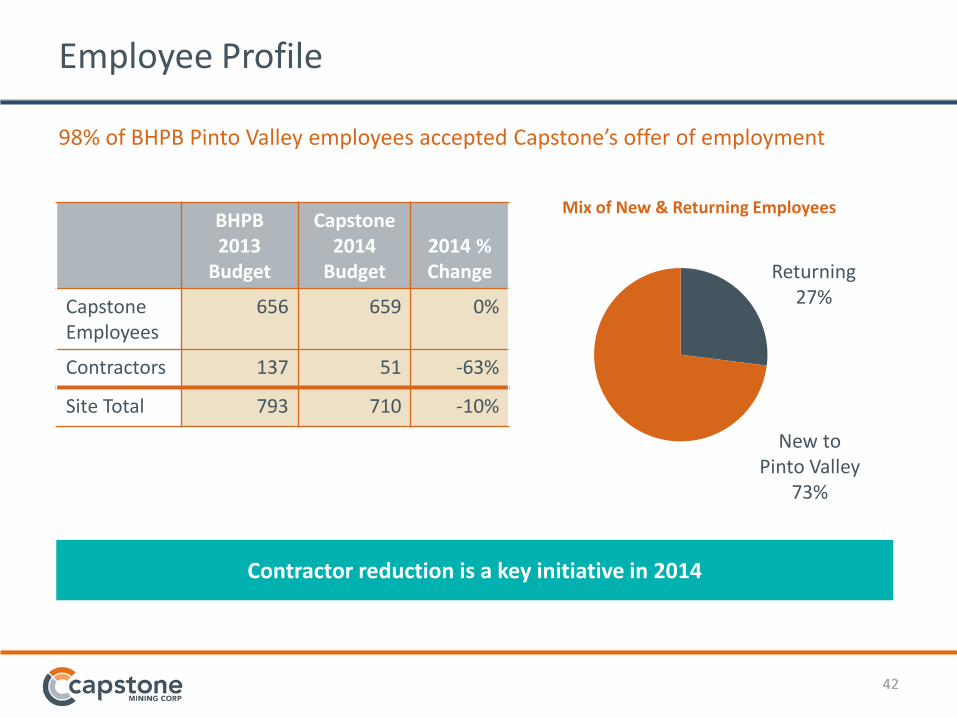
Employee Profile
BHPB 2013
Budget
Capstone 2014
Budget
2014 % Change
Capstone Employees
656 659 0%
Contractors 137 51 -63%
Site Total 793 710 -10%
Returning 27%
New to Pinto Valley
73%
Mix of New & Returning Employees
Contractor reduction is a key initiative in 2014
98% of BHPB Pinto Valley employees accepted Capstone’s offer of employment
43 43
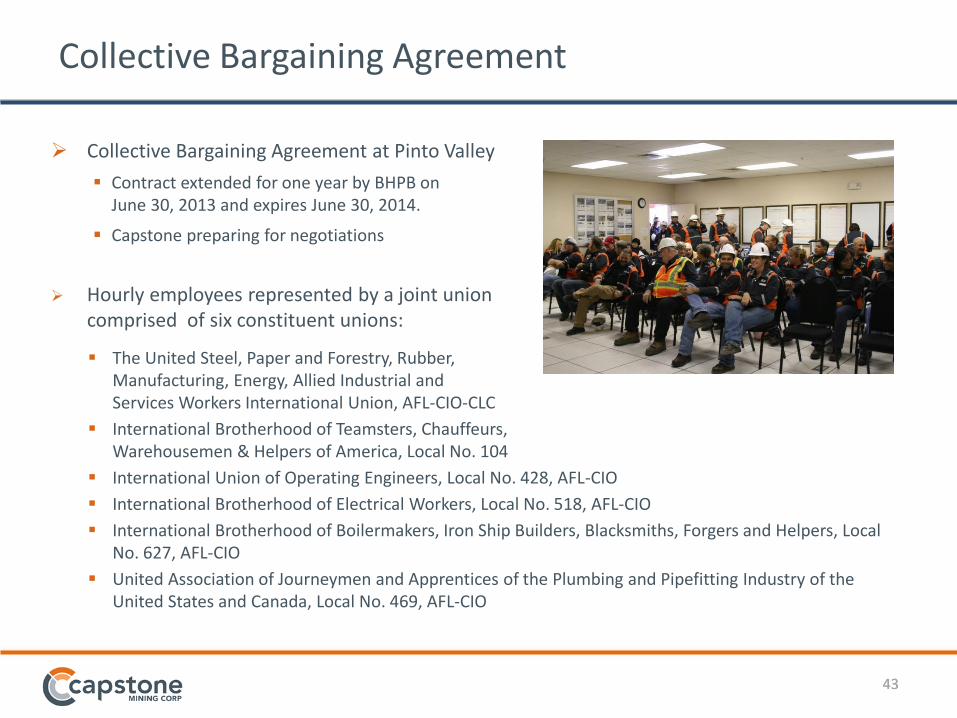
Collective Bargaining Agreement Collective Bargaining Agreement at Pinto Valley
Contract extended for one year by BHPB on June 30, 2013 and expires June 30, 2014.
Capstone preparing for negotiations
Hourly employees represented by a joint union comprised of six constituent unions:
The United Steel, Paper and Forestry, Rubber, Manufacturing, Energy, Allied Industrial and Services Workers International Union, AFL-CIO-CLC
International Brotherhood of Teamsters, Chauffeurs, Warehousemen & Helpers of America, Local No. 104
International Union of Operating Engineers, Local No. 428, AFL-CIO
International Brotherhood of Electrical Workers, Local No. 518, AFL-CIO
International Brotherhood of Boilermakers, Iron Ship Builders, Blacksmiths, Forgers and Helpers, Local No. 627, AFL-CIO
United Association of Journeymen and Apprentices of the Plumbing and Pipefitting Industry of the United States and Canada, Local No. 469, AFL-CIO
44 44
PV2: Pre-Feasibility Study
45 45
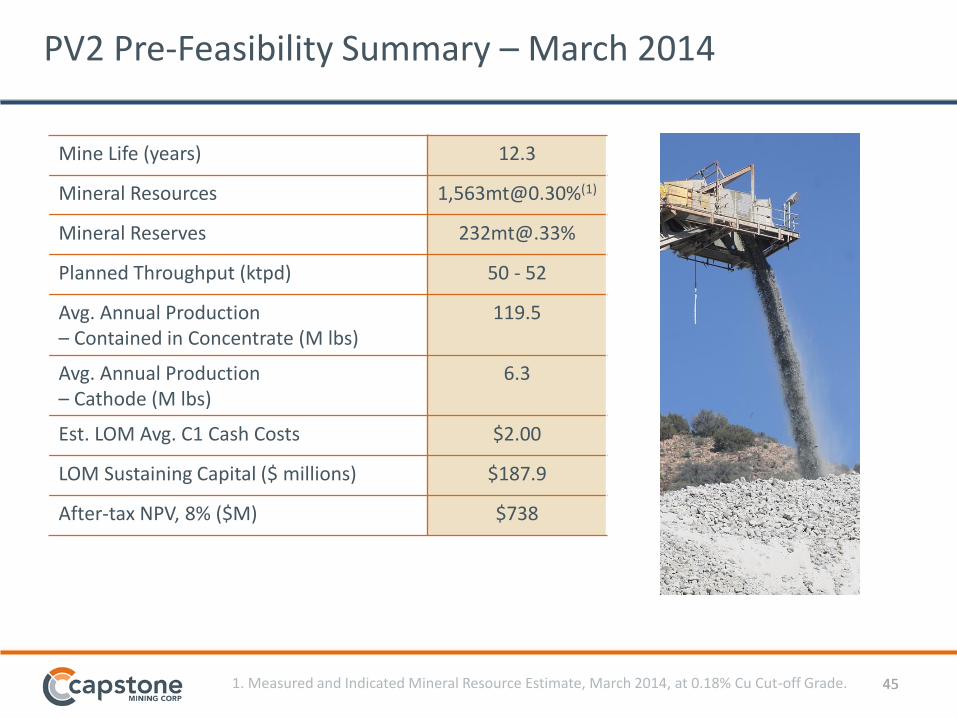
PV2 Pre-Feasibility Summary – March 2014
Mine Life (years) 12.3
Mineral Resources 1,[email protected]%(1)
Mineral Reserves [email protected]%
Planned Throughput (ktpd) 50 - 52
Avg. Annual Production – Contained in Concentrate (M lbs)
119.5
Avg. Annual Production – Cathode (M lbs)
6.3
Est. LOM Avg. C1 Cash Costs $2.00
LOM Sustaining Capital ($ millions) $187.9
After-tax NPV, 8% ($M) $738
1. Measured and Indicated Mineral Resource Estimate, March 2014, at 0.18% Cu Cut-off Grade.
46 46
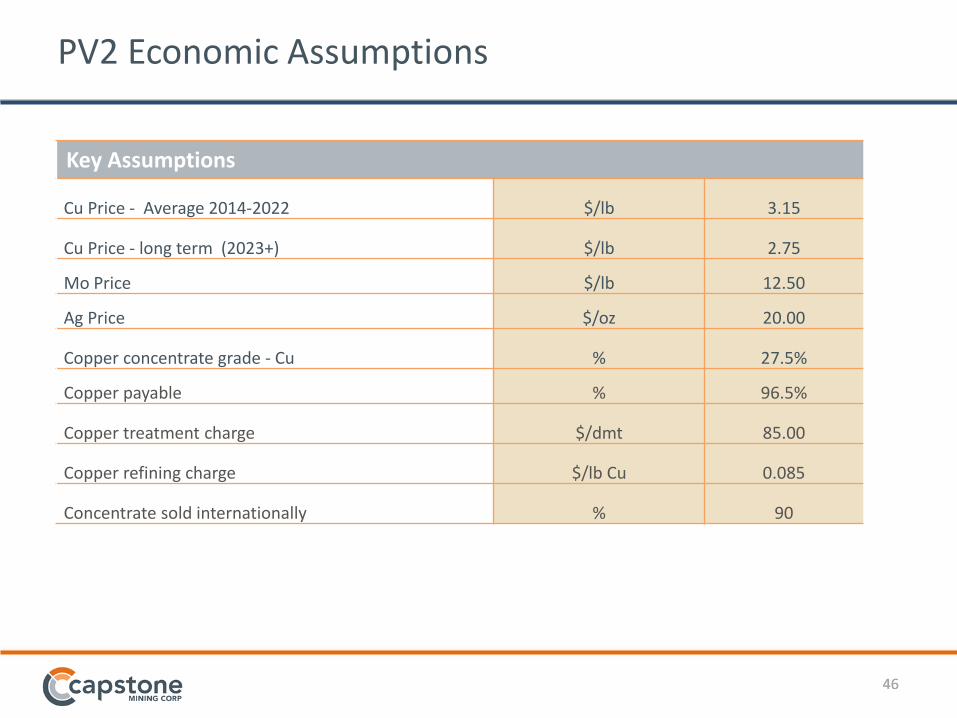
PV2 Economic Assumptions
Key Assumptions
Cu Price - Average 2014-2022 $/lb 3.15
Cu Price - long term (2023+) $/lb 2.75
Mo Price $/lb 12.50
Ag Price $/oz 20.00
Copper concentrate grade - Cu % 27.5%
Copper payable % 96.5%
Copper treatment charge $/dmt 85.00
Copper refining charge $/lb Cu 0.085
Concentrate sold internationally % 90
47
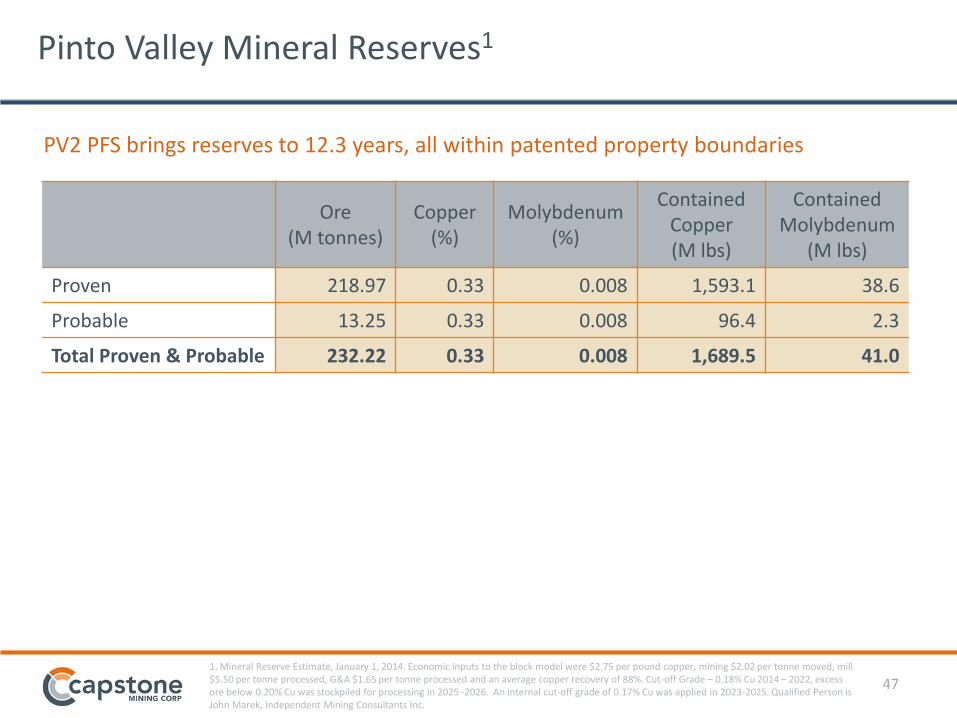
Ore (M tonnes)
Copper (%)
Molybdenum (%)
Contained Copper (M lbs)
Contained Molybdenum
(M lbs)
Proven 218.97 0.33 0.008 1,593.1 38.6
Probable 13.25 0.33 0.008 96.4 2.3
Total Proven & Probable 232.22 0.33 0.008 1,689.5 41.0
Pinto Valley Mineral Reserves1
PV2 PFS brings reserves to 12.3 years, all within patented property boundaries
1. Mineral Reserve Estimate, January 1, 2014. Economic inputs to the block model were $2.75 per pound copper, mining $2.02 per tonne moved, mill $5.50 per tonne processed, G&A $1.65 per tonne processed and an average copper recovery of 88%. Cut-off Grade – 0.18% Cu 2014 – 2022, excess ore below 0.20% Cu was stockpiled for processing in 2025 -2026. An internal cut-off grade of 0.17% Cu was applied in 2023-2025. Qualified Person is John Marek, Independent Mining Consultants Inc.
48 48
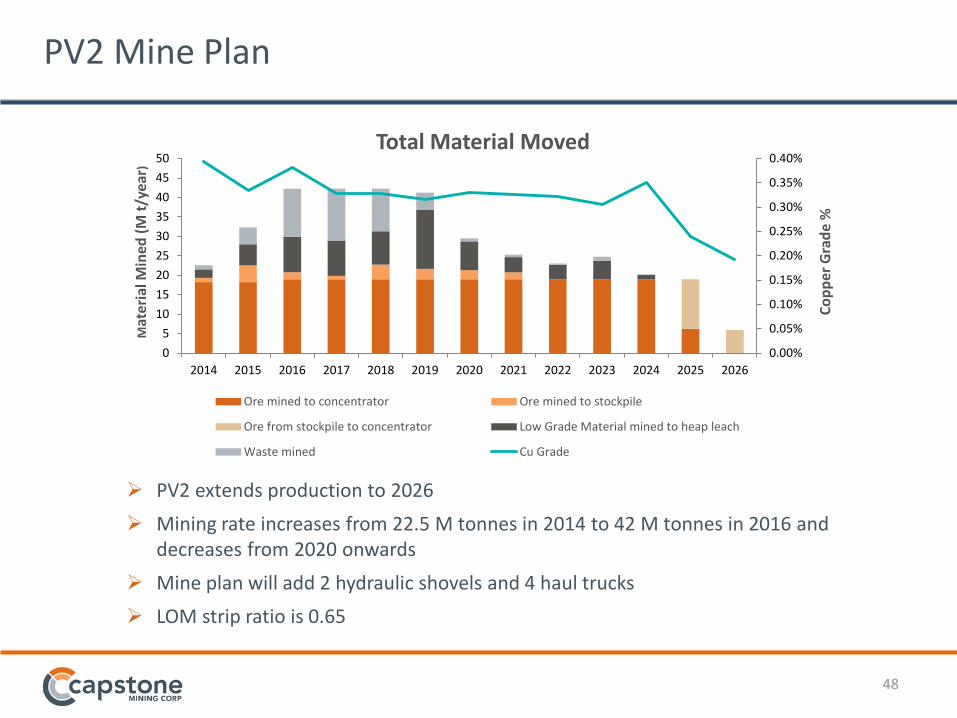
PV2 Mine Plan
PV2 extends production to 2026
Mining rate increases from 22.5 M tonnes in 2014 to 42 M tonnes in 2016 and decreases from 2020 onwards
Mine plan will add 2 hydraulic shovels and 4 haul trucks
LOM strip ratio is 0.65
0.00%
0.05%
0.10%
0.15%
0.20%
0.25%
0.30%
0.35%
0.40%
0
5
10
15
20
25
30
35
40
45
50
2014 2015 2016 2017 2018 2019 2020 2021 2022 2023 2024 2025 2026
Co
pp
er G
rad
e %
Mat
eria
l Min
ed (
M t
/yea
r)
Total Material Moved
Ore mined to concentrator Ore mined to stockpile
Ore from stockpile to concentrator Low Grade Material mined to heap leach
Waste mined Cu Grade
49 49
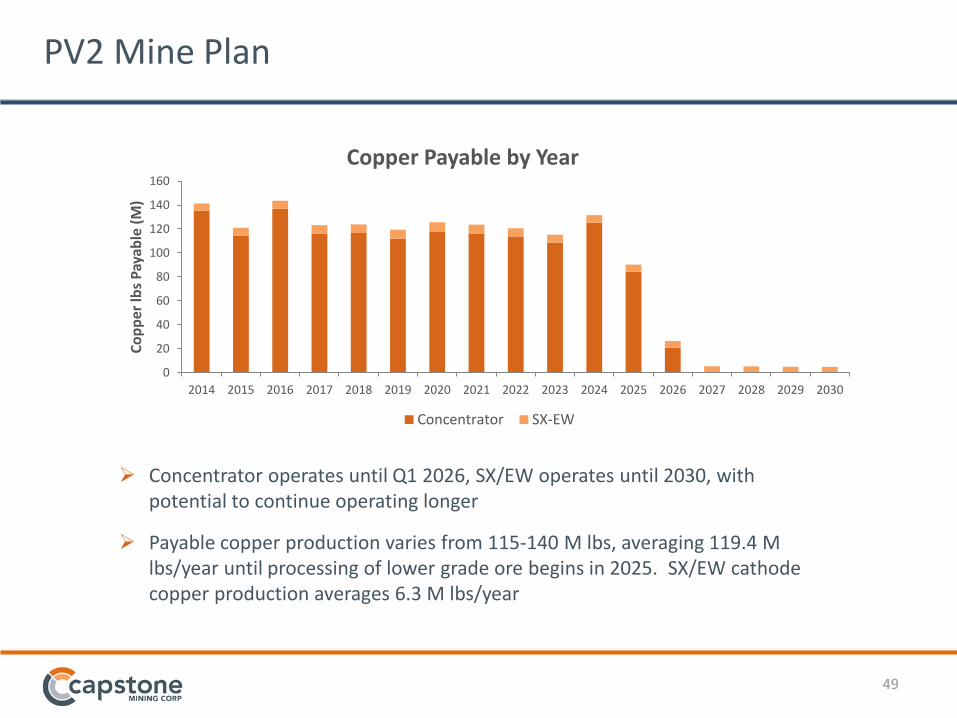
PV2 Mine Plan
Concentrator operates until Q1 2026, SX/EW operates until 2030, with potential to continue operating longer
Payable copper production varies from 115-140 M lbs, averaging 119.4 M lbs/year until processing of lower grade ore begins in 2025. SX/EW cathode copper production averages 6.3 M lbs/year
0
20
40
60
80
100
120
140
160
2014 2015 2016 2017 2018 2019 2020 2021 2022 2023 2024 2025 2026 2027 2028 2029 2030
Co
pp
er lb
s P
ayab
le (
M)
Copper Payable by Year
Concentrator SX-EW
50 50
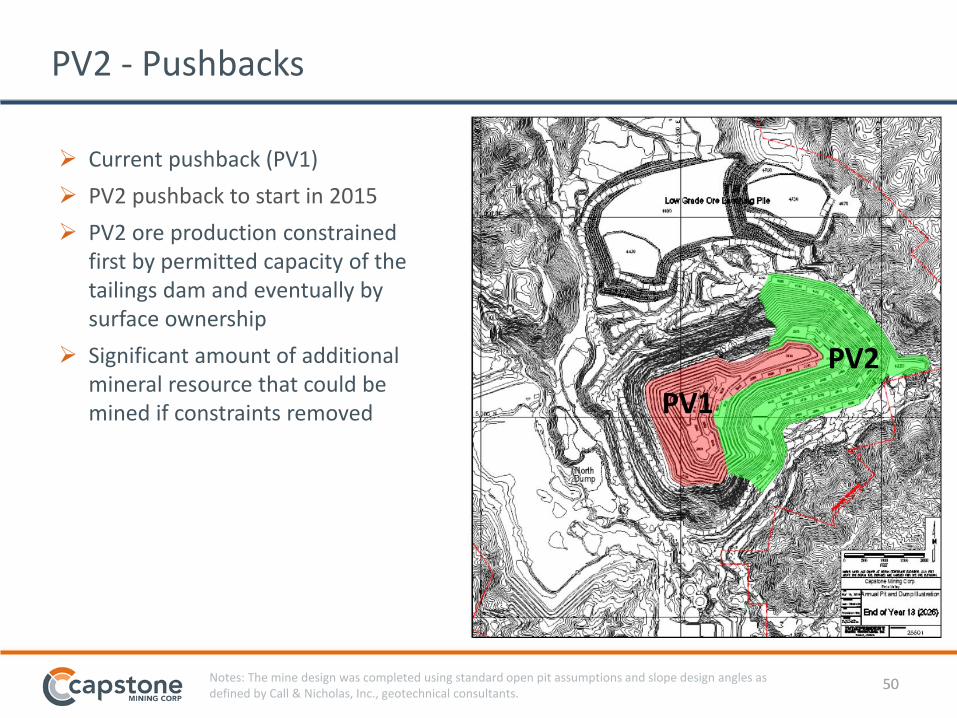
PV2 - Pushbacks
Current pushback (PV1)
PV2 pushback to start in 2015
PV2 ore production constrained first by permitted capacity of the tailings dam and eventually by surface ownership
Significant amount of additional mineral resource that could be mined if constraints removed
PV2
PV1
PV2
Notes: The mine design was completed using standard open pit assumptions and slope design angles as defined by Call & Nicholas, Inc., geotechnical consultants.
51 51
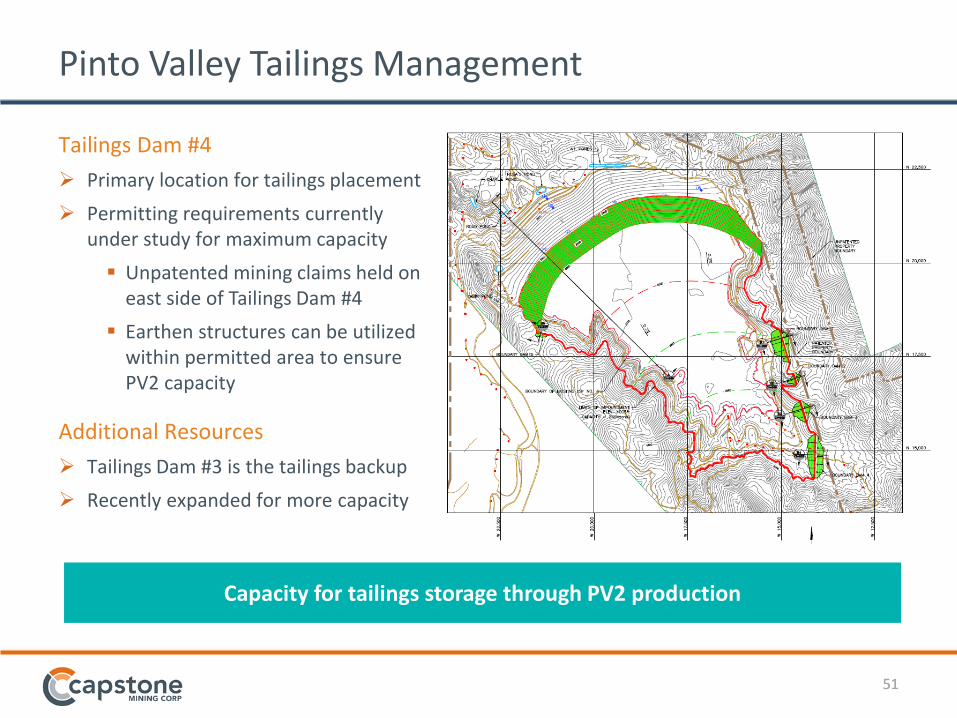
Capacity for tailings storage through PV2 production
Tailings Dam #4
Primary location for tailings placement
Permitting requirements currently under study for maximum capacity
Unpatented mining claims held on east side of Tailings Dam #4
Earthen structures can be utilized within permitted area to ensure PV2 capacity
Additional Resources
Tailings Dam #3 is the tailings backup
Recently expanded for more capacity
Pinto Valley Tailings Management
52 52
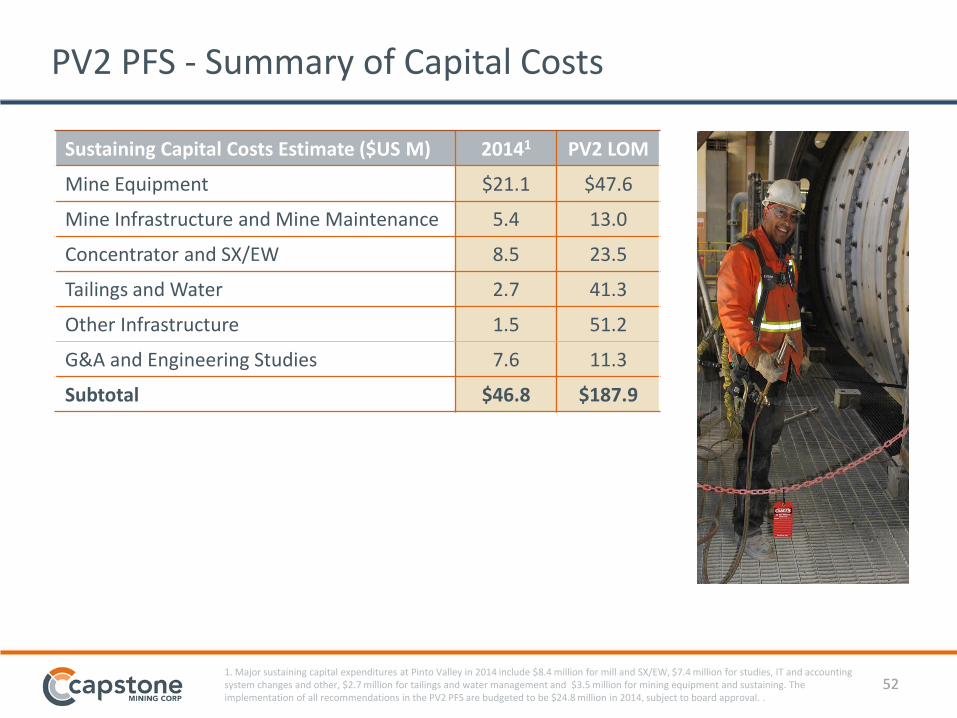
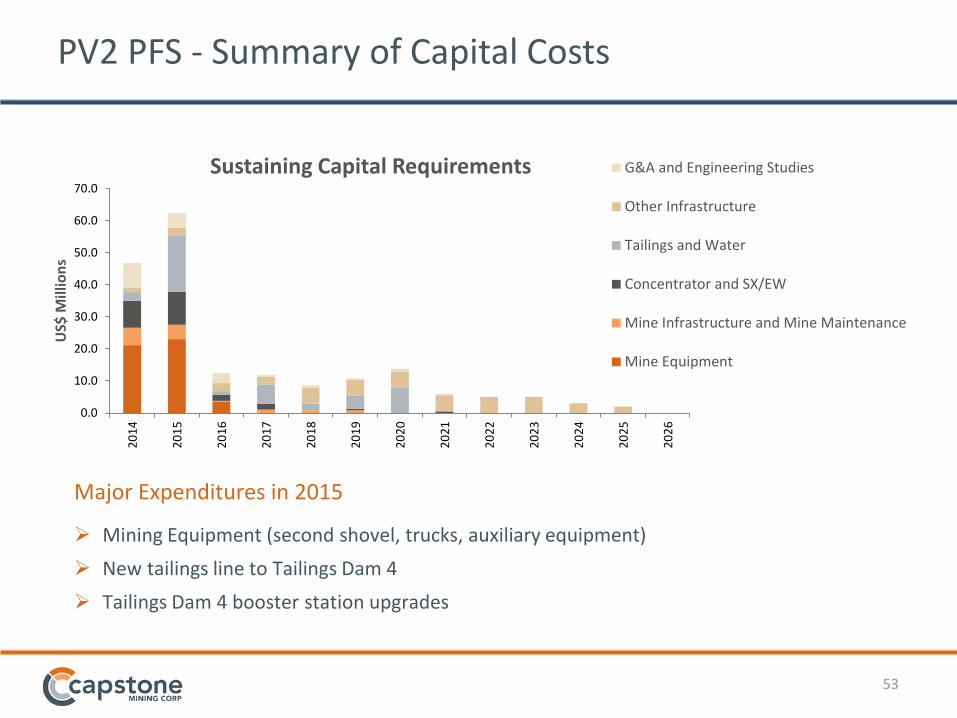
Sustaining Capital Costs Estimate ($US M) 20141 PV2 LOM
Mine Equipment $21.1 $47.6
Mine Infrastructure and Mine Maintenance 5.4 13.0
Concentrator and SX/EW 8.5 23.5
Tailings and Water 2.7 41.3
Other Infrastructure 1.5 51.2
G&A and Engineering Studies 7.6 11.3
Subtotal $46.8 $187.9
PV2 PFS - Summary of Capital Costs
1. Major sustaining capital expenditures at Pinto Valley in 2014 include $8.4 million for mill and SX/EW, $7.4 million for studies, IT and accounting system changes and other, $2.7 million for tailings and water management and $3.5 million for mining equipment and sustaining. The implementation of all recommendations in the PV2 PFS are budgeted to be $24.8 million in 2014, subject to board approval. .
53 53
PV2 PFS - Summary of Capital Costs
0.0
10.0
20.0
30.0
40.0
50.0
60.0
70.0
20
14
20
15
20
16
20
17
20
18
20
19
20
20
20
21
20
22
20
23
20
24
20
25
20
26
US$
Mill
ion
s
Sustaining Capital Requirements G&A and Engineering Studies
Other Infrastructure
Tailings and Water
Concentrator and SX/EW
Mine Infrastructure and Mine Maintenance
Mine Equipment
Major Expenditures in 2015
Mining Equipment (second shovel, trucks, auxiliary equipment)
New tailings line to Tailings Dam 4
Tailings Dam 4 booster station upgrades
54 54
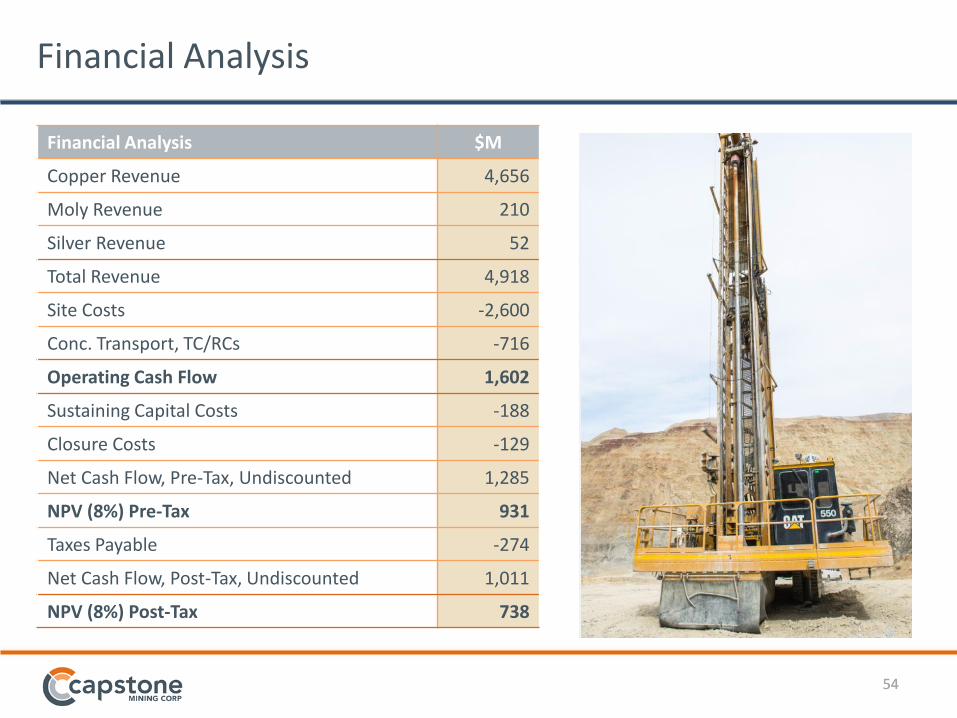
Financial Analysis
Financial Analysis $M
Copper Revenue 4,656
Moly Revenue 210
Silver Revenue 52
Total Revenue 4,918
Site Costs -2,600
Conc. Transport, TC/RCs -716
Operating Cash Flow 1,602
Sustaining Capital Costs -188
Closure Costs -129
Net Cash Flow, Pre-Tax, Undiscounted 1,285
NPV (8%) Pre-Tax 931
Taxes Payable -274
Net Cash Flow, Post-Tax, Undiscounted 1,011
NPV (8%) Post-Tax 738
55 55
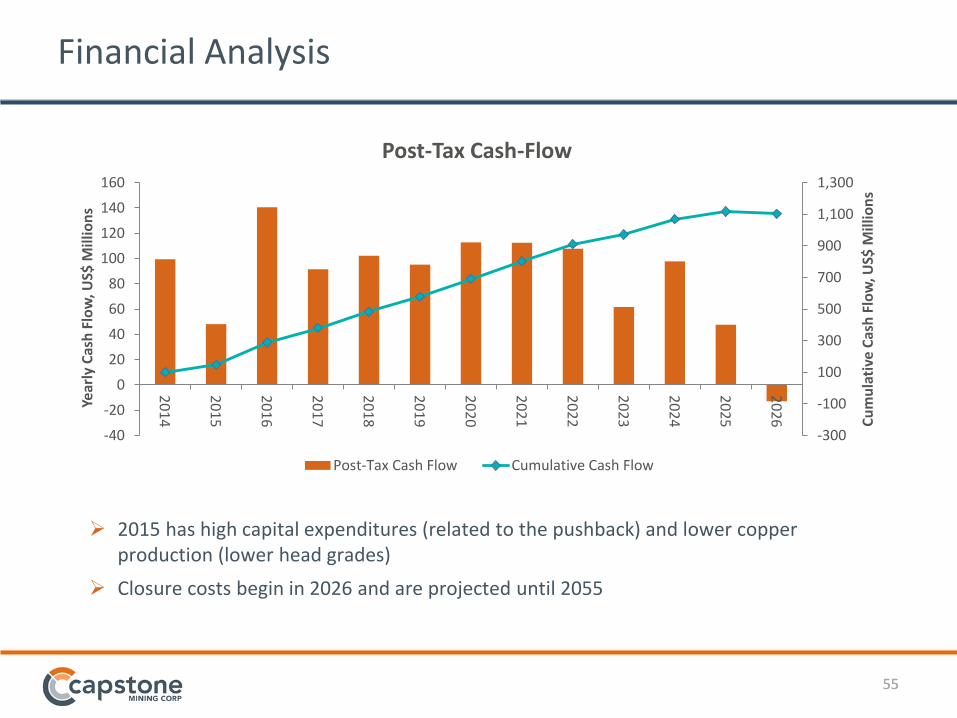
Financial Analysis
-300
-100
100
300
500
700
900
1,100
1,300
-40
-20
0
20
40
60
80
100
120
140
160
20
14
20
15
20
16
20
17
20
18
20
19
20
20
20
21
20
22
20
23
20
24
20
25
20
26 C
um
ula
tive
Cas
h F
low
, US$
Mill
ion
s
Yea
rly
Cas
h F
low
, US$
Mill
ion
s
Post-Tax Cash-Flow
Post-Tax Cash Flow Cumulative Cash Flow
2015 has high capital expenditures (related to the pushback) and lower copper production (lower head grades)
Closure costs begin in 2026 and are projected until 2055
56 56
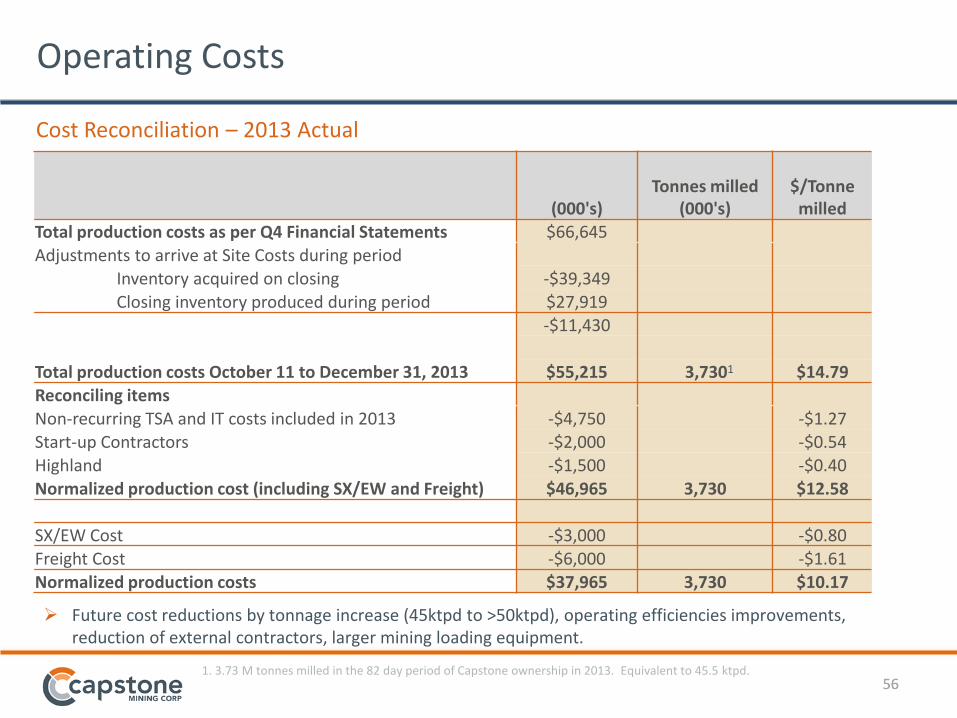
Operating Costs
(000's)
Tonnes milled (000's)
$/Tonne milled
Total production costs as per Q4 Financial Statements $66,645
Adjustments to arrive at Site Costs during period
Inventory acquired on closing -$39,349
Closing inventory produced during period $27,919
-$11,430
Total production costs October 11 to December 31, 2013 $55,215 3,7301 $14.79 Reconciling items
Non-recurring TSA and IT costs included in 2013 -$4,750 -$1.27 Start-up Contractors -$2,000 -$0.54
Highland -$1,500 -$0.40 Normalized production cost (including SX/EW and Freight) $46,965 3,730 $12.58
SX/EW Cost -$3,000 -$0.80 Freight Cost -$6,000 -$1.61
Normalized production costs $37,965 3,730 $10.17
Cost Reconciliation – 2013 Actual
Future cost reductions by tonnage increase (45ktpd to >50ktpd), operating efficiencies improvements, reduction of external contractors, larger mining loading equipment.
1. 3.73 M tonnes milled in the 82 day period of Capstone ownership in 2013. Equivalent to 45.5 ktpd.
57 57
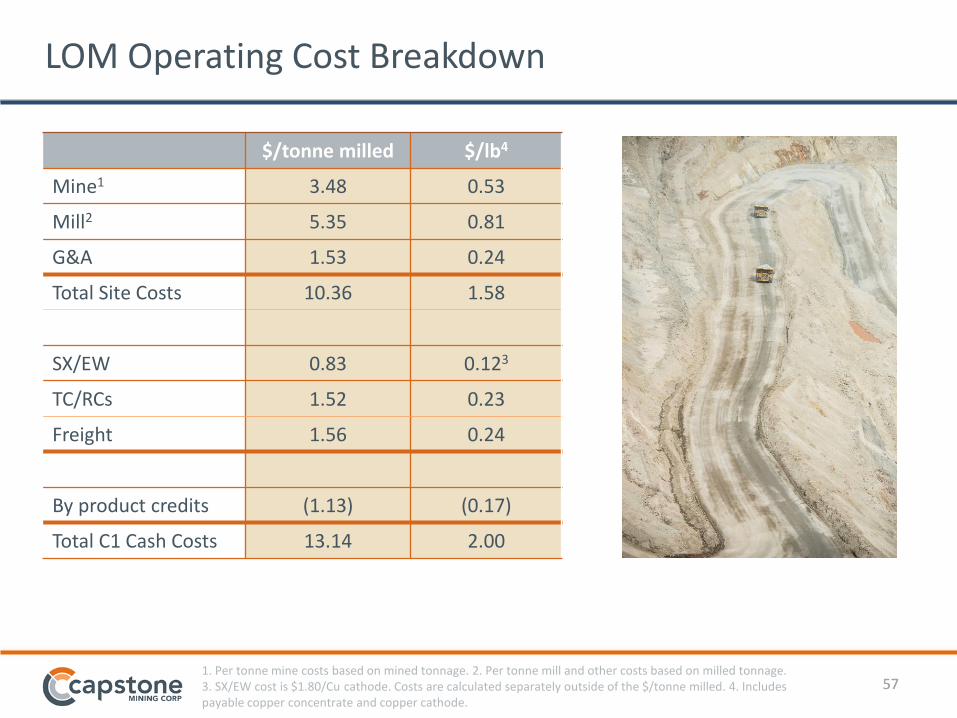
LOM Operating Cost Breakdown
1. Per tonne mine costs based on mined tonnage. 2. Per tonne mill and other costs based on milled tonnage. 3. SX/EW cost is $1.80/Cu cathode. Costs are calculated separately outside of the $/tonne milled. 4. Includes payable copper concentrate and copper cathode.
$/tonne milled $/lb4
Mine1 3.48 0.53
Mill2 5.35 0.81
G&A 1.53 0.24
Total Site Costs 10.36 1.58
SX/EW 0.83 0.123
TC/RCs 1.52 0.23
Freight 1.56 0.24
By product credits (1.13) (0.17)
Total C1 Cash Costs 13.14 2.00
58 58
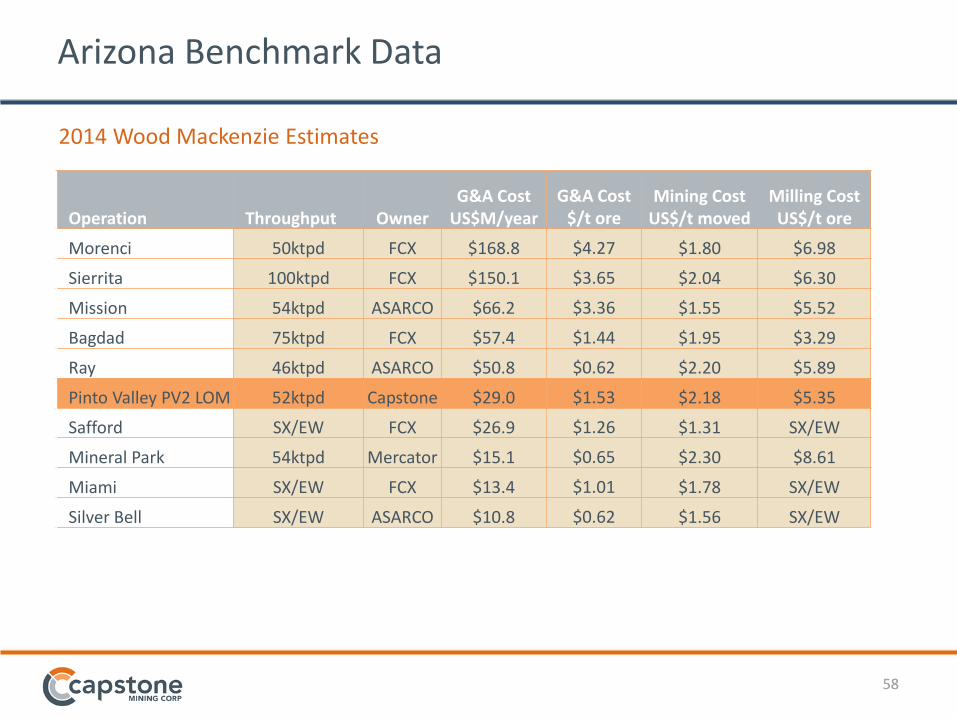
Arizona Benchmark Data
Operation Throughput Owner G&A Cost
US$M/year G&A Cost
$/t ore Mining Cost
US$/t moved Milling Cost US$/t ore
Morenci 50ktpd FCX $168.8 $4.27 $1.80 $6.98
Sierrita 100ktpd FCX $150.1 $3.65 $2.04 $6.30
Mission 54ktpd ASARCO $66.2 $3.36 $1.55 $5.52
Bagdad 75ktpd FCX $57.4 $1.44 $1.95 $3.29
Ray 46ktpd ASARCO $50.8 $0.62 $2.20 $5.89
Pinto Valley PV2 LOM 52ktpd Capstone $29.0 $1.53 $2.18 $5.35
Safford SX/EW FCX $26.9 $1.26 $1.31 SX/EW
Mineral Park 54ktpd Mercator $15.1 $0.65 $2.30 $8.61
Miami SX/EW FCX $13.4 $1.01 $1.78 SX/EW
Silver Bell SX/EW ASARCO $10.8 $0.62 $1.56 SX/EW
2014 Wood Mackenzie Estimates

59 59
PV2 Sensitivities
VARIATION
AFTER TAX NPV AFTER TAX NPV
@ 0%
($M) @ 8.0%
($M)
Copper Price
-20% 306 254
-10% 682 512
Base Case 1,011 738
10% 1,324 952
20% 1,620 1,155
Total Operating Costs
-20% 1,415 1,011
-10% 1,221 880
Base Case 1,011 738
10% 785 585
20% 537 418
60 60
2014 Guidance
61 61
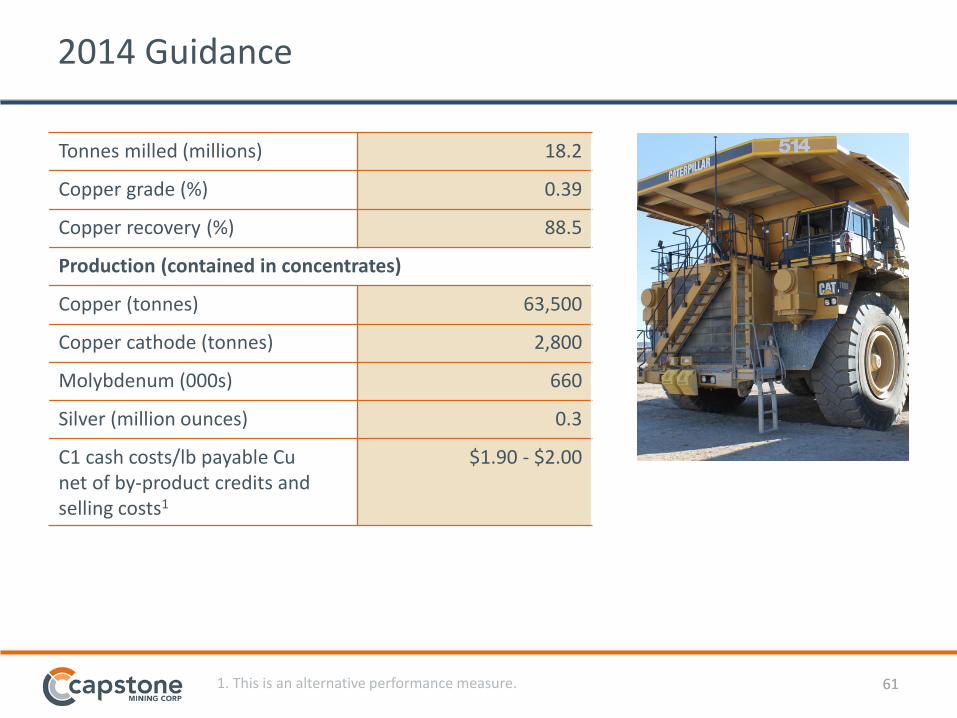
2014 Guidance
Tonnes milled (millions) 18.2
Copper grade (%) 0.39
Copper recovery (%) 88.5
Production (contained in concentrates)
Copper (tonnes) 63,500
Copper cathode (tonnes) 2,800
Molybdenum (000s) 660
Silver (million ounces) 0.3
C1 cash costs/lb payable Cu net of by-product credits and selling costs1
$1.90 - $2.00
1. This is an alternative performance measure.
62 62
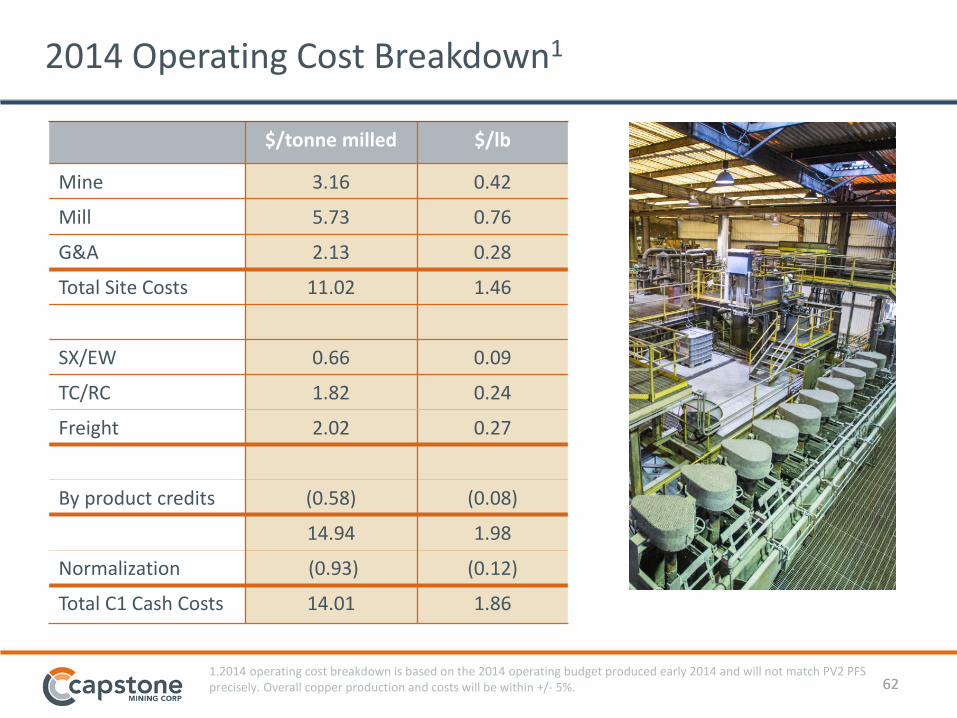
2014 Operating Cost Breakdown1
$/tonne milled $/lb
Mine 3.16 0.42
Mill 5.73 0.76
G&A 2.13 0.28
Total Site Costs 11.02 1.46
SX/EW 0.66 0.09
TC/RC 1.82 0.24
Freight 2.02 0.27
By product credits (0.58) (0.08)
14.94 1.98
Normalization (0.93) (0.12)
Total C1 Cash Costs 14.01 1.86
1.2014 operating cost breakdown is based on the 2014 operating budget produced early 2014 and will not match PV2 PFS precisely. Overall copper production and costs will be within +/- 5%.
63 63
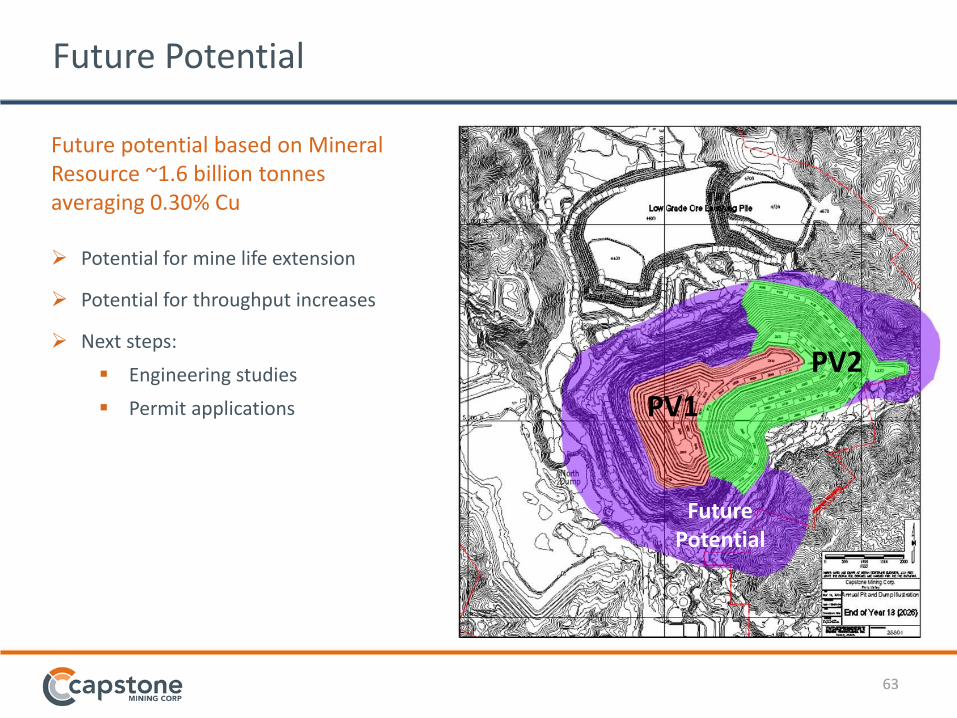
Future Potential
Future potential based on Mineral Resource ~1.6 billion tonnes averaging 0.30% Cu Potential for mine life extension
Potential for throughput increases
Next steps:
Engineering studies
Permit applications
PV1
PV2
Future Potential
64 64
HSEC and Permitting
65 65
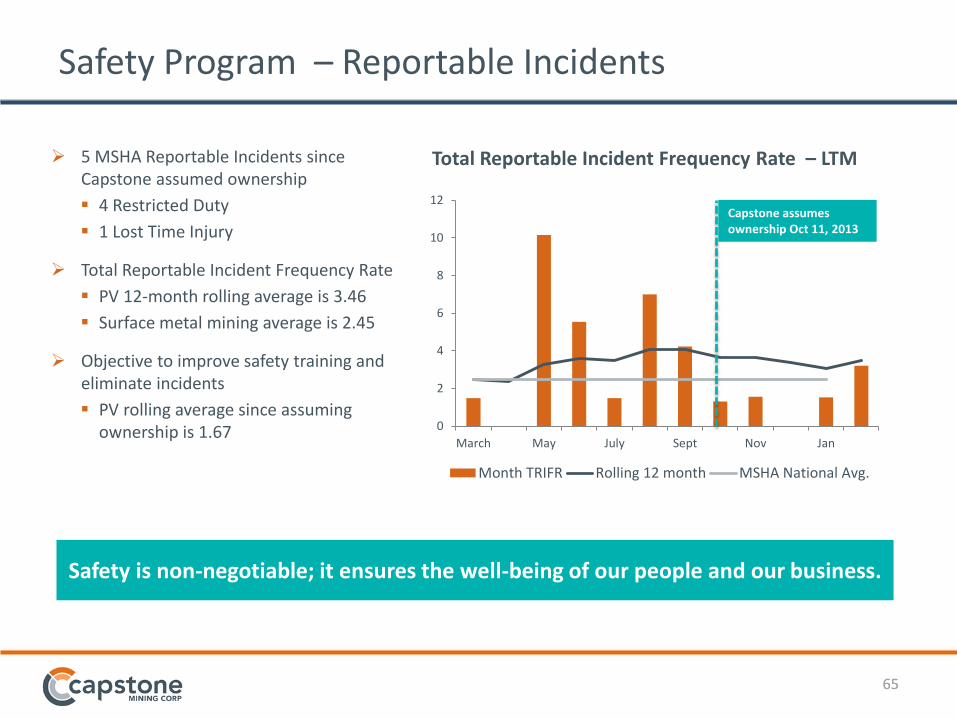
Safety Program – Reportable Incidents
Total Reportable Incident Frequency Rate – LTM
0
2
4
6
8
10
12
March May July Sept Nov Jan
Month TRIFR Rolling 12 month MSHA National Avg.
Safety is non-negotiable; it ensures the well-being of our people and our business.
5 MSHA Reportable Incidents since Capstone assumed ownership
4 Restricted Duty
1 Lost Time Injury
Total Reportable Incident Frequency Rate
PV 12-month rolling average is 3.46
Surface metal mining average is 2.45
Objective to improve safety training and eliminate incidents
PV rolling average since assuming ownership is 1.67
Capstone assumes ownership Oct 11, 2013
66 66
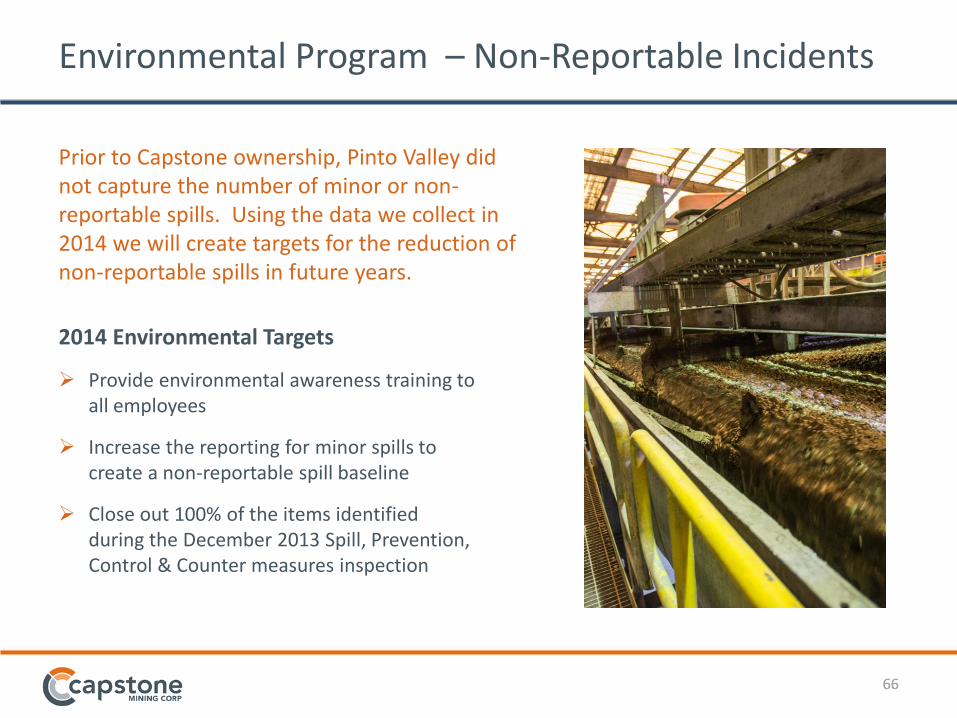
Environmental Program – Non-Reportable Incidents
2014 Environmental Targets
Provide environmental awareness training to all employees
Increase the reporting for minor spills to create a non-reportable spill baseline
Close out 100% of the items identified during the December 2013 Spill, Prevention, Control & Counter measures inspection
Prior to Capstone ownership, Pinto Valley did not capture the number of minor or non-reportable spills. Using the data we collect in 2014 we will create targets for the reduction of non-reportable spills in future years.
67 67
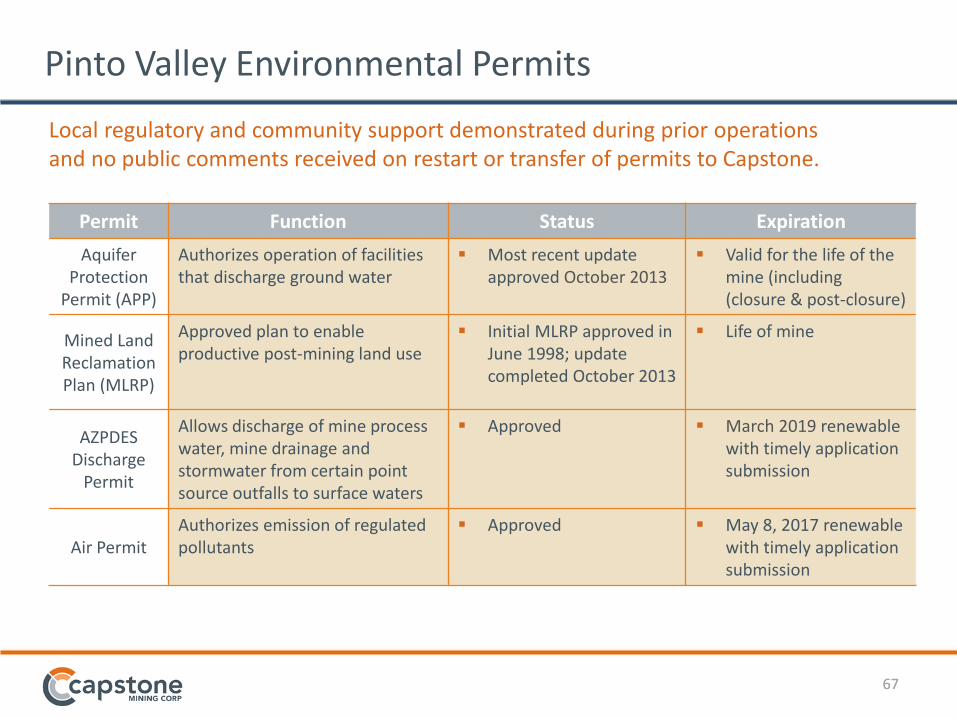
Permit Function Status Expiration
Aquifer Protection
Permit (APP)
Authorizes operation of facilities that discharge ground water
Most recent update approved October 2013
Valid for the life of the mine (including (closure & post-closure)
Mined Land Reclamation Plan (MLRP)
Approved plan to enable productive post-mining land use
Initial MLRP approved in June 1998; update completed October 2013
Life of mine
AZPDES Discharge
Permit
Allows discharge of mine process water, mine drainage and stormwater from certain point source outfalls to surface waters
Approved March 2019 renewable with timely application submission
Air Permit Authorizes emission of regulated pollutants
Approved May 8, 2017 renewable with timely application submission
Pinto Valley Environmental Permits
Local regulatory and community support demonstrated during prior operations and no public comments received on restart or transfer of permits to Capstone.
68 68
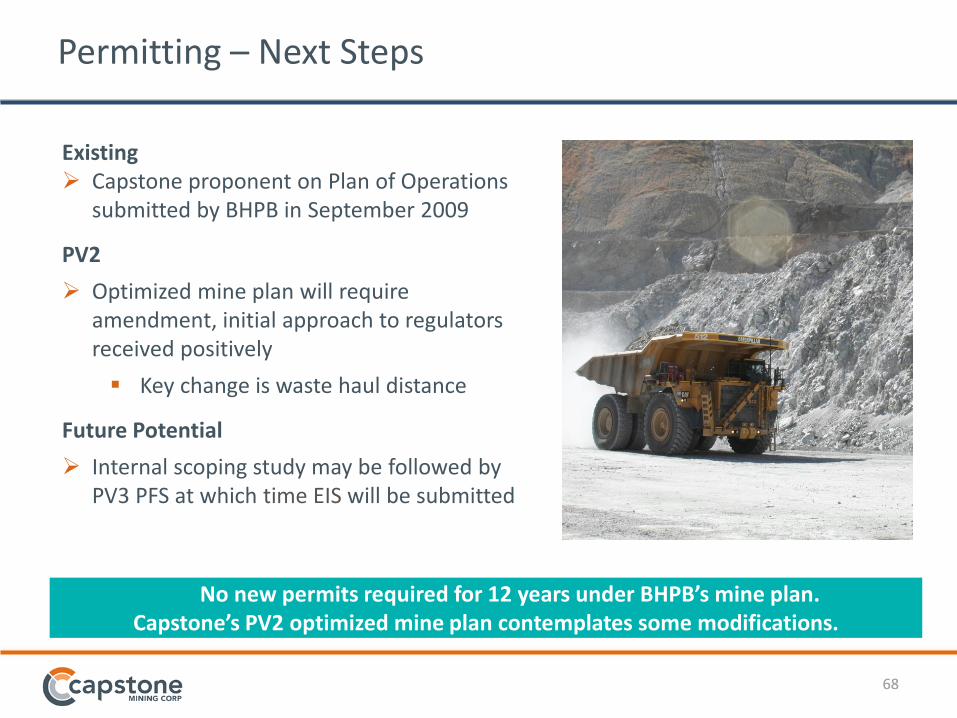
Permitting – Next Steps
Existing Capstone proponent on Plan of Operations
submitted by BHPB in September 2009
PV2
Optimized mine plan will require amendment, initial approach to regulators received positively
Key change is waste haul distance
Future Potential
Internal scoping study may be followed by PV3 PFS at which time EIS will be submitted
No new permits required for 12 years under BHPB’s mine plan. Capstone’s PV2 optimized mine plan contemplates some modifications.
69 69
Unless otherwise indicated, Capstone has prepared the technical information in this presentation (“Technical Information”) based on information contained in the
technical reports and news releases (collectively the “Disclosure Documents”) available under Capstone Mining Corp.’s company profile on SEDAR at www.sedar.com. Each
Disclosure Document was prepared by or under the supervision of a qualified person (a “Qualified Person”) as defined in National Instrument 43-101 – Standards of
Disclosure for Mineral Projects of the Canadian Securities Administrators (“NI 43-101”). For readers to fully understand the information in this presentation, they should
read the Technical Reports (available on www.sedar.com) in their entirety, including all qualifications, assumptions and exclusions that relate to the information set out in
this presentation which qualifies the Technical Information. Readers are advised that mineral resources that are not mineral reserves do not have demonstrated economic
viability. The Disclosure Documents are each intended to be read as a whole, and sections should not be read or relied upon out of context. The Technical Information is
subject to the assumptions and qualifications contained in the Disclosure Documents.
The technical information in this presentation has been prepared in accordance with Canadian regulatory requirements set out in National Instrument 43-101 Standards of
Disclosure for Mineral Projects of the Canadian Securities Administrators ("NI 43-101") and reviewed by Brad Skeeles, P.Eng. VP of North American Operations (Technical
Information related to mining and production) and Brad Mercer, P. Geol., Senior Vice President, Exploration (Technical Information related to mineral exploration
activities), and reviewed and approved by Gregg Bush, P. Eng., Senior Vice President and Chief Operating Officer for Capstone Mining, all "Qualified Persons" under NI 43-
101.
The PV2 PFS project was directed by Capstone with contributions from Kirkham Geosystems Ltd. (geology, Resource estimation), Independent Mining Consultants Inc.
(reserve, geotechnical, mine design and schedule, equipment selection), KWM Consulting Inc. (metallurgy, mill operation), AMEC Environment & Infrastructure Inc.
(tailings), Stantec (Infrastructure and PFS report compilation), SRK (US), Inc. (environmental), and Adam M Consulting Inc. (financial modelling). Personnel from each of
these companies will be signing off as a QP as defined in NI 43-101 for their specific responsibilities. The following QP’s will author the technical report: Mel Lawson, P.E. of
Stantec, Garth Kirkham, P.Geo. of Kirkham Geosystems Ltd., John Marek P.E. of Independent Mining Consultants, Inc., Ken Majors P.Eng. of KWM Consulting Inc, Tony
Freiman, P.E. of AMEC Inc., Adam Majorkiewicz, P.Eng of Adam M Consulting Inc. and Cori Hoag C.P.G. of SRK.
The March 2014 Mineral Resource estimate reported herein for the Pinto Valley property was prepared by Garth Kirkham, P. Geo, Kirkham Geosystems Ltd., an
independent QP. Based on the Mineral Resource Estimate, a standard methodology for pit limit analysis, mining sequence, and cut-off grade optimization, including
application of mining dilution, process recovery, economic criteria and physical mine and plant operating constraints, has been followed to design the Pinto Valley pit and
determine the Mineral Reserve Estimate.
Compliance with NI 43-101
70
For additional information, please visit capstonemining.com or contact us at:
Phone: +1-604-684-8894
Toll Free: 1-866-684-8894
Email: [email protected]
Last updated March 25, 2014