Embed Size (px)
Citation preview

2004 © David Kirjassoff
FocusFocus
How can a development engineering organizationIncrease the flow of new productsBy taking the perspective of operating a development pipeline?

2004 © David Kirjassoff
Pipeline ThinkingPipeline Thinking
Common for operations/manufacturing (and chemical engineers!)– Processes and workflow are visible, and explicit– Work flowing through the pipe is routine and
repeatable– Capacity, throughput, bottlenecks are designed in and
managed– The pipeline is managed for continuous improvement
But it hasn’t always been that way…

2004 © David Kirjassoff
Pipeline Evolution in OperationsPipeline Evolution in Operations
Load and Chase
ProductionControl
Lean Manufacturing
Job Shop
Effic
ienc
y
Time

2004 © David Kirjassoff
Pipeline ThinkingPipeline Thinking
Less common for design/development– Process and workflow is invisible, and in a
constant state of flux– Work flowing in the pipe is highly variable,
often indeterminate– Capacity, throughput are often secondary
considerations– Projects are managed for improvement, often
the pipeline is not
2004 © David Kirjassoff
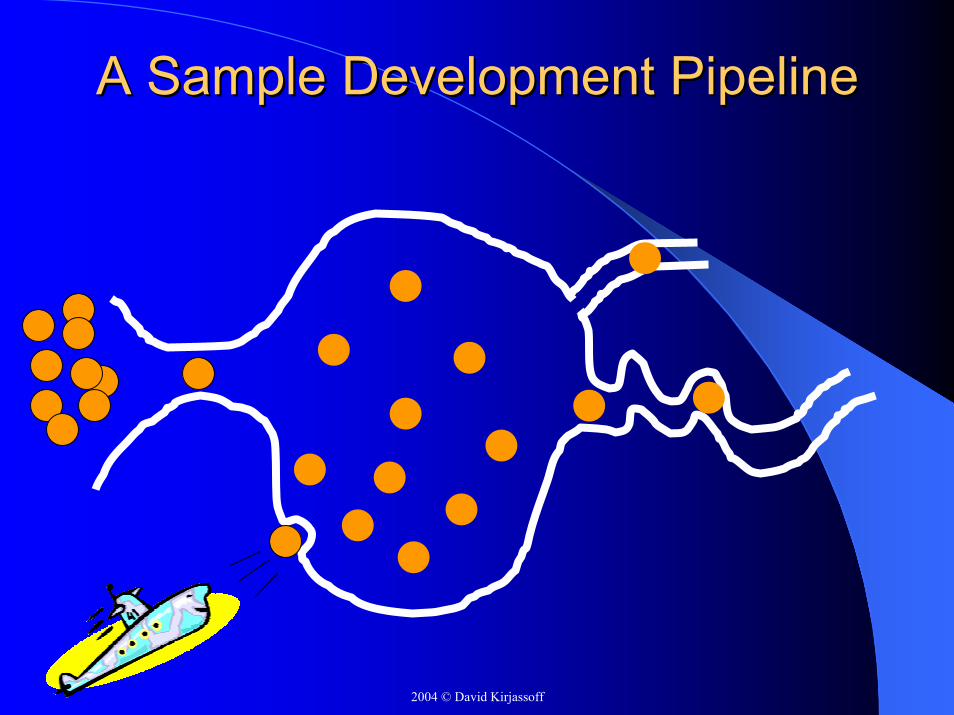
A Sample Development PipelineA Sample Development Pipeline

2004 © David Kirjassoff
Common Development Pipeline Common Development Pipeline ProblemsProblems
Good new ideas spoil; waiting for someone to start working on themToo many projects for too few resourcesConstantly shifting prioritiesNew work slips in unannouncedHalf-baked work is rushed to completionLots of work is sort of on hold, but nothing ever goes away

2004 © David Kirjassoff
Pipeline ManagementPipeline ManagementDefinition:– The process of managing a portfolio of separate
development projects across a common group of resources (people, processes, tools)
Three main focus areas:– Pipeline Design
What do we want our development process to look like, and what capacity do we want to establish?
– Pipeline OperationHow do we best operate the pipeline we have, and how do we know how well its working?
– Pipeline ImprovementHow do we take what we are learning during pipeline operation, and translate it into improvements in pipeline design?

2004 © David Kirjassoff
Pipeline Design ConsiderationsPipeline Design Considerations
Length– Where does the development pipeline start and end?
Width– How many projects do we want to work on at once?
How much capacity do we need to provide?
Shape– What should the pipeline look like?– One pipeline for all, or special purpose pipes?

2004 © David Kirjassoff
Pipeline Length Pipeline Length –– Start PointStart Point
Idea Concept
Beware the fuzzy front end
Consider separating discovery from development
Product
Discovery Team Development Team
Idea Concept Product

2004 © David Kirjassoff
Pipeline Length Pipeline Length –– End PointEnd Point
Avoid the sustaining engineering black hole
Separate design resources from sustaining resourcesClearly define the handoff from development to sustaining
Sustaining
Development

2004 © David Kirjassoff
Pipeline WidthPipeline Width
How many projects do we want to work on at once?Consider two extremes:
Start Many
Time
Proj
ect C
Proj
ect B
Proj
ect A
Start Few
Project C
Project A
Res
ourc
es
Res
ourc
es
Project B
Time

2004 © David Kirjassoff
Advantages:Advantages:Start Fewer, Finish QuickerStart Fewer, Finish Quicker
Multiple resources involved, easier to deal with resource disruptionSmaller window to introduce changes or deal with reprioritizationEasier to forecast customer needs over shorter time horizonCycles of learning for both team development and project contentBenefits of completed work begin accruing earlier

2004 © David Kirjassoff
Pipeline WidthPipeline WidthHow much capacity do we need to provide?
Capacity Utilization
Ave
rage
Cyc
le-T
ime
What has the greater impact your profitability – Time-to-market or– Productivity
100%

2004 © David Kirjassoff
Pipeline ShapePipeline Shape

2004 © David Kirjassoff
The Pipeline(s) have to Supply The Pipeline(s) have to Supply the Product Portfoliothe Product Portfolio
New
Performance EnhancementRevs/Updates
Breakthrough ProductsDerivatives/Spins
Exis
ting
Mar
kets
Existing Technology New

2004 © David Kirjassoff
Pipeline Operational Pipeline Operational ConsiderationsConsiderations
How do projects get defined and initiated? How are priorities established and maintained across pending and active projects?How are resources allocated to projects on an initial and ongoing basis?How is forward progress tracked and maintained for active projects?
Let’s look at these from both a “getting started” and a best practices perspective

2004 © David Kirjassoff
Getting StartedGetting Started
Inventory current projectsDrain the swampPrioritize what’s leftGet some control on the input

2004 © David Kirjassoff
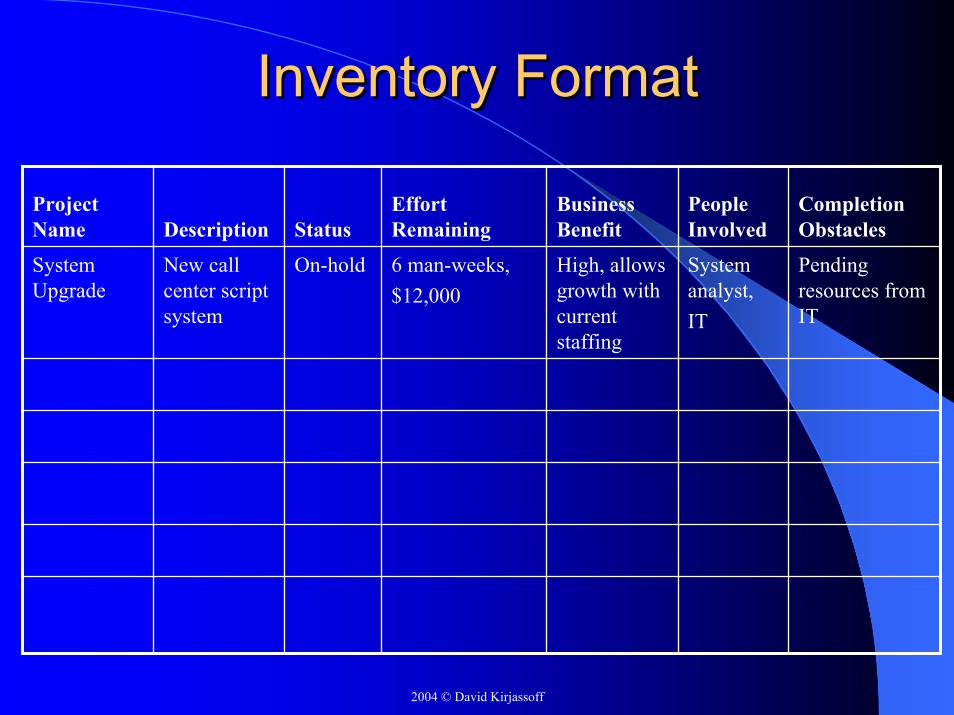
Inventory Current ProjectsInventory Current Projects
Generate a list of all active and on-hold projectsIdentify (or assign) an “owner” for each projectAsk owners to estimate:– Effort remaining (man-hours, calendar time, $$)– Business benefit ($$, H/M/L, etc.)– Team members involved (and time %)– Current status (active, on-hold, stalled)– Obstacles to completion
Tabulate and circulate summary for review/comment
2004 © David Kirjassoff
Inventory FormatInventory Format
System analyst,IT
People Involved
Pending resources from IT
High, allows growth with current staffing
6 man-weeks,$12,000
On-holdNew call center script system
System Upgrade
Completion Obstacles
Business Benefit
Effort RemainingStatusDescription
Project Name

2004 © David Kirjassoff
Drain the SwampDrain the Swamp
Schedule a meeting to review the inventory– Evaluate the work– Expedite the easy wins– Identify what to stop doing

2004 © David Kirjassoff
Evaluation MatrixEvaluation MatrixH
igh
Low Hanging Fruit Prioritize for Completion
Impa
ct
EffortLow High
Low Finish Quickly or Stop Candidates to Stop

2004 © David Kirjassoff
Prioritize what’s leftPrioritize what’s left
Rank order remaining significant projectsAssign resources in priority orderCommunicate priority across the teamEstablish ground rules for priority:– Queues are handled in priority order– In case of resource constraints, assign to higher
priority projects first

2004 © David Kirjassoff
Get control of the pipeline inputsGet control of the pipeline inputs
Declare a temporary moratorium on initiating new work until inventory process is completedDedicate separate resources to sustaining tasks and projects
2004 © David Kirjassoff
Best PracticesBest Practices
Input controlPhase gate review processPipeline control room

2004 © David Kirjassoff
Input Control MethodologyInput Control MethodologyEstablish a sequence of two queues for potential new projects:
NewIdeas
ActiveProjects
Valve 1 – Is this a good idea?
Valve 2 – Do we have the
resources?
Prioritized list of good ideas awaiting resources
1.
2.
3.
List of ideas awaiting review
•
•
•
Prioritized list of active projects
1.
2.
3.

2004 © David Kirjassoff
Valve 1 Valve 1 –– Good Idea TestGood Idea Test
Establish a process for submitting and collecting ideas for projects– Minimize bureaucracy, keep it simple– Review ideas frequently, avoid spoilage
Rank ideas for fit with team strategy, business impactSelect ideas to pass through the valveEstimate resource requirements

2004 © David Kirjassoff
Idea Evaluation MatrixIdea Evaluation MatrixFi
ts o
ur C
harte
r Hig
h
Prioritize and passto second valveJust say no
Good ROILow High
Low Just say no Refer elsewhere

2004 © David Kirjassoff
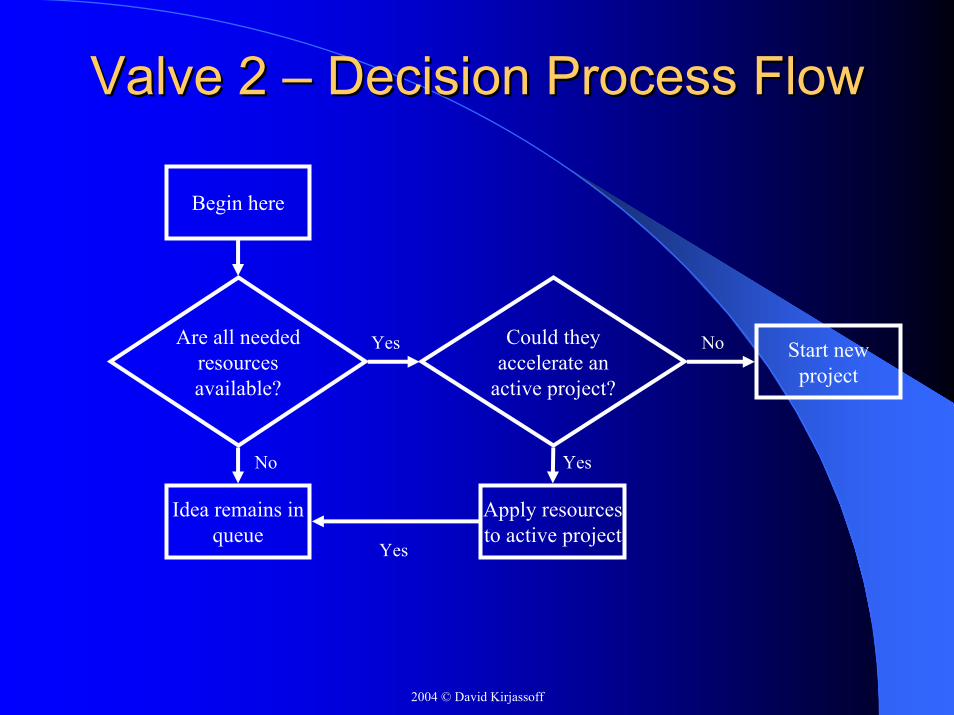
Valve 2 Valve 2 -- Resources TestResources Test
Note: Periodically review the “good ideas” queue, priorities often shiftStarting with the top idea, apply the following process
2004 © David Kirjassoff
Valve 2 Valve 2 –– Decision Process FlowDecision Process Flow
Begin here
Are all needed resources available?
Could they accelerate an
active project?
Yes No Start new project
No Yes
Idea remains in queue
Apply resources to active project
Yes

2004 © David Kirjassoff
Phase Gate Review ProcessPhase Gate Review Process
Establish a standard set of phases that fit your types of projectsMaintain a virtual status board showing where each project is in the pipelineConduct reviews of every project in the pipeline as it passes a phase milestone (next slide)Allow for “emergency” review any time a project in jeopardy

2004 © David Kirjassoff
Phase Review QuestionsPhase Review Questions
Is this project still worth doing?– Market/customer needs– Opportunity cost
Are the planned resource requirements on track?Are there any anticipated obstacles to completion?

2004 © David Kirjassoff
Pipeline Control RoomPipeline Control Room
Development Project Status
Pipeline Metrics Improvement Project Status

2004 © David Kirjassoff
Metrics WallMetrics Wall-- ExampleExample% Of Sales from New Products
0%10%20%30%40%50%60%70%80%90%
100%
1st Qtr 2nd Qtr 3rd Qtr 4th Qtr
>12 months6-12 months< 6 months
New Product Revenue Growth
0
20
40
60
80
100
120
140
P1 P2 P3 P4 P5 P6 P7 P8 P9 P10
P11
P12
Product DProduct CProduct BProduct A
Aggregate Schedule Performance
01020
30405060
708090
P1 P3 P5 P7 P9
P11
% of PlannedMilestones MetGoal
Normalized Development Cycle Time(Days/1000 gates)
0
10
20
30
40
50
60
70
80
Q1 Q2 Q3 Q4
ActualGoal

2004 © David Kirjassoff
Development Project Status WallDevelopment Project Status WallProject C
•Schedule Performance
•Resource Utilization
• By Name
• Hours/month, planned vs. actual
•Development Spending
•Forecast Revenue Plan
Project Priority
1. A
2. C
3. E
4. B
5. D
Project B
•Schedule Performance
•Resource Utilization
• By Name
• Hours/month, planned vs. actual
•Development Spending
•Forecast Revenue Plan
Project A
•Schedule Performance
•Resource Utilization
• By Name
• Hours/month, planned vs. actual
•Development Spending
•Forecast Revenue Plan
Idea Queue
•
•
•
•
Input Queue
1.
2.
3.
4.
5.

2004 © David Kirjassoff
Pipeline Improvement Pipeline Improvement ConsiderationsConsiderations
How do we identify potential improvements in our pipeline design?How do we plan and implement desired improvements?How do we allocate resources to improvement work?

2004 © David Kirjassoff
Pipeline Improvement WallPipeline Improvement WallImprovement Project C
•Schedule Performance
•Resource Utilization
• By Name
• Hours/month, planned vs. actual
•Development Spending
•Forecast Revenue Plan
Input Queue
1.
2.
3.
4.
5.
Active Improvement Project Priority
1. A
2. C
3. B
Improvement Project B
•Schedule Performance
•Resource Utilization
• By Name
• Hours/month, planned vs. actual
•Development Spending
•Forecast Revenue Plan
Improvement Project A
•Charter/Goals
•Schedule Performance
•Resource Utilization
• By Name
• Hours/month, planned vs. actual
Idea Queue
•
•
•
•

2004 © David Kirjassoff
In SummaryIn SummaryTeams that manage a portfolio of projects often don’t view themselves as managing a production pipelineWe have a natural tendency to “bite off more than we can chew” which has unintended consequences to productivityControlling the front end of the process generally results in a faster flow of completed work at the back endMaintaining a clear and common set of priorities for project queues and active projects can help ensure that at least the high priority work gets through