Embed Size (px)
Citation preview

Piping the Point Cloud Scott Diaz – kubit USA John Bunn – kubit USA Oliver Bringmann – kubit GmbH
PD3982 Plants and other industrial facilities have accepted laser scanning as a viable option for brownfield projects. How is scanning a more efficient method for documenting existing conditions? What are the major advantages and disadvantages of using scanning in the industrial facility setting? What are some of the latest methods for going from field to intelligent model, detecting pipes and fittings, finding clashes and ensuring accuracy? Most importantly, how can it all be integrated with AutoCAD®, AutoCAD Plant 3D®, or AutoCAD MEP®?
LearningObjectivesAt the end of this class, you will be able to:
Learn current trends, advantages and disadvantages with laser scanning in industrial facilities
Identify the requirements for achieving your desired deliverable from clouds
Learn potential workflows for reaching your deliverables with AutoCAD and the PCG engine
Recognize the difference between reality and the design world
Avoid potential barriers in your laser scanning projects
About the Speakers
Scott Diaz: Scott is managing director for kubit USA of Houston, Texas. Scott has worked and trained directly with kubit GmbH of Dresden, Germany, over the past four years and opened the first United States office—with a focus on establishing reseller networks throughout the United States to support kubit CAD-based products for documenting as-builts. He worked previously as marketing and technical sales manager for an Autodesk® software developer in the plant and process industry. Scott has a background in business management and marketing with an MBA from Lamar University.
Oliver Bringmann: Oliver is the co-founder and managing director of kubit GmbH in Dresden, Germany. For the past ten years, Oliver has led the kubit team in the development of AutoCAD®-based software for capturing existing conditions. He is an expert in modern surveying technologies, such as 3D laser scanning. His focus is on software technology and pattern recognition. Oliver is a professional computer scientist with a Ph.D. from Dresden University.
John Bunn: John works in technical sales and support for kubit USA, located in Houston, Texas. John has spent more than 12 years programming and utilizing AutoCAD and Autodesk products, primarily for use within the oil & gas industry. John now spends much of his time performing training sessions and demonstrations for creating deliverables from point clouds inside of AutoCAD. He is well-versed with the workings and manipulation of point cloud data within AutoCAD, including pattern-recognition, 2D and 3D digitizing, measurements/deviation analysis, etc. Moving forward John has a core focus on being in-tune with multiple industries in order to create more complete software solutions and workflows.
Piping the Point Cloud
2
LaserScanningReviewMost people attending this class already have some familiarity with laser scanning but we don’t want to assume that everyone is an expert; so as a review, what is a laser scanner? A laser scanner is a surveying device capable of producing a 3D representation of present conditions through the collection of individually measured points via pulse laser. The resulting set of all points collected and registered after the scanning process is a point cloud. LaserScanningMethods
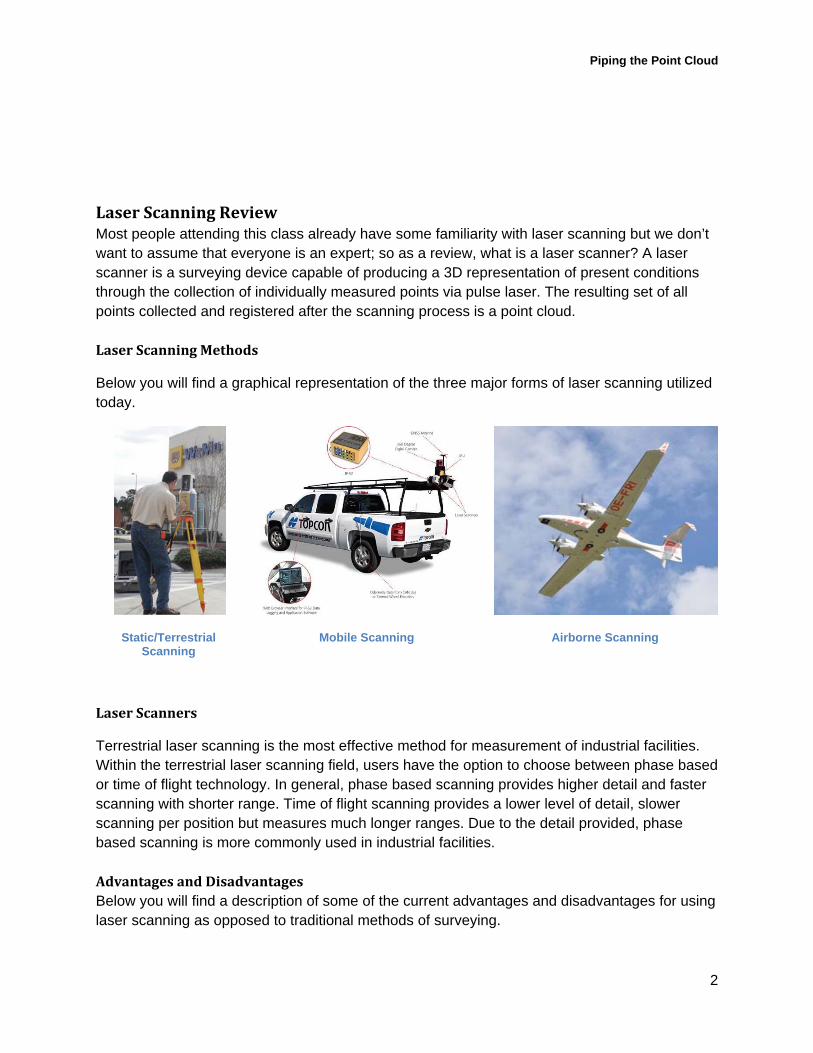
Below you will find a graphical representation of the three major forms of laser scanning utilized today.
Static/Terrestrial Scanning
Mobile Scanning Airborne Scanning
LaserScanners
Terrestrial laser scanning is the most effective method for measurement of industrial facilities. Within the terrestrial laser scanning field, users have the option to choose between phase based or time of flight technology. In general, phase based scanning provides higher detail and faster scanning with shorter range. Time of flight scanning provides a lower level of detail, slower scanning per position but measures much longer ranges. Due to the detail provided, phase based scanning is more commonly used in industrial facilities. AdvantagesandDisadvantagesBelow you will find a description of some of the current advantages and disadvantages for using laser scanning as opposed to traditional methods of surveying.
Piping the Point Cloud
3
Advantages:
Safety: A non contact measurement technology which helps avoid climbing on equipment and increasing risk of injury.
Long Run Cost Savings: Data acquired after a single trip to the field gathers more than multiple crews could collect in years
More Data: Millions of points collected per setup Faster Collection: Entire facility measurement in a few days.
Disadvantages:
Initial Investment: Hardware, software investment still relatively high Post-processing time: Time spent in the field is transferred to more time designing in the
office to achieve needed deliverables. Data overkill: Too much data can cause confusion and hardware issues.
CurrentTrends
LaserscanningIndustry
Scanning technology has finally moved from a novelty to a mainstream solution for surveying. This is especially true in the industrial facility realm where scanning is often preferred to traditional measurement methods. Below are some specific areas of change in recent years within the laser scanning industry.
Cost
The cost of laser scanning is beginning to decrease dramatically. Previously, the initial investment for entering the market was around 100k-120k. Today, companies can get started with laser scanning for as little as 40k. This trend started with Faro Technologies’ release of their Focus 3D scanner. This scanner was the first of its kind to step away from the 100K range for cost while offering a comparable piece of hardware to its competitors (for less than half of the price in some cases). The industry should continue in this direction as laser scanning becomes more commonplace in various industries.
ComputingPower
Hardware as well as software has increased in power significantly in a short period of time. Powerful processors, 64 bit operating systems and power video cards are now “off the shelf” common and within the price range of more users. This has allowed for management of much larger data sets. In addition to hardware, software is finally catching up to the hardware. More powerful point cloud engines, algorithms and industry specific workflows have made cloud data management much easier.
DataInteroperability
Piping the Point Cloud
4
One of the major hiccups with generating full workflows from the scanner to finished deliverable is getting the cloud data into the format needed for your program of choice. Many hardware manufacturers have made it difficult to bring data outside of their proprietary formats. This forces many users to remain in the manufacturer’s software rather than wait on export/conversion to a different format which can take hours of machine time. As laser scanning moves to mainstream, major CAD players provide native point cloud functionality (Autodesk, AVEVA, Bentley) and users demand more specific tools outside of scanner manufacturer software, we are seeing the emergence of industry standard file formats. These include the Autodesk PCG engine and the E57 format which launched with the intended effort of putting an end to interoperability issues. Many scanning manufacturers as well as 3rd party developers are beginning to support E57. Finally, Navisworks continues to be a deliverable platform which allows for import of most industry formats, including most major point cloud formats.
AutodeskTrends
Along with other major software companies, Autodesk has recognized the value of laser scanning technology. Now supporting two native point cloud engines (PCG, ISD), along with the recent acquisition of 3rd party reality capture companies (Alice Labs) and the support of many file formats from major laser scanner manufacturers, Autodesk is continuing to show its commitment to making laser scanning a native part of the design world.
You can now find native point cloud support in AutoCAD, Revit and Navisworks 2012 as well as an Autodesk Labs support for 3D Studio Max. The PCG engine is compatible across all of these platforms which means users can apply the same cloud file within an entire suite of Autodesk software. This native support also means that users can transfer files to clients for easy cloud viewing without the need for 3rd party software. The point cloud can serve as a standalone deliverable to clients.
The Autodesk Labs team is also working heavily on developing stronger tools for working with the cloud data. So far, we have seen releases of Shape Extraction tools for AutoCAD and Civil 3D. We expect to see these tools leave their testing phase and eventually make their way into the native product releases in the future.
WorkingwithJustaCloud
This section will review the possible workflows and usability of a point cloud data set without the need for additional, 3rd party cloud manipulation tools.
VisualizationandMeasurement
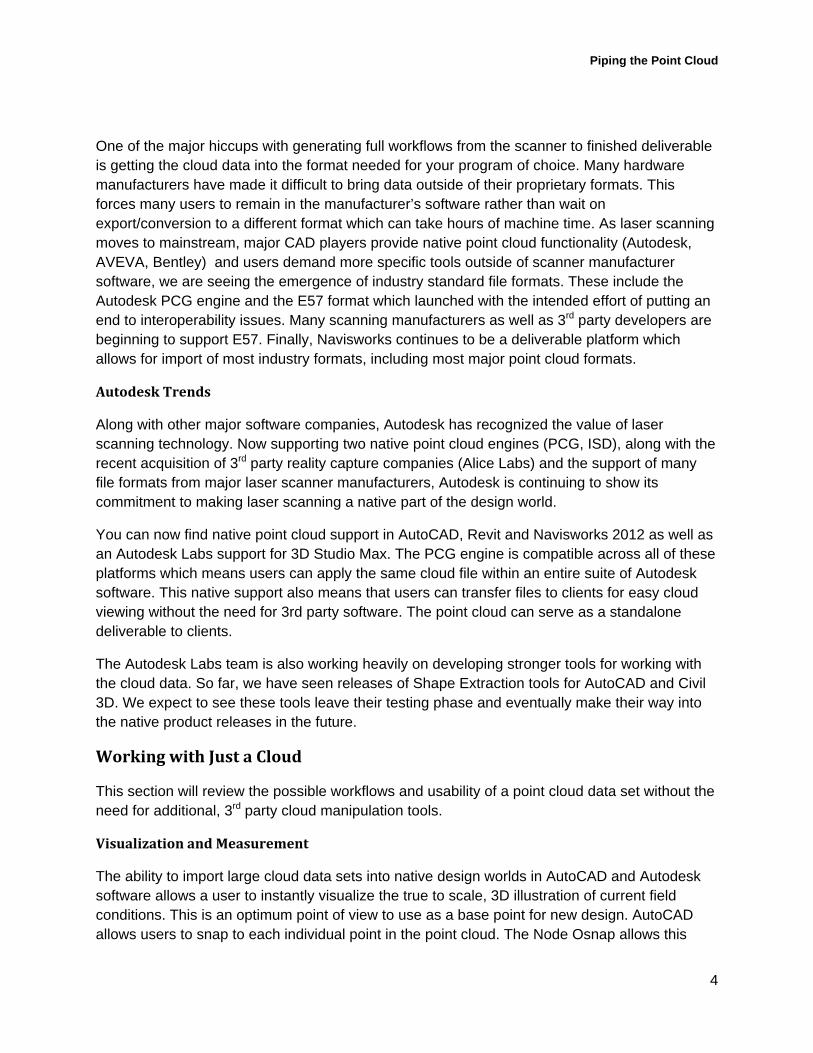
The ability to import large cloud data sets into native design worlds in AutoCAD and Autodesk software allows a user to instantly visualize the true to scale, 3D illustration of current field conditions. This is an optimum point of view to use as a base point for new design. AutoCAD allows users to snap to each individual point in the point cloud. The Node Osnap allows this
Piping the Point Cloud
5
action. Reference measurements/distances/annotations can be quickly marked on the drawing and used as a deliverable.
ClashDetection
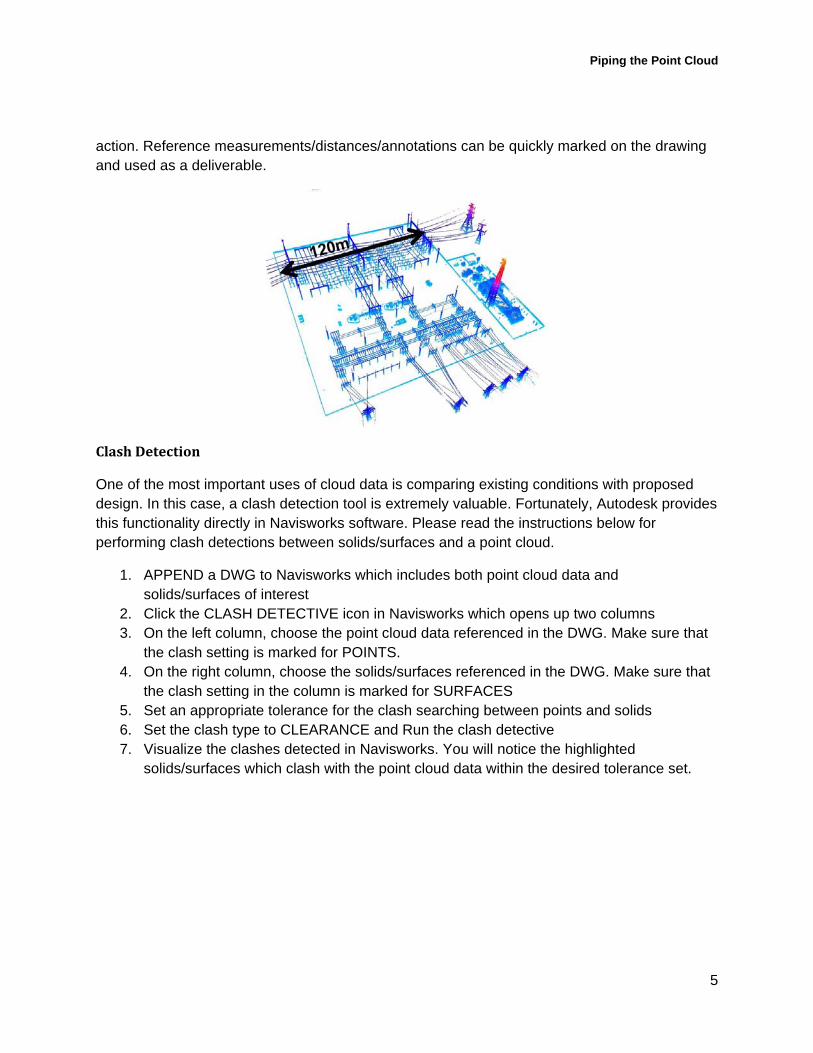
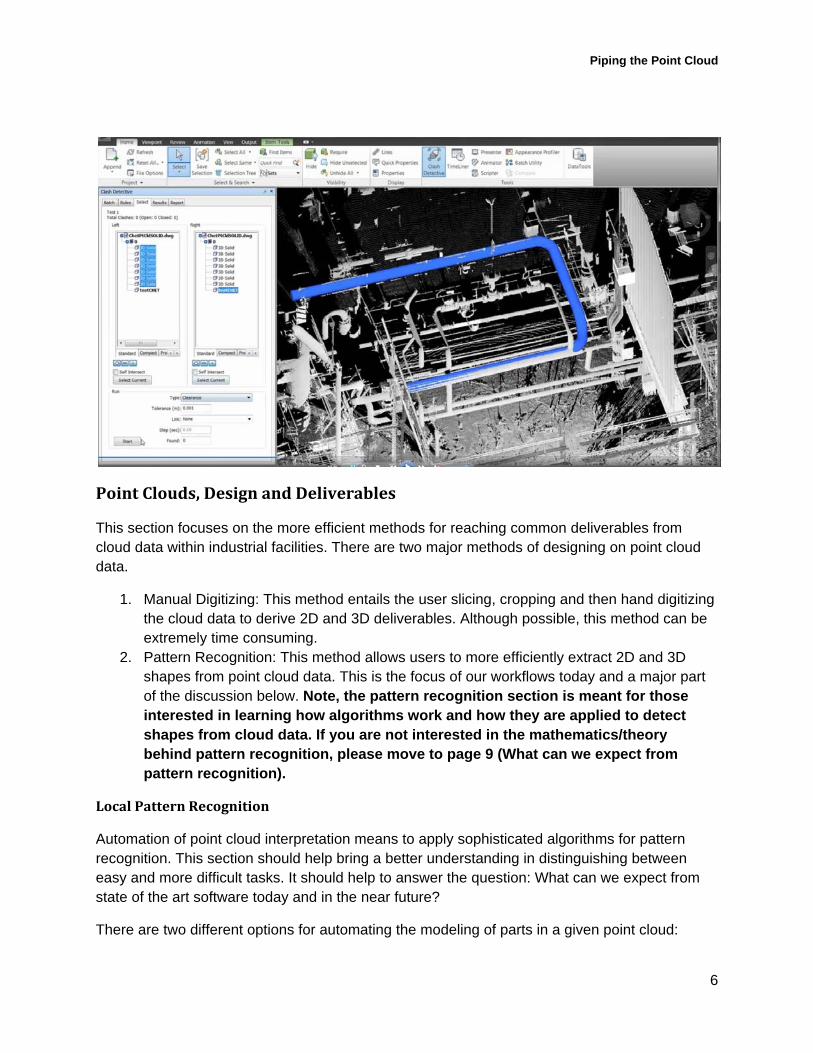
One of the most important uses of cloud data is comparing existing conditions with proposed design. In this case, a clash detection tool is extremely valuable. Fortunately, Autodesk provides this functionality directly in Navisworks software. Please read the instructions below for performing clash detections between solids/surfaces and a point cloud.
1. APPEND a DWG to Navisworks which includes both point cloud data and solids/surfaces of interest
2. Click the CLASH DETECTIVE icon in Navisworks which opens up two columns 3. On the left column, choose the point cloud data referenced in the DWG. Make sure that
the clash setting is marked for POINTS. 4. On the right column, choose the solids/surfaces referenced in the DWG. Make sure that
the clash setting in the column is marked for SURFACES 5. Set an appropriate tolerance for the clash searching between points and solids 6. Set the clash type to CLEARANCE and Run the clash detective 7. Visualize the clashes detected in Navisworks. You will notice the highlighted
solids/surfaces which clash with the point cloud data within the desired tolerance set.
Piping the Point Cloud
6
PointClouds,DesignandDeliverables
This section focuses on the more efficient methods for reaching common deliverables from cloud data within industrial facilities. There are two major methods of designing on point cloud data.
1. Manual Digitizing: This method entails the user slicing, cropping and then hand digitizing the cloud data to derive 2D and 3D deliverables. Although possible, this method can be extremely time consuming.
2. Pattern Recognition: This method allows users to more efficiently extract 2D and 3D shapes from point cloud data. This is the focus of our workflows today and a major part of the discussion below. Note, the pattern recognition section is meant for those interested in learning how algorithms work and how they are applied to detect shapes from cloud data. If you are not interested in the mathematics/theory behind pattern recognition, please move to page 9 (What can we expect from pattern recognition).
LocalPatternRecognition
Automation of point cloud interpretation means to apply sophisticated algorithms for pattern recognition. This section should help bring a better understanding in distinguishing between easy and more difficult tasks. It should help to answer the question: What can we expect from state of the art software today and in the near future?
There are two different options for automating the modeling of parts in a given point cloud:
Piping the Point Cloud
7
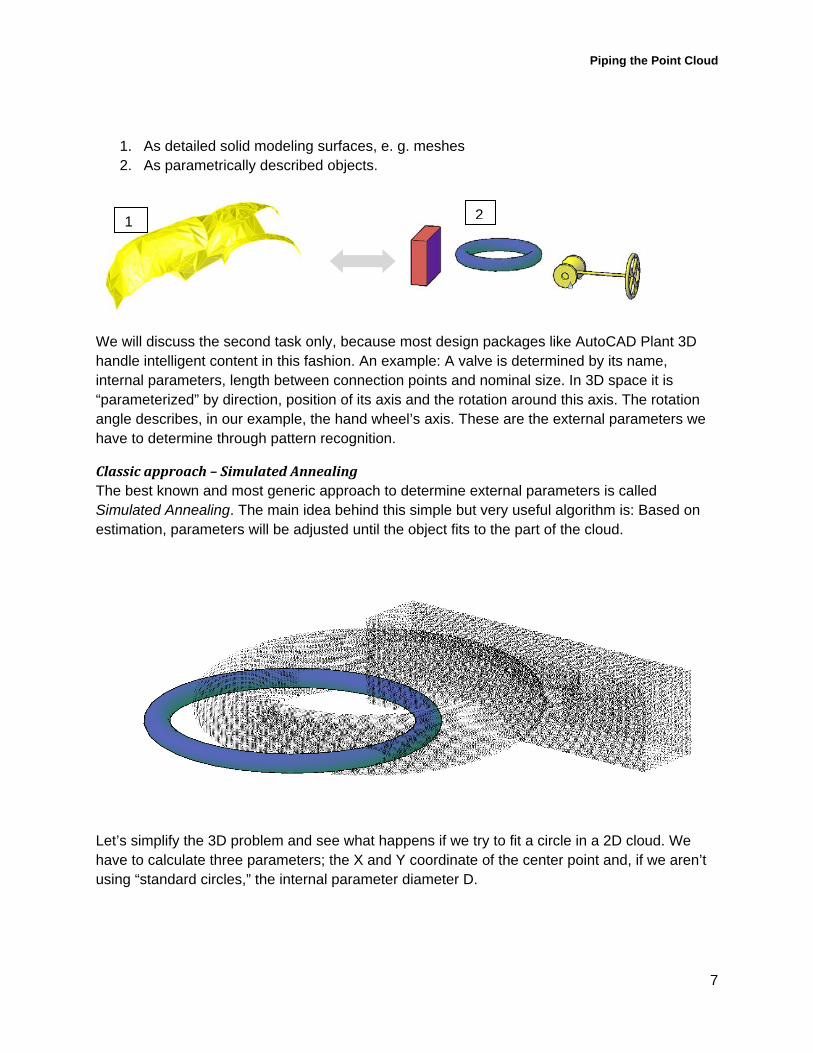
1. As detailed solid modeling surfaces, e. g. meshes 2. As parametrically described objects.
We will discuss the second task only, because most design packages like AutoCAD Plant 3D handle intelligent content in this fashion. An example: A valve is determined by its name, internal parameters, length between connection points and nominal size. In 3D space it is “parameterized” by direction, position of its axis and the rotation around this axis. The rotation angle describes, in our example, the hand wheel’s axis. These are the external parameters we have to determine through pattern recognition.
Classicapproach–SimulatedAnnealingThe best known and most generic approach to determine external parameters is called Simulated Annealing. The main idea behind this simple but very useful algorithm is: Based on estimation, parameters will be adjusted until the object fits to the part of the cloud.
Let’s simplify the 3D problem and see what happens if we try to fit a circle in a 2D cloud. We have to calculate three parameters; the X and Y coordinate of the center point and, if we aren’t using “standard circles,” the internal parameter diameter D.
1 2
Piping the Point Cloud
8
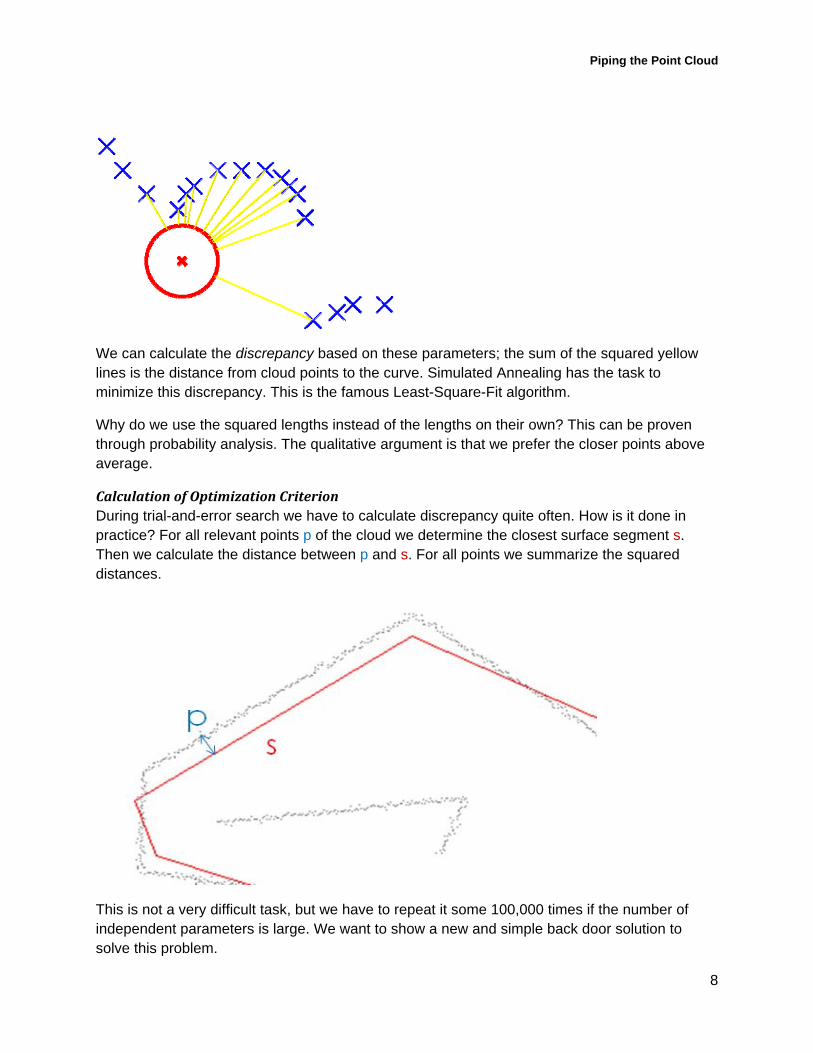
We can calculate the discrepancy based on these parameters; the sum of the squared yellow lines is the distance from cloud points to the curve. Simulated Annealing has the task to minimize this discrepancy. This is the famous Least-Square-Fit algorithm.
Why do we use the squared lengths instead of the lengths on their own? This can be proven through probability analysis. The qualitative argument is that we prefer the closer points above average.
CalculationofOptimizationCriterionDuring trial-and-error search we have to calculate discrepancy quite often. How is it done in practice? For all relevant points p of the cloud we determine the closest surface segment s. Then we calculate the distance between p and s. For all points we summarize the squared distances.
This is not a very difficult task, but we have to repeat it some 100,000 times if the number of independent parameters is large. We want to show a new and simple back door solution to solve this problem.
Piping the Point Cloud
9
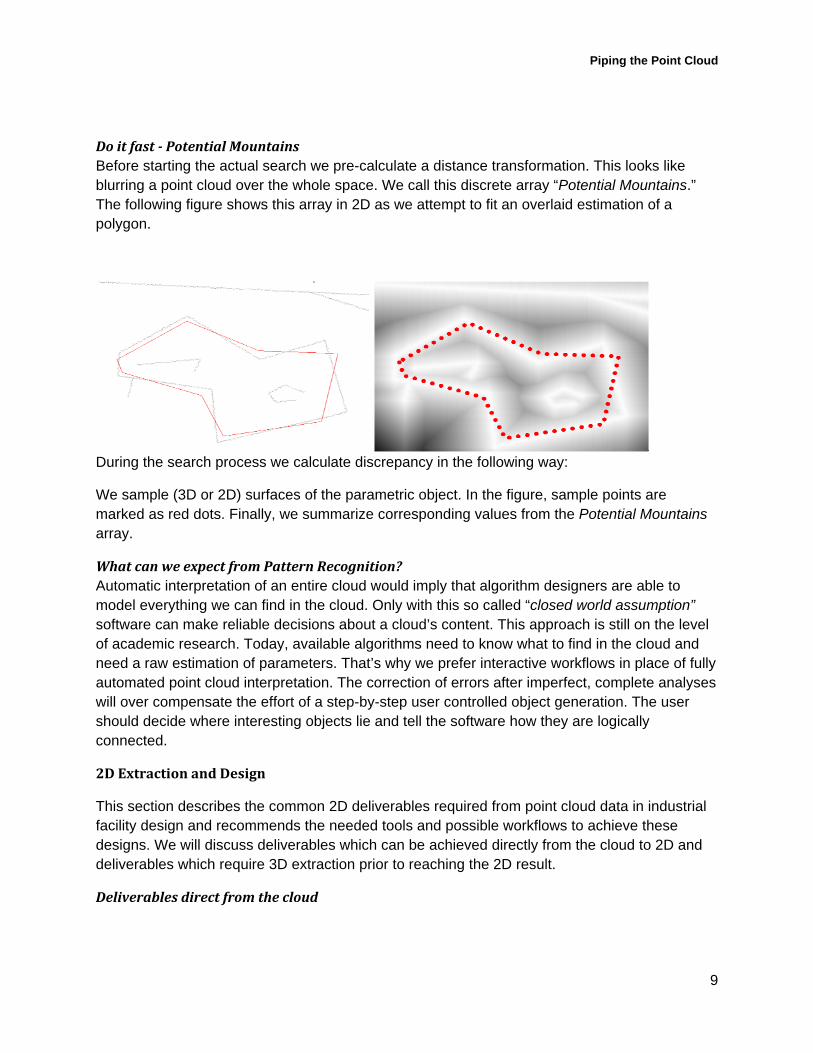
Doitfast‐PotentialMountainsBefore starting the actual search we pre-calculate a distance transformation. This looks like blurring a point cloud over the whole space. We call this discrete array “Potential Mountains.” The following figure shows this array in 2D as we attempt to fit an overlaid estimation of a polygon.
During the search process we calculate discrepancy in the following way:
We sample (3D or 2D) surfaces of the parametric object. In the figure, sample points are marked as red dots. Finally, we summarize corresponding values from the Potential Mountains array.
WhatcanweexpectfromPatternRecognition?Automatic interpretation of an entire cloud would imply that algorithm designers are able to model everything we can find in the cloud. Only with this so called “closed world assumption” software can make reliable decisions about a cloud’s content. This approach is still on the level of academic research. Today, available algorithms need to know what to find in the cloud and need a raw estimation of parameters. That’s why we prefer interactive workflows in place of fully automated point cloud interpretation. The correction of errors after imperfect, complete analyses will over compensate the effort of a step-by-step user controlled object generation. The user should decide where interesting objects lie and tell the software how they are logically connected.
2DExtractionandDesign
This section describes the common 2D deliverables required from point cloud data in industrial facility design and recommends the needed tools and possible workflows to achieve these designs. We will discuss deliverables which can be achieved directly from the cloud to 2D and deliverables which require 3D extraction prior to reaching the 2D result.
Deliverablesdirectfromthecloud
Piping the Point Cloud
10
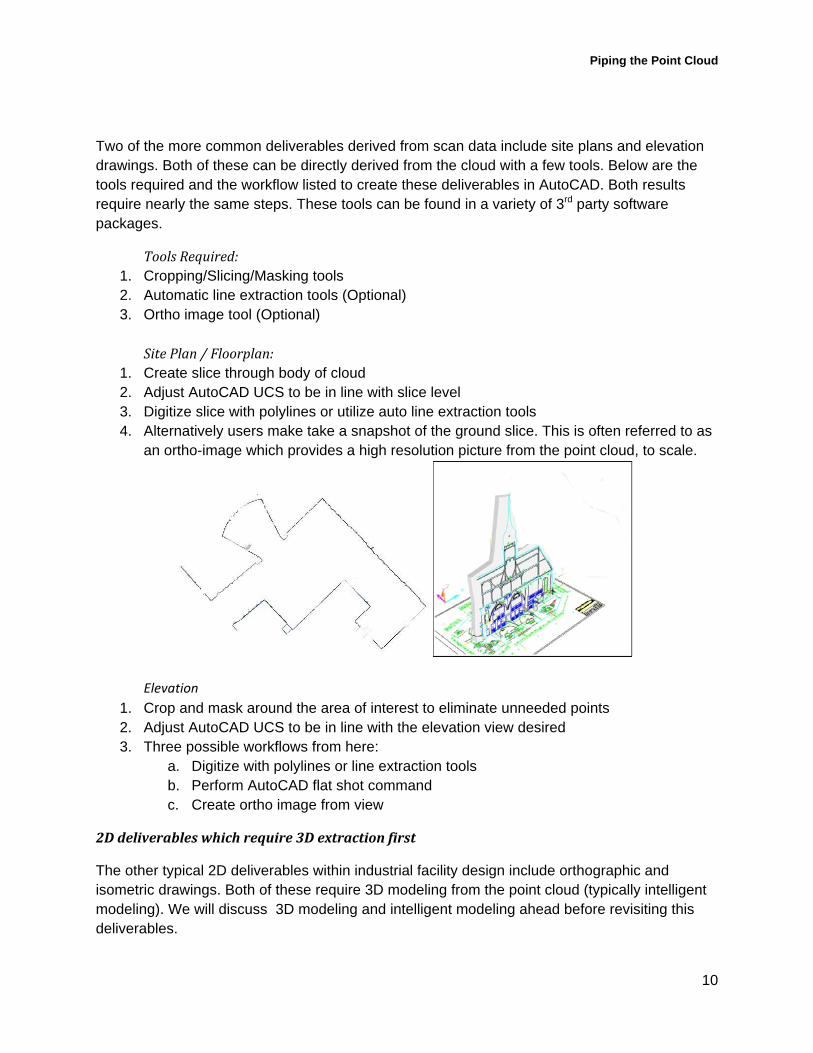
Two of the more common deliverables derived from scan data include site plans and elevation drawings. Both of these can be directly derived from the cloud with a few tools. Below are the tools required and the workflow listed to create these deliverables in AutoCAD. Both results require nearly the same steps. These tools can be found in a variety of 3rd party software packages.
ToolsRequired:1. Cropping/Slicing/Masking tools 2. Automatic line extraction tools (Optional) 3. Ortho image tool (Optional)
SitePlan/Floorplan:
1. Create slice through body of cloud 2. Adjust AutoCAD UCS to be in line with slice level 3. Digitize slice with polylines or utilize auto line extraction tools 4. Alternatively users make take a snapshot of the ground slice. This is often referred to as
an ortho-image which provides a high resolution picture from the point cloud, to scale.
Elevation
1. Crop and mask around the area of interest to eliminate unneeded points 2. Adjust AutoCAD UCS to be in line with the elevation view desired 3. Three possible workflows from here:
a. Digitize with polylines or line extraction tools b. Perform AutoCAD flat shot command c. Create ortho image from view
2Ddeliverableswhichrequire3Dextractionfirst
The other typical 2D deliverables within industrial facility design include orthographic and isometric drawings. Both of these require 3D modeling from the point cloud (typically intelligent modeling). We will discuss 3D modeling and intelligent modeling ahead before revisiting this deliverables.
Piping the Point Cloud
11
3DExtraction,ModelingandDesign
3Dmodelinganditsuse
Before discussing how to achieve 3D modeling from cloud data, it is important to know the true value and need for 3D modeling. Otherwise, we are simply wasting valuable time in post-processing.
Visualization: The 3D model is a very clear picture of field data. Visualization is the major benefit from a 3D model. The client as well as the client’s client can benefit from visualizing the layout of assets in a 3D space. We also use the model as reference for new design as well as clash detection against additional proposed designs.
Volume Calculation: A model provides a very easy means of deriving the volume and surface area of a real world object. Stock piles, holding tanks and vessels may require volume calculation.
3D Printing: This market is also growing rapidly and can allow for users to print a scaled down version of field data in true 3D. A printed model can serve as a strong deliverable to clients.
Toolsneededfor3Dmodelingofclouddata
The tools needed to achieve a 3D model from cloud data in AutoCAD include:
1. Cropping/masking/slicing 2. 3D AutoCAD knowledge
Toolsrecommendedformodelingofclouddata
Although the tools listed above make modeling from a cloud possible, the tools recommended for a more efficient modeling process include:
1. Primitive/Shape Extraction 2. Line/Plane Extraction 3. Mesh capabilities (Not optimal in AutoCAD)
3Dmodelingtechniques
There are two major modeling techniques discussed in this session. Since our aim is to create solids and surfaces in AutoCAD, we will not focus on 3D meshing.
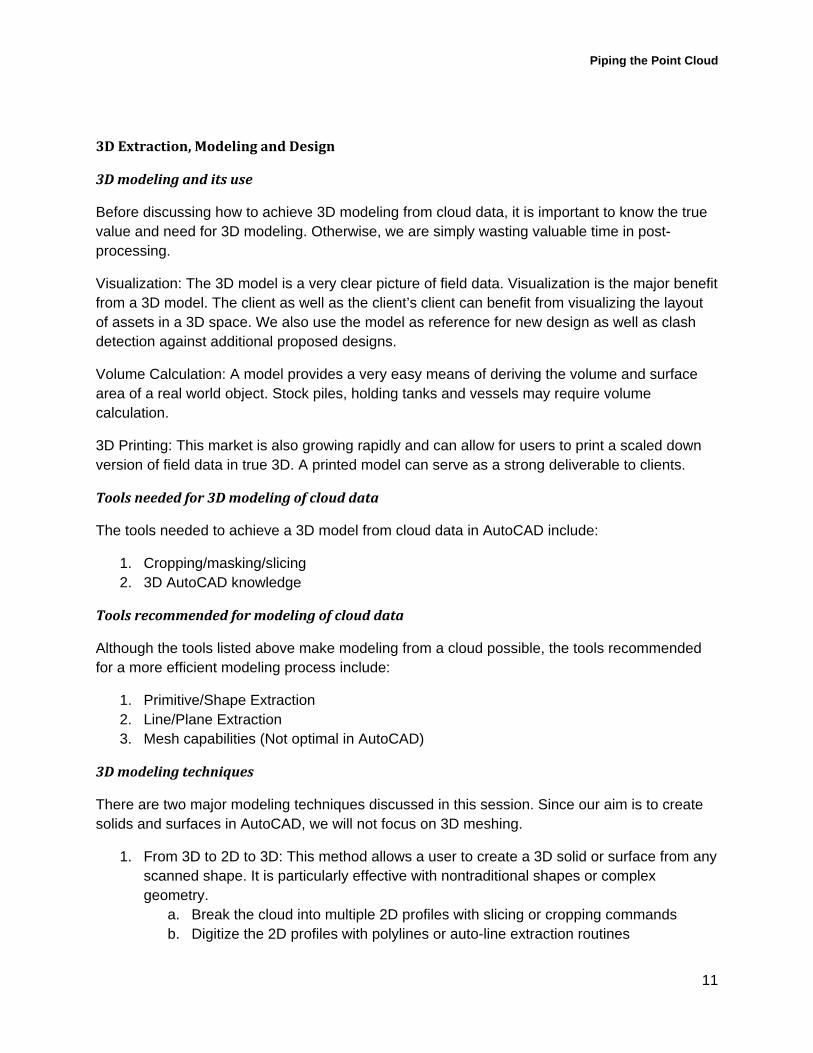
1. From 3D to 2D to 3D: This method allows a user to create a 3D solid or surface from any scanned shape. It is particularly effective with nontraditional shapes or complex geometry.
a. Break the cloud into multiple 2D profiles with slicing or cropping commands b. Digitize the 2D profiles with polylines or auto-line extraction routines
Piping the Point Cloud
12
c. Utilize AutoCAD modeling commands to create 3D solids and surfaces from the 2D profiles (Extrude, Loft, Sweep, Revolve)
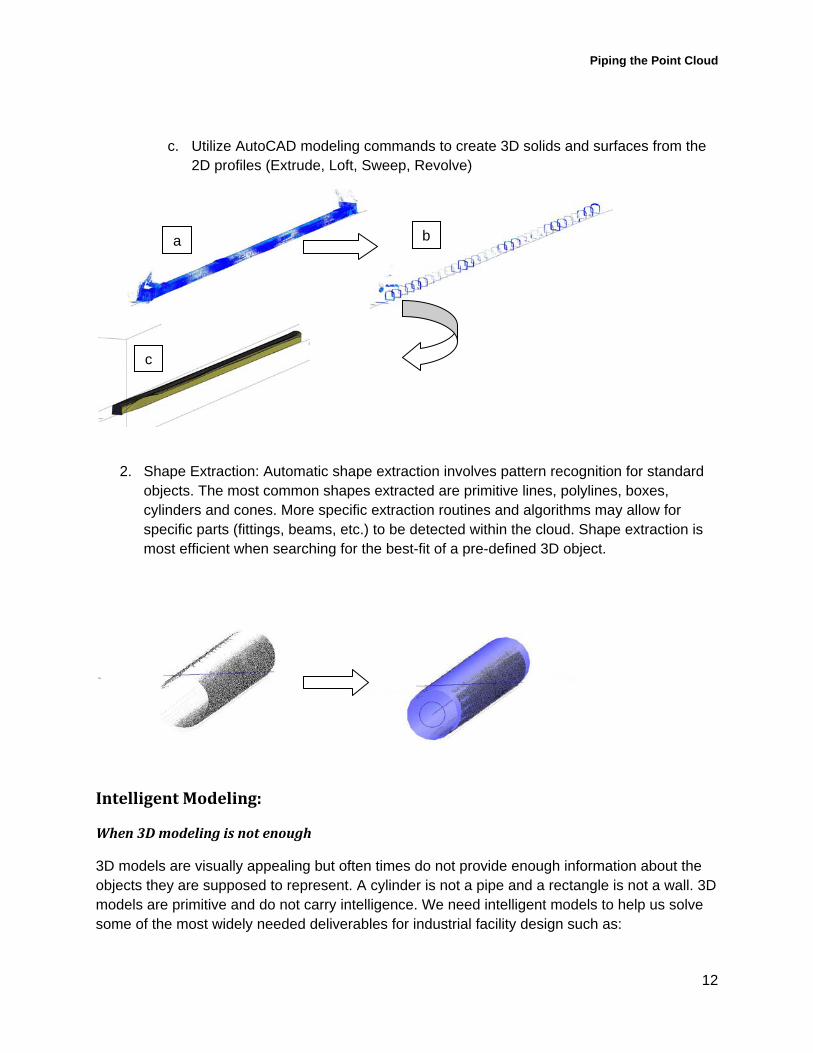
2. Shape Extraction: Automatic shape extraction involves pattern recognition for standard objects. The most common shapes extracted are primitive lines, polylines, boxes, cylinders and cones. More specific extraction routines and algorithms may allow for specific parts (fittings, beams, etc.) to be detected within the cloud. Shape extraction is most efficient when searching for the best-fit of a pre-defined 3D object.
IntelligentModeling:
When3Dmodelingisnotenough
3D models are visually appealing but often times do not provide enough information about the objects they are supposed to represent. A cylinder is not a pipe and a rectangle is not a wall. 3D models are primitive and do not carry intelligence. We need intelligent models to help us solve some of the most widely needed deliverables for industrial facility design such as:
a b
c
Piping the Point Cloud
13
Orthographics/Isometrics Accounting for insulated piping Variations in pipe diameter (detected diameter vs. nominal size) Asset management / database management / parts lists
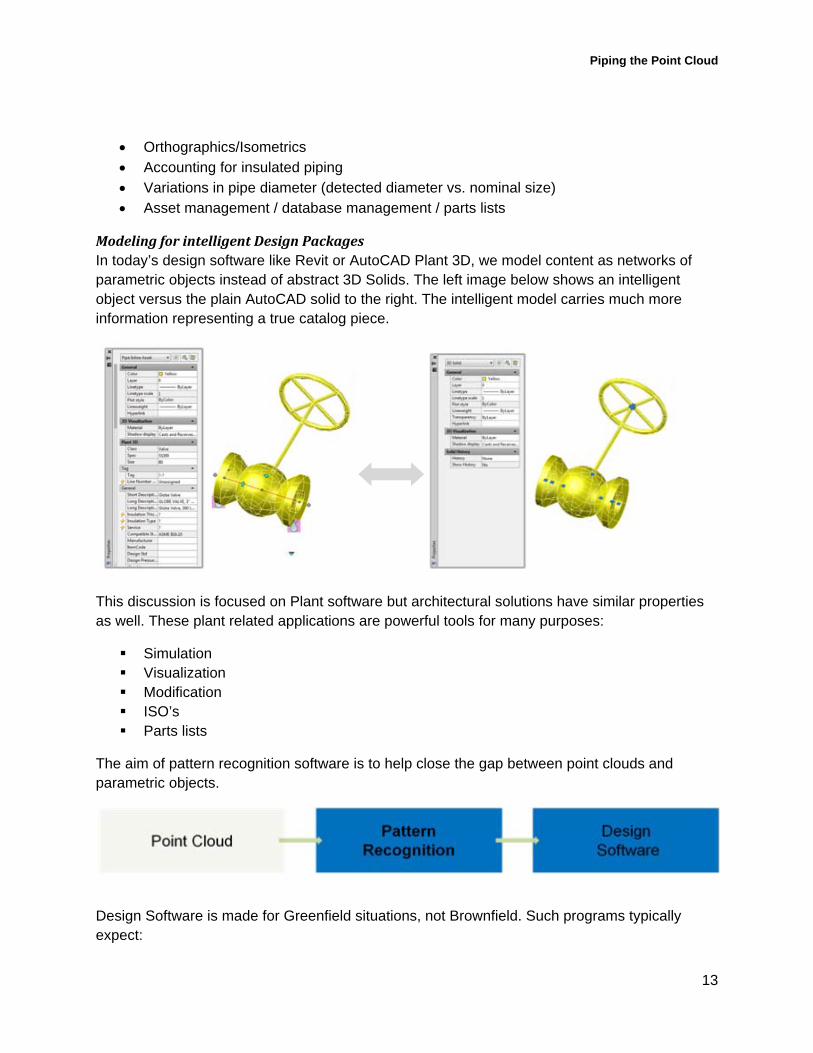
ModelingforintelligentDesignPackagesIn today’s design software like Revit or AutoCAD Plant 3D, we model content as networks of parametric objects instead of abstract 3D Solids. The left image below shows an intelligent object versus the plain AutoCAD solid to the right. The intelligent model carries much more information representing a true catalog piece.
This discussion is focused on Plant software but architectural solutions have similar properties as well. These plant related applications are powerful tools for many purposes:
Simulation Visualization Modification ISO’s Parts lists
The aim of pattern recognition software is to help close the gap between point clouds and parametric objects.
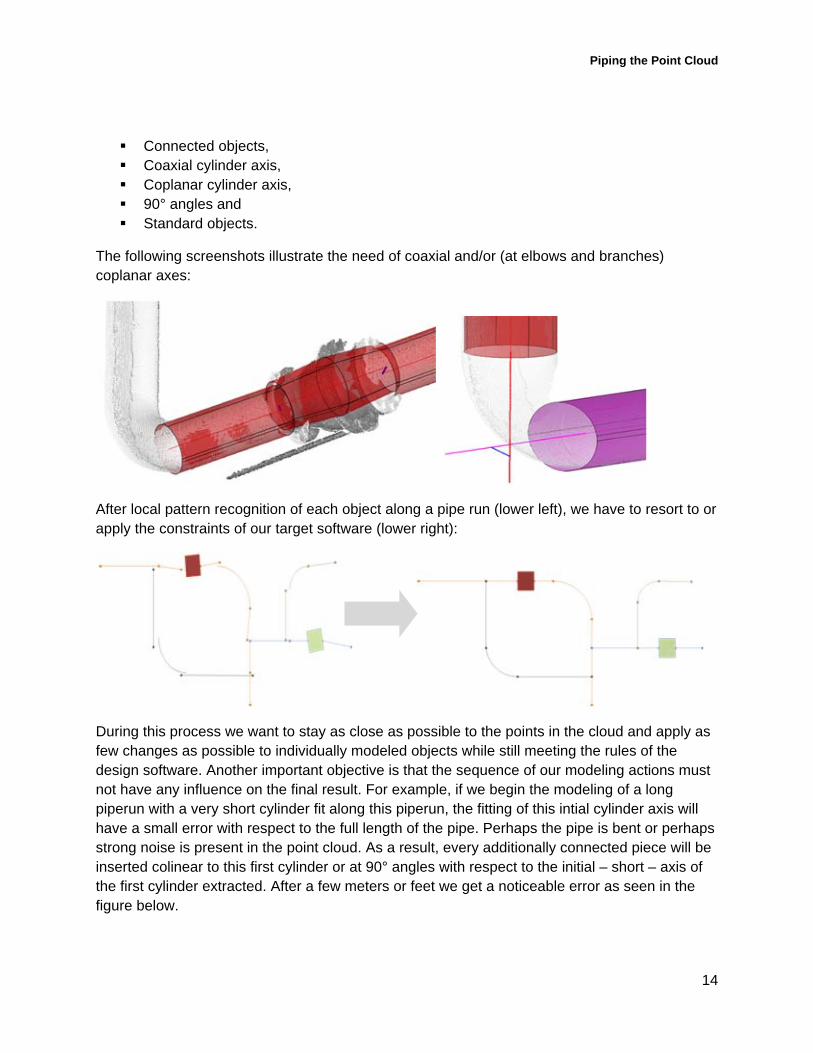
Design Software is made for Greenfield situations, not Brownfield. Such programs typically expect:
Piping the Point Cloud
14
Connected objects, Coaxial cylinder axis, Coplanar cylinder axis, 90° angles and Standard objects.
The following screenshots illustrate the need of coaxial and/or (at elbows and branches) coplanar axes:
After local pattern recognition of each object along a pipe run (lower left), we have to resort to or apply the constraints of our target software (lower right):
During this process we want to stay as close as possible to the points in the cloud and apply as few changes as possible to individually modeled objects while still meeting the rules of the design software. Another important objective is that the sequence of our modeling actions must not have any influence on the final result. For example, if we begin the modeling of a long piperun with a very short cylinder fit along this piperun, the fitting of this intial cylinder axis will have a small error with respect to the full length of the pipe. Perhaps the pipe is bent or perhaps strong noise is present in the point cloud. As a result, every additionally connected piece will be inserted colinear to this first cylinder or at 90° angles with respect to the initial – short – axis of the first cylinder extracted. After a few meters or feet we get a noticeable error as seen in the figure below.
Piping the Point Cloud
15
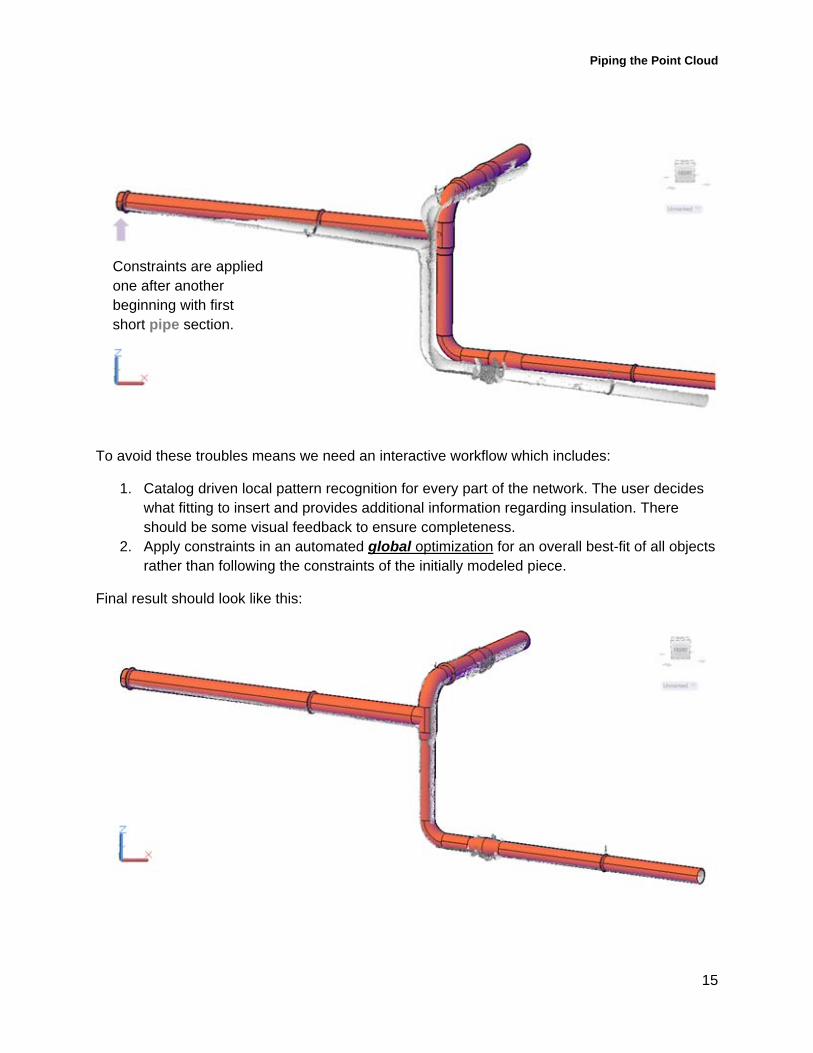
To avoid these troubles means we need an interactive workflow which includes:
1. Catalog driven local pattern recognition for every part of the network. The user decides what fitting to insert and provides additional information regarding insulation. There should be some visual feedback to ensure completeness.
2. Apply constraints in an automated global optimization for an overall best-fit of all objects rather than following the constraints of the initially modeled piece.
Final result should look like this:
Constraints are applied one after another beginning with first short pipe section.
Piping the Point Cloud
16
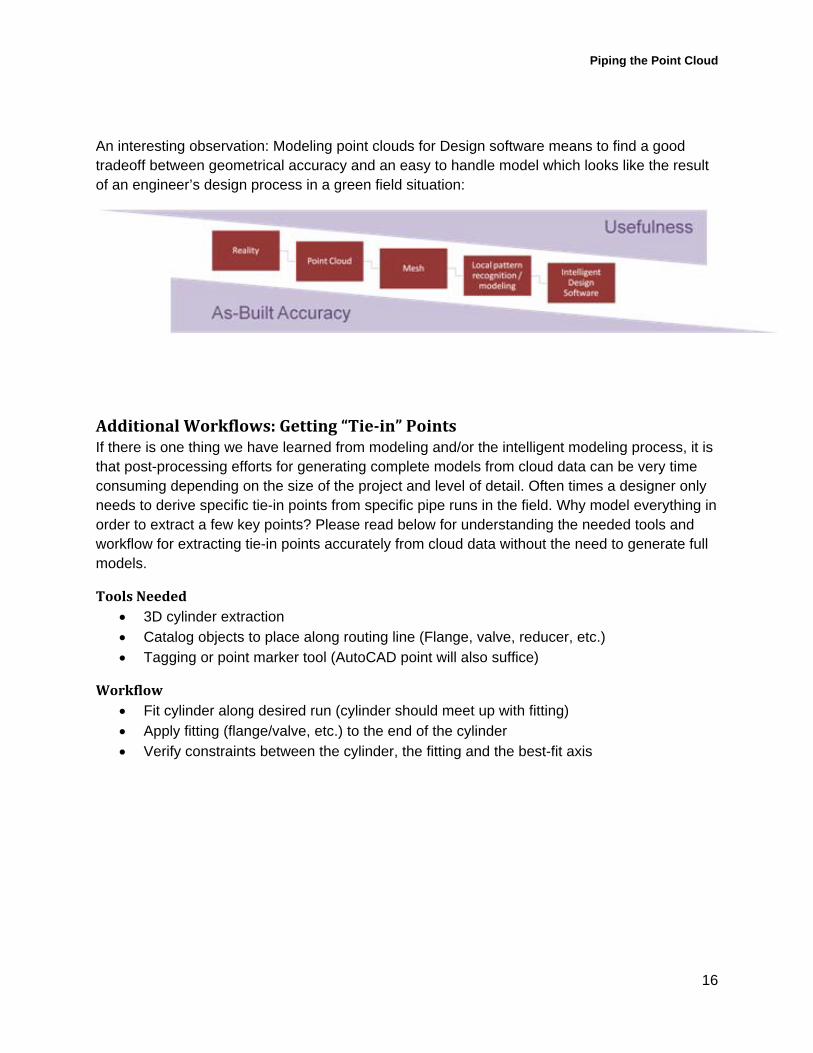
An interesting observation: Modeling point clouds for Design software means to find a good tradeoff between geometrical accuracy and an easy to handle model which looks like the result of an engineer’s design process in a green field situation:
AdditionalWorkflows:Getting“Tie‐in”PointsIf there is one thing we have learned from modeling and/or the intelligent modeling process, it is that post-processing efforts for generating complete models from cloud data can be very time consuming depending on the size of the project and level of detail. Often times a designer only needs to derive specific tie-in points from specific pipe runs in the field. Why model everything in order to extract a few key points? Please read below for understanding the needed tools and workflow for extracting tie-in points accurately from cloud data without the need to generate full models.
ToolsNeeded 3D cylinder extraction Catalog objects to place along routing line (Flange, valve, reducer, etc.) Tagging or point marker tool (AutoCAD point will also suffice)
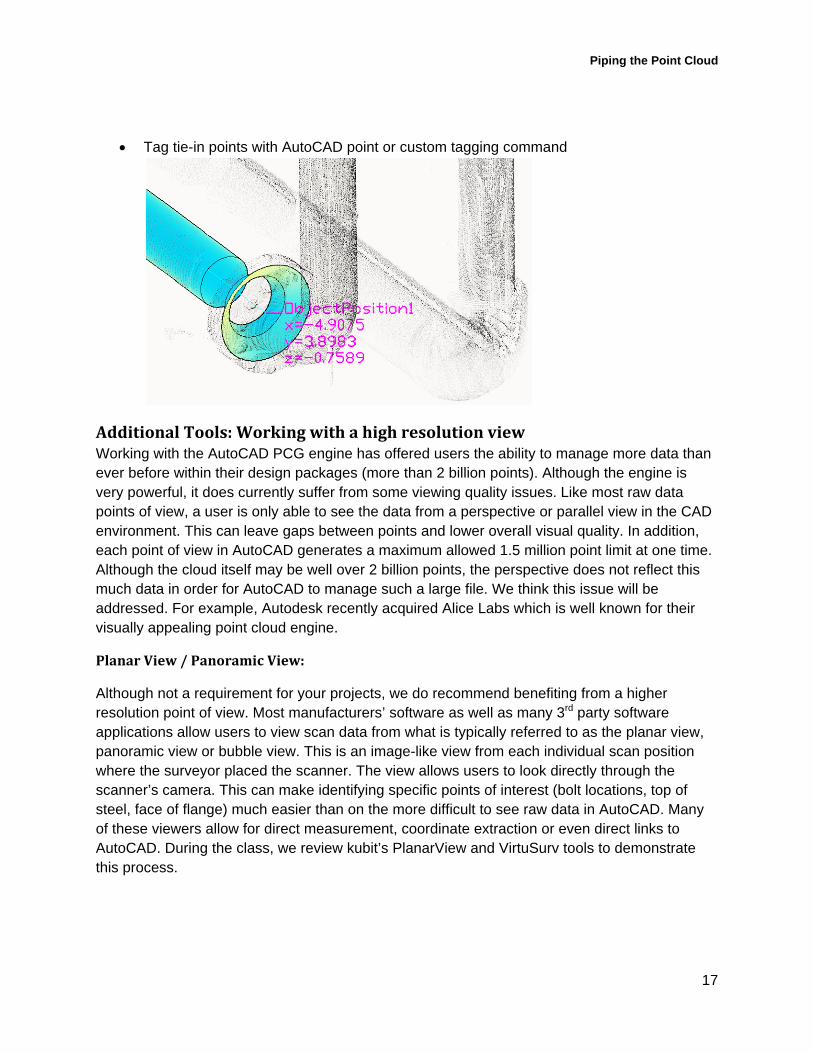
Workflow Fit cylinder along desired run (cylinder should meet up with fitting) Apply fitting (flange/valve, etc.) to the end of the cylinder Verify constraints between the cylinder, the fitting and the best-fit axis
Piping the Point Cloud
17
Tag tie-in points with AutoCAD point or custom tagging command
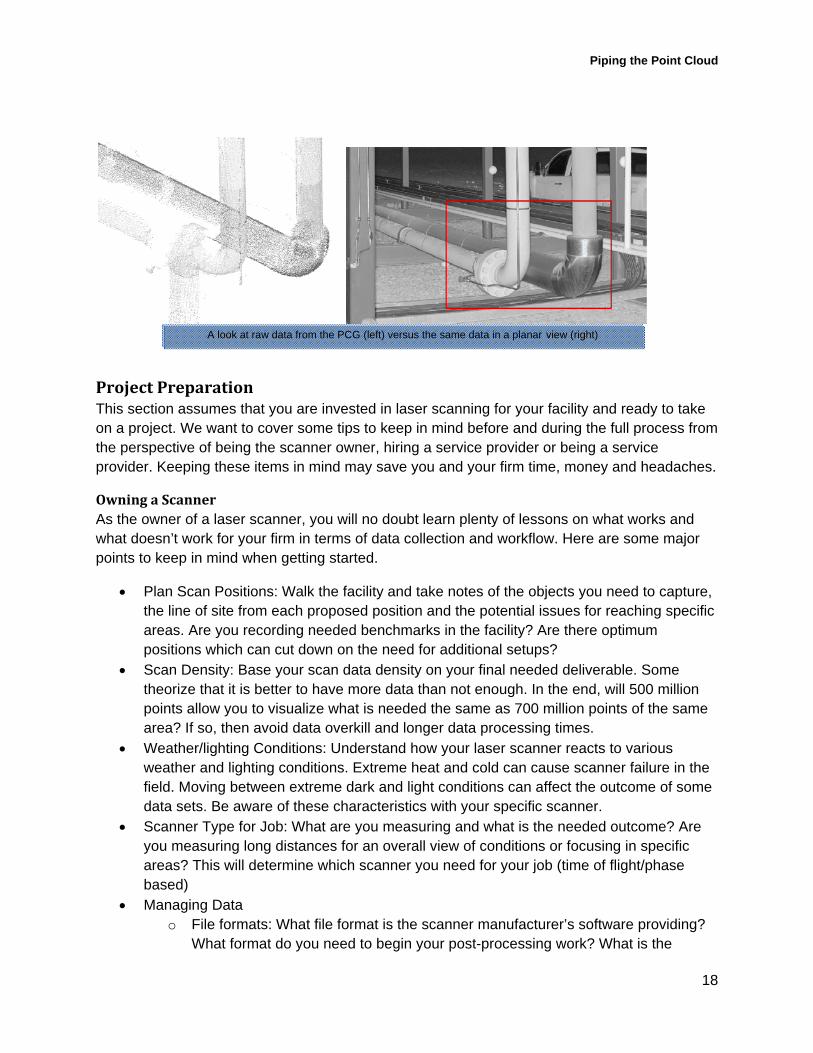
AdditionalTools:WorkingwithahighresolutionviewWorking with the AutoCAD PCG engine has offered users the ability to manage more data than ever before within their design packages (more than 2 billion points). Although the engine is very powerful, it does currently suffer from some viewing quality issues. Like most raw data points of view, a user is only able to see the data from a perspective or parallel view in the CAD environment. This can leave gaps between points and lower overall visual quality. In addition, each point of view in AutoCAD generates a maximum allowed 1.5 million point limit at one time. Although the cloud itself may be well over 2 billion points, the perspective does not reflect this much data in order for AutoCAD to manage such a large file. We think this issue will be addressed. For example, Autodesk recently acquired Alice Labs which is well known for their visually appealing point cloud engine.
PlanarView/PanoramicView:
Although not a requirement for your projects, we do recommend benefiting from a higher resolution point of view. Most manufacturers’ software as well as many 3rd party software applications allow users to view scan data from what is typically referred to as the planar view, panoramic view or bubble view. This is an image-like view from each individual scan position where the surveyor placed the scanner. The view allows users to look directly through the scanner’s camera. This can make identifying specific points of interest (bolt locations, top of steel, face of flange) much easier than on the more difficult to see raw data in AutoCAD. Many of these viewers allow for direct measurement, coordinate extraction or even direct links to AutoCAD. During the class, we review kubit’s PlanarView and VirtuSurv tools to demonstrate this process.
Piping the Point Cloud
18
ProjectPreparationThis section assumes that you are invested in laser scanning for your facility and ready to take on a project. We want to cover some tips to keep in mind before and during the full process from the perspective of being the scanner owner, hiring a service provider or being a service provider. Keeping these items in mind may save you and your firm time, money and headaches.
OwningaScannerAs the owner of a laser scanner, you will no doubt learn plenty of lessons on what works and what doesn’t work for your firm in terms of data collection and workflow. Here are some major points to keep in mind when getting started.
Plan Scan Positions: Walk the facility and take notes of the objects you need to capture, the line of site from each proposed position and the potential issues for reaching specific areas. Are you recording needed benchmarks in the facility? Are there optimum positions which can cut down on the need for additional setups?
Scan Density: Base your scan data density on your final needed deliverable. Some theorize that it is better to have more data than not enough. In the end, will 500 million points allow you to visualize what is needed the same as 700 million points of the same area? If so, then avoid data overkill and longer data processing times.
Weather/lighting Conditions: Understand how your laser scanner reacts to various weather and lighting conditions. Extreme heat and cold can cause scanner failure in the field. Moving between extreme dark and light conditions can affect the outcome of some data sets. Be aware of these characteristics with your specific scanner.
Scanner Type for Job: What are you measuring and what is the needed outcome? Are you measuring long distances for an overall view of conditions or focusing in specific areas? This will determine which scanner you need for your job (time of flight/phase based)
Managing Data o File formats: What file format is the scanner manufacturer’s software providing?
What format do you need to begin your post-processing work? What is the
A look at raw data from the PCG (left) versus the same data in a planar view (right)
Piping the Point Cloud
19
process for getting to this format and the amount of time to perform the conversion?
o Volume of data: How many points are in the entire project? Are you better off separating the data into organized sections rather than working with one massive scan file?
o Site plans: Do you have site plan showing an overview of your scanned facility along with locations of each scan position? Have you taken notes on what can be seen at each scan position? Do you feel that photographs can also aid you in organizing the scan project?
Communication between surveyors and designers: Do the surveyors know what the designers need from the field?
HiringaServiceProvider Create a set of specific guidelines for the vendor
o File format: What format/program is the vendor planning to use for pre-processing? Are they able to deliver the needed format for you? Have you defined your end purpose with the scan data?
o Organization: Obtain a scan map from the service provider. Do not assume that the provider understands your needs from the scan data. Open communication through every possible question prior to and during scanning will help avoid costly errors or site revisits which can cost you more money.
o Density/accuracy level: How much data can you handle in your design software? How much do you need to complete the end deliverable? Are there specific benchmarks they are required to mark within the facility? Have you seen examples of low, medium and high density scan data from the provider?
o Deliverable required: Whether you or the vendor are providing the post-processing, there should be a clear definition of the final deliverable prior to scanning. Where does their job end and your job begin?
o Timeframe: How much time will be needed for the scanning or scanning to deliverable process?
Data ownership: Some scan providers hold on to your scan data until you require a deliverable from this data. Do you want to have this data in-house or are you ok with the vendor controlling the data? Will they repeatedly charge you to access the same data set from your facility? Work these details out in contract prior to agreeing to their scanning terms.
Background check for experience: It goes without saying that you should be using a scan provider with proper experience in your field. Have you seen results from their previous work or received references from their clients? Would you rather give them a test run before committing to a larger project?
BeingaServiceProvider Communicate entire process to client
Piping the Point Cloud
20
o Expected deliverable: What is the client trying to accomplish with the scan data. Do not assume that the client understands the scanning process or what is needed in order to reach their deliverable. Part of being a good service provider is helping put your clients on a path to success through clear communication.
o File format: What program will the client be using to view the scan data and what file format is needed?
o Timeframe: Is the client aware of the necessary time required to complete your services? Are they being reasonable with regard to what is possible and what is risking a bad job?
o Level of detail/accuracy/volume of data: Have you clearly defined the difference in scan densities offered, the number of points this entails and the number/size of files this will create? Have you defined a clear plan for delivering this data to the client in an organized fashion based on their software used? Dumping 6 billion points on a hard drive and wishing them luck is no way to treat client that you wish to have again in the future.
Understanding of where your job ends and their job begins: Have you clearly defined your role as the service provider? Has the client defined the actions they will take with the scan data? Does the client understand that anything outside of these parameters may be additional cost?
CommonProjectIssuesRegardless of the amount of preparation, these most common issues below will no doubt come bout at some point in your laser scanning experiences. Being familiar with these issues can help you form an action plan in dealing with them for the future.
Communication between designer/surveyor Insufficient hardware File conversion time Data overkill Missing points