Embed Size (px)
Citation preview
Pisgah Elementary
School Improvement Plan
2016 – 2018
Buncombe County Schools
Pisgah Elementary School, School Improvement Plan 2016 - 2018 2
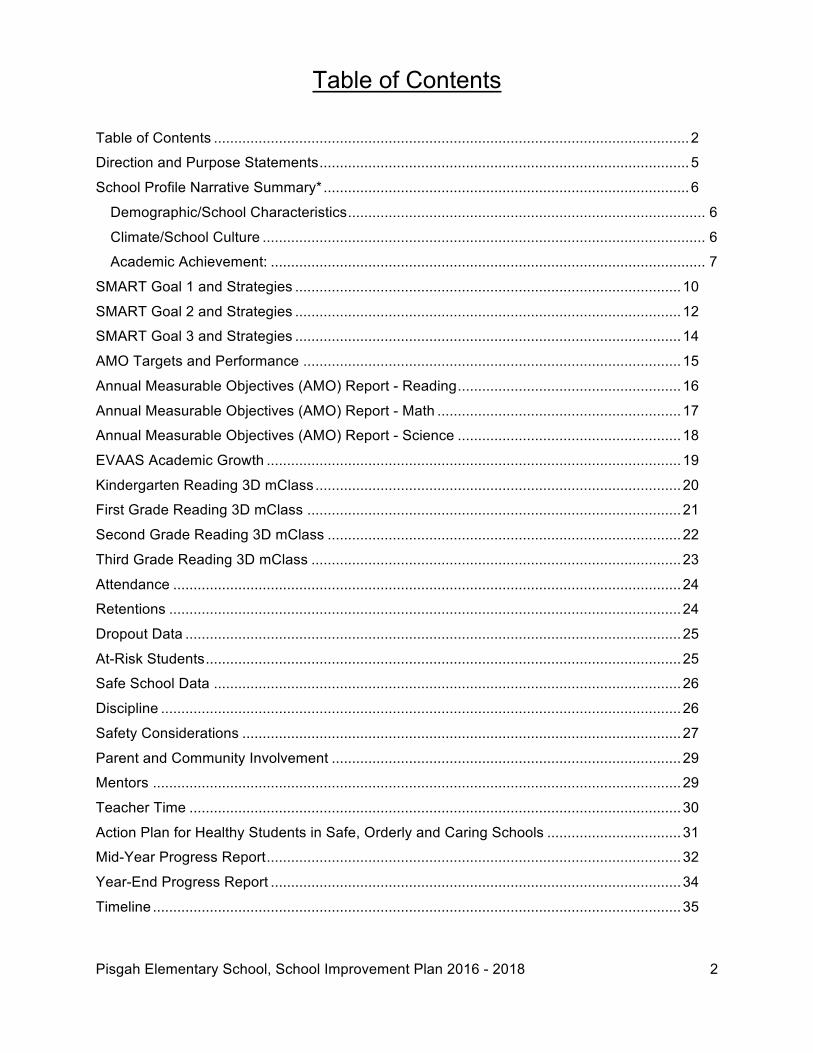
Table of Contents Table of Contents ..................................................................................................................... 2
Direction and Purpose Statements ........................................................................................... 5
School Profile Narrative Summary* .......................................................................................... 6
Demographic/School Characteristics ........................................................................................ 6
Climate/School Culture ............................................................................................................. 6
Academic Achievement: ........................................................................................................... 7
SMART Goal 1 and Strategies ............................................................................................... 10
SMART Goal 2 and Strategies ............................................................................................... 12
SMART Goal 3 and Strategies ............................................................................................... 14
AMO Targets and Performance ............................................................................................. 15
Annual Measurable Objectives (AMO) Report - Reading ....................................................... 16
Annual Measurable Objectives (AMO) Report - Math ............................................................ 17
Annual Measurable Objectives (AMO) Report - Science ....................................................... 18
EVAAS Academic Growth ...................................................................................................... 19
Kindergarten Reading 3D mClass .......................................................................................... 20
First Grade Reading 3D mClass ............................................................................................ 21
Second Grade Reading 3D mClass ....................................................................................... 22
Third Grade Reading 3D mClass ........................................................................................... 23
Attendance ............................................................................................................................. 24
Retentions .............................................................................................................................. 24
Dropout Data .......................................................................................................................... 25
At-Risk Students ..................................................................................................................... 25
Safe School Data ................................................................................................................... 26
Discipline ................................................................................................................................ 26
Safety Considerations ............................................................................................................ 27
Parent and Community Involvement ...................................................................................... 29
Mentors .................................................................................................................................. 29
Teacher Time ......................................................................................................................... 30
Action Plan for Healthy Students in Safe, Orderly and Caring Schools ................................. 31
Mid-Year Progress Report ...................................................................................................... 32
Year-End Progress Report ..................................................................................................... 34
Timeline .................................................................................................................................. 35
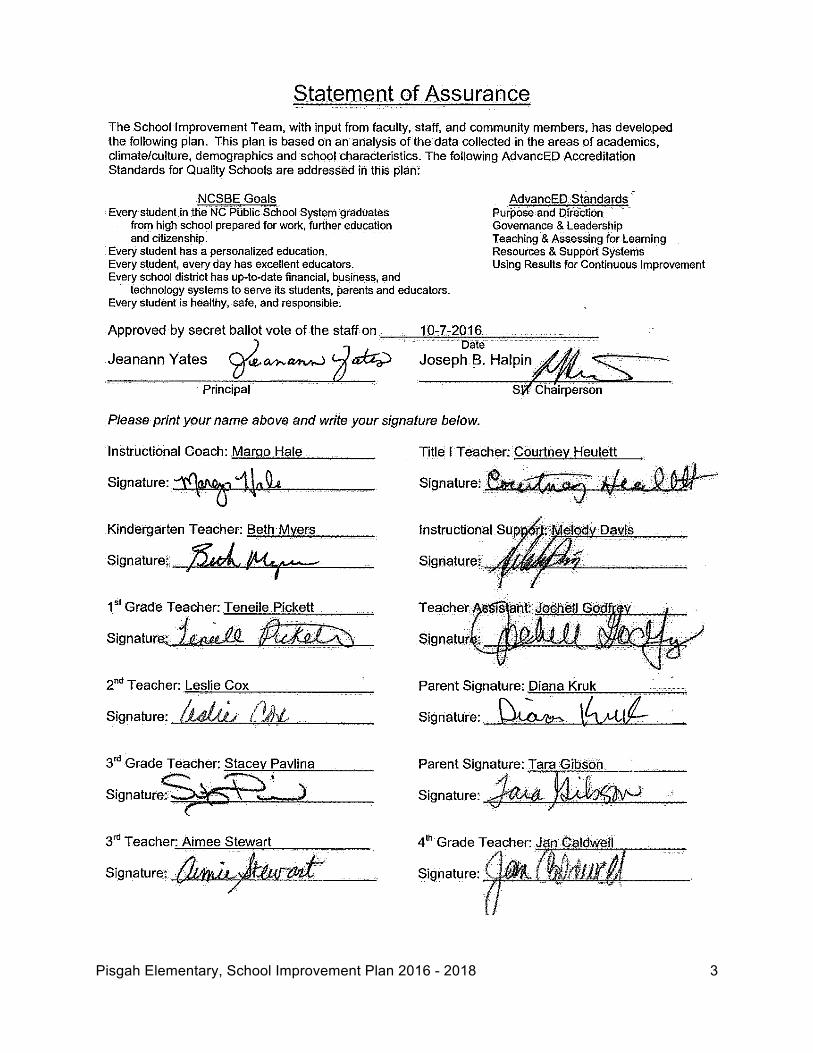
Pisgah Elementary, School Improvement Plan 2016 - 2018 3
Pisgah Elementary, School Improvement Plan 2016 - 2018 4
Pisgah Elementary, School Improvement Plan 2016 - 2018 5
Direction and Purpose Statements
BCS Direction Statement
Buncombe County Schools’ students will reach their full potential and become successful, responsible citizens in a diverse, global society.
BCS Purpose Statement
To collaborate with stakeholders to provide a safe, caring, rigorous and engaging learning environment that prepares all students to be College and Career Ready.
Pisgah Elementary School Direction Statement
Students at Pisgah Elementary School will acquire the knowledge and skills necessary to become lifelong learners capable of being responsible citizens who can adapt to a changing world in the 21st century. It is our desire to work cooperatively with parents
and the community to create a school environment which is safe, inviting, engaging and academically rigorous that prepares all students to be 21st century ready.
Pisgah Elementary School Purpose Statement
Students at Pisgah Elementary School will be challenged through meaningful contexts, problem solving and life applicable experiences. At Pisgah Elementary we create a
family of learners through building respect and caring about others. Students are safe and responsible. It is our vision to create a family of learners through building respect
and caring about others. Students will be safe and responsible.
• Students will find success through varied learning styles in a safe environment. We believe students will be positively encouraged to be actively engaged in their own learning.
• Students will have committed teachers dedicated to them in all ways:
academics, discipline, respect, and self-esteem.
• Parents and community will share the common responsibility of understanding the expectations of and providing the support for an environment where maximum learning can occur.
Pisgah Elementary, School Improvement Plan 2016 - 2018 6
School Profile Narrative Summary* Based on your school’s needs assessment, complete the following sections: Demographic/School Characteristics Pisgah Elementary School, a small rural school, is nestled at the foot of Mt. Pisgah. The school was built in 1951 and was renovated and upgraded in 2001, 2005 and 2006. Sitting on a 13-acre tract of land, the building and grounds are manicured throughout. It is not uncommon for the staff to know each student by name. Pisgah has a population of 176 students with 69 percent of the students receiving free or reduced lunch. The staff is made up of one Principal, ten Homeroom Teachers, one Media Specialist, one Title I Reading Specialist, one Resource Teacher, and one School counselor position, itinerant teachers consisting of support staff in the areas of Special Services, one Speech, one Physical Education, one Music and one Art, one Nurse, one Social Worker, one Curriculum Coach, eight Teacher Assistants (five full time; three half-time), two Title I half-time reading assistants, two Office Staff, two Bus Drivers, four Cafeteria Workers, and two Custodians. Pisgah has a 30-student workstation computer lab with Internet access. Each 4th grade student is provided with a personal tablet to use all year. Once a week this lab provides 30 minutes of computer project based education to all students. In addition to the computer lab, each classroom has two Internet accessible computers. There are also three mobile iPad labs based in the Media Center. Each classroom has a teaching station laptop, data projector, document camera, and SMART Board. The Media Center currently meets or exceeds standards that have been set up for the number of recommended per pupil books. Over the last several years Pisgah has prioritized funding to increase the number of books and decrease the age of the collection in the Media Center. This is and will continue to be a priority at the school. We currently have 8488 books, which equates to 47 books per child with an average publishing date of 2001. This year Pisgah received a $10,000 grant for iPads and online math and science subscriptions. Climate/School Culture - Provide information from student, parent and staff surveys. Climate/School Culture
For many years, Pisgah was considered a community school where generations of families attended and supported common educational goals. In recent years, the student population has become more transient/mobile. Many families have been adversely affected by economic conditions, which in turn, has impacted the educational setting in a variety of ways. “Red flags” such as lack of basic skills, reduced parent involvement, and increased behavioral issues have been observed. A continued effort is being made to provide a positive learning environment for all students as they assimilate into the “traditional” Pisgah Elementary community, by addressing social, academic, and safety concerns.
Pisgah Elementary, School Improvement Plan 2016 - 2018 7
Challenges notwithstanding, Pisgah continues to enjoy a positive climate. A variety of approaches have been utilized over time and the successful strategies are still in place today. Students and staff continue to recite the “Pisgah Promise” and Pledge of Allegiance each morning. Students are recognized throughout the year for positive and respectful behavior from walking correctly in the hallway to riding the bus and all areas in between. Pisgah Pride Tickets are given to students when earned and these may be traded in at the Pisgah School Store or used for student/teacher-generated rewards, such as lunch with a friend in another class or reading with a book buddy. To continue to strengthen the climate and culture of the school, data boards are mounted in the front hall to highlight student and staff achievements. Also, staff members are encouraged to nominate a coworker for a Spirit Award. Monthly prize drawings are held. Dress-down Fridays allow staff to fund charitable giving to organizations, needy Pisgah families, and/or staff members in difficult circumstances. Many and varied after school opportunities are available for student participation such as our new Wetland, Trout Club and Garden Club. Pisgah also offers Destination Imagination, a creative problem solving strategy experience. Pisgah’s Team has qualified to compete globally the past eight years. These activities enhance climate, and help support high academic expectations. Academic Achievement:
For 2013/2014 and 2014/2015 Pisgah has been recognized as a National Title 1 Distinguished school. Our overall reading, math, and science scores for 3rd-5th grade were in the top 10 percent of the state. We are a 2016 National Blue Ribbon award-winning school. This award recognizes Pisgah as an exemplary high performing school by being in the top 15 percent of schools across the United States for students who participated in the most recently administered state assessments in reading and mathematics.
Based upon our EOG data, Pisgah saw a small drop in reading. Our scores dropped .6 percent from 75% to 74.4% as indicated by the EOG Internal Ready Review. In addition, our math scores had a decrease from 83.6 percent to 76 percent, resulting in a seven point six percent decrease, this was also indicated by the EOG Internal Ready Review. In looking specifically at our cohorts, math scores increased in third grade to fourth grade from 72.1 percent to 76.9 percent. While our fourth to fifth grade cohort had a significant drop in scores from 88.1 percent to 77.3 percent. Our reading scores showed a slight increase with the third to fourth grade cohort from 74.4 percent to 76.9 percent and our fourth to fifth grade cohort showing a slight decline from 76.2 percent to 72.7 percent.
Science scores continued to be an academic strength at our school with a performance composite that increased from 87.1 percent in 2014 to 90.9 percent in 2015.
Pisgah Elementary, School Improvement Plan 2016 - 2018 8
Although Pisgah has a history of high growth and academic achievement, our staff shares the belief that there is always room for improvement as indicated by the decline in both reading and math in the specified areas. We have developed numerous strategies used to increase student achievement:
▪ One of our most powerful tools at Pisgah is the abundance of highly qualified staff who are dedicated professionals and consistently have high expectation for their students and for themselves.
▪ Teachers and staff know our students both academically and socially and constantly seek to mitigate any barriers that prevent students from fully accessing the curriculum.
▪ Staff development opportunities that meet the needs of our students and enhance best practice
▪ Implementation of Buncombe County 90 minute literacy block and Math Investigations 3.0
▪ Common planning/Intervention Block embedded in the Master Schedule
Our current success significantly rests in the area of academics through the implementation of our Intervention Block Schedule and coordinating Title I, EC, AIG, Tutors, and Enrichment times to allow for more focused content area blocks. Additionally, highly qualified tutors and volunteers provide targeted differentiation by mentoring our struggling students and providing enrichment for students at or above grade level. The staff of Pisgah is well aware that there is always room for growth in the area of academics. Based on the knowledge and the results of the recent survey, the following bulleted areas will be targeted for improvement over the next two years:
▪ Increase strategies to work with special needs/resource students in the area of math vocabulary.
▪ Implement a school-wide incentive program and new policy procedure to decrease tardiness to school.
▪ Implement “Wit and Wisdom”, a rigorous literacy program which will increase the percentage of students who perceive that their curriculum is challenging.
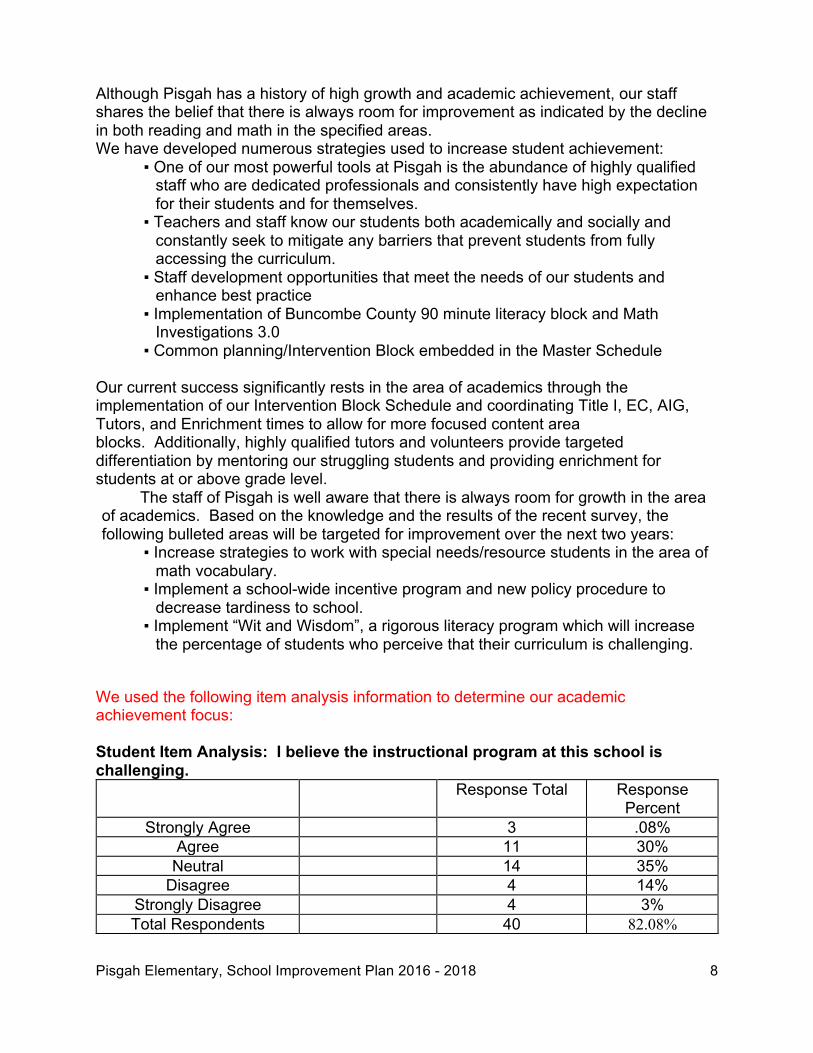
We used the following item analysis information to determine our academic achievement focus: Student Item Analysis: I believe the instructional program at this school is challenging.
Response Total Response Percent
Strongly Agree 3 .08% Agree 11 30% Neutral 14 35%
Disagree 4 14% Strongly Disagree 4 3% Total Respondents 40 82.08%
Pisgah Elementary, School Improvement Plan 2016 - 2018 9
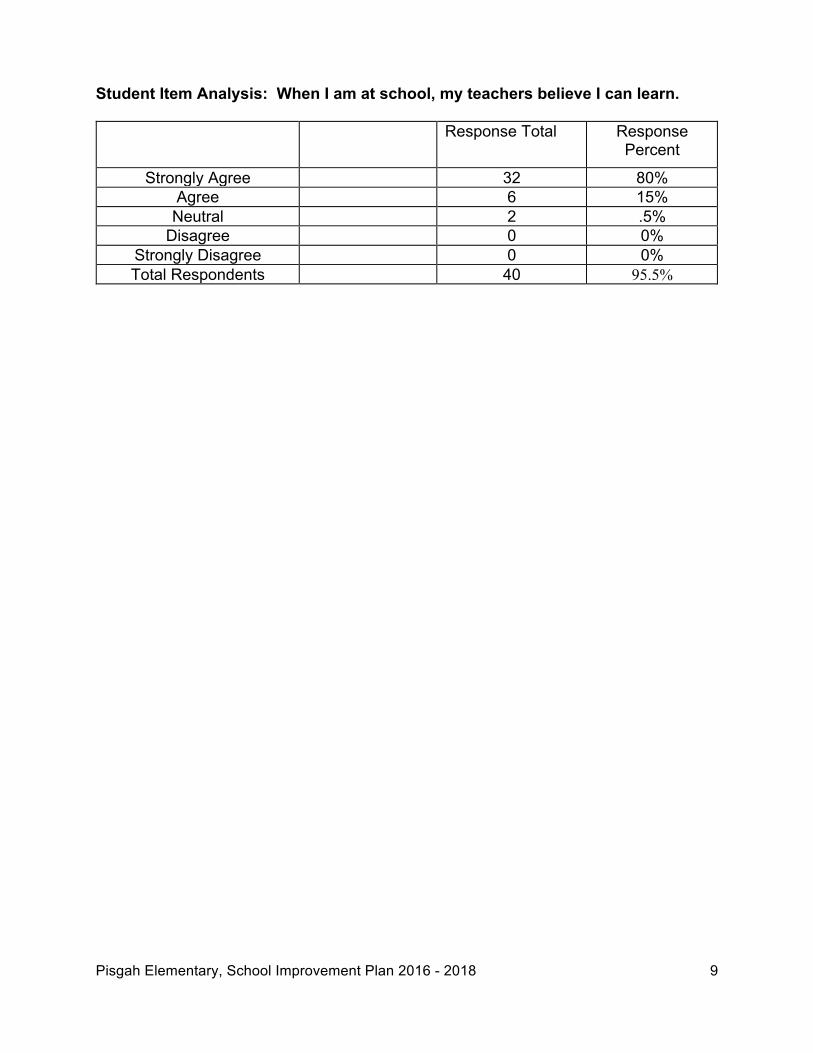
Student Item Analysis: When I am at school, my teachers believe I can learn.
Response Total Response Percent
Strongly Agree 32 80% Agree 6 15% Neutral 2 .5%
Disagree 0 0% Strongly Disagree 0 0% Total Respondents 40 95.5%
Pisgah Elementary, School Improvement Plan 2016 - 2018 10
SMART Goal 1 and Strategies NCSBE Goal BCS Strategic
Priorities 2012 AdvancED
Standards Title I Component
Every student in the NC Public School System graduates from high school prepared for work, further education and citizenship
Every student has a personalized education
Every student, every day has excellent educators
Every school district has up-to-date financial, business, and technology systems to serve its students, parents and educators
Every student is healthy, safe, and responsible
All students will graduate as high-achieving and globally competitive learners with 21st Century Skills.
All learning environments will be safe, respectful, caring and produce healthy and responsible students.
Quality teachers, administrators and staff will provide an innovative and effective educational program for all students.
Systems will be in place to inform, educate and engage the community to build support for schools and ensure accountability.
Purpose and Direction Governance & Leadership Teaching & Assessing for
Learning Resources and Support
Systems Using Results for
Continuous Improvement
School-wide Reform Strategies
Transition Plans Parental Involvement Support for Students
Experiencing Difficulty Teacher Involvement in
Use of Assessment Coordination of Programs
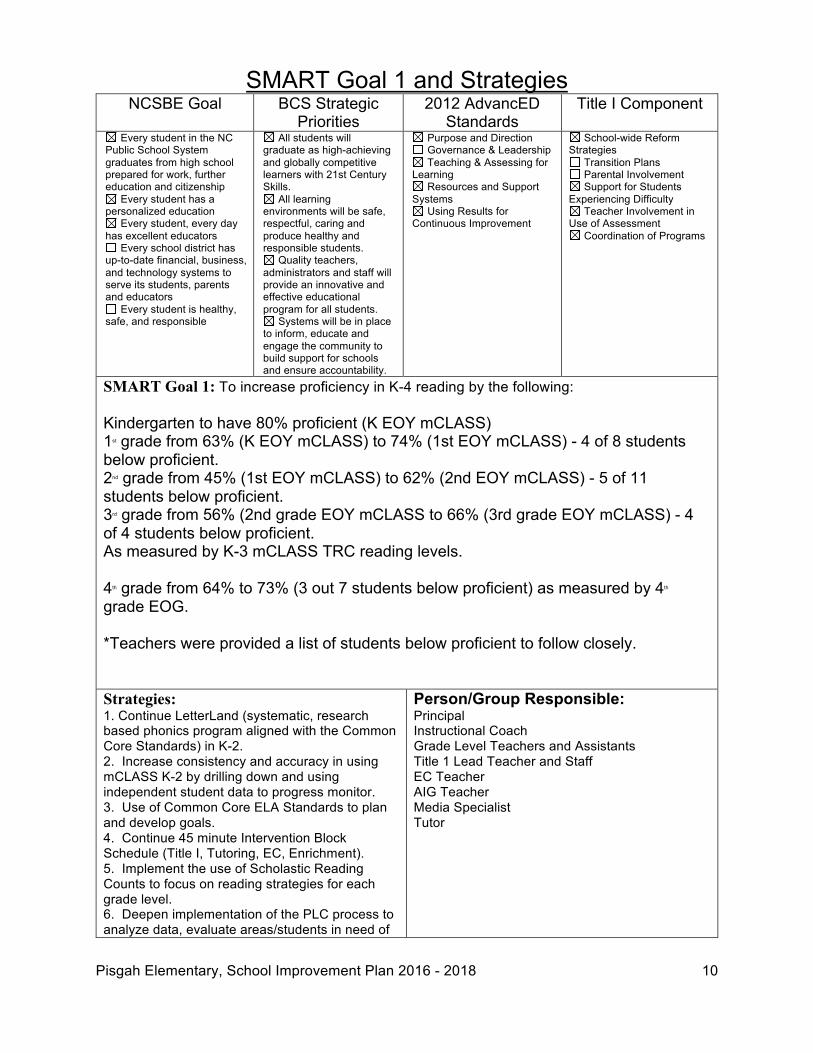
SMART Goal 1: To increase proficiency in K-4 reading by the following: Kindergarten to have 80% proficient (K EOY mCLASS) 1st grade from 63% (K EOY mCLASS) to 74% (1st EOY mCLASS) - 4 of 8 students below proficient. 2nd grade from 45% (1st EOY mCLASS) to 62% (2nd EOY mCLASS) - 5 of 11 students below proficient. 3rd grade from 56% (2nd grade EOY mCLASS to 66% (3rd grade EOY mCLASS) - 4 of 4 students below proficient. As measured by K-3 mCLASS TRC reading levels. 4th grade from 64% to 73% (3 out 7 students below proficient) as measured by 4th grade EOG. *Teachers were provided a list of students below proficient to follow closely. Strategies: 1. Continue LetterLand (systematic, research based phonics program aligned with the Common Core Standards) in K-2. 2. Increase consistency and accuracy in using mCLASS K-2 by drilling down and using independent student data to progress monitor. 3. Use of Common Core ELA Standards to plan and develop goals. 4. Continue 45 minute Intervention Block Schedule (Title I, Tutoring, EC, Enrichment). 5. Implement the use of Scholastic Reading Counts to focus on reading strategies for each grade level. 6. Deepen implementation of the PLC process to analyze data, evaluate areas/students in need of
Person/Group Responsible: Principal Instructional Coach Grade Level Teachers and Assistants Title 1 Lead Teacher and Staff EC Teacher AIG Teacher Media Specialist Tutor
Pisgah Elementary, School Improvement Plan 2016 - 2018 11
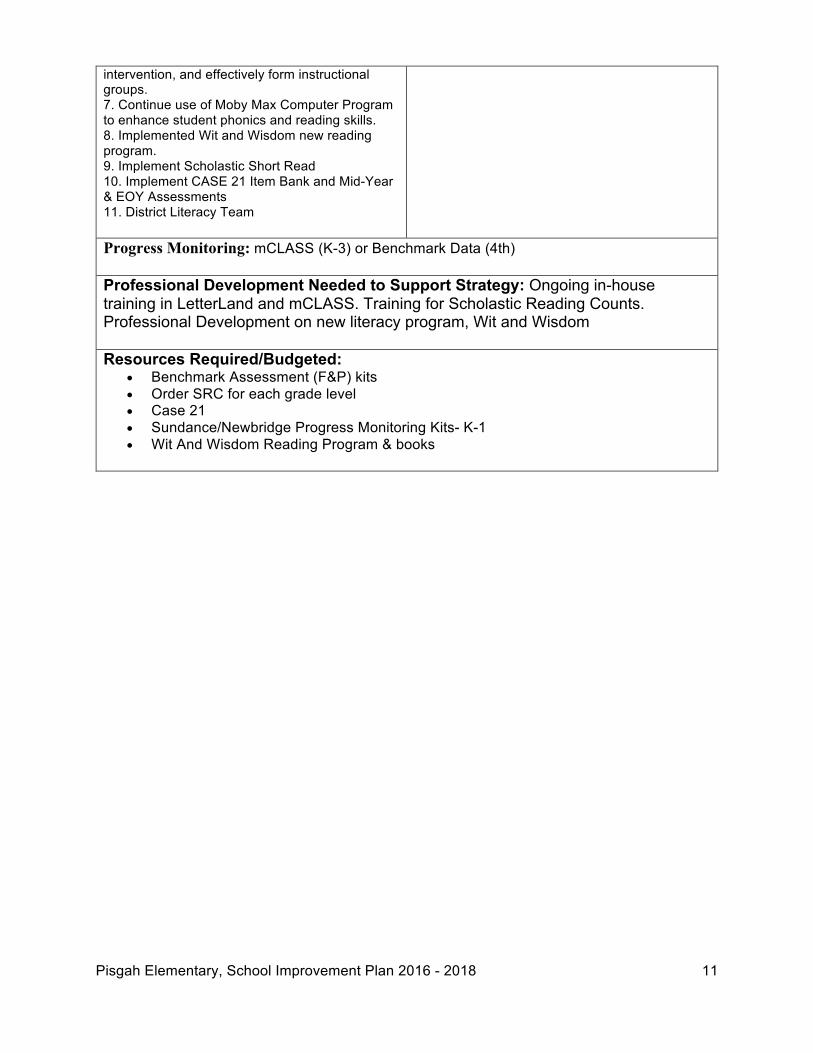
intervention, and effectively form instructional groups. 7. Continue use of Moby Max Computer Program to enhance student phonics and reading skills. 8. Implemented Wit and Wisdom new reading program. 9. Implement Scholastic Short Read 10. Implement CASE 21 Item Bank and Mid-Year & EOY Assessments 11. District Literacy Team Progress Monitoring: mCLASS (K-3) or Benchmark Data (4th) Professional Development Needed to Support Strategy: Ongoing in-house training in LetterLand and mCLASS. Training for Scholastic Reading Counts. Professional Development on new literacy program, Wit and Wisdom Resources Required/Budgeted:
• Benchmark Assessment (F&P) kits • Order SRC for each grade level • Case 21 • Sundance/Newbridge Progress Monitoring Kits- K-1 • Wit And Wisdom Reading Program & books
Pisgah Elementary, School Improvement Plan 2016 - 2018 12
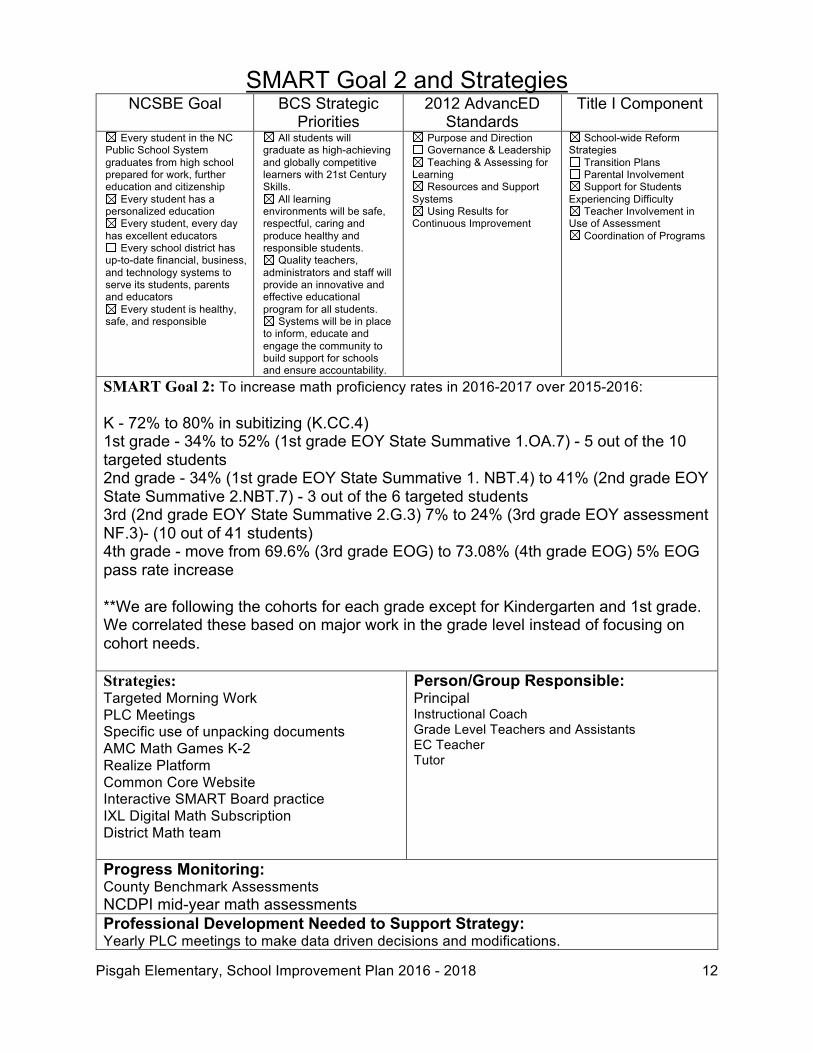
SMART Goal 2 and Strategies NCSBE Goal BCS Strategic
Priorities 2012 AdvancED
Standards Title I Component
Every student in the NC Public School System graduates from high school prepared for work, further education and citizenship
Every student has a personalized education
Every student, every day has excellent educators
Every school district has up-to-date financial, business, and technology systems to serve its students, parents and educators
Every student is healthy, safe, and responsible
All students will graduate as high-achieving and globally competitive learners with 21st Century Skills.
All learning environments will be safe, respectful, caring and produce healthy and responsible students.
Quality teachers, administrators and staff will provide an innovative and effective educational program for all students.
Systems will be in place to inform, educate and engage the community to build support for schools and ensure accountability.
Purpose and Direction Governance & Leadership Teaching & Assessing for
Learning Resources and Support
Systems Using Results for
Continuous Improvement
School-wide Reform Strategies
Transition Plans Parental Involvement Support for Students
Experiencing Difficulty Teacher Involvement in
Use of Assessment Coordination of Programs
SMART Goal 2: To increase math proficiency rates in 2016-2017 over 2015-2016: K - 72% to 80% in subitizing (K.CC.4) 1st grade - 34% to 52% (1st grade EOY State Summative 1.OA.7) - 5 out of the 10 targeted students 2nd grade - 34% (1st grade EOY State Summative 1. NBT.4) to 41% (2nd grade EOY State Summative 2.NBT.7) - 3 out of the 6 targeted students 3rd (2nd grade EOY State Summative 2.G.3) 7% to 24% (3rd grade EOY assessment NF.3)- (10 out of 41 students) 4th grade - move from 69.6% (3rd grade EOG) to 73.08% (4th grade EOG) 5% EOG pass rate increase **We are following the cohorts for each grade except for Kindergarten and 1st grade. We correlated these based on major work in the grade level instead of focusing on cohort needs. Strategies: Targeted Morning Work PLC Meetings Specific use of unpacking documents AMC Math Games K-2 Realize Platform Common Core Website Interactive SMART Board practice IXL Digital Math Subscription District Math team
Person/Group Responsible: Principal Instructional Coach Grade Level Teachers and Assistants EC Teacher Tutor
Progress Monitoring: County Benchmark Assessments NCDPI mid-year math assessments Professional Development Needed to Support Strategy: Yearly PLC meetings to make data driven decisions and modifications.
Pisgah Elementary, School Improvement Plan 2016 - 2018 13
Resources Required/Budgeted: REALIZE Platform Case 21
Pisgah Elementary, School Improvement Plan 2016 - 2018 14
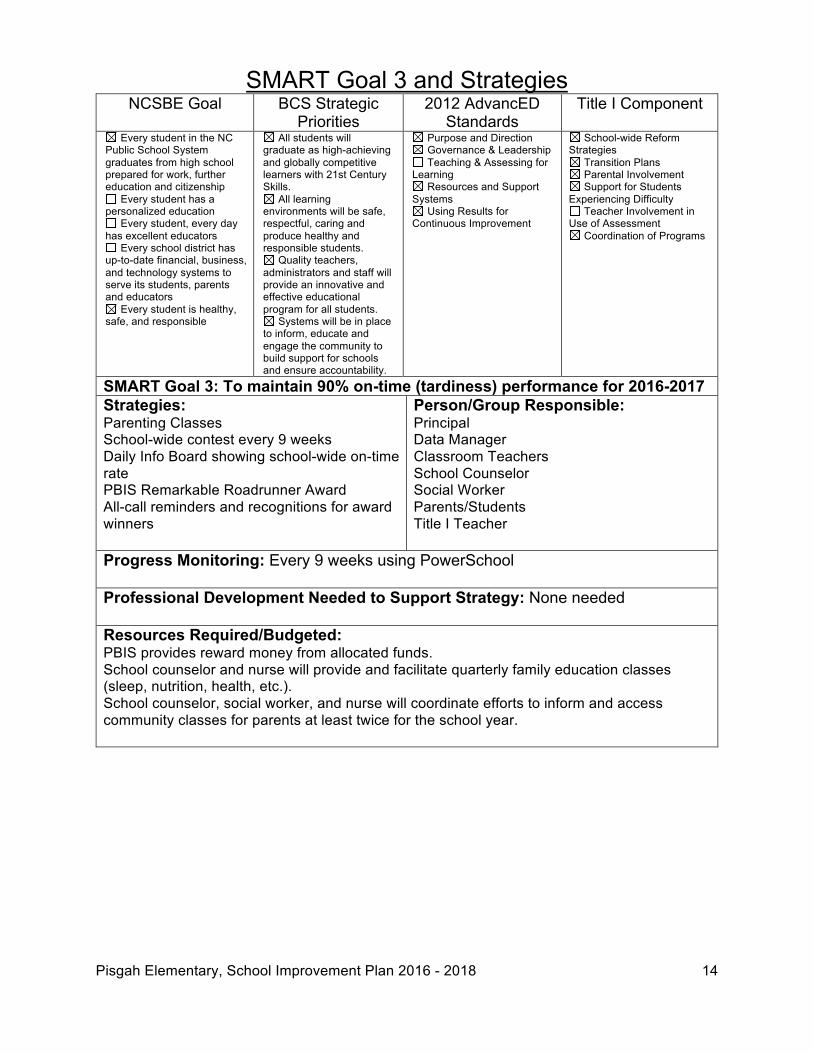
SMART Goal 3 and Strategies NCSBE Goal BCS Strategic
Priorities 2012 AdvancED
Standards Title I Component
Every student in the NC Public School System graduates from high school prepared for work, further education and citizenship
Every student has a personalized education
Every student, every day has excellent educators
Every school district has up-to-date financial, business, and technology systems to serve its students, parents and educators
Every student is healthy, safe, and responsible
All students will graduate as high-achieving and globally competitive learners with 21st Century Skills.
All learning environments will be safe, respectful, caring and produce healthy and responsible students.
Quality teachers, administrators and staff will provide an innovative and effective educational program for all students.
Systems will be in place to inform, educate and engage the community to build support for schools and ensure accountability.
Purpose and Direction Governance & Leadership Teaching & Assessing for
Learning Resources and Support
Systems Using Results for
Continuous Improvement
School-wide Reform Strategies
Transition Plans Parental Involvement Support for Students
Experiencing Difficulty Teacher Involvement in
Use of Assessment Coordination of Programs
SMART Goal 3: To maintain 90% on-time (tardiness) performance for 2016-2017 Strategies: Parenting Classes School-wide contest every 9 weeks Daily Info Board showing school-wide on-time rate PBIS Remarkable Roadrunner Award All-call reminders and recognitions for award winners
Person/Group Responsible: Principal Data Manager Classroom Teachers School Counselor Social Worker Parents/Students Title I Teacher
Progress Monitoring: Every 9 weeks using PowerSchool Professional Development Needed to Support Strategy: None needed Resources Required/Budgeted: PBIS provides reward money from allocated funds. School counselor and nurse will provide and facilitate quarterly family education classes (sleep, nutrition, health, etc.). School counselor, social worker, and nurse will coordinate efforts to inform and access community classes for parents at least twice for the school year.
Pisgah Elementary, School Improvement Plan 2016 - 2018 15
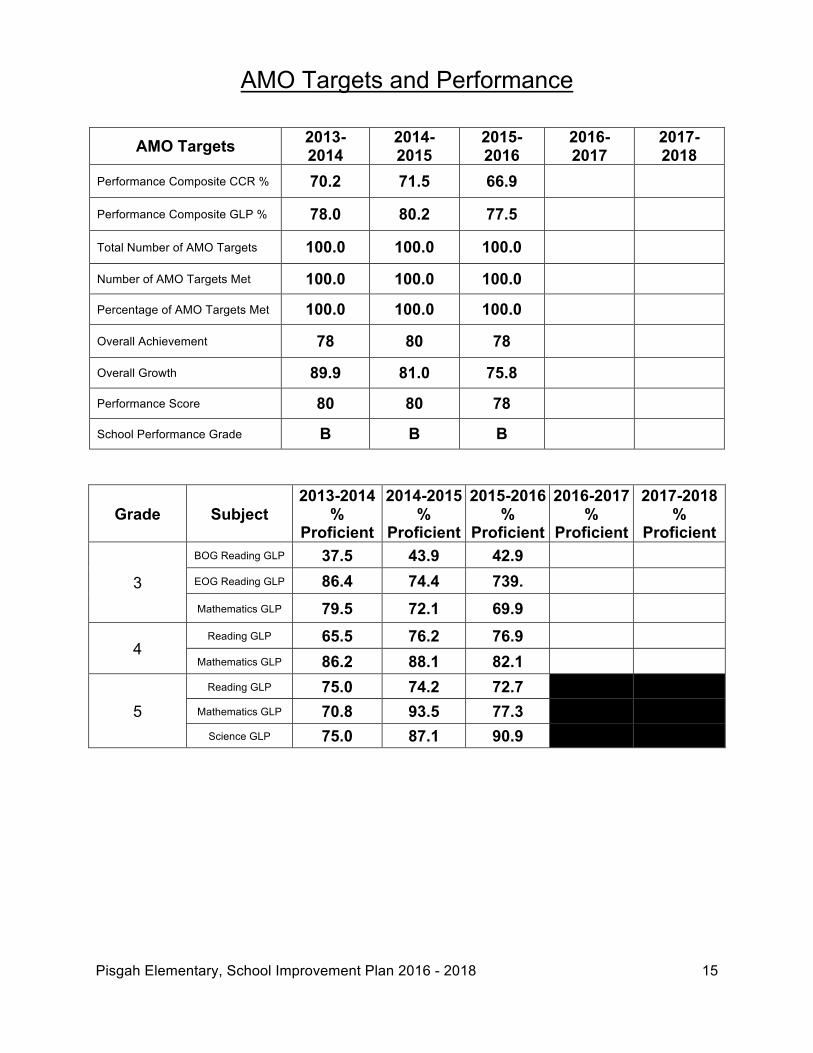
AMO Targets and Performance
AMO Targets 2013-2014
2014-2015
2015-2016
2016-2017
2017-2018
Performance Composite CCR % 70.2 71.5 66.9
Performance Composite GLP % 78.0 80.2 77.5
Total Number of AMO Targets 100.0 100.0 100.0
Number of AMO Targets Met 100.0 100.0 100.0
Percentage of AMO Targets Met 100.0 100.0 100.0
Overall Achievement 78 80 78
Overall Growth 89.9 81.0 75.8
Performance Score 80 80 78
School Performance Grade B B B
Grade Subject 2013-2014
% Proficient
2014-2015 %
Proficient
2015-2016 %
Proficient
2016-2017 %
Proficient
2017-2018 %
Proficient
3
BOG Reading GLP 37.5 43.9 42.9 EOG Reading GLP 86.4 74.4 739. Mathematics GLP 79.5 72.1 69.9
4 Reading GLP 65.5 76.2 76.9
Mathematics GLP 86.2 88.1 82.1
5 Reading GLP 75.0 74.2 72.7
Mathematics GLP 70.8 93.5 77.3 Science GLP 75.0 87.1 90.9
Pisgah Elementary, School Improvement Plan 2016 - 2018 16
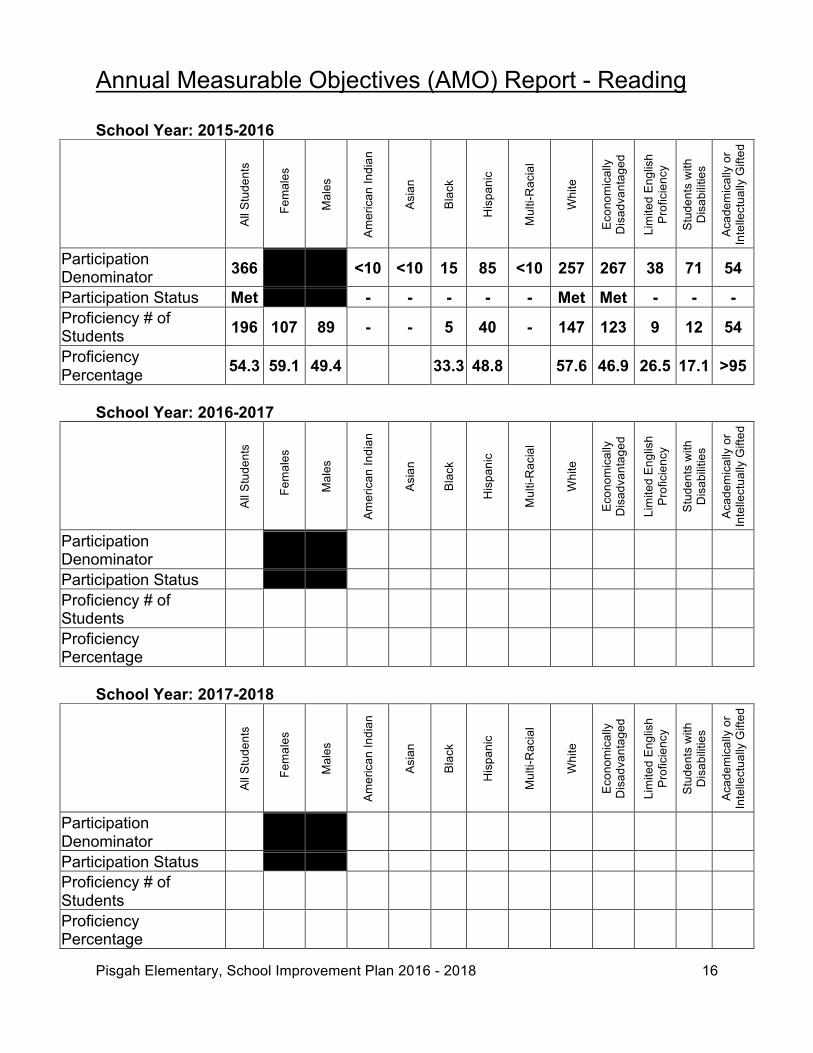
Annual Measurable Objectives (AMO) Report - Reading
School Year: 2015-2016
All S
tude
nts
Fem
ales
Mal
es
Amer
ican
Indi
an
Asia
n
Blac
k
His
pani
c
Mul
ti-R
acia
l
Whi
te
Econ
omic
ally
D
isad
vant
aged
Lim
ited
Engl
ish
Prof
icie
ncy
Stud
ents
with
D
isab
ilitie
s
Acad
emic
ally
or
Inte
llect
ually
Gift
ed
Participation Denominator 366 <10 <10 15 85 <10 257 267 38 71 54
Participation Status Met - - - - - Met Met - - - Proficiency # of Students 196 107 89 - - 5 40 - 147 123 9 12 54
Proficiency Percentage 54.3 59.1 49.4 33.3 48.8 57.6 46.9 26.5 17.1 >95
School Year: 2016-2017
All S
tude
nts
Fem
ales
Mal
es
Amer
ican
Indi
an
Asia
n
Blac
k
His
pani
c
Mul
ti-R
acia
l
Whi
te
Econ
omic
ally
D
isad
vant
aged
Lim
ited
Engl
ish
Prof
icie
ncy
Stud
ents
with
D
isab
ilitie
s
Acad
emic
ally
or
Inte
llect
ually
Gift
ed
Participation Denominator
Participation Status Proficiency # of Students
Proficiency Percentage
School Year: 2017-2018
All S
tude
nts
Fem
ales
Mal
es
Amer
ican
Indi
an
Asia
n
Blac
k
His
pani
c
Mul
ti-R
acia
l
Whi
te
Econ
omic
ally
D
isad
vant
aged
Lim
ited
Engl
ish
Prof
icie
ncy
Stud
ents
with
D
isab
ilitie
s
Acad
emic
ally
or
Inte
llect
ually
Gift
ed
Participation Denominator
Participation Status Proficiency # of Students
Proficiency Percentage
Pisgah Elementary, School Improvement Plan 2016 - 2018 17
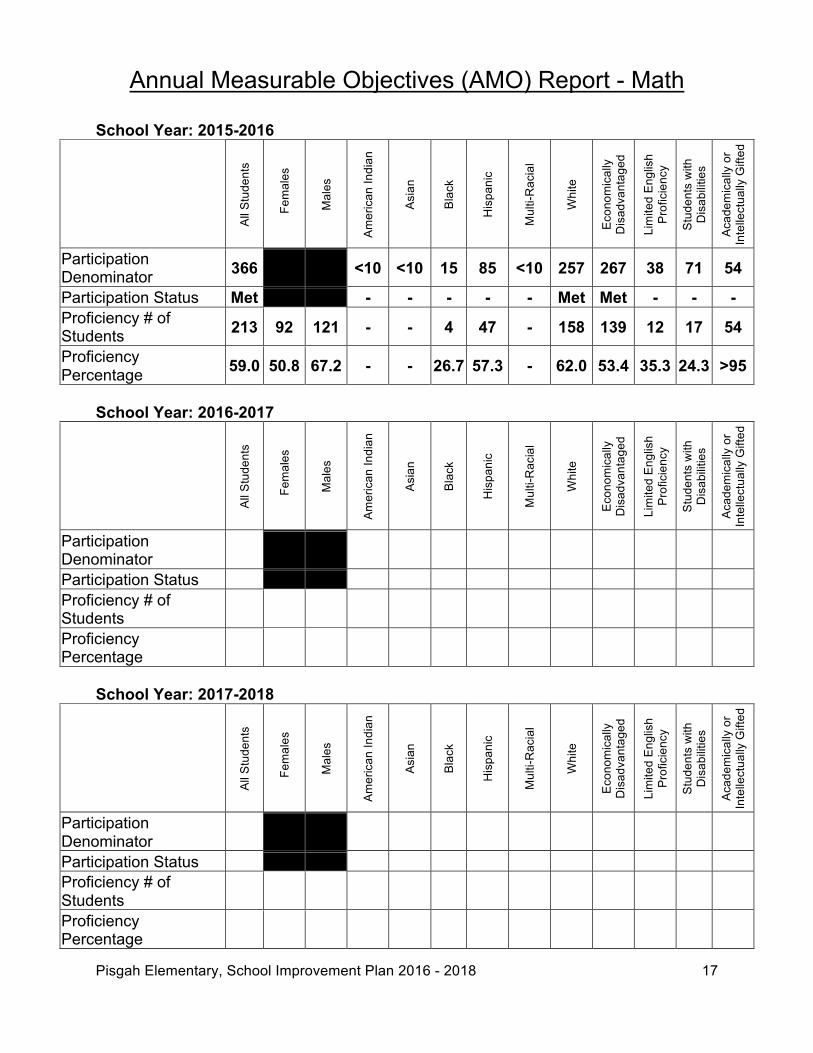
Annual Measurable Objectives (AMO) Report - Math
School Year: 2015-2016
All S
tude
nts
Fem
ales
Mal
es
Amer
ican
Indi
an
Asia
n
Blac
k
His
pani
c
Mul
ti-R
acia
l
Whi
te
Econ
omic
ally
D
isad
vant
aged
Lim
ited
Engl
ish
Prof
icie
ncy
Stud
ents
with
D
isab
ilitie
s
Acad
emic
ally
or
Inte
llect
ually
Gift
ed
Participation Denominator 366 <10 <10 15 85 <10 257 267 38 71 54
Participation Status Met - - - - - Met Met - - - Proficiency # of Students 213 92 121 - - 4 47 - 158 139 12 17 54
Proficiency Percentage 59.0 50.8 67.2 - - 26.7 57.3 - 62.0 53.4 35.3 24.3 >95
School Year: 2016-2017
All S
tude
nts
Fem
ales
Mal
es
Amer
ican
Indi
an
Asia
n
Blac
k
His
pani
c
Mul
ti-R
acia
l
Whi
te
Econ
omic
ally
D
isad
vant
aged
Lim
ited
Engl
ish
Prof
icie
ncy
Stud
ents
with
D
isab
ilitie
s
Acad
emic
ally
or
Inte
llect
ually
Gift
ed
Participation Denominator
Participation Status Proficiency # of Students
Proficiency Percentage
School Year: 2017-2018
All S
tude
nts
Fem
ales
Mal
es
Amer
ican
Indi
an
Asia
n
Blac
k
His
pani
c
Mul
ti-R
acia
l
Whi
te
Econ
omic
ally
D
isad
vant
aged
Lim
ited
Engl
ish
Prof
icie
ncy
Stud
ents
with
D
isab
ilitie
s
Acad
emic
ally
or
Inte
llect
ually
Gift
ed
Participation Denominator
Participation Status Proficiency # of Students
Proficiency Percentage
Pisgah Elementary, School Improvement Plan 2016 - 2018 18
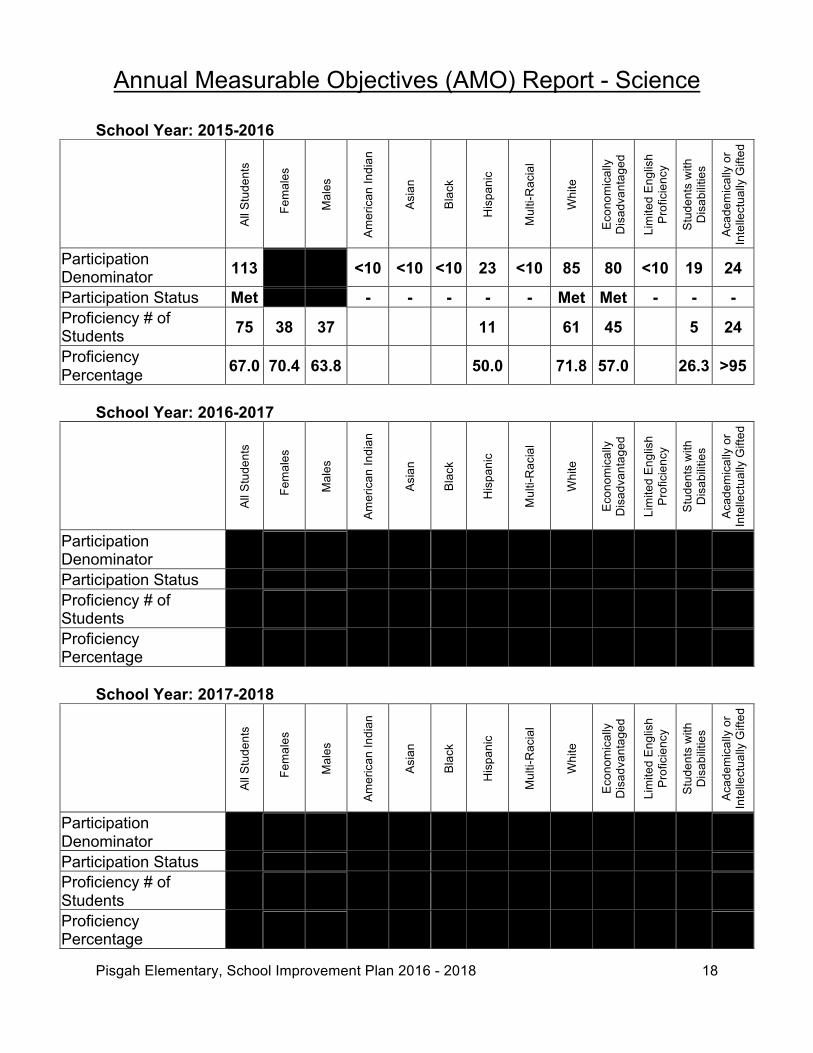
Annual Measurable Objectives (AMO) Report - Science
School Year: 2015-2016
All S
tude
nts
Fem
ales
Mal
es
Amer
ican
Indi
an
Asia
n
Blac
k
His
pani
c
Mul
ti-R
acia
l
Whi
te
Econ
omic
ally
D
isad
vant
aged
Lim
ited
Engl
ish
Prof
icie
ncy
Stud
ents
with
D
isab
ilitie
s
Acad
emic
ally
or
Inte
llect
ually
Gift
ed
Participation Denominator 113 <10 <10 <10 23 <10 85 80 <10 19 24
Participation Status Met - - - - - Met Met - - - Proficiency # of Students 75 38 37 11 61 45 5 24
Proficiency Percentage 67.0 70.4 63.8 50.0 71.8 57.0 26.3 >95
School Year: 2016-2017
All S
tude
nts
Fem
ales
Mal
es
Amer
ican
Indi
an
Asia
n
Blac
k
His
pani
c
Mul
ti-R
acia
l
Whi
te
Econ
omic
ally
D
isad
vant
aged
Lim
ited
Engl
ish
Prof
icie
ncy
Stud
ents
with
D
isab
ilitie
s
Acad
emic
ally
or
Inte
llect
ually
Gift
ed
Participation Denominator
Participation Status Proficiency # of Students
Proficiency Percentage
School Year: 2017-2018
All S
tude
nts
Fem
ales
Mal
es
Amer
ican
Indi
an
Asia
n
Blac
k
His
pani
c
Mul
ti-R
acia
l
Whi
te
Econ
omic
ally
D
isad
vant
aged
Lim
ited
Engl
ish
Prof
icie
ncy
Stud
ents
with
D
isab
ilitie
s
Acad
emic
ally
or
Inte
llect
ually
Gift
ed
Participation Denominator
Participation Status Proficiency # of Students
Proficiency Percentage
Pisgah Elementary, School Improvement Plan 2016 - 2018 19
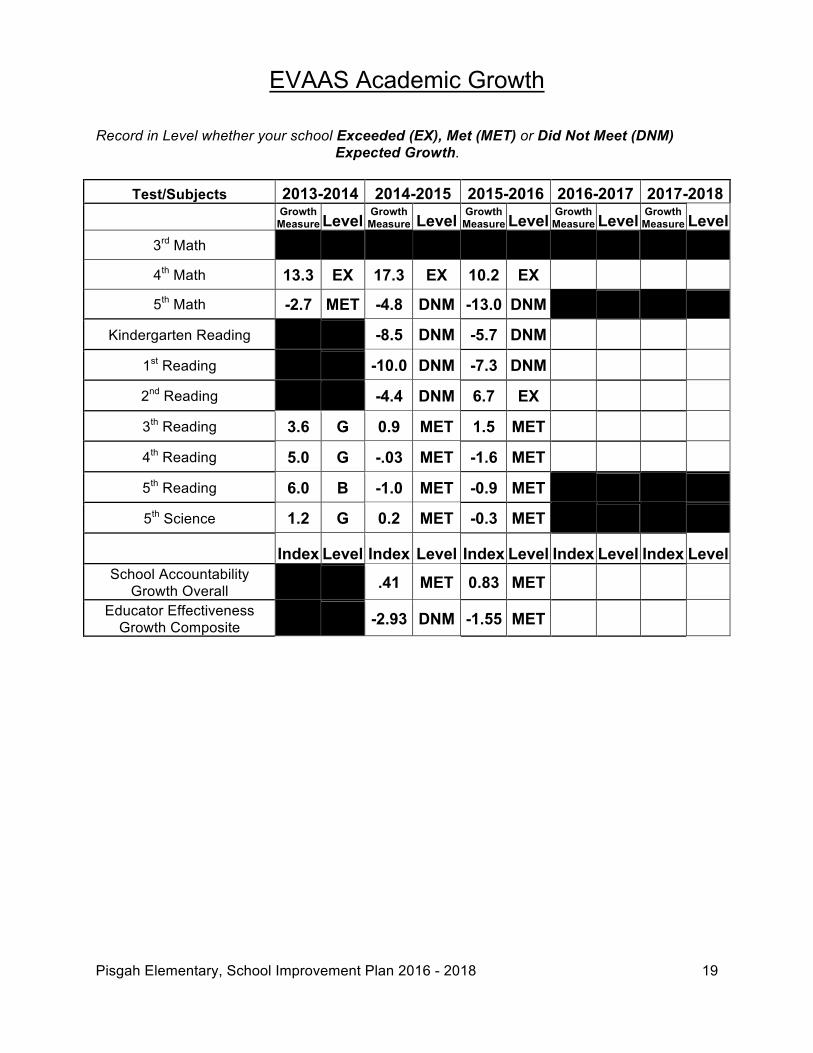
EVAAS Academic Growth
Record in Level whether your school Exceeded (EX), Met (MET) or Did Not Meet (DNM) Expected Growth.
Test/Subjects 2013-2014 2014-2015 2015-2016 2016-2017 2017-2018
Growth
Measure Level Growth Measure Level Growth
Measure Level Growth Measure Level Growth
Measure Level 3rd Math
4th Math 13.3 EX 17.3 EX 10.2 EX
5th Math -2.7 MET -4.8 DNM -13.0 DNM
Kindergarten Reading -8.5 DNM -5.7 DNM
1st Reading -10.0 DNM -7.3 DNM
2nd Reading -4.4 DNM 6.7 EX
3th Reading 3.6 G 0.9 MET 1.5 MET
4th Reading 5.0 G -.03 MET -1.6 MET
5th Reading 6.0 B -1.0 MET -0.9 MET
5th Science 1.2 G 0.2 MET -0.3 MET
Index Level Index Level Index Level Index Level Index Level School Accountability
Growth Overall .41 MET 0.83 MET Educator Effectiveness
Growth Composite -2.93 DNM -1.55 MET
Pisgah Elementary, School Improvement Plan 2016 - 2018 20
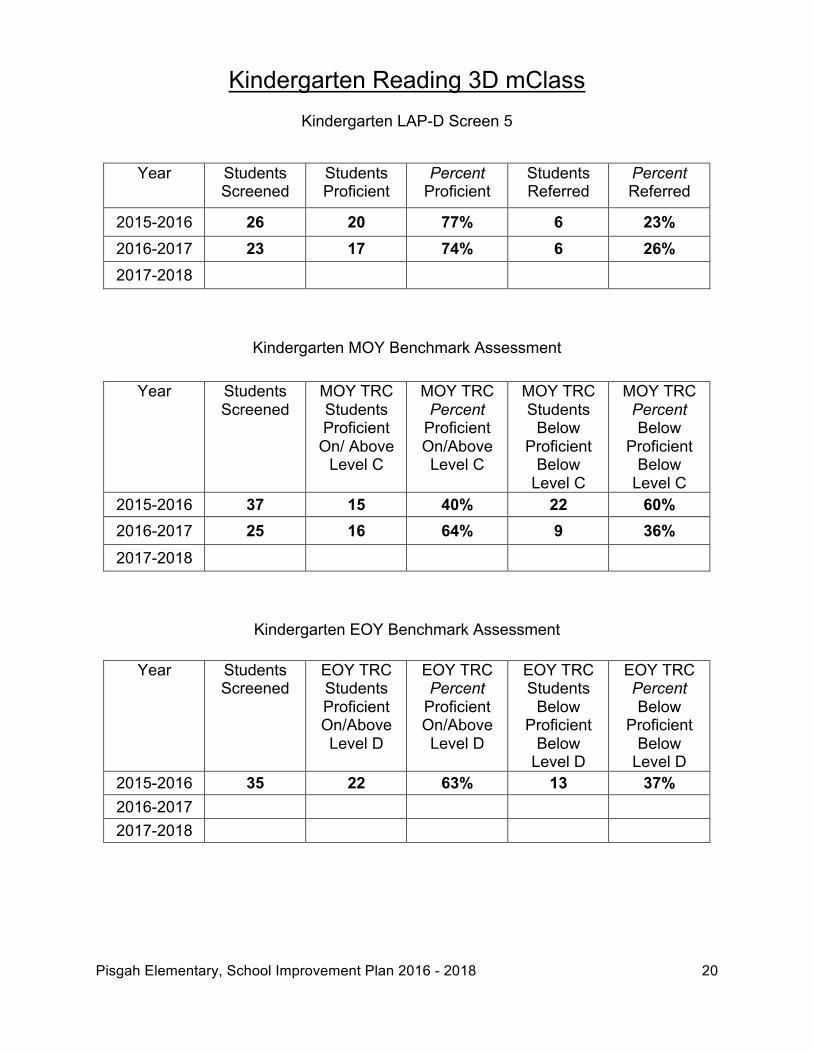
Kindergarten Reading 3D mClass
Kindergarten LAP-D Screen 5
Year Students
Screened Students Proficient
Percent Proficient
Students Referred
Percent Referred
2015-2016 26 20 77% 6 23% 2016-2017 23 17 74% 6 26% 2017-2018
Kindergarten MOY Benchmark Assessment
Year Students Screened
MOY TRC Students Proficient
On/ Above Level C
MOY TRC Percent
Proficient On/Above Level C
MOY TRC Students
Below Proficient
Below Level C
MOY TRC Percent Below
Proficient Below
Level C 2015-2016 37 15 40% 22 60% 2016-2017 25 16 64% 9 36% 2017-2018
Kindergarten EOY Benchmark Assessment
Year Students Screened
EOY TRC Students Proficient On/Above Level D
EOY TRC Percent
Proficient On/Above Level D
EOY TRC Students
Below Proficient
Below Level D
EOY TRC Percent Below
Proficient Below
Level D 2015-2016 35 22 63% 13 37% 2016-2017 2017-2018
Pisgah Elementary, School Improvement Plan 2016 - 2018 21
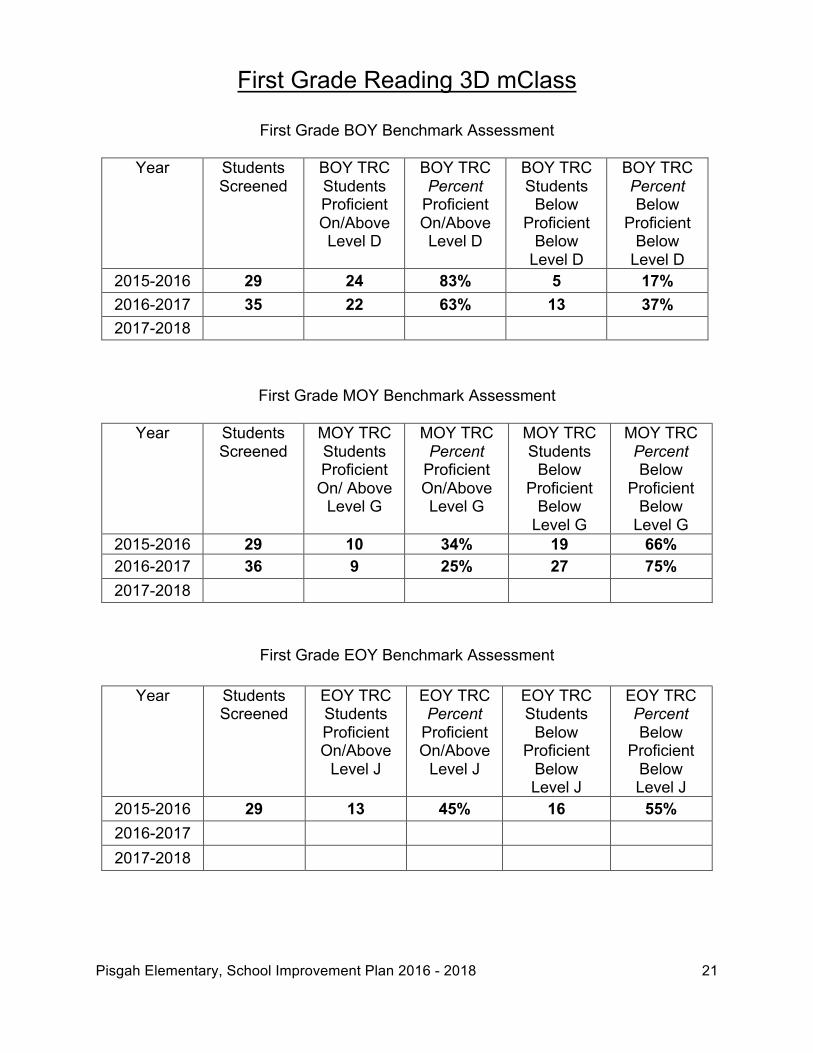
First Grade Reading 3D mClass
First Grade BOY Benchmark Assessment
Year Students Screened
BOY TRC Students Proficient On/Above Level D
BOY TRC Percent
Proficient On/Above Level D
BOY TRC Students
Below Proficient
Below Level D
BOY TRC Percent Below
Proficient Below
Level D 2015-2016 29 24 83% 5 17% 2016-2017 35 22 63% 13 37% 2017-2018
First Grade MOY Benchmark Assessment
Year Students Screened
MOY TRC Students Proficient
On/ Above Level G
MOY TRC Percent
Proficient On/Above Level G
MOY TRC Students
Below Proficient
Below Level G
MOY TRC Percent Below
Proficient Below
Level G 2015-2016 29 10 34% 19 66% 2016-2017 36 9 25% 27 75% 2017-2018
First Grade EOY Benchmark Assessment
Year Students Screened
EOY TRC Students Proficient On/Above
Level J
EOY TRC Percent
Proficient On/Above
Level J
EOY TRC Students
Below Proficient
Below Level J
EOY TRC Percent Below
Proficient Below Level J
2015-2016 29 13 45% 16 55% 2016-2017 2017-2018
Pisgah Elementary, School Improvement Plan 2016 - 2018 22
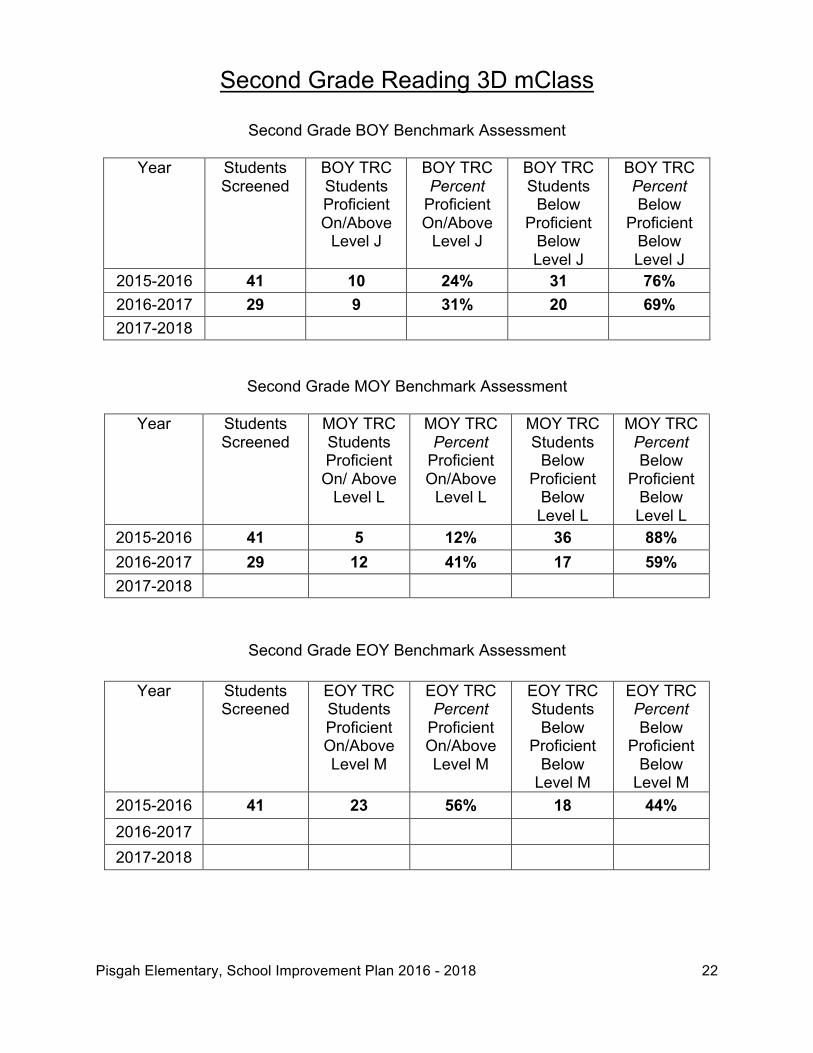
Second Grade Reading 3D mClass
Second Grade BOY Benchmark Assessment
Year Students Screened
BOY TRC Students Proficient On/Above
Level J
BOY TRC Percent
Proficient On/Above
Level J
BOY TRC Students
Below Proficient
Below Level J
BOY TRC Percent Below
Proficient Below Level J
2015-2016 41 10 24% 31 76% 2016-2017 29 9 31% 20 69% 2017-2018
Second Grade MOY Benchmark Assessment
Year Students Screened
MOY TRC Students Proficient
On/ Above Level L
MOY TRC Percent
Proficient On/Above
Level L
MOY TRC Students
Below Proficient
Below Level L
MOY TRC Percent Below
Proficient Below Level L
2015-2016 41 5 12% 36 88% 2016-2017 29 12 41% 17 59% 2017-2018
Second Grade EOY Benchmark Assessment
Year Students Screened
EOY TRC Students Proficient On/Above Level M
EOY TRC Percent
Proficient On/Above Level M
EOY TRC Students
Below Proficient
Below Level M
EOY TRC Percent Below
Proficient Below
Level M 2015-2016 41 23 56% 18 44% 2016-2017 2017-2018
Pisgah Elementary, School Improvement Plan 2016 - 2018 23
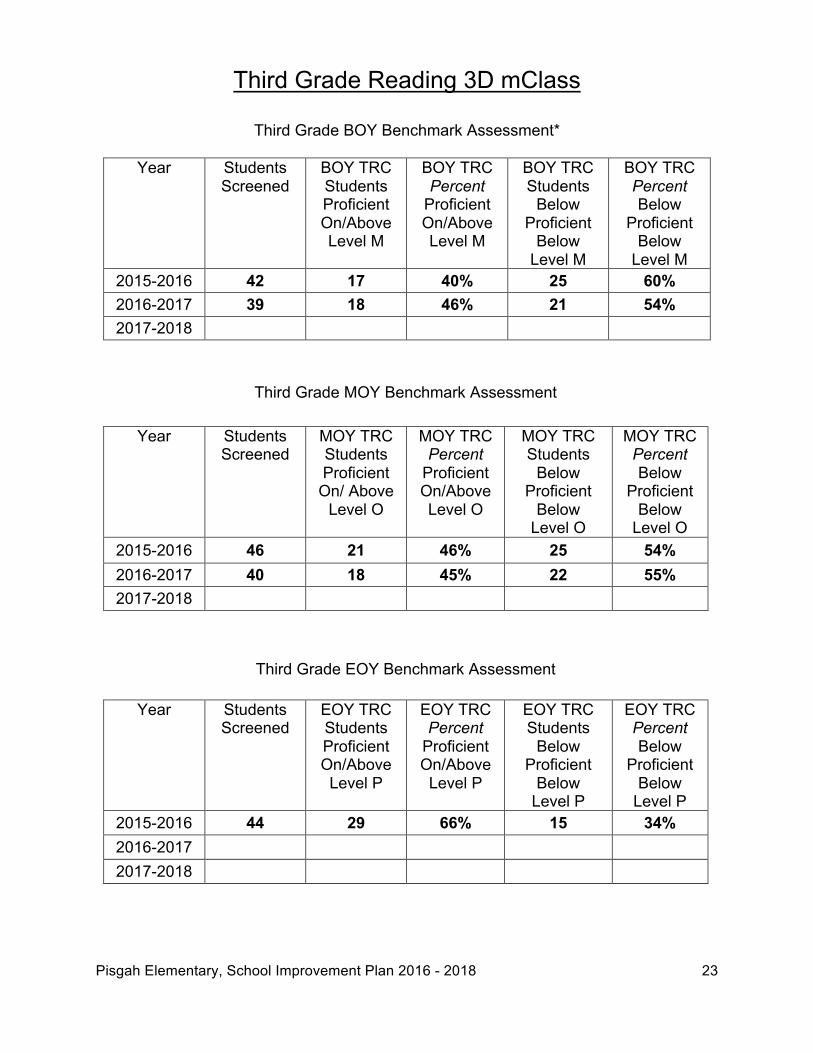
Third Grade Reading 3D mClass
Third Grade BOY Benchmark Assessment*
Year Students Screened
BOY TRC Students Proficient On/Above Level M
BOY TRC Percent
Proficient On/Above Level M
BOY TRC Students
Below Proficient
Below Level M
BOY TRC Percent Below
Proficient Below
Level M 2015-2016 42 17 40% 25 60% 2016-2017 39 18 46% 21 54% 2017-2018
Third Grade MOY Benchmark Assessment
Year Students Screened
MOY TRC Students Proficient
On/ Above Level O
MOY TRC Percent
Proficient On/Above Level O
MOY TRC Students
Below Proficient
Below Level O
MOY TRC Percent Below
Proficient Below
Level O 2015-2016 46 21 46% 25 54% 2016-2017 40 18 45% 22 55% 2017-2018
Third Grade EOY Benchmark Assessment
Year Students Screened
EOY TRC Students Proficient On/Above Level P
EOY TRC Percent
Proficient On/Above Level P
EOY TRC Students
Below Proficient
Below Level P
EOY TRC Percent Below
Proficient Below
Level P 2015-2016 44 29 66% 15 34% 2016-2017 2017-2018
Pisgah Elementary, School Improvement Plan 2016 - 2018 24
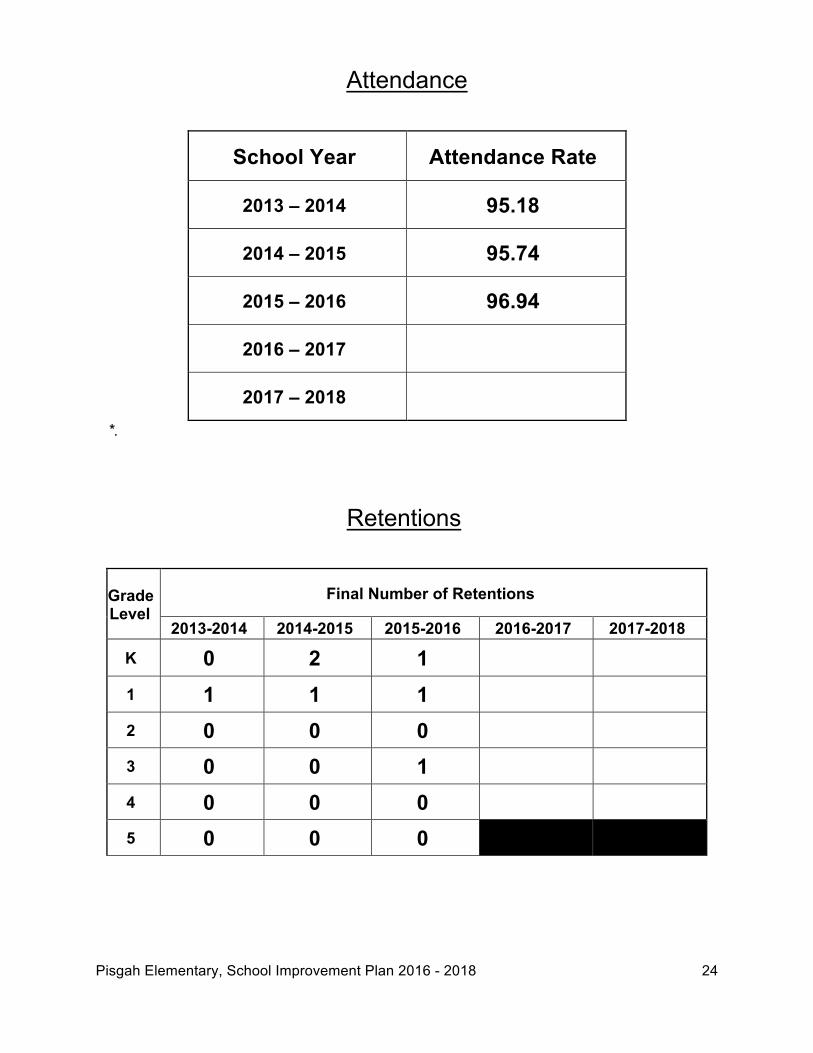
Attendance
School Year Attendance Rate
2013 – 2014 95.18
2014 – 2015 95.74
2015 – 2016 96.94
2016 – 2017
2017 – 2018 *.
Retentions
Grade Level
Final Number of Retentions
2013-2014 2014-2015 2015-2016 2016-2017 2017-2018
K 0 2 1 1 1 1 1 2 0 0 0 3 0 0 1 4 0 0 0 5 0 0 0
Pisgah Elementary, School Improvement Plan 2016 - 2018 25
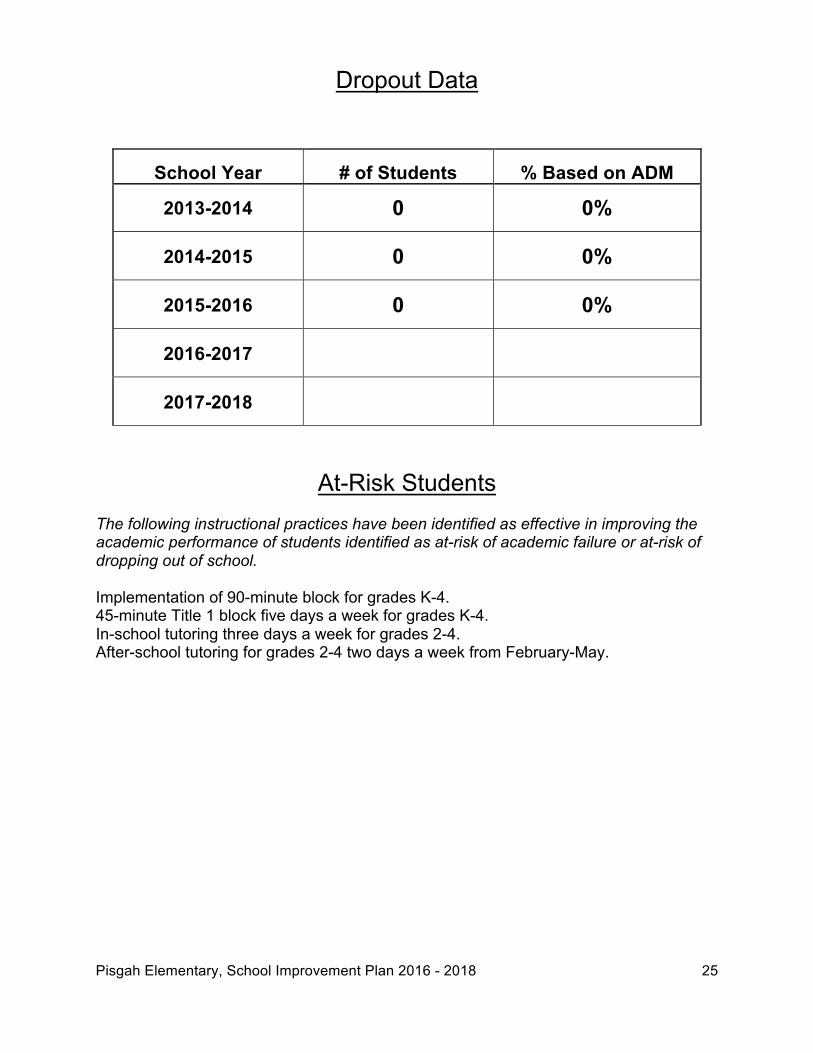
Dropout Data
School Year # of Students % Based on ADM
2013-2014 0 0%
2014-2015 0 0%
2015-2016 0 0%
2016-2017
2017-2018
At-Risk Students The following instructional practices have been identified as effective in improving the academic performance of students identified as at-risk of academic failure or at-risk of dropping out of school. Implementation of 90-minute block for grades K-4. 45-minute Title 1 block five days a week for grades K-4. In-school tutoring three days a week for grades 2-4. After-school tutoring for grades 2-4 two days a week from February-May.
Pisgah Elementary, School Improvement Plan 2016 - 2018 26
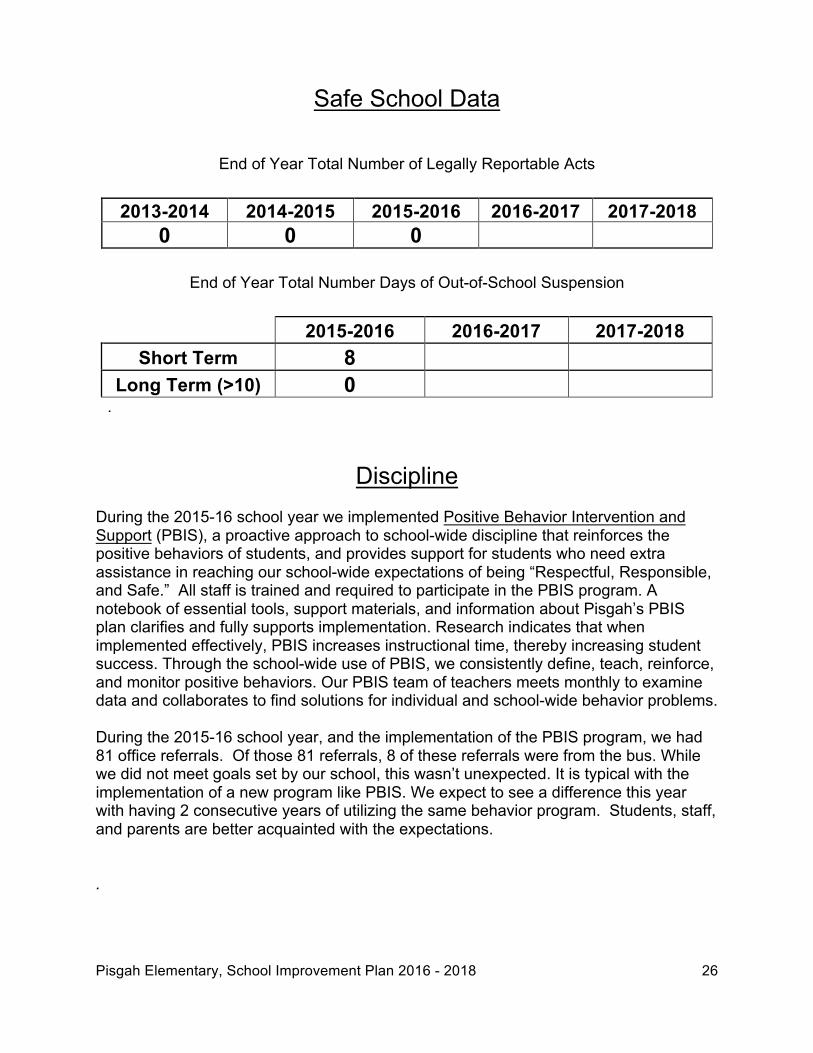
Safe School Data
End of Year Total Number of Legally Reportable Acts
2013-2014 2014-2015 2015-2016 2016-2017 2017-2018 0 0 0
End of Year Total Number Days of Out-of-School Suspension
2015-2016 2016-2017 2017-2018
Short Term 8 Long Term (>10) 0
.
Discipline During the 2015-16 school year we implemented Positive Behavior Intervention and Support (PBIS), a proactive approach to school-wide discipline that reinforces the positive behaviors of students, and provides support for students who need extra assistance in reaching our school-wide expectations of being “Respectful, Responsible, and Safe.” All staff is trained and required to participate in the PBIS program. A notebook of essential tools, support materials, and information about Pisgah’s PBIS plan clarifies and fully supports implementation. Research indicates that when implemented effectively, PBIS increases instructional time, thereby increasing student success. Through the school-wide use of PBIS, we consistently define, teach, reinforce, and monitor positive behaviors. Our PBIS team of teachers meets monthly to examine data and collaborates to find solutions for individual and school-wide behavior problems. During the 2015-16 school year, and the implementation of the PBIS program, we had 81 office referrals. Of those 81 referrals, 8 of these referrals were from the bus. While we did not meet goals set by our school, this wasn’t unexpected. It is typical with the implementation of a new program like PBIS. We expect to see a difference this year with having 2 consecutive years of utilizing the same behavior program. Students, staff, and parents are better acquainted with the expectations.
.
Pisgah Elementary, School Improvement Plan 2016 - 2018 27
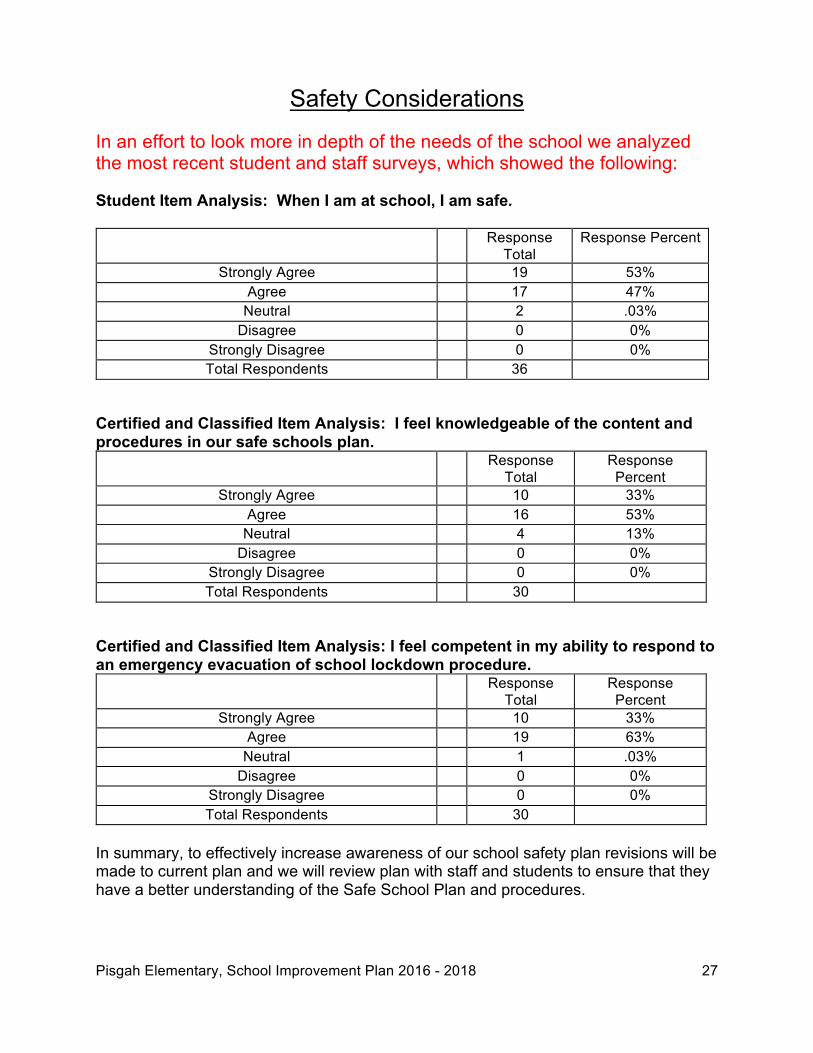
Safety Considerations
In an effort to look more in depth of the needs of the school we analyzed the most recent student and staff surveys, which showed the following: Student Item Analysis: When I am at school, I am safe.
Response Total
Response Percent
Strongly Agree 19 53% Agree 17 47%
Neutral 2 .03% Disagree 0 0%
Strongly Disagree 0 0% Total Respondents 36
Certified and Classified Item Analysis: I feel knowledgeable of the content and procedures in our safe schools plan.
Response Total
Response Percent
Strongly Agree 10 33% Agree 16 53%
Neutral 4 13% Disagree 0 0%
Strongly Disagree 0 0% Total Respondents 30
Certified and Classified Item Analysis: I feel competent in my ability to respond to an emergency evacuation of school lockdown procedure.
Response Total
Response Percent
Strongly Agree 10 33% Agree 19 63%
Neutral 1 .03% Disagree 0 0%
Strongly Disagree 0 0% Total Respondents 30
In summary, to effectively increase awareness of our school safety plan revisions will be made to current plan and we will review plan with staff and students to ensure that they have a better understanding of the Safe School Plan and procedures.
Pisgah Elementary, School Improvement Plan 2016 - 2018 28
Incident Response – As per GS 115C-105.27(c1), specific information on incident response is not included in the school improvement plan; however, each Buncombe County School has a crisis response plan. The principal has communicated this plan to the staff and students as appropriate. Further, this plan has been approved by the Buncombe County Board of Education and is on file in the Assistant Superintendent’s Office.
Pisgah Elementary, School Improvement Plan 2016 - 2018 29
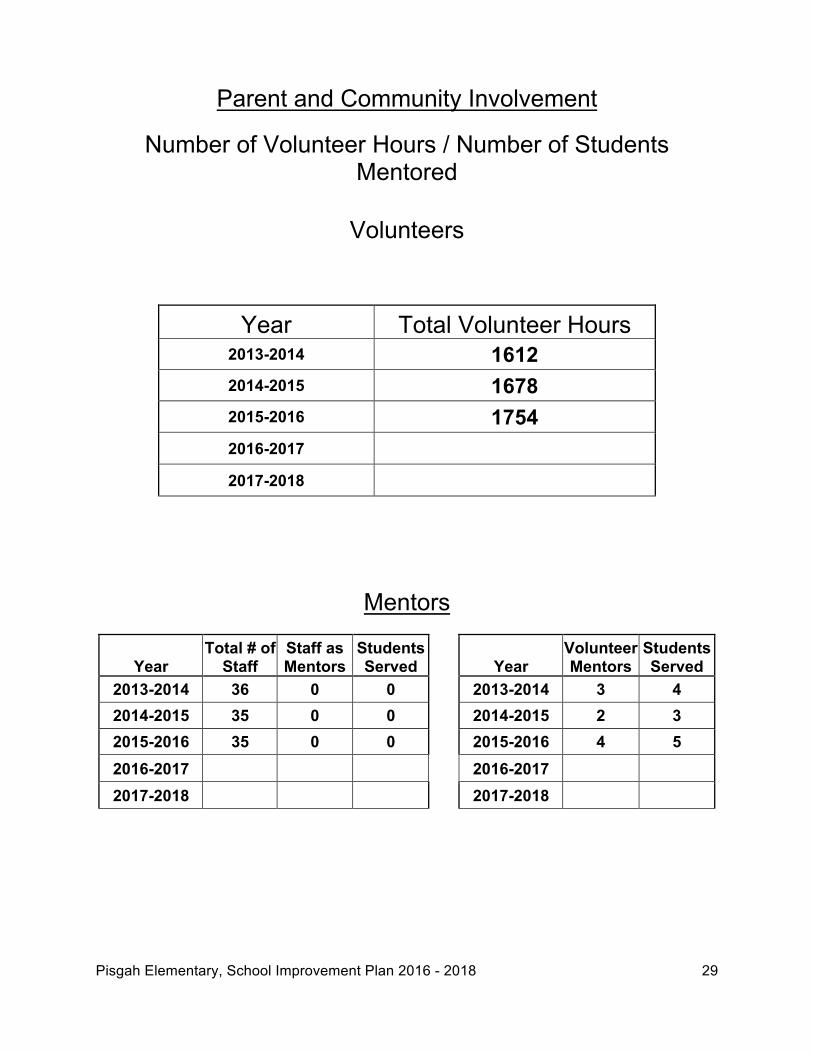
Parent and Community Involvement
Number of Volunteer Hours / Number of Students
Mentored
Volunteers
Year Total Volunteer Hours 2013-2014 1612 2014-2015 1678 2015-2016 1754 2016-2017 2017-2018
Mentors
Year Total # of
Staff Staff as Mentors
Students Served Year
Volunteer Mentors
Students Served
2013-2014 36 0 0 2013-2014 3 4 2014-2015 35 0 0 2014-2015 2 3 2015-2016 35 0 0 2015-2016 4 5 2016-2017 2016-2017 2017-2018 2017-2018
Pisgah Elementary, School Improvement Plan 2016 - 2018 30
Teacher Time Duty-Free Lunch – The School Improvement Team voted and decided to implement Duty Free Lunch for staff. A schedule was created using support staff and assistants to provide supervision. The schedule was designed so that no instructional time was comprised for teacher assistants.
Duty-Free Instructional Planning – Kindergarten through fourth grade staff will have 50 minutes, four days a week during the instructional day for planning and PLC’s. All teachers will have one hour of planning after school three to four days a week. Efficient Reporting – Teachers have access to electronic reporting for attendance, lunch count, PBIS, grading, staff evaluations, and all parent/staff/students surveys, minimizing redundancies and streamlining data. Students have access to online surveys and results, as well as the Parent Portal, in which families can review student grades and attendance. This information can be accessed through the use of PowerSchool, Google Docs, Buncombe County Moodle, and/or school created data collection sites.
Pisgah Elementary School, School Improvement Plan 2016 - 2018 31
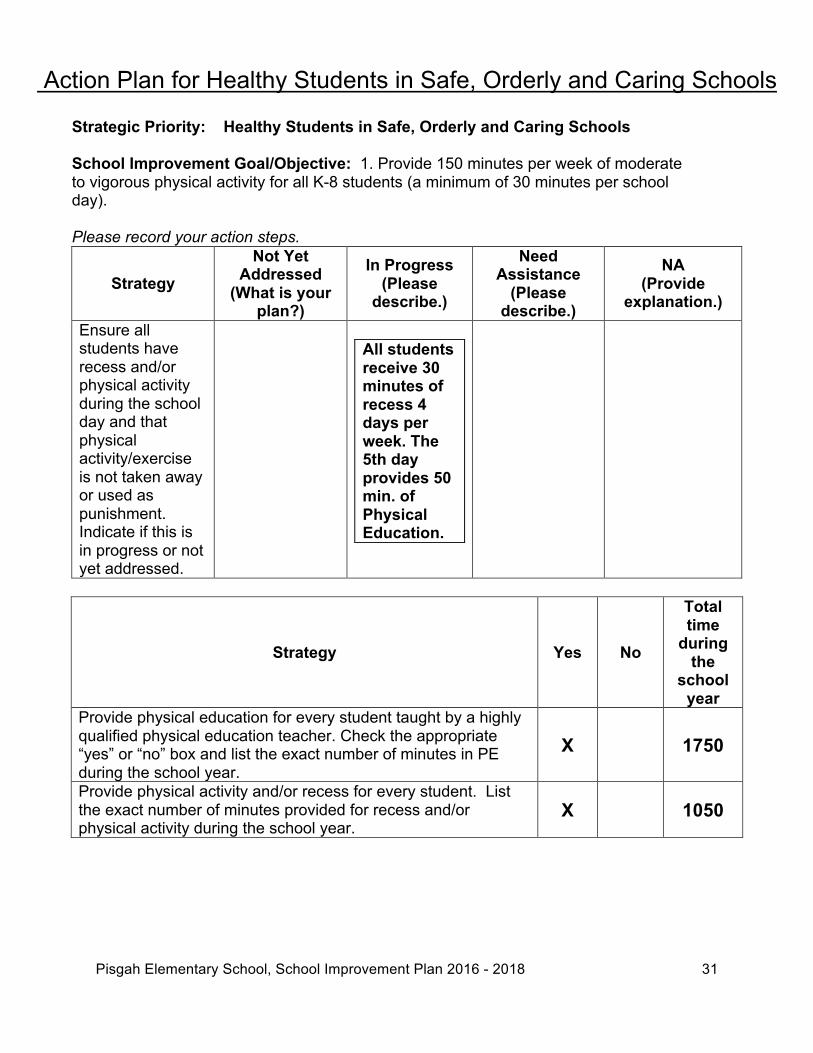
Action Plan for Healthy Students in Safe, Orderly and Caring Schools
Strategic Priority: Healthy Students in Safe, Orderly and Caring Schools School Improvement Goal/Objective: 1. Provide 150 minutes per week of moderate to vigorous physical activity for all K-8 students (a minimum of 30 minutes per school day). Please record your action steps.
Strategy Not Yet
Addressed (What is your
plan?)
In Progress (Please
describe.)
Need Assistance
(Please describe.)
NA (Provide
explanation.) Ensure all students have recess and/or physical activity during the school day and that physical activity/exercise is not taken away or used as punishment. Indicate if this is in progress or not yet addressed.
All students receive 30 minutes of recess 4 days per week. The 5th day provides 50 min. of Physical Education.
Strategy Yes No
Total time
during the
school year
Provide physical education for every student taught by a highly qualified physical education teacher. Check the appropriate “yes” or “no” box and list the exact number of minutes in PE during the school year.
X 1750
Provide physical activity and/or recess for every student. List the exact number of minutes provided for recess and/or physical activity during the school year.
X 1050
Pisgah Elementary School, School Improvement Plan 2016 - 2018 32
Mid-Year Progress Report School Year: Pisgah Elementary School Please list each current SIP Goal/Objective and provide a brief description of progress to date. Please modify this form as necessary to complete the Mid-Year Reflection. SMART Goal 1: Progress to Date: SMART Goal 2: Progress to Date: SMART Goal 3: Progress to Date: SMART Goal 4: Progress to Date: SMART Goal 5: Progress to Date: Signatures below indicate the School Improvement Team has participated in the development of the School Improvement Plan Mid-Year Reflection as submitted. Principal SIT Chairperson Signature: Signature: Signature: Signature: Signature: Signature: Signature: Signature:
Pisgah Elementary, School Improvement Plan 2016 - 2018 33
Signature: Signature: Signature: ___________________________ Signature: ___________________________ Signature: ___________________________ Signature: ___________________________ Signature: Signature: Signature: Signature: Signature: Signature: Signature: Signature: Signature: ____________________________ Signature: __________________________ Signature: ____________________________ Signature: __________________________ Signature: ___________________________ Signature: __________________________ Signature: ___________________________ Signature: __________________________ Signature: ___________________________ Signature: __________________________
Pisgah Elementary, School Improvement Plan 2016 - 2018 34
Year-End Progress Report
School Year: Pisgah Elementary School How did your school’s Purpose, Direction and Belief Statements guide your actions throughout the school year?
Respond to the following for each Goal/Objective in your School Improvement Plan. Use additional sheets as necessary. SMART Goal 1: Major Accomplishments: SMART Goal 2: Major Accomplishments: SMART Goal 3: Major Accomplishments: SMART Goal 4: Major Accomplishments: SMART Goal 5: Major Accomplishments:
Pisgah Elementary, School Improvement Plan 2016 - 2018 35
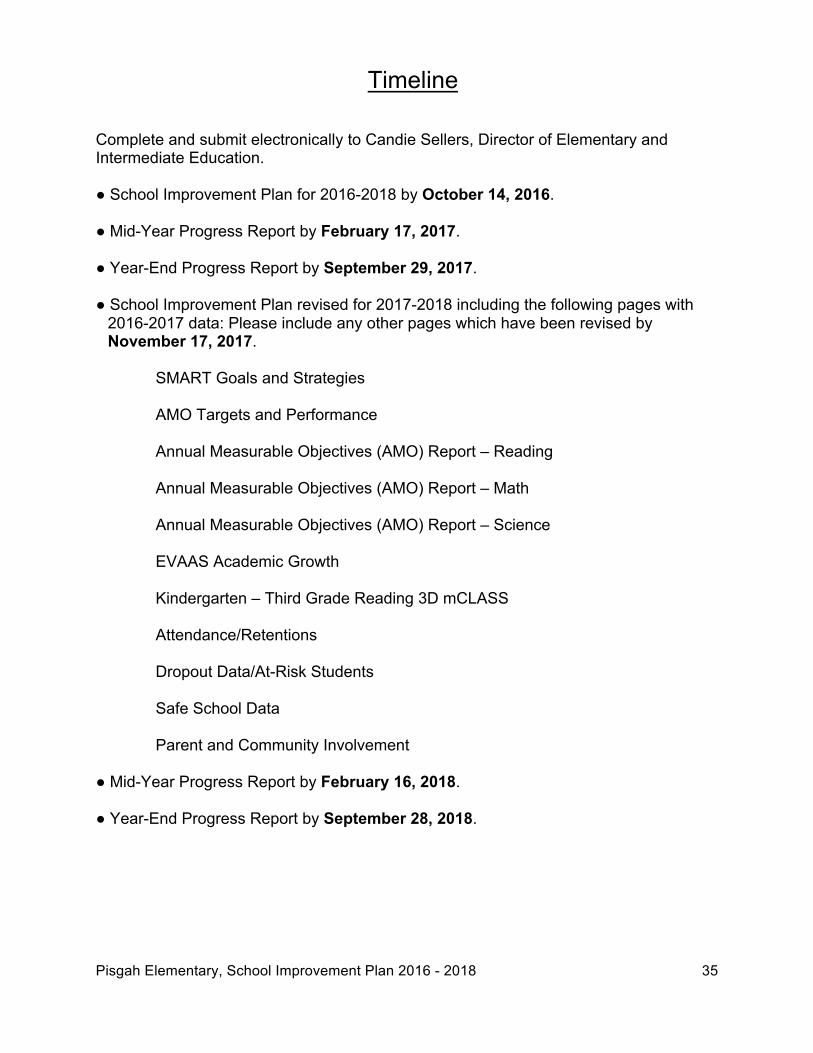
Timeline Complete and submit electronically to Candie Sellers, Director of Elementary and Intermediate Education. ● School Improvement Plan for 2016-2018 by October 14, 2016. ● Mid-Year Progress Report by February 17, 2017. ● Year-End Progress Report by September 29, 2017. ● School Improvement Plan revised for 2017-2018 including the following pages with
2016-2017 data: Please include any other pages which have been revised by November 17, 2017.
SMART Goals and Strategies
AMO Targets and Performance Annual Measurable Objectives (AMO) Report – Reading Annual Measurable Objectives (AMO) Report – Math Annual Measurable Objectives (AMO) Report – Science EVAAS Academic Growth Kindergarten – Third Grade Reading 3D mCLASS Attendance/Retentions
Dropout Data/At-Risk Students Safe School Data Parent and Community Involvement
● Mid-Year Progress Report by February 16, 2018. ● Year-End Progress Report by September 28, 2018.