Embed Size (px)
Citation preview

October 2011
T H E U S E O F F I N A N C I A L D E R I V A T I V E S I N L A T I N A M E R I C A
S T
R I C
T L
Y
P R
I V
A T
E
A N
D
C O
N F
I D
E N
T I A
L
Etienne Lacroix
(1) 212 – 834 - 2260
Introduction
This presentation will attempt to illustrate the evolution of the usage of financial derivatives in global markets and in select
Latin American countries (when data is available)
Given that they represent the majority of the traded volume globally, we will concentrate in three of the most active
derivatives markets: FX, Interest Rates, and Commodities.
We will delve into what are the reasons driving companies and countries to enter into financial derivative transactions and
what the evolution in the use of Financial Derivatives has been in the region
We will conclude by outlining our prognostics with regards to the future of the industry and our opinions on possible
developments
1 T H
E
U S
E
O F
F
I N
A N
C I A
L
D E
R I V
A T
I V
E S
I N
L
A T
I N
A
M E
R I C
A

Agenda
2
Derivatives - What Are We Talking About ?
2
The Use of Financial Derivatives 5
Implementing Risk Management Policy 21
Annex A: Basic Derivative Product Descriptions 31
Annex B: JPM Commodity Capabilities 36
T H
E
U S
E
O F
F
I N
A N
C I A
L
D E
R I V
A T
I V
E S
I N
L
A T
I N
A
M E
R I C
A
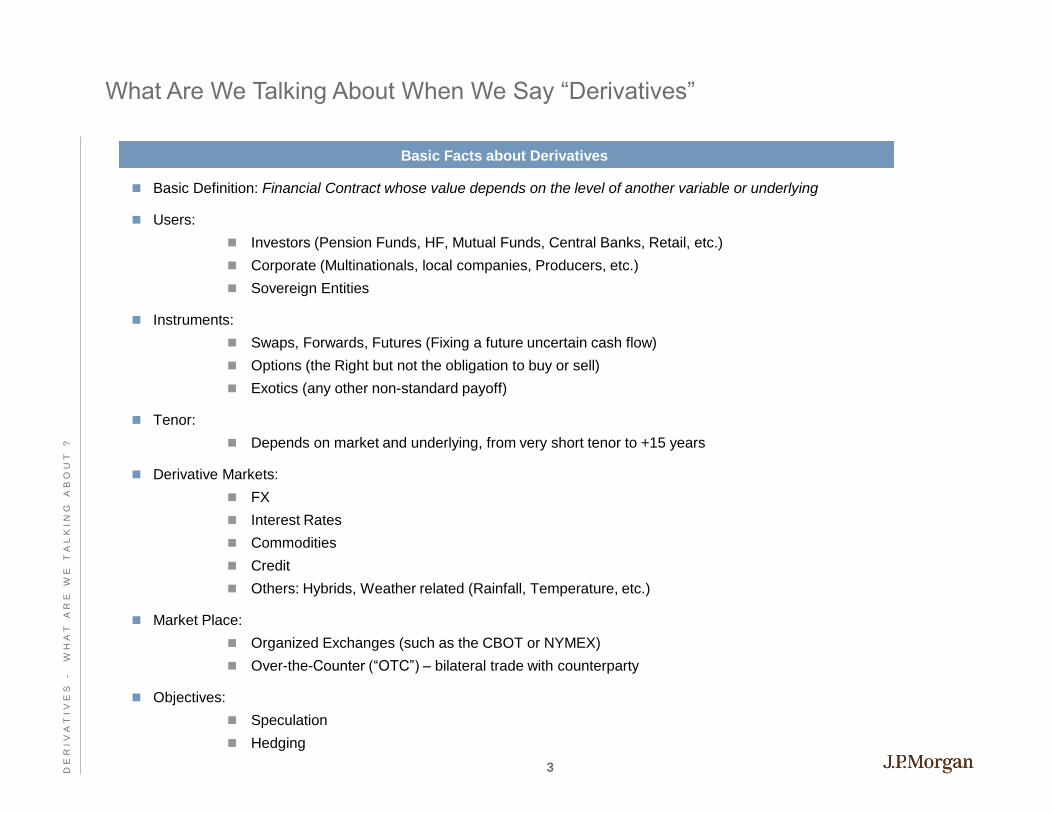
What Are We Talking About When We Say “Derivatives”
Basic Facts about Derivatives
Basic Definition: Financial Contract whose value depends on the level of another variable or underlying
Users:
Investors (Pension Funds, HF, Mutual Funds, Central Banks, Retail, etc.)
Corporate (Multinationals, local companies, Producers, etc.)
Sovereign Entities
Instruments:
Swaps, Forwards, Futures (Fixing a future uncertain cash flow)
Options (the Right but not the obligation to buy or sell)
Exotics (any other non-standard payoff)
Tenor:
Depends on market and underlying, from very short tenor to +15 years
Derivative Markets:
FX
Interest Rates
Commodities
Credit
Others: Hybrids, Weather related (Rainfall, Temperature, etc.)
Market Place:
Organized Exchanges (such as the CBOT or NYMEX)
Over-the-Counter (“OTC”) – bilateral trade with counterparty
Objectives:
Speculation
Hedging
3 D E
R I V
A T
I V
E S
-
W H
A T
A
R E
W
E
T A
L K
I N
G
A B
O U
T ?

Basic Overview of Financial Derivatives
Fixing Future Cash Flows through Futures, Forwards or Swaps
Futures, Swaps and Forwards are financial contracts that allow the user to fix an uncertain future cash flow
Why uncertain ? Because the future price level is not known yet and will depend on many unforeseeable factors. Examples:
Libor rate in 180 days or in 5.2 years
Imports on March 20 2012, denominated in EUR or JOY
Copper exports to happen during 2H12
10 Year Treasury Level relevant for a new bond issuance in 2 months time
By using Forwards or Swaps these future uncertain cash flows can be “fixed”, thus fully known in advance
Benefits vs. Risks:
Price Certainty versus Opportunity Cost
Other risks:
Legal risks
Operational risk (execution, transfers, etc)
Counterparty risk, etc. (bankruptcy of counterparty)
Financial Options
In contrast to Swaps (or Forwards), options provide an asymmetric payoff (downside and upside are not similar)
For the right to participate in a certain price movement, the buyer has to pay a premium in order to avoid being exposed to
the opposite price movement
By combining different option types (Calls, Puts) different profiles could be obtained, depending on needs, views, etc.
Exotics (non-standard payoffs very common)
4 D E
R I V
A T
I V
E S
-
W H
A T
A
R E
W
E
T A
L K
I N
G
A B
O U
T ?

Agenda
5
The Use of Financial Derivatives
5
Derivatives - What Are We Talking About ? 2
Implementing Risk Management Policy 21
Annex A: Basic Derivative Product Descriptions 31
Annex B: JPM Commodity Capabilities 36
T H
E
U S
E
O F
F
I N
A N
C I A
L
D E
R I V
A T
I V
E S
I N
L
A T
I N
A
M E
R I C
A

Derivative Use across Sectors is Very High for Fortune 500 Companies Worldwide
Source: ISDA News Release April 23, 2009
6 T H
E
U S
E
O F
F
I N
A N
C I A
L
D E
R I V
A T
I V
E S

Firms are Increasingly Using Derivatives Markets to Hedge Financial Risks
Commentary
Source: 2009 ISDA survey for Global Fortune 500 companies
Current usage of derivatives
Do not use
derivatives
6%
Use derivatives
94%
Historically, a significant number of large companies have
been utilizing financial instruments for risk management
purposes
Based on an ISDA survey conducted in 2009, 94% of
top large companies currently use derivatives (up from
92% in 2003)
Over the course of the last 5 years, the total outstanding
notional amount has increased significantly
Mix from swaps to options has increased of late with a
drop in option volatility
85% 84%
96%
72%
86% 85%92%
88%
70%
81%
94%
80%86%
75%
86%92%
79%
39%
63%
8%
37% 35%
15%
83%
Basic materials Consumer goods Financial Healthcare Industrial goods Services Technology Utilities
% Using FX % Using interest rate % Using commodity
Source: ISDA news release published on April 23, 2009
Current derivative usage by the world’s largest companies
7 T H
E
U S
E
O F
F
I N
A N
C I A
L
D E
R I V
A T
I V
E S

Peer Max Tenor Disclosed Commodities Exposures Hedged
Barrick 60 months Interest Rate Swaps, FX Forwards (AUD, CAD, CLP, EUR, PGK), Base Metals Zero Cost Options Collars
(Copper), Energy Swaps (Diesel, Propane, Natural Gas, Electricity)
Goldcorp 6-12 months FX Forwards & Options (CAD, MXN), Base Metals Swaps & Zero Cost Options Collars (Copper, Zinc, Lead),
Energy Swaps (Heating Oil)
Newmont 60 months FX Forwards (AUD, NZD, IDR), Energy Swaps (Diesel), Interest Rate Swaps
Kinross 36 months Precious Metals Forwards & Options (Gold, Silver), FX Forwards (BRL, CLP, RUB, CAD, EUR), Energy
Swaps (Crude Oil)
Agnico-Eagle 12 months FX Forwards (CAD), Base Metals Zero Cost Options Collars (Zinc)
IAMGOLD 36 months Precious Metals Zero Cost Options Collars (Gold), FX Options & Forwards (CAD, EUR), Energy Options and
Swaps (Heating Oil), Base Metals Options (Aluminum)
Hecla Mining 36 months Base Metals Swaps (Zinc, Lead)
Jaguar Mining 6 months FX Forwards (BRL), Precious Metals Zero Cost Options Collars (Gold)
Capstone
Mining
48 months Base Metals Swaps (Copper, Lead, Zinc)
Breakwater
Resources
12 months Base Metals Options (Copper, Lead, Zinc), Precious Metals Options (Gold, Silver)
Century
Aluminum
12 months Energy Swaps (Natural Gas), Base Metals Swaps & Zero Cost Options Collars (Aluminum)
Alpha Natural
Resources
12 months Energy Swaps & Options (Diesel, Natural Gas), Interest Rate Swaps
Disclosed Hedging of North American Mining Companies
Disclosed Hedging of North American Mining Companies
Sources: Third Quarter 2010 Financial Reports of each company 8 T
H E
U
S E
O
F
F I N
A N
C I A
L
D E
R I V
A T
I V
E S

Size of Foreign Exchange (FX) OTC Derivatives Market Worldwide Continuous to Grow
BIS 2010 Data
In the past 10 years the global OTC FX market has more than doubled.
While the Spot and Swaps markets still represent the bulk of the trading volume, there has been a significant increase in the
Options and Forwards markets as well.
Swaps volume has been greater than spot volume every year for the past 12 years, showing how the usage of derivatives is
becoming a central part of business transactions and gaining traction as a solution to mitigate risk exposure.
Now, let’s compare how Latin American markets are tracking the rest of the world…
1998 2001 2004 2007 2010
Spot 568 386 631 1,005 1,490
Forwards 128 130 209 362 475
FX Swaps 744 663 975 1,745 1,808
Options 87 60 119 212 207
Total 1,527 1,239 1,934 3,324 3,980
Source:BIS 2010
OTC FX Markets Worldwide (Billions US$/Day)
9 T H
E
U S
E
O F
F
I N
A N
C I A
L
D E
R I V
A T
I V
E S

ISDA Shows Granular Impact of Past Crisis in the Derivative Use, by Category
Source: ISDA Market Survey 2010
10 T H
E
U S
E
O F
F
I N
A N
C I A
L
D E
R I V
A T
I V
E S

Where are FX Derivatives Traded?
For financial derivatives, transaction costs tend to lower when volume increases, this in turn further increases the traded
volume for that asset, creating a virtuous cycle of volume and liquidity.
As Latin America has historically not been a center for financial derivative transactions, it has failed to gain traction as a
mayor powerhouse in total volume traded.
As it can be observed in the pie chart below, geographical areas with far lesser economic size (e.g. Australia, Switzerland
and Hong Kong) have significant higher proportions of FX turnover than Latin America.
11 T H
E
U S
E
O F
F
I N
A N
C I A
L
D E
R I V
A T
I V
E S

Global Interest Rate Derivatives Use by Instrument Shows Strong Preference to
Swaps
Source: BIS, Triennial Central Bank Survey, April 2010
12 T H
E
U S
E
O F
F
I N
A N
C I A
L
D E
R I V
A T
I V
E S

The Use of Derivatives has Increased Rapidly in the Last 15 years: Summary
14 T H
E
U S
E
O F
F
I N
A N
C I A
L
D E
R I V
A T
I V
E S

The Use of Derivatives has Increased Rapidly in the Last 15 years: Summary
15 T H
E
U S
E
O F
F
I N
A N
C I A
L
D E
R I V
A T
I V
E S

ISDA 2010 End User Survey Shows Strong Use of FX, Interest Rate and Commodities
During July and August 2010, ISDA conducted a survey of over-the-counter (OTC) derivatives end-users, including non-
financial corporations, asset managers and other financial institutions295 respondents from North America and Europe who use
OTC derivatives participated in the survey. Of these:80% or 234 used interest rate swaps (IRS)
59% or 174 used currency/FX swaps,
27% or 80 used credit default swaps (CDS),
25% or 74 used equity swaps and
32% or 94 used commodity/energy swaps.
Respondents were asked their opinions only on those OTC derivatives that they said they have used
On a 1 to 5 scale, 62% rate IRS price competitiveness at a 4 or 5
Only 10% of IRS end-users rate it at a 1 or 2
Electronic Trading: A majority of those surveyed (77%) believe electronic trading of IRS is beneficial
The majority of surveyed IRS end-users give high remarks to the current level of pre-trade price transparency
71% of IRS end-users rank it same as or better than FX. 69% rank it same as or better than equities. 83% rank it equal to or
better than corporate bonds. 87% rank it same as or better than ABS
Source: ISDA End-User Survey: Interest Rate Swaps, October 2010
13 T H
E
U S
E
O F
F
I N
A N
C I A
L
D E
R I V
A T
I V
E S

Size of OTC Derivatives in Latin America
Latin American derivatives markets have almost tripled in size in the past 12 years…
… but they still represent less than 1% of the global market for derivatives
In fact, Latin America share of the world’s transactions hasn’t changed significantly in the last 12 years.
FX Rates Total
1998 2001 2004 2007 2010 1998 2001 2004 2007 2010 1998 2001 2004 2007 2010
Argentina 2.2 0.0 0.7 1.1 1.6 0.0 0.0 0.0 0.0 0.0 2.2 0.0 0.7 1.1 1.6
Brazil 5.1 5.5 3.8 5.8 14.2 0.0 0.3 0.9 0.1 7.5 5.1 5.8 4.7 5.9 21.7
Chile 1.3 2.3 2.5 4.0 5.5 0.0 0.0 0.0 0.0 0.2 1.3 2.3 2.5 4.0 5.7
Colombia 0.0 0.4 0.8 1.9 2.8 0.0 0.0 0.0 0.0 0.0 0.0 0.4 0.8 1.9 2.8
Mexico 8.7 8.6 15.3 15.3 17.0 0.2 0.4 1.4 2.9 1.4 8.9 9.0 16.7 18.2 18.4
Peru 0.0 0.2 0.3 0.8 1.4 0.0 0.0 0.0 0.0 0.0 0.0 0.2 0.3 0.8 1.4
Total Latam 17.3 17.0 23.4 28.9 42.5 0.2 0.7 2.3 3.0 9.1 17.5 17.7 25.7 31.9 51.6
Total World 2,099 1,692 2,609 4,281 5,056 344 676 1,331 2,173 2,698 2,443 2,368 3,940 6,454 7,754
Source:BIS 2010
OTC Derivatives Markets in Latin America (Billions US$/Day)
16 T H
E
U S
E
O F
F
I N
A N
C I A
L
D E
R I V
A T
I V
E S

Mexico FX Market by Product
Source:BIS 2010
Mexican OTC FX Market
17 T H
E
U S
E
O F
F
I N
A N
C I A
L
D E
R I V
A T
I V
E S

Colombia FX Market
Source:BIS 2010
Colombia OTC FX Market by Product Colombia OTC FX Market por plazo
18 T H
E
U S
E
O F
F
I N
A N
C I A
L
D E
R I V
A T
I V
E S

Chile: Policy Makers Have Expressed Continuous Interest in the Development of
Local Derivative Markets
Source: IMF Working paper
19 T H
E
U S
E
O F
F
I N
A N
C I A
L
D E
R I V
A T
I V
E S

Macro Hedging on Country Level has Experienced Particular Interest During the
Last Decade in Latin America
20 T H
E
U S
E
O F
F
I N
A N
C I A
L
D E
R I V
A T
I V
E S

Agenda
21
Implementing Risk Management Policy
21
Derivatives - What Are We Talking About ? 2
The Use of Financial Derivatives 5
Annex A: Basic Derivative Product Descriptions 31
Annex B: JPM Commodity Capabilities 36
T H
E
U S
E
O F
F
I N
A N
C I A
L
D E
R I V
A T
I V
E S
I N
L
A T
I N
A
M E
R I C
A
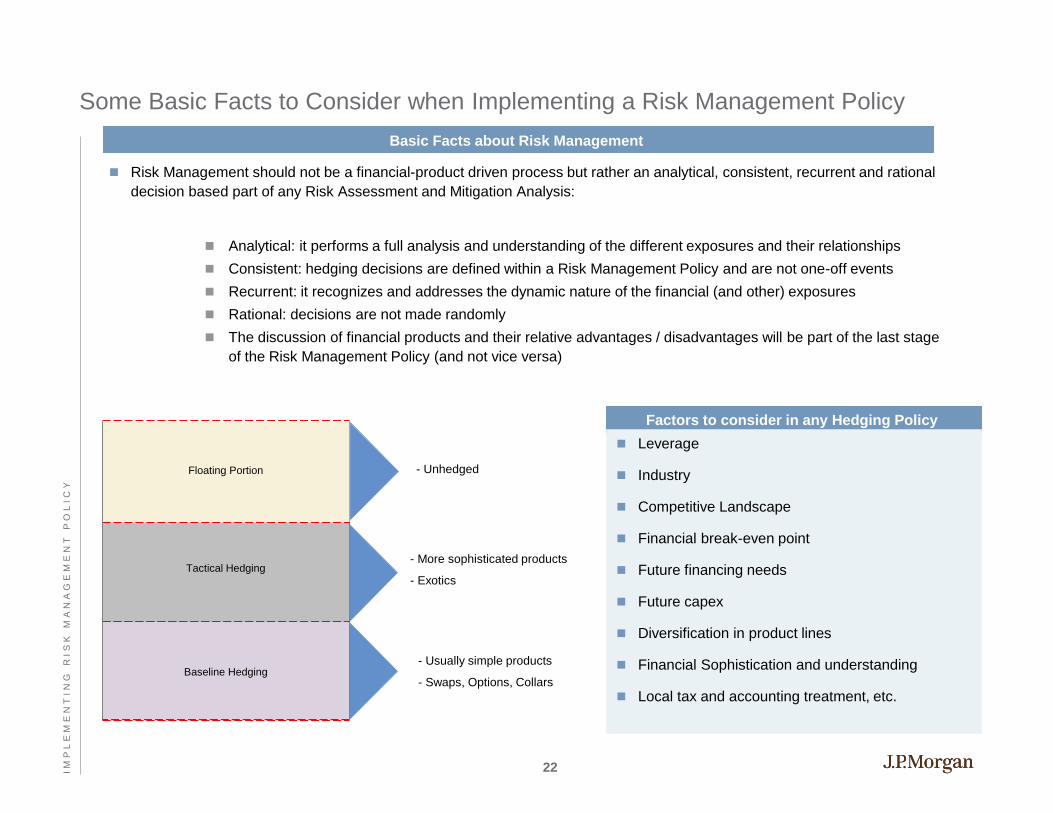
Some Basic Facts to Consider when Implementing a Risk Management Policy
Risk Management should not be a financial-product driven process but rather an analytical, consistent, recurrent and rational
decision based part of any Risk Assessment and Mitigation Analysis:
Analytical: it performs a full analysis and understanding of the different exposures and their relationships
Consistent: hedging decisions are defined within a Risk Management Policy and are not one-off events
Recurrent: it recognizes and addresses the dynamic nature of the financial (and other) exposures
Rational: decisions are not made randomly
The discussion of financial products and their relative advantages / disadvantages will be part of the last stage
of the Risk Management Policy (and not vice versa)
Tactical Hedging
Baseline Hedging
Floating Portion Floating Portion - Unhedged
- More sophisticated products
- Exotics
- Usually simple products
- Swaps, Options, Collars
Basic Facts about Risk Management
Factors to consider in any Hedging Policy
Leverage
Industry
Competitive Landscape
Financial break-even point
Future financing needs
Future capex
Diversification in product lines
Financial Sophistication and understanding
Local tax and accounting treatment, etc.
22 I M
P L
E M
E N
T I N
G
R I S
K
M A
N A
G E
M E
N T
P
O L
I C
Y

R I
S K
M
A N
A G
E M
E N
T P
O L
I C
Y
Decision to
hedge
Key drivers of the Hedging Decision
Business
viability
risk?
Hedge
Are competitors
hedging financial
risks?
Meaningful
impact to value? Hedge
Hedge
Are any
exposures at
opportunistic
levels to hedge?
Hedge Do not hedge
Yes
Yes
Yes
Yes
No
No
No
No
23 I M
P L
E M
E N
T I N
G
R I S
K
M A
N A
G E
M E
N T
P
O L
I C
Y

$30
$80
$130
Jan-2007 Apr-2007 Jul-2007 Oct-2007 Jan-2008 Apr-2008 Jul-2008 Oct-2008 Jan-2009 Apr-2009 Jul-2009
Pri
ce
( $
/ b
bl)
WTI Crude Oil Price Performance vs. 2 – Standard Deviation Risk Cone (Assuming Jan 2, 2008 Market Data)
Market Moves Greater than Two-Standard Deviations are not Unseen Events in
Commodity Markets – In Fact, They Have Occurred Repeatedly in the Recent Past
2 - Standard Deviation
Potential Move
WTI
Within a 10-month period,
WTI had a +2 and -2 standard
deviation move
Source: JPMorgan
24 I M
P L
E M
E N
T I N
G
R I S
K
M A
N A
G E
M E
N T
P
O L
I C
Y

$1.4
$1.6
$1.8
$2.0
$2.2
$2.4
$2.6
Jan-
2006
Apr
-200
6
Jul-2
006
Oct
-200
6
Jan-
2007
Apr
-200
7
Jul-2
007
Oct
-200
7
Jan-
2008
Apr
-200
8
Jul-2
008
Oct
-200
8
Jan-
2009
Apr
-200
9
Jul-2
009
Oct
-200
9
Jan-
2010
Apr
-201
0
Jul-2
010
Oct
-201
0
Jan-
2011
Apr
-201
1
Jul-2
011
Ex
ch
an
ge
Ra
te U
SD
BR
L)
Exchange rate USDBRL vs. 2 – Standard Deviation Risk Cone (Assuming Jan 2, 2007 Market Data)
The Same is True for FX and Interest Rates Markets
2 - Standard Deviation
Potential Move
USDBRL
Within a 10-month period,
BRL had a +2 and -2 standard
deviation move
Source: JPMorgan
25 I M
P L
E M
E N
T I N
G
R I S
K
M A
N A
G E
M E
N T
P
O L
I C
Y

Analysts Forecasting Commodity Prices Have Shown Low Accuracy in the
Recent Past
Monthly crude oil price forecast published by a well-known international consulting firm has shown low accuracy when
compared versus ex-post (real) prices, not only for long forecast horizons (12-18 months) but also in the short term (1-3
month period). Based on monthly published reports from 2002 - 2010
To base financial decisions on published forecasts could potentially become a dangerous proposal given that historically
financial analysts have exhibited low predictive powers, not only in Commodities but across different asset classes
-120.00%
-100.00%
-80.00%
-60.00%
-40.00%
-20.00%
0.00%
20.00%
40.00%
60.00%
80.00%
1 2 3 4 5 6 7 8 9 10 11 12 13 14 15 16 17 18
Source: JPMorgan
Month out
Perc
enta
ge F
ore
cast
Err
or
25% Percentile
75% Percentile
Maximum
Minimum
26 I M
P L
E M
E N
T I N
G
R I S
K
M A
N A
G E
M E
N T
P
O L
I C
Y

0%
10%
20%
30%
40%
50%
60%
70%
80%
90%
100%
1Q (current
quarter)
2Q 3Q 4Q 5Q 6Q
Hedge: Rolling and Layering as a Consistent Way to Lower Overall Cash Flow Volatility
J.P. Morgan recommends a policy that mandates discipline in hedging forecasted cash flows. The policy could also allow for
a measure of discretion within that discipline
Discretion on whether Client hedges to the minimum required by its policy or up to the maximum allowed in any given
quarter
Some discretion on layering trades intra-quarter: When does Client add a layer and how much?
Ability to layer further out than required
Discretion between minimum and maximum mandated by policy Minimum mandated by policy
Layer E
Layer D
Layer C
Layer B
Layer A
Layer E
Layer D
Layer C
Layer B
Layer E
Layer D
Layer c
Layer E
Layer D
Mandatory
% Hedged 50% 40% 30% 20%
0%
10%
20%
30%
40%
50%
60%
70%
80%
90%
100%
Q1 (current quarter) Q2 Q3 Q4 Q5 Q6
[***] Assumptions: sliding scale minimum base level, decreasing discretionary maximum level, 15-month hedging tenor
Layer E
10%
How much discretion should your risk policy permit?
27 I M
P L
E M
E N
T I N
G
R I S
K
M A
N A
G E
M E
N T
P
O L
I C
Y

($5.00)
$0.00
$5.00
$10.00
$15.00
$20.00
$25.00
$30.00
$35.00
$40.00
May-96 May-97 May-98 May-99 May-00 May-01 May-02 May-03 May-04
Difference WTI Hedged Profile 1 Hedge Profile 2 Hedge Profile 3
Rebalancing Effects of Different Consistent Hedging Policies – Crude Oil 1996 - 2004
Different Hedging Profiles Produce Different Reductions in Volatilities
28 I M
P L
E M
E N
T I N
G
R I S
K
M A
N A
G E
M E
N T
P
O L
I C
Y

($30.00)
($10.00)
$10.00
$30.00
$50.00
$70.00
$90.00
$110.00
$130.00
$150.00
Jul-04 Jul-05 Jul-06 Jul-07 Jul-08 Jul-09 Jul-10
Difference WTI Hedged Profile 1 Hedged Profile 2 Hedged Profile 3
Rebalancing Effects of Different Consistent Hedging Policies – Crude Oil 2004 - 2010
Different Hedging Profiles Produce Different Reductions in Volatilities
29 I M
P L
E M
E N
T I N
G
R I S
K
M A
N A
G E
M E
N T
P
O L
I C
Y

Historical Evolution in the Use of Financial Derivatives in Latin America
In the 1980’s few clients used Derivatives to hedge exposures, the exception to this usually in the agricultural space (through
Futures in the US) and to some extent FX Forwards, when available
During the 1990’s, for several reasons (PC’s, networks, education, sophistication pushed by international banks in local
markets) a widespread boom took off, across different asset classes, be it FX, Interest Rates, Commodities, etc.
From first generation derivatives (standard swaps and options) to second generation and beyond (“exotics”, such as barriers,
and extendible structures to more complex products, such as credit linked transactions) became quickly available – no limit in
terms of pricing, booking and marketing capabilities
Since the introduction of FAS 133 (and other similar accounting standards) corporate users, when affected, have gone back
to more simple structures due to adverse mark-to-market treatment for exotic products
In some jurisdictions tax treatment is (still) not fully clear, such as derivative loss deduction in the income statement, or
withholding tax issues
On average, sophistication has grown strongly across countries and sectors – customers that 10-15 years ago didn’t trade
any derivatives nowadays trade through Bloomberg electronically swaps (or other electronic platforms) and close other
sophisticated trades
Trades are being booked locally as well as with offshore entities (Banks), under standardized local and ISDA Master
Agreement
Sovereign entities have grown in sophistication as well and macro hedges are not uncommon any more (FX, Commodities,
Rates) in the region
As a general tendency, Derivatives are being used as part of more complex transactions – Capital Markets driven bond
issuance in other local markets and swapped back into local currency, commodity prepays, tax efficient funding structures,
etc.
Local Derivatives have become deeper and with longer maturities as well, similar to the ones seen in some mature markets:
FX and Rates in Chile, Mexico, Brazil
30 I M
P L
E M
E N
T I N
G
R I S
K
M A
N A
G E
M E
N T
P
O L
I C
Y

Agenda
31
Annex A: Basic Derivative Product Descriptions
31
Derivatives - What Are We Talking About ? 2
The Use of Financial Derivatives 5
Implementing Risk Management Policy 21
Annex B: JPM Commodity Capabilities 36
T H
E
U S
E
O F
F
I N
A N
C I A
L
D E
R I V
A T
I V
E S
I N
L
A T
I N
A
M E
R I C
A

Market Price
Net Price Unhedged Hedged
Buying a Fixed Price Swap
Key considerations Illustrative example
Objective
To lock in a forward price
Description
Client locks in the price over a predetermined period by
buying a fixed price swap from J.P.Morgan
The monthly settlement price is the average of each day’s
settlement in a given month and compared to the swap
price
– If settlement price is higher than the swap price, Client
receives the difference between the settlement price and
the swap price
– If settlement price is lower than the swap price, Client
pays the difference between the swap price and the
settlement price
Advantages
The Client locks in a price over a designated time period
and is protected from any price increase above the swap
price
Price increases in the physical market are compensated by
hedging gains
No upfront premium required
Disadvantages
The Client loses the potential gain from downward price
moves below the swap price
Price declines in the physical market are offset by hedging
losses
Potential gains
Potential costs
Client pays
difference
Client receives
difference
32 A N
N E
X
A :
B A
S I C
D
E R
I V
A T
I V
E
P R
O D
U C
T
D E
S C
R I P
T I O
N S

Market Price
Net Price Unhedged Hedged
Buying a Call Option
Key considerations Illustrative example
Objective
Buying insurance to protect against price increases by
paying premium upfront
Description
A call option creates a cap price in exchange for upfront
premium, which reflects the likelihood that the option will be
exercised. The farther the strike price is from trading levels,
the lower the amount of premium paid upfront. The call
option will reference a published price
The monthly settlement price is the average of each day’s
settlement in a given month and compared to the “option”
strike price
– If the settlement price is higher than the strike price,
Client receives the difference between the strike price
and settlement price. This payment offsets higher prices
in the physical market
– Otherwise, the purchased option expires worthless, but
Client benefits from lower prices in the physical market
Advantages
Client participates fully in downward price movements
while protecting against price increases above the call level
Disadvantages
There is an upfront cost associated with this strategy.
However, this strategy may prove to be more cost effective
than locking in a fixed price
Potential gains
Potential costs
Client receives
difference
Premium paid
Call Strike
33 A N
N E
X
A :
B A
S I C
D
E R
I V
A T
I V
E
P R
O D
U C
T
D E
S C
R I P
T I O
N S

Consumer Zero Cost Collar
Key considerations Illustrative example
Objective
To hedge at zero cost and still retain some benefit from
lower prices
Description
Client buys a call option and finances it by selling a put
option for the same time period at zero upfront cost. The
put and call options will reference a published price
The monthly settlement price is the average of each day’s
settlement in a given month and compared to the strike
levels of the monthly put and call
– If the settlement price is higher than call strike, the
Client receives the difference between the settlement
price and the call strike
– If the settlement price is lower than put strike, the Client
pays the difference between the put strike and the
settlement price
– Otherwise, no payments are made
Advantages
Zero upfront cost method of hedging against upward price
moves while maintaining some downside participation
Disadvantages
If the market price falls below the put strike, the Client will
pay the difference
Client has upward price exposure from the current swap
level to the call strike
Market Price
Net Price Unhedged Hedged
Potential gains
Potential costs
Client pays
difference
Put Strike
Call Strike
Client receives
difference
34 A N
N E
X
A :
B A
S I C
D
E R
I V
A T
I V
E
P R
O D
U C
T
D E
S C
R I P
T I O
N S

Hedge: Recommended Financial Instruments – the Risk Spectrum
Each of the available hedge alternatives offers different risk profiles
Low Risk High Risk
Call options Zero-Cost
Collars Swaps
Enhanced value
strategies
Written
options
Lock in forward price
Consumer receives
difference between
actual price and swap
price, if actual price is
higher than swap
price. Otherwise,
pays the difference
Full protection from
any price increases
above the swap price
No upfront premium
required
Forfeits potential
participation if prices
fall below swap price
Guaranteed cap level
in exchange for
upfront premium
Bespoke settlement
Full protection against
price increase above
the cap level
Full participation in
downward price
movements
Premium paid to
finance hedging
Guaranteed cap
level financed by
selling put options
for the same
time period
Zero upfront
premium cost
Maintain some
downward
participation
Downward
participation capped
at sold put strike
price
Upward price
exposure to calls
strike price
No upfront cost
relative to swap
Locks in more
favorable price today
Unknown potential
cash outflow if
market prices
change significantly
Limited participation in
downward price
movements to the sold
put strike price
Maximum benefit is
upfront premium
Downward
participation capped at
sold put strike price
Fully exposed to price
increases
Medium Risk
Premium
Collars
Guaranteed cap level
partially financed by
selling put options for
the same time period
Cheaper than outright
call purchase
Maintain some
downward
participation
Downward
participation capped at
sold put strike price
Upward price
exposure to calls
strike price
35 A N
N E
X
A :
B A
S I C
D
E R
I V
A T
I V
E
P R
O D
U C
T
D E
S C
R I P
T I O
N S
Agenda
Page
D U P O N T 36
Annex B: JPM Commodity Capabilities
36
Derivatives - What Are We Talking About ? 2
The Use of Financial Derivatives 5
Implementing Risk Management Policy 21
Annex A: Basic Derivative Product Descriptions 31
T H
E
U S
E
O F
F
I N
A N
C I A
L
D E
R I V
A T
I V
E S
I N
L
A T
I N
A
M E
R I C
A

J.P. Morgan Covers Commodities Across the Supply Chain
Futures & Options Global Commodities Research
OTC Metals, Energy and Ags
Warehousing Risk
Structured Products
Long Dated Contracts
Listed Futures and Options
Specialist Trading Desks
Global Clearing Solutions
Electronic Trading
Metals, Bulk Commodities
Energy and Power
Grains and Agricultural
Technical Analysis
Energy and
Power
Coal
Electricity
Natural Gas
Gasoline
Crude Oil
NGLs
Transportation
Freight
Base Metals
Steel
Nickel
Zinc
Tin
Copper
Aluminium
Lead
Aluminium Alloy
NASAAC
Precious Metals
Gold
Silver
Platinum
Palladium
Agricultural
Cattle
Dairy
Grains
Soybeans
Wheat
Corn
Softs
Coffee
Sugar
Cotton
Weather
Temperature
Precipitation
Wind
Hurricanes
Sunshine
Crop Yields
Environmental
Markets
Carbon
allowances and
offsets (e.g.,
RGGI; EUAs;
CERs; VERs)
Sulphur Dioxide
Nitrogen Oxides
Renewable
Energy Credits
Plastics
Ethylene
Polyethylene
Polypropylene
37 A N
N E
X
B :
J P
M
C O
M M
O D
I T
Y
C A
P A
B I L
I T
I E
S

J.P. Morgan named “2011 House of the Year” in Oil, Coal and Natural Gas
Oil and Products House of the Year
J.P. Morgan won EnergyRisk’s Oil and Products House in June 2011
Innovative financing deals with refiners and state-owned enterprises
demonstrated J.P. Morgan’s continued ability to provide first class
solutions to clients
J.P Morgan also showed the importance of maintaining strong
relationships with clients despite a challenging economic climate
Achieved greatest market penetration for over-the-counter energy
derivatives
Executed several large tailored transactions to meet clients risk
management needs
U.S. Natural Gas House of the Year
“Particularly over the last three years, it is fair to say that our
share of the wallet overall, in terms of flow and structured
transactions, has grown dramatically. I think there isn’t a
meaningful transaction or opportunity out there that we’re
not participating in or competing for.“
- Roy Salame, Global Head of Commodities Corporate Sales
EnergyRisk; June, 2011
Coal House of the Year
J.P. Morgan won EnergyRisk’s Coal House of the Year in June 2011
The magazine recognized J.P. Morgan for its “transformational
restructure” of its U.S Coal business highlighting:
Increase in offerings
International integration
Alignment with changing market fundamentals
Developing export market for thermal coal
J.P Morgan also demonstrated growth in product offering to European
and Asian clients
Increased marketing support, illustrates J.P. Morgan’s leadership within
the Commodities Industry
J.P. Morgan won EnergyRisk’s U.S. Natural Gas House of the Year
in June 2011
EnergyRisk highlighted J.P. Morgan’s robust deal-making activities
and purchase of RBS Sempra’s North America gas business
Resulting in expansion of the Firm’s ability to serve clients through
a diverse network of physical assets in North America
70 bcf/d of storage capacity
1.9 bcf/d of transportation capacity
6 bcf/d of gas marketing activities in 2010
J.P. Morgan also continued excellence in executing large,
structured transactions and risk managing capabilities
38 A N
N E
X
B :
J P
M
C O
M M
O D
I T
Y
C A
P A
B I L
I T
I E
S

J.P. Morgan named “2011 Best Commodities House” by Euromoney
Euromoney Awards for Excellence - June 2011
Diverse platform of financial and physical capabilities across product
areas – energy, metals, investor products, agriculture etc
Strong growth both organically and through strategic acquisitions,
multi-year agreements and large structured transactions
Integrated RBS Sempra business in 2010 to further develop a strong
and diversified platform across multiple commodity product types
Acquisition nearly doubled physical and financial power business
Expanded our presence in oil, power, gas and metals
Expanded global presence
Integration of US and Europe Coal and Freight Platform and a
long-term physical coal supply agreement into German coal fired
power-plant
Increased agricultural products presence in emerging market
regions
Established sales coverage in emerging markets such as Brazil,
South Africa and Middle East
Undertaken innovative projects to transform the J.P. Morgan
Commodities business
In February 2011, J.P. Morgan launched the Commodity-related
Project Finance business, a joint venture between Commodities
and Syndicated and Leveraged Finance Business
Moved the Commodities Research function into the business,
publishing some of the industry’s most thought-provoking analysis
Notable Structured Transactions
Large syndicated loan facility for a North African producer
In July 2011, J.P. Morgan acted as the lead arranger and
underwriter for a syndicated pre-export credit facility
J.P. Morgan’s leading commodity trading capability enabled
enhanced tailoring of oil hedges to fit with the client’s actual
exposure profile
Long term, large volume physical Natural Gas purchase with North
East producer
In February 2011, J.P. Morgan entered into a large volume, 10
year physical index sales agreement with a major North American
Natural Gas producer
This leverages J.P. Morgan’s existing platform in US and Canada,
providing the client with a credit worthy base load market and
access to potentially higher priced markets
J.P. Morgan acquired and restructured five wind power purchase
agreements to monetize the assets owned by a large renewable
energy client
Highlights J.P. Morgan’s continued leadership in executing large,
structured transactions across commodities
LNG delivery to the UK
J.P. Morgan executed delivery of Liquified Natural Gas (LNG)
across three continents, purchasing the cargo from a large Middle
Eastern gas and power company
Transaction represents the first import of LNG into the UK from
the US in over 50 years
39 A N
N E
X
B :
J P
M
C O
M M
O D
I T
Y
C A
P A
B I L
I T
I E
S

JPMorgan has Recently Won Every Commodity Award in the Industry
JPMorgan Named “Commodity Derivatives House” of 2009 by IFR
JPMorgan Named “Derivatives House of the Year” in 2010 by Energy Risk Magazine
JPMorgan ranked “Most Innovative in Commodities” in 2009 by The Banker
JPMorgan Named “Commodity Derivatives House of the Year” in 2009 by Risk
Magazine
JP Morgan Named “Quality Leader in US Commodities Corporate Energy” in 2010 by
Greenwich Associates
40 A N
N E
X
B :
J P
M
C O
M M
O D
I T
Y
C A
P A
B I L
I T
I E
S