Embed Size (px)
Citation preview

Pitfalls in Lactate Measurements at 3T
Thomas Lange1, Ulrike Dydak, PhD1, Tim Roberts, PhD2, Howard Rowley, MD3, Miroslava Bjeljac, MD4, Peter Boesiger, PhD1
1Institute of Biomedical Engineering, University of Zurich and Swiss Federal Institute
of Technology Zurich, Zurich, Switzerland 2Radiology Department, Children’s Hospital of Philadelphia, Philadelphia, PA, USA
3Radiology Department, University of Wisconsin, Madison, WI, USA 4Department of Neurosurgery, University Hospital Zurich, Zurich, Switzerland
Submitted to
AJNR
as a technical report
Mailing Address: Dr. Peter Boesiger Institute for Biomedical Engineering University and ETH Zurich Gloriastrasse 35 CH-8092 Zurich Switzerland Email: [email protected] Phone: + 41-1-632 4581 Fax: + 41-1-632 11 93 presented at ASNR 2005 (received the ASNR 2005 best paper
award for functional neuroradiology) grant ETH Zurich SEP TH 7/02-2 Keywords: lactate, MRS, high field, signal loss short running title Pitfalls in Lactate Measurements at 3T Date: July 22nd , 2005
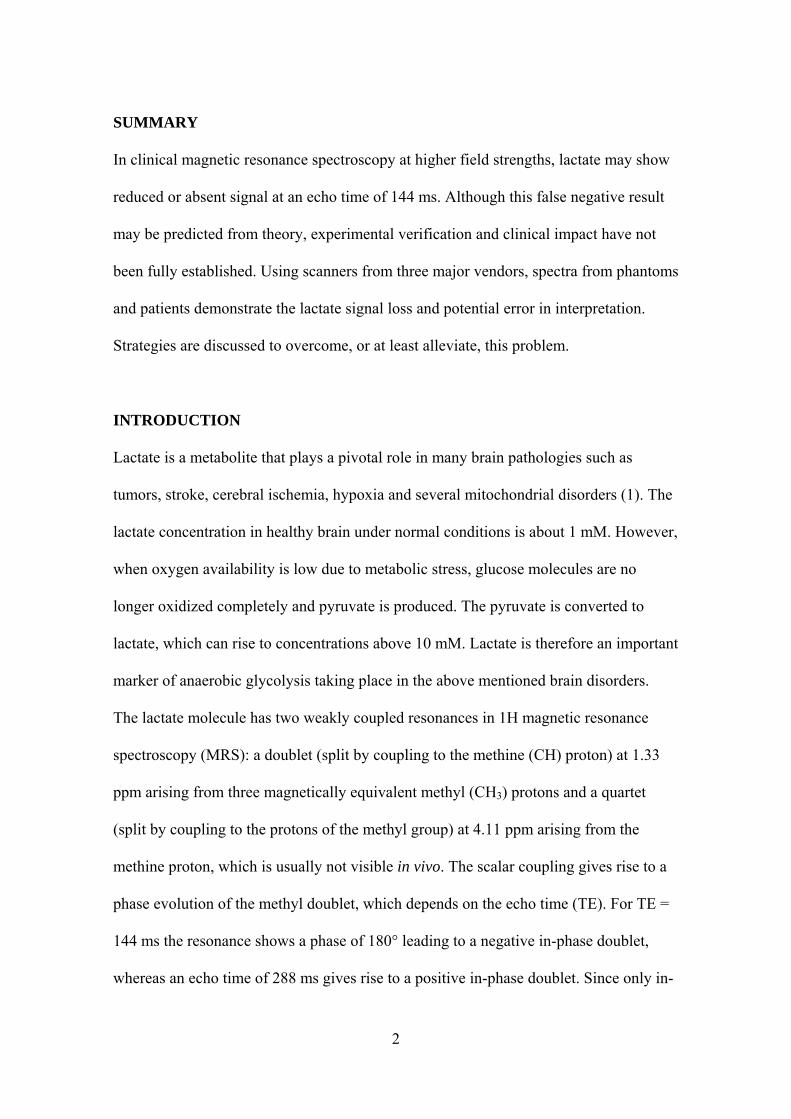
SUMMARY
In clinical magnetic resonance spectroscopy at higher field strengths, lactate may show
reduced or absent signal at an echo time of 144 ms. Although this false negative result
may be predicted from theory, experimental verification and clinical impact have not
been fully established. Using scanners from three major vendors, spectra from phantoms
and patients demonstrate the lactate signal loss and potential error in interpretation.
Strategies are discussed to overcome, or at least alleviate, this problem.
INTRODUCTION
Lactate is a metabolite that plays a pivotal role in many brain pathologies such as
tumors, stroke, cerebral ischemia, hypoxia and several mitochondrial disorders (1). The
lactate concentration in healthy brain under normal conditions is about 1 mM. However,
when oxygen availability is low due to metabolic stress, glucose molecules are no
longer oxidized completely and pyruvate is produced. The pyruvate is converted to
lactate, which can rise to concentrations above 10 mM. Lactate is therefore an important
marker of anaerobic glycolysis taking place in the above mentioned brain disorders.
The lactate molecule has two weakly coupled resonances in 1H magnetic resonance
spectroscopy (MRS): a doublet (split by coupling to the methine (CH) proton) at 1.33
ppm arising from three magnetically equivalent methyl (CH3) protons and a quartet
(split by coupling to the protons of the methyl group) at 4.11 ppm arising from the
methine proton, which is usually not visible in vivo. The scalar coupling gives rise to a
phase evolution of the methyl doublet, which depends on the echo time (TE). For TE =
144 ms the resonance shows a phase of 180° leading to a negative in-phase doublet,
whereas an echo time of 288 ms gives rise to a positive in-phase doublet. Since only in-
2
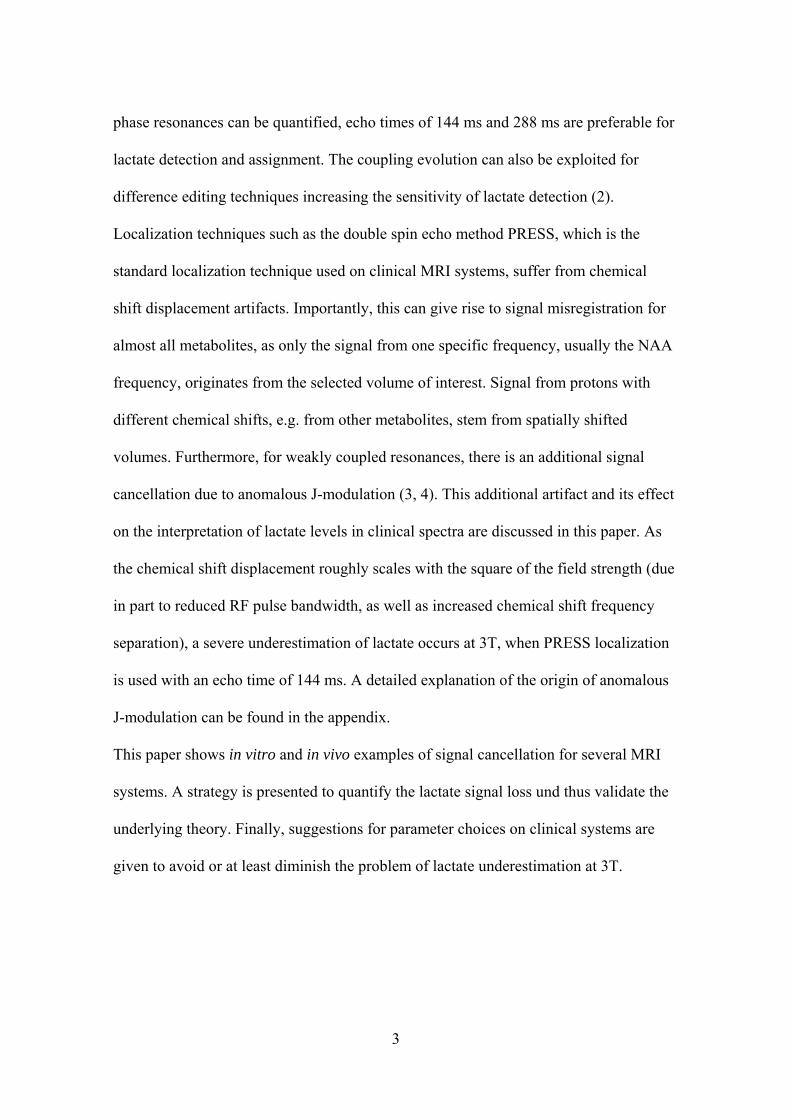
phase resonances can be quantified, echo times of 144 ms and 288 ms are preferable for
lactate detection and assignment. The coupling evolution can also be exploited for
difference editing techniques increasing the sensitivity of lactate detection (2).
Localization techniques such as the double spin echo method PRESS, which is the
standard localization technique used on clinical MRI systems, suffer from chemical
shift displacement artifacts. Importantly, this can give rise to signal misregistration for
almost all metabolites, as only the signal from one specific frequency, usually the NAA
frequency, originates from the selected volume of interest. Signal from protons with
different chemical shifts, e.g. from other metabolites, stem from spatially shifted
volumes. Furthermore, for weakly coupled resonances, there is an additional signal
cancellation due to anomalous J-modulation (3, 4). This additional artifact and its effect
on the interpretation of lactate levels in clinical spectra are discussed in this paper. As
the chemical shift displacement roughly scales with the square of the field strength (due
in part to reduced RF pulse bandwidth, as well as increased chemical shift frequency
separation), a severe underestimation of lactate occurs at 3T, when PRESS localization
is used with an echo time of 144 ms. A detailed explanation of the origin of anomalous
J-modulation can be found in the appendix.
This paper shows in vitro and in vivo examples of signal cancellation for several MRI
systems. A strategy is presented to quantify the lactate signal loss und thus validate the
underlying theory. Finally, suggestions for parameter choices on clinical systems are
given to avoid or at least diminish the problem of lactate underestimation at 3T.
3

DESCRIPTION OF THE TECHNIQUE AND RESULTS
1) Patient Measurements
Two patients with high-grade gliomas underwent MRS both with TE of 144 and 288
ms, performed on Philips Intera whole body systems using a send-receive head coil.
One patient was measured at a field strength of 1.5T, while the other was measured at
3T.
Another patient with Mitochondrial myopathy, encephalopathy, lactacidosis, stroke
(MELAS) was examined on 1.5T and 3T systems from a second vendor (GE
Healthcare, Milwaukee, WI). Two dimensional multivoxel spectra were acquired at
both field strengths consecutively the same day, repeated with both TE = 144 ms and
TE = 288 ms. Standard PRESS localization was used with the region of interest
centered over an acute occipital lesion. On this system VSS saturation bands (5) are
placed around the volume of interest by default.
Some of the data presented here was acquired on a clinical basis, but all patients gave
their written informed consent prior to participating in research experiments.
In the high-grade tumor in figure 1 the spectra acquired at 1.5T both show a prominent
lactate doublet, inverted for TE = 144 ms and in phase with NAA for TE = 288 ms. The
lactate peak, clearly visible as inverted doublet at TE = 144 ms, is of greater area and
amplitude at TE = 144 ms than at TE = 288 ms. This signal change reflects the known
T2 related signal attenuation with increasing TE.
4

Comparable experiments were carried out on a 3T system scanning another patient with
a glioma (grade III). While for TE = 288 ms a large lactate peak is observable at
1.33 ppm, the lactate resonance has completely vanished for TE = 144 ms, due to
anomalous J-modulation (Fig. 2).
The third patient example (Fig. 3), carried out on different systems, shows lactate peaks
of similar relative amplitude with TE = 144 ms and TE = 288 ms at 1.5T. The lactate
signal loss, which is expected with TE = 288 ms compared to TE = 144 ms due to T2
relaxation, is approximately compensated by the signal loss due to anomalous J-
modulation with TE = 144 ms. At 3T, however, anomalous J-modulation gives rise to a
complete disappearance of the lactate peak.
2) Phantom Measurements
A standard brain metabolite phantom containing 5 mM of lactate was measured on three
3T MRI scanners from three different vendors (GE Healthcare, Philips Medical Systems
and Siemens Medical Solutions). Single Voxel MRS (VOI size = 2x2x2 cm3, PRESS
localization) was acquired from the same volume once with TE = 144 ms and once with
TE = 288 ms. The lactate peak seen at 1.33 ppm for TE = 288 ms would be expected to
be smaller than the inverted doublet for TE = 144 ms due to T2 relaxation. However, at
3T spectra from all three MR systems show significantly larger lactate resonances at TE
= 288 ms than at TE = 144 ms. For one system the lactate peak has even disappeared
completely. This demonstrates that a significant amount of the lactate signal is lost (not
visible) at TE = 144 ms (Fig. 4).
5
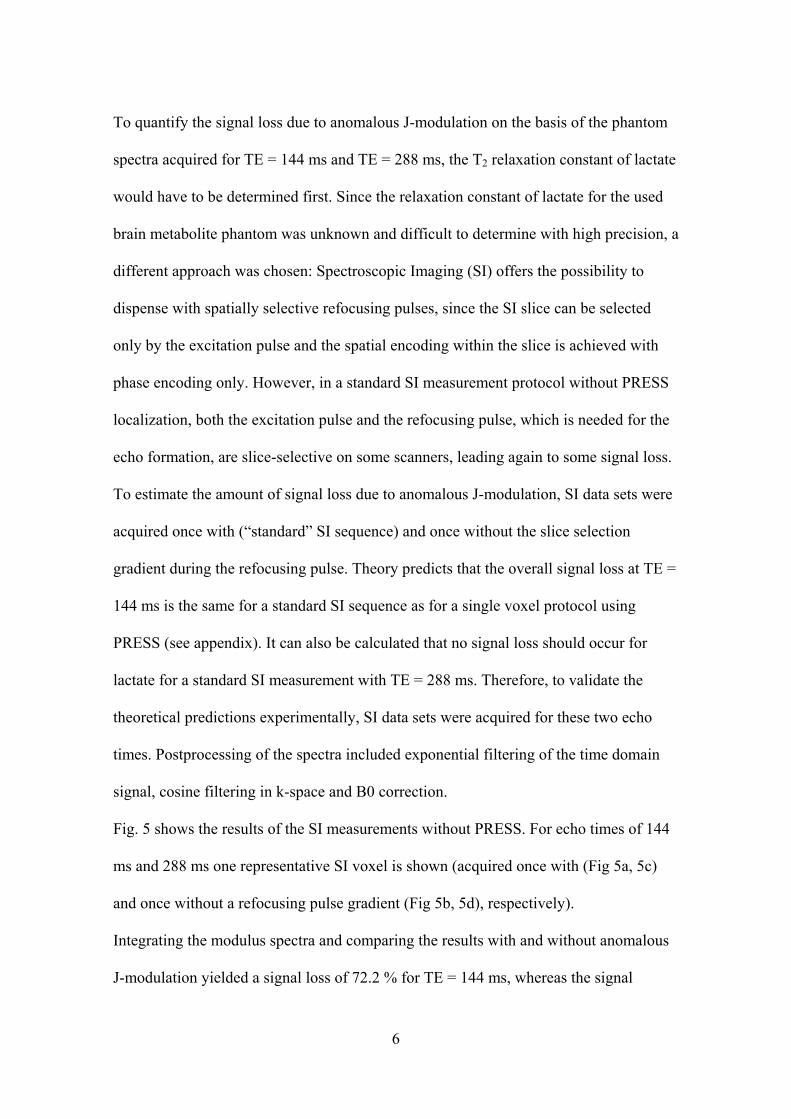
To quantify the signal loss due to anomalous J-modulation on the basis of the phantom
spectra acquired for TE = 144 ms and TE = 288 ms, the T2 relaxation constant of lactate
would have to be determined first. Since the relaxation constant of lactate for the used
brain metabolite phantom was unknown and difficult to determine with high precision, a
different approach was chosen: Spectroscopic Imaging (SI) offers the possibility to
dispense with spatially selective refocusing pulses, since the SI slice can be selected
only by the excitation pulse and the spatial encoding within the slice is achieved with
phase encoding only. However, in a standard SI measurement protocol without PRESS
localization, both the excitation pulse and the refocusing pulse, which is needed for the
echo formation, are slice-selective on some scanners, leading again to some signal loss.
To estimate the amount of signal loss due to anomalous J-modulation, SI data sets were
acquired once with (“standard” SI sequence) and once without the slice selection
gradient during the refocusing pulse. Theory predicts that the overall signal loss at TE =
144 ms is the same for a standard SI sequence as for a single voxel protocol using
PRESS (see appendix). It can also be calculated that no signal loss should occur for
lactate for a standard SI measurement with TE = 288 ms. Therefore, to validate the
theoretical predictions experimentally, SI data sets were acquired for these two echo
times. Postprocessing of the spectra included exponential filtering of the time domain
signal, cosine filtering in k-space and B0 correction.
Fig. 5 shows the results of the SI measurements without PRESS. For echo times of 144
ms and 288 ms one representative SI voxel is shown (acquired once with (Fig 5a, 5c)
and once without a refocusing pulse gradient (Fig 5b, 5d), respectively).
Integrating the modulus spectra and comparing the results with and without anomalous
J-modulation yielded a signal loss of 72.2 % for TE = 144 ms, whereas the signal
6
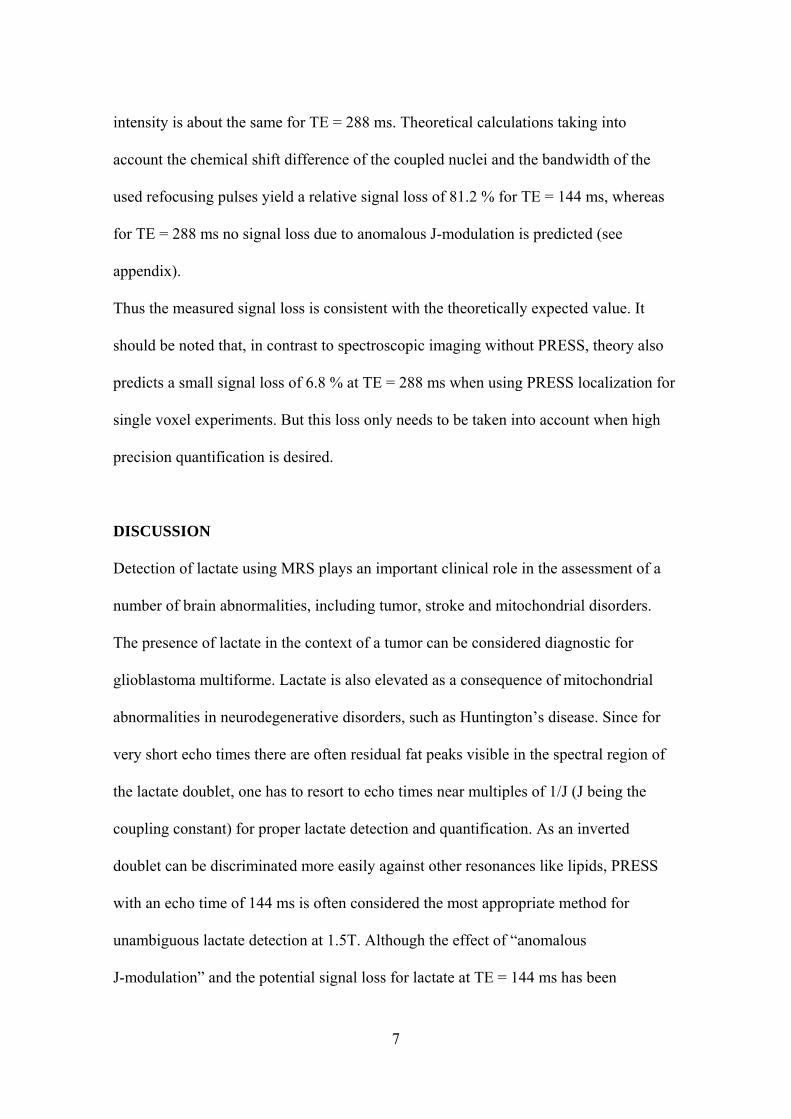
intensity is about the same for TE = 288 ms. Theoretical calculations taking into
account the chemical shift difference of the coupled nuclei and the bandwidth of the
used refocusing pulses yield a relative signal loss of 81.2 % for TE = 144 ms, whereas
for TE = 288 ms no signal loss due to anomalous J-modulation is predicted (see
appendix).
Thus the measured signal loss is consistent with the theoretically expected value. It
should be noted that, in contrast to spectroscopic imaging without PRESS, theory also
predicts a small signal loss of 6.8 % at TE = 288 ms when using PRESS localization for
single voxel experiments. But this loss only needs to be taken into account when high
precision quantification is desired.
DISCUSSION
Detection of lactate using MRS plays an important clinical role in the assessment of a
number of brain abnormalities, including tumor, stroke and mitochondrial disorders.
The presence of lactate in the context of a tumor can be considered diagnostic for
glioblastoma multiforme. Lactate is also elevated as a consequence of mitochondrial
abnormalities in neurodegenerative disorders, such as Huntington’s disease. Since for
very short echo times there are often residual fat peaks visible in the spectral region of
the lactate doublet, one has to resort to echo times near multiples of 1/J (J being the
coupling constant) for proper lactate detection and quantification. As an inverted
doublet can be discriminated more easily against other resonances like lipids, PRESS
with an echo time of 144 ms is often considered the most appropriate method for
unambiguous lactate detection at 1.5T. Although the effect of “anomalous
J-modulation” and the potential signal loss for lactate at TE = 144 ms has been
7

discussed in the literature (3, 4), little attention has been given to this phenomenon in
clinical routine so far. Neglecting this effect can potentially lead to a severe
misinterpretation in clinical diagnosis as shown in our examples. The extent of the
signal loss due to anomalous J-modulation can vary considerably depending on the field
strength, the used coil and the sequence parameters. A practical recommendation for
clinical MRS at 3T is to perform a phantom study at TE = 144 ms and TE = 288 ms; if
the lactate signal at TE = 144 ms is less than that seen at TE = 288 ms, it is
recommended not to use TE = 144 ms, but rather only TE = 288 ms in clinical
examinations, although in general the sensitivity decreases with longer echo times due
to T2 relaxation. However it should be noted that the quantitative influence of
anomalous J-modulation can be different in specific in vivo examples, where
inhomogeneous metabolite distributions can either aggravate or attenuate the effect
compared to in vitro experiments.
Strategies to prevent or alleviate the signal loss due to anomalous J-modulation are
discussed elsewhere in detail (3-5), but usually require changes in the scanner software.
An approach implemented on several clinical scanners is to saturate the region of spin-
selective refocusing with outer volume suppression (OVS) pulses prior to excitation.
E.g. on some scanners, quadratic phase suppression pulses have been implemented for
this purpose (6), but they suppress the effect only partially, since they are not
specifically tuned for lactate detection as can be seen both from in vivo and phantom
examples in this paper. However, at higher field strengths than 3 T, which have now
become available for human studies as well, the chemical shift displacement will be so
pronounced that this work-around will be less effective.
8

Another approach for high-field systems is using pulses with much larger bandwidths
such as adiabatic pulses to alleviate the chemical shift displacement. However, since
ordinary adiabatic pulses are usually not spatially selective, they cannot be used in
PRESS sequences. LASER (Localization by Adiabatic SElective Refocusing)
sequences, using pairs of large bandwidth AFP (Adiabatic Full Passage) pulses for
volume selection and echo formation at the same time, will probably be the method of
choice for localization in high-field spectroscopy applications in the future (7). A
further popular localization technique is STEAM (STimulated Echo Acquisition Mode),
which uses three 90° pulses giving rise to a stimulated echo. Since 90° pulses have
much larger bandwidths than 180° pulses, the chemical shift displacement is far less
severe. However, for STEAM the signal intensity of coupled resonances not only varies
with TE, but also shows a strong modulation governed by the mixing time (TM)
between the second and third pulse (1). Furthermore, SI (Spectroscopic Imaging) offers
the possibility to dispense with spatially selective refocusing pulses and therefore
prevent the signal cancellation. However, SI protocols without PRESS localization are
usually not implemented on purely clinical scanners and very good outer-volume
suppression is required for this approach to prevent the spectra from being impaired by
subcutaneous fat signal.
APPENDIX
The signal cancellation by anomalous J-modulation for coupled resonances arises from
the chemical shift displacement artifact. The relative voxel displacement for two
protons with chemical shifts δ1 and δ2 equals the ratio of the chemical shift difference
(ΔωCS = δ1- δ2) and the bandwidth of the RF pulse (ΔωRF) used for volume selection.
9

For the signal of the methyl (CH3) resonance of lactate at 1.33 ppm the signal loss can
be understood as follows: Due to this chemical shift displacement the volume selected
by one single refocusing pulse decomposes into a region where both the methyl and the
methine (CH) protons of the lactate molecule are affected by the pulse (“non-
selective”pulse) and a region where only the methyl spin is inverted (“selective”pulse)
and therefore the coupling evolution is refocused. This leads to a superposition of signal
with different phases giving rise to signal cancellation in the spectrum. The volume
selected by a PRESS sequence, which uses two refocusing pulses, consists of four
partial volumes with different phase evolutions, depending on whether none, one or
both of the two refocusing pulses are spin-selective (Fig. 6). In a PRESS sequence the
signal loss is also determined by the sequence timing, since the spins are inverted twice
by the two spatially selective refocusing pulses (8). By adding the signal terms for the
four partial volumes, the resulting signal loss can be calculated. This effect termed
“anomalous J-modulation” (4) is particularly pronounced for an echo time of 144 ms,
when the two superimposed signals from the partial volumes V1 and V4 have a phase
difference of 180° and therefore the cancellation is most effective, whereas for an echo
time of 288 ms almost no cancellation occurs (Fig. 6).
According to theory, the relative signal loss for lactate due to anomalous J-modulation
at TE = 144 ms amounts to
,2SS
RF
CS
ωΔωΔ
=Δ
(1)
where ΔωCS is the chemical shift difference of the coupled nuclei and ΔωRF is the
bandwidth of the refocusing pulse. At 3T the chemical shift difference between the
methyl and the methine proton is 355 Hz, and the refocusing pulse used in this example
10

had a bandwidth of 874 Hz. This predicts a relative signal loss of 81.2 % due to
anomalous J-modulation for TE = 144 ms. The theoretical signal loss for single voxel
PRESS measurements at TE = 288 ms depends on the position of the two refocusing
pulses within the sequence. Usually the PRESS sequence is rendered as asymmetric as
possible with the first refocusing pulse being irradiated as soon as possible (at time τ1)
after the excitation pulse. For the standard PRESS sequence implemented on a 3T
Philips Intera Scanner theory predicts the following signal loss due to anomalous J-
modulation at TE = 288 ms:
( )( ) %.8.62Jcos112
SS
1RF
CS
RF
CS =τ⋅⋅π−⋅⎟⎟⎠
⎞⎜⎜⎝
⎛ωΔωΔ
−⋅ωΔωΔ
=Δ (2) (2)
For an SI sequence without PRESS localization, but with a slice-selective refocusing
pulse for the echo formation, there are only two interfering partial volumes
(corresponding to V1 and V4 in Fig. 6). For TE = 144 ms, this leads to the same relative
signal loss as for a single voxel PRESS sequence, whereas no signal loss at all occurs
for TE = 288 ms.
To understand the basic behavior of the lactate resonances in a PRESS sequence, it is
sufficient to approximate the used pulses as ideal hard pulses. However, pulse
imperfections give rise to a far more complicated evolution behavior, which was
investigated analytically, simulated numerically and discussed in detail in several
publications (9-13). As the chemical shift is proportional to B0 and, due to B1
limitations, the pulse bandwidths are approximately inversely proportional to B0, the
chemical shift displacement and also the lactate signal loss due to anomalous J-
modulation at TE = 144 ms roughly scale with the square of the field strength.
11

ACKNOWLEDGEMENTS
The authors are grateful for the financial support by the SEP program of the ETH
Zurich. Furthermore the authors want to thank Dr. Andy Alexander and Dr. Karl
Vigen, University of Wisconsin, Madison, as well as Dr. D-J Wang, CHOP,
Philadelphia for helping with the acquisition of some of the spectra on different
vendor’s scanners.

REFERENCES
1. de Graaf R. In Vivo NMR Spectroscopy: Principles and Techniques. John Wiley &
Sons Ltd, Chichester, 1998;53-55.
2. Allen PS, Thompson RB, Wilman AH. Metabolite-Specific NMR Spectroscopy In
Vivo. NMR Biomed 1997;10:435-444.
3. Yablonskiy DA, Neil JJ, Raichle ME, Ackerman JJH. Homonuclear J coupling
Effects in Volume Localized NMR Spectroscopy: Pitfalls and Solutions. Magn
Reson Med 1998;39:159-178.
4. Kelley DAC, Lawrence LW, Star-Lack JM. Lactate Detection at 3T: Compensating
J Coupling Effects With BASING. J Magn Reson Imaging 1999;9:732-737.
5. Star-Lack J, Spielman D, Adalsteinsson E, Kurhanewicz J, Terris DJ, Vigneron
DB. In Vivo Lactate Editing with Simultaneous Detection of Choline, Creatine,
NAA, and Lipid Singlets at 1.5 T Using PRESS Excitation with Applications to the
Study of Brain and Head and Neck Tumors. J Magn Reson 1998;133:243-254.
6. Tran TK, Vigneron DB, Sailasuta N, Tropp J, Le Roux P, Kurhanewicz J, Nelson
S, Hurd R. Very selective suppression pulses for clinical MRSI studies of brain and
prostate cancer. Magn Reson Med 2000;43:23-33.
7. Garwood M, DelaBarre L. The return to frequency sweep: designing adiabatic
pulses for contemporary NMR. Magn Reson Med 2001; 153:155-177.
13

8. Schick F, Nägele T, Klose U, Lutz O. Lactate Quantification by Means of PRESS
Spectroscopy-Influence of Refocusing Pulses and Timing Scheme. Magn Reson
Imaging 1995;13:309-319.
9. Jung WI, Bunse M, Lutz O. Quantitative Evaluation of the Lactate Signal Loss and
Its Spatial Dependence in PRESS Localized 1H NMR Spectroscopy. J Magn Reson
2001;152:203-213.
10. Marshall I, Wild J. A Systematic Study of the Lactate Line-shape in PRESS-
Localized Proton Spectroscopy. Magn Reson Med 1998;40:72-78.
11. Thompson RB, Allen PS. Sources of variability in the response of coupled spins to
the PRESS sequence and their potential impact on metabolite quantification. Magn
Reson Med 1999;41:112-1159.
12. Slotboom J, Mehlkopf AF, Bovee WMMJ. The effects of frequency-selective RF
pulses on J-coupled spin-1/2 systems. J Magn Reson A 1994;108:38-50.
13. Maudsley AA, Govindaraju V, Young K, Zakaria KA, Pattany PM, Soher B,
Matson GB. Numerical simulation of PRESS localized MR spectroscopy. J Magn
Reson 2005;173:54-63.
14

FIGURE CAPTIONS
Figure 1:
Single voxel spectra acquired at 1.5T from the brain of a patient with a high grade
glioma using PRESS localization: a) TE = 144 ms, b) TE = 288 ms.
Figure 2:
Single voxel spectra acquired at 3T from the brain of a patient with a grade III glioma
using PRESS localization: a) TE = 144 ms, b) TE = 288 ms.
Figure 3:
Multi-voxel spectra acquired at 1.5 T and 3 T one hour apart from the the same region
in the brain of a patient with MELAS using a standard PRESS localization with TE =
144 ms and TE = 288 ms. An inverted lactate doublet is clearly visible at 1.5T, but not
at 3T (arrows). Upright lactate peaks at TE = 288 are seen equally well at both field
strengths (arrows).
Figure 4:
Proton spectra acquired from a standard brain metabolite phantom containing 5 mM of
lactate. The measurements were performed on three 3T MRI scanners from three
15

different vendors (Philips Medical Systems, GE Health Care and Siemens Medical
Solutions). Single Voxel MRS (VOI size = 2x2x2 cm3, PRESS localization) was
performed from the same volume once with TE = 144 ms and once with TE = 288 ms.
RF pulse bandwidths for the selective refocusing pulses vary between vendors in the
range 874 to 2300 Hz.
Figure 5:
Spectra from a spectroscopic imaging dataset acquired at 3 T from a phantom
containing 10 mM NAA and 20 mM lactate without PRESS localization: a) TE = 144
ms, with refocusing pulse gradient, b) TE = 144 ms, without refocusing pulse gradient,
c) TE = 288 ms, with refocusing pulse gradient, d) TE = 288 ms, without refocusing
pulse gradient.
Figure 6:
Partial volumes and their coupling evolution for a single voxel PRESS experiment: The
90° excitation pulse is applied with a gradient in the z direction, whereas the two
refocusing pulses are applied with gradients in the x and y direction respectively. The
size of the partial volumes is determined by the chemical shift displacement. The signal
phase of the magnetization is determined by the echo time (TE), the scalar coupling
16

constant (J) of lactate and the time interval (t1) between the excitation pulse and the first
refocusing pulse.
17

Fig. 1)
a) b)
Lac
NAA
Choc)
ChoLac
NAA
TE = 144 ms TE = 288 ms

Fig. 2)
a) b)
LacNAA
Cho Lac
NAA
Cho
c)
TE = 144 ms TE = 288 ms
Cr
Cr

Fig. 3)
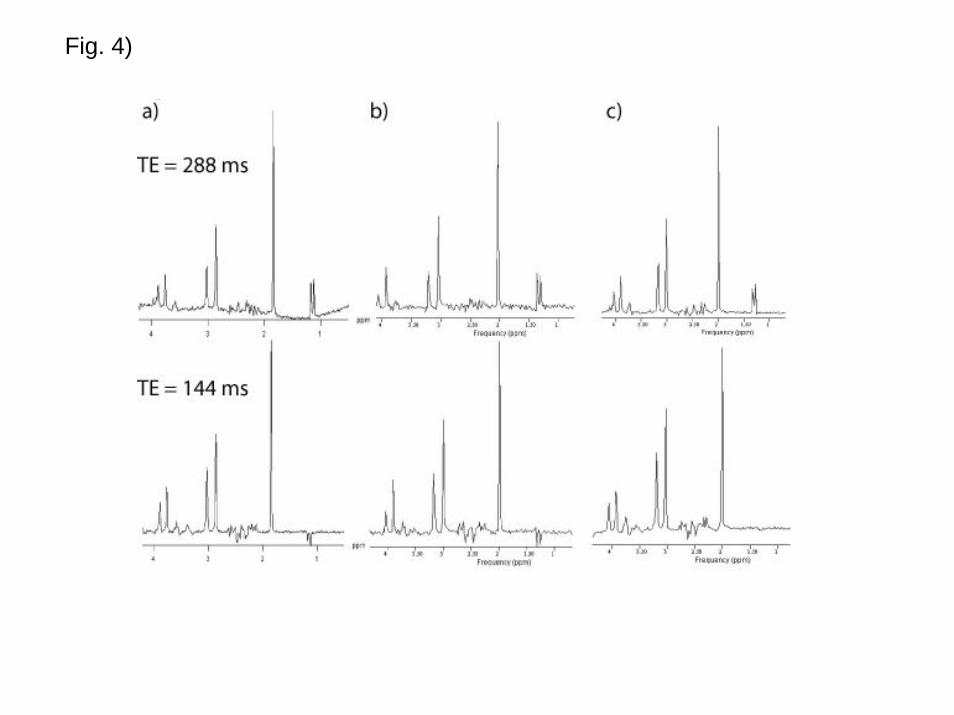
Fig. 4)

d)c)
b)a)
Lac
NAA
Lac
NAA
LacNAA
LacNAA
Fig. 5)

Region 1st 180º 2nd 180º Observable Magnetization
1 non-selective non-selective S1 ~ V1· cos(π·J· TE )2 non-selective selective S2 ~ V2· cos(π·J· 2t1)3 selective non-selective S3 ~ V3 · cos(π·J· (TE -2t1) )4 selective selective S4 ~ V4
V1V2
RF
CS1 ⋅⎟⎟
⎠
⎞⎜⎜⎝
⎛ωΔωΔ
−=
V1VVRF
CS
RF
CS32 ⋅⎟⎟
⎠
⎞⎜⎜⎝
⎛ωΔωΔ
−⋅ωΔωΔ
==
VV2
RF
CS4 ⋅⎟⎟
⎠
⎞⎜⎜⎝
⎛ωΔωΔ
=
Fig. 6)