Embed Size (px)
Citation preview
PJ'~ ~?bPy PJ'0It f!Jtadta P7 ~ 91Jeleclion mndP7uu/a~ F. E. Nathanson
J. Patrick Reilly The use of frequency agility in radar systems can reduce nulls in the radar cross section of complex targets and also reduce angle and range glint. How widely the frequencies must
be separated and how much can be gained in terms of improved detection and tracking capability are surveyed in this paper.
DESIGNERS OF MODERN RADAR SYSTEMS are showing great inte-rest in the use of frequency
agile waveforms. These waveforms are being used to circumvent the phenomenon of signal fading in the radar echoes from complex targets.
Complex targets, such as aircraft, appear as a set of discrete scattering centers situated at various distances from the radar. The echo strength from the composite target is the vector sum of the echoes from each scattering center: the phase of each vector component depends on the scatterer's range from the radar, and the magnitude of each vector component depends on its radar cross section (RCS). At certain target aspects, these vectors will combine in such a way that their sum is zero (or a small value), and thus there will be a "signal fade." Since the probability of the occurrence of a signal fade is significant, it is not reasonable to rely on detecting a target on the basis of a singl~ transmitted pulse. One means of coping with these signal fades is to average a series of echoes while the target's aspect is changing (this can occur as the target maneuvers, or as it. pitches and rolls). Some of the echoes will be of low strength, but the average, if taken over a sufficient length of time, will be relatively uniform. As an example, consider the reflected power from an idealized target consisting of a large set of scatterers, randomly oriented with respect to one another. For different orientations with respect to the radar, the total reflected power will vary. The probability density
2
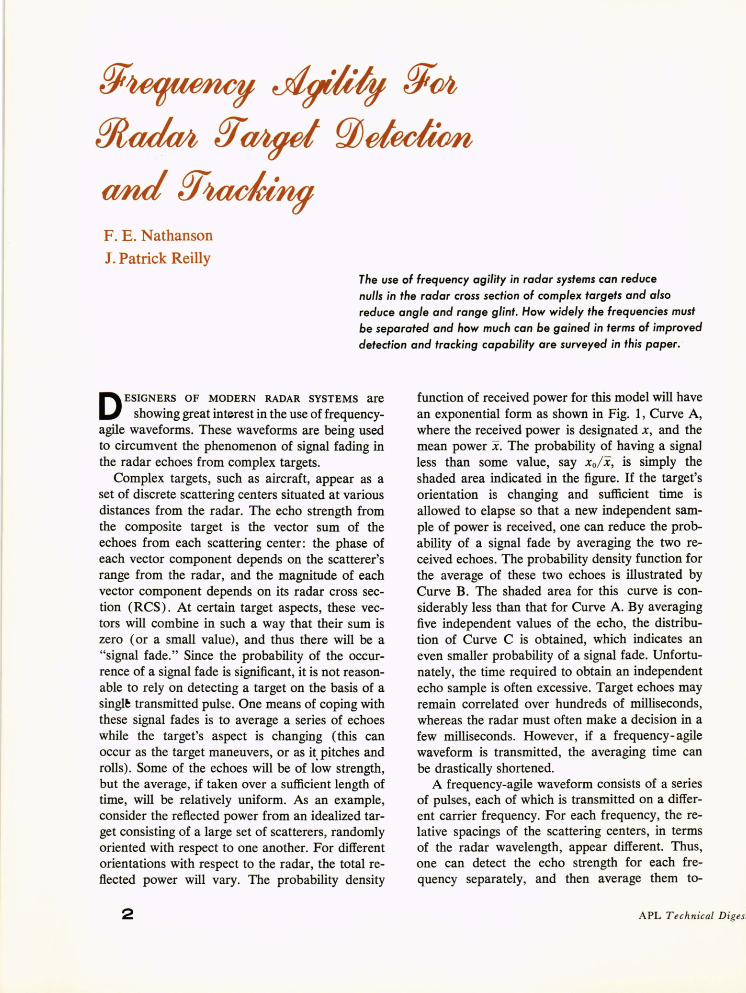
function of received power for this model will have an exponential form as shown in Fig. 1, Curve A, where the received power is designated x, and the mean power x. The probability of having a signa] less than some value, say xo/i, is simply the shaded area indicated in the figure. If the target's orientation is changing and sufficient time is allowed to elapse so that a new independent sample of power is received, one can reduce the probability of a signal fade by averaging the two received echoes. The probability density function for the average of these two echoes is illustrated by Curve B. The shaded area for this curve is considerably less than that for Curve A. By averaging five independent values of the echo, the distribution of Curve C is obtained, which indicates an even smaller probability of a signal fade. Unfortunately, the time required to obtain an independent echo sample is often excessive. Target echoes may remain correlated over hundreds of milliseconds, whereas the radar must often make a decision in a few milliseconds. However, if a frequency-agile waveform is transmitted, the averaging time can be drastically shortened.
A frequency-agile waveform consists of a series of pulses, each of which is transmitted on a different carrier frequency. For each frequency, the relative spacings of the scattering centers, in terms of the radar wavelength, appear different. Thus, one can detect the echo strength for each frequency separately, and then average them to-
APL Technical D igest
0.81--+----+-1-- -+-\---+---+----+-------1
x = RECEIVED POWER
0.6 I--t-I--Jl..----Tt-- -\- J ~ ~~Eit°'t{iR INDEPENDENT SAMPLES
0.4 ~."....-""""-+--"Irl---T-;.t----+----+------t
0.2 H-+--iI..-..f---+---+~~::-I----+-------1
0.5 1.0 1.5 2.0 2.5 3.0
NORMALIZED POWER (x/ x)
Fig. I-Probability density functions for the received power from: (A) a random array of scatterers (the shaded areas show the probability that the received power will be less than the value xo/x),(B) the average of two independent values of received power, and (C) the average of five independent values of received power.
gether. Since the carrier frequency can be shifted in a few microseconds, the required averaging time can be greatly reduced. The questions arise: How widely must the frequencies be separated, and how much will be gained in terms of improved detection and tracking performance? These are the questions to which this paper is directed.
Effects of Frequency Agility on Radar Target Detection and Tracking
A frequency agility (or "diversity") radar transmits several pulses on different carrier frequencies during a single look at the target. The received signals are envelope-detected and either lineadyintegrated or otherwise combined with some logic technique. While the diversity technique has been accepted in the communication field as a valuable tool for reducing fading losses, its benefits in radar are not always obvious. For detection and tracking radars, frequency agility can:
1. Reduce the probability that a target will have an aspect angle that gives a null in its radar cross section.
2. Reduce range and angle tracking errors caused by finite target extent (glint) and multipath effects.
3. Allow improvement in the target signal-toclutter fluctuations (SI C) for incoherent pulse radars.
July-August 1970
4. Deny an enemy the possibility of concentrating all of his jamming power at a single carrier frequency.
The first and second benefits result from the modification of the RCS distribution and will be discussed in this paper.
The most difficult targets to detect with high probability are those whose echoes fluctuate slowly. If such a target presents a null in cross section on a given pulse, its aspect may not change enough to increase the RCS on successively transmitted pulses during a single scan. It is in this situation that frequency agility can be of benefit.
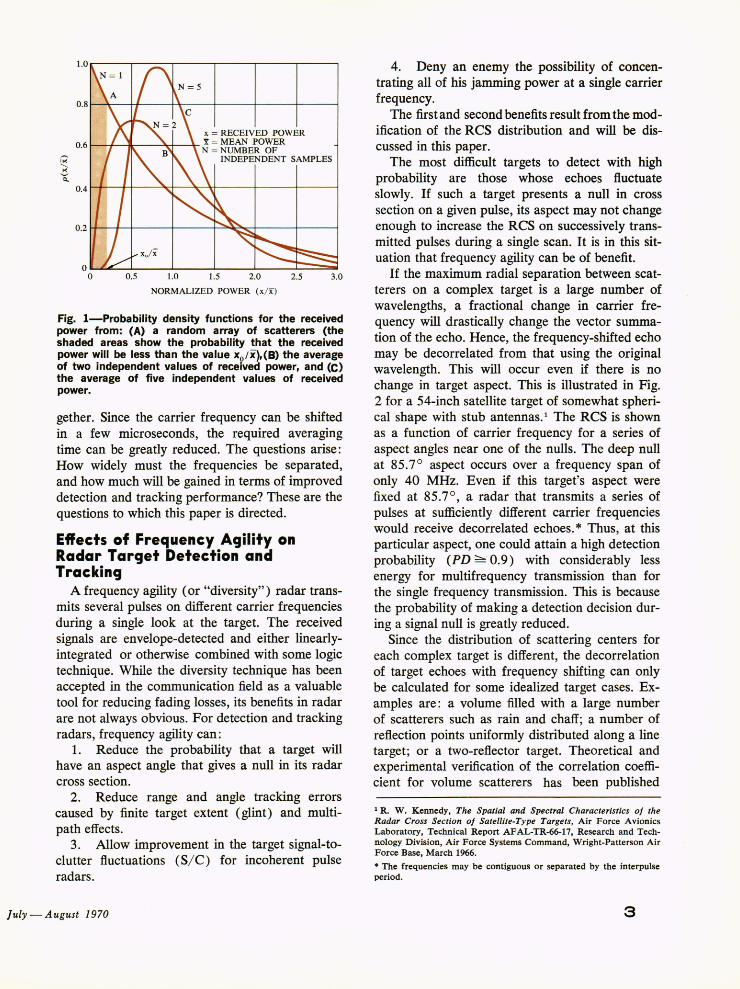
If the maximum radial separation between scatterers on a complex target is a large number of wavelengths, a fractional change in carrier frequency will drastically change the vector summation of the echo. Hence, the frequency-shifted echo may be decorrelated from that using the original wavelength. This will occur even if there is no change in target aspect. This is illustrated in Fig. 2 for a 54-inch satellite target of somewhat spherical shape with stub antennas. 1 The RCS is shown as a function of carrier frequency for a series of aspect angles near one of the nulls. The deep null at 85.7 0 aspect occurs over a frequency span of only 40 MHz. Even if this target's aspect were fixed at 85.7 0
, a radar that transmits a series of pulses at sufficiently different carrier frequencies would receive decorrelated echoes. * Thus, at this particular aspect, one could attain a high detection probability (PD:::::'" 0.9) with considerably less energy for multifrequency transmission than for the single frequency transmission. This is because the probability of making a detection decision during a signal null is greatly reduced.
Since the distribution of scattering centers for each complex target is different, the decorrelation of target echoes with frequency shifting can only be calculated for some idealized target cases. Examples are: a volume filled with a large number of scatterers such as rain and chaff; a number of reflection points uniformly distributed along a line target; or a two-reflector target. Theoretical and experimental verification of the correlation coefficient for volume scatterers has been publiShed
1 R. W. Kennedy, The Spatial and Spectral Characteristics of the Radar Cross Section of Satellite-Type Targets, Air Force Avionics Laboratory, Technical Report AFAL-TR-66-17, Research and Technology Division, Air Force Systems Command, Wright-Patterson Air Force Base, March 1966.
* The frequencies may be contiguous or separated by the interpulse period.
3
L
e 15
1 0° .---------~----------~----------~~
~ -6° r-------~~~--++~~ en U r:.:::
-IO° r---------~;_TT_T----_+----------_r~
- 14° r---------~_;~+_----_+----------_r~
- 1 8 ° r---------~--;r------_+----------~~
A FTE R KE NN EDY -22° ~ ________ ~ __________ ~ __________ ~~
10,000 10,080 10,160 10,240
FREQUENCY (MHz)
Fig. 2-Radar cross section versus frequency near a null for a 54·inch satellite.
previously. 2 ,3 For uniformly distributed reflecting points along a line target of length L, Birkemeier and Wallace4 have shown that the correlation coefficient (p) of the square-law detected echoes is:
(ill) = sin2 [27Tilf(L sinO) I c] P [27Tilj(L sinO ) / c)2'
where
ill = carrier frequency shift, L sinO = projection of target length onto radial
dimension, and c = velocity of light.
This equation assumes that the pulse length, cr/ 2, is greater than the projection of the target extent on the radar line of sight, L sinO. They also define a critical frequency shift (ill c) that yields the first zero of p (ill) and hence one definition of "decorrelation: "
2 F. E. Nathanson and J . P. Reilly, Radar Precipitation Echoes, APL/ JHU TG-899, Apr. 1967 (also IEEE Trans. Aerospace and E lectronic Systems AES-4, Jui. 1968, 505-514). 3 F . E. Nathanson and J. P . Reilly, " Clutter Statistics that Affect Radar Performance Analysis," IEEE EASTCON, supplement to IEEE Trans. Aerospace and Electronic Systems AES·3, Nov. 1967, 386-398.
4 W. P . Birkemeier and N . D. Wallace, " Radar Tracking Accuracy Improvement by Means of Pulse-to-Pulse Frequency Modulation," AlEE Trans. Communication and Electronics 81, Jan. 1963, 571-575.
4
il c = c = ~ = 150 ~Hz f 2L sinO 2Lo tgt. length m meters
where Lo is defined as the effective radial extent of the scatterers. The term c/ 2Lo can be seen to be the inverse of the radial target extent in radar time. Since c <= 3 X 10⁸ ml sec, the critical frequency shift is 150 MHz divided by effective target length in meters, and the 50% correlation point occurs at 67 MHzI Lo. Ray,5 using a different criterion, suggests that 45 MHzI Lo is sufficient for decorrelation. Gaheen, McDonough, and Tice6
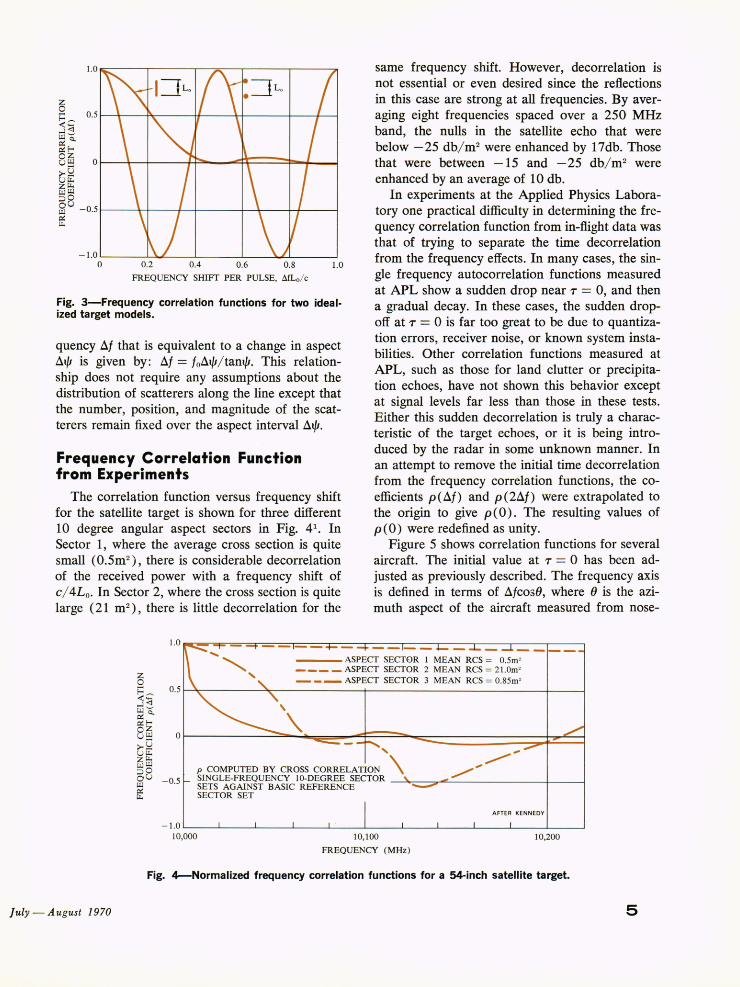
suggest that 75 MHzI Lo is adequate (for a correlation coefficient of 0.4). Since most targets are not a large collection of linearly distributed scatterers, these values may not result in completely decorrelated returns from a target at all aspects. However, they should be sufficient to fill in the deep nulls. For example, if the target consists of two equal-strength point reflectors having a nominal radial separation L o, the squar:e-Iaw detected echoes will have a frequency correlation function:
p(ilf) = COS(47TilILo/ c) .
For this two-point target, a frequency shift of only 37.5 MHz per meter of target length is sufficient to fill in a deep null in the signal intensity, although subsequent frequency shifted pulses will not give any additional independent information. The frequency correlation functions for these two idealized target models are contrasted in Fig. 3.
Clarke7 related the frequency correlation function to the temporal correlation function for a line target undergoing uniform rotation rate tjJ :
p ( 'T; ill) = P (T - T' ; 0) ,
where T' = (ill tamp I f o~ ), and I/J is the angle between the plane perpendicular to the radar line of sight and the target. This relationship shows that a certain degree of decorrelation may be obtained by either shifting the frequency or by allowing the target to change its aspect. The change in fre-
5 Howard Ray, " Improving Radar Range and Angle Detection with Frequency Agility," 11th Annual East Coast Conference on Aerospace and Navigational Electronics, IEEE, Baltimore, Oct. 21- 23, 1964, 1.3.6-1-1.3.6-7.
GA. F . Gaheen, J. McDonough, and D . P . Tice, Frequency Diversity Radar Study, Vol. 1, " Experimental Verification of Frequency and Polarization Diversity on the Statistics of the Radar Cross Section of Satellite Targets," Westinghouse Electric Corporation, F eb. 11, 1966.
7 A. S. Clarke, Target Noise Reduction by Pulse-to-Pulse Frequency Shil ting (Non-Coherent Processing), Hughes Aircraft Company, Aerospace Group, TM-893, Nov. 1967.
APL Technical D igest
1.0 ~----,--------,~=------,----.----~
- 1.0'---__ --'---""""-_---'-_ _ ------' __ __.-'-------' o 0.2 0.4 0.6 0.8 1.0
FREQUENCY SHIFT PER PULSE, MLo/ c
Fig. 3-Frequency correlation functions for two idealized target models.
quency ill that is equivalent to a change in aspect ilt/J is given by: ill = loilt/J/ tant/J. This relationship does not require any assumptions about the distribution of scatterers along the line except that the number, position, and magnitude of the scatterers remain fixed over the aspect interval ilt/J.
Frequency Correlation Function from Experiments
The correlation function versus frequency shift for the satellite target is shown for three different 10 degree angular aspect sectors in Fig. 41
• In Sector 1, where the average cross section is quite small (0.5m2) , there is considerable decorrelation of the received power with a frequency shift of c/ 4Lo. In Sector 2, where the cross section is quite large (21 m 2), there is little decorrelation for the
same frequency shift. However, decorrelation is not essential or even desired since the reflections in this case are strong at all frequencies. By averaging eight frequencies spaced over a 250 MHz band, the nulls in the satellite echo that were below -25 db/ m2 were enhanced by 17db. Those that were between -15 and -25 db/ m2 were enhanced by an average of 10 db.
In experiments at the Applied Physics Laboratory one practical difficulty in determining the frequency correlation function from in-flight data was that of trying to separate the time decorrelation from the frequency effects. In many cases, the single frequency autocorrelation functions measured at APL show a sudden drop near T = 0, and then a gradual decay. In these cases, the sudden dropoff at T = 0 is far too great to be due to quantization errors, receiver noise, or known system instabilities. Other correlation functions measured at APL, such as those for land clutter or precipitation echoes, have not shown this behavior except at signal levels far less than those in these tests. Either this sudden decorrelation is truly a characteristic of the target echoes, or it is being introduced by the radar in some unknown manner. In an attempt to remove the initial time decorrelation from the frequency correlation functions, the coefficients p (ill) and p (2ill) were extrapolated to the origin to give p (0). The resulting values of p(O) were redefined as unity.
Figure 5 shows correlation functions for several aircraft. The initial value at T = 0 has been adjusted as previously described. The frequency axis is defined in terms of il/cos(}, where .() is the azimuth aspect of the aircraft measured from nose-
0.5 ~~-----'\~------+------------_+_-__I
July-August 1970
- 0.5
P COMPUTED BY CROSS CORRELA nON " \ ~,. ~.; SINGLE-FREQUENCY lO-DEGREE SECTOR -~---::;~'---------t---i SETS AGAINST BASIC REFERENCE SECTOR SET
- 1.0 '------'---'--_---'-__ -'--_---'-__ -'--_--'-__ -'--_---'-__ --1--_------'
10,000 10,100
FREQUENCY (MHz)
10,200
Fig. 4--Normalized frequency correlation functions for a 54-inch satellite target.
5

~ Q..
f-< Z ~
U ~ ~ 0 U Z 0 E=: <C ....J ~
~ 0 U
>< U Z ~ ::> 0
~
O.S 1-----+---
0
1.0
O.S
0
1.0
O.S ~-----"',..-4--+L---+------l
2 4 6
~f COS 8 (MHz)
ASPECT RANGE 8 = 29°_75 ° FROM NOSE
(a) SMALL PROPELLER AIRCRAFT
ASPECT RANGE 8 = 41 °_61 ° FROM NOSE
(b) MEDIUM SIZE AIRCRAFT
ASPECT RANGE 8 = 41 °_62° FROM NOSE
( c ) JET AIRCRAFT
Fig. 5--Frequency correlation for aircraft returns.
on. The factor cosO is introduced to compensate for the fact that the effective target length ' is proportional to cosO. The type of aircraft indicated are guesses based on target's speed, altitude, and a poor telescope image (the weather was quite hazy the day the data were taken). The functions show that large aircraft tend to decorrelate faster than do small ones, but there is still considerable scatter of the data. Although these correlation data drop off somewhat more rapidly than the linear array model of Fig. 3, there is still reasonable agreement. Unfortunately, almost no data were collected for near nose-on aspects. Before definitive conclusions can be drawn from these data, further experiments are required at other aspects, with wider bandwidths, and with controlled aircraft and flight paths.
Detectability Improvements Using Frequency Diversity
If the single-frequency target fluctuation model is known, the improvement in detectability for N
6
pulses can be determined from the appropriate Swerling curves 8 (standard radar detection probability curves). These curves are defined in terms of "Swerling Cases" 1 to 4, which refer to the statistical distribution of the echo and its rate of fluctuation. For example, Swerling Case 1 applies to the exponential power model of Fig. 1, Curve A, when the fluctuation rate is very slow (all echoes are completely correlated within the pulse group comprising a single scan). Swerling Case 2 applies to the exponential model when echoes are statistically .independent from one pulse to the next. Cases 3 and 4 apply to a target with a dominant reflector plus smaller reflectors, the Case 3 statistics applying to completely correlated echoes, and Case 4 applying to completely independent echoes. Without frequency agIlity and with integration times that are short compared to the correlation time of the target echoes, Case 1 or Case 3 curves should be used. If the frequency shift of the agility radar is sufficient to decorrelate the target echoes, Case 2 or 4 curves for N pulses integrated should be used. The improvement in detectability is the difference in the required signal-to-noise ratio (S I N) between the two sets. For partially decorrelated target echoes, N should be replaced with the number of independent target echoes (Nd·
>< A 0.99 Ib '-b
f-< <C ::t f-<
>< f-< ::i 0.90
~ ill 0 e::: ~
AFTER GAHEEN ET AL
X (square meters )
Fig. 6-Missile target cross-section distribution versus bandwidth for 16 frequency increments. Missile length equals 150 inches.
8 J. I. Marcum and P. Swerling, "A Statistical Theory of Target Detection by Pulsed Radar," IRE Trans. Information Theory 1T-6, Apr. 1960, 5~267.
APL Technical Digest
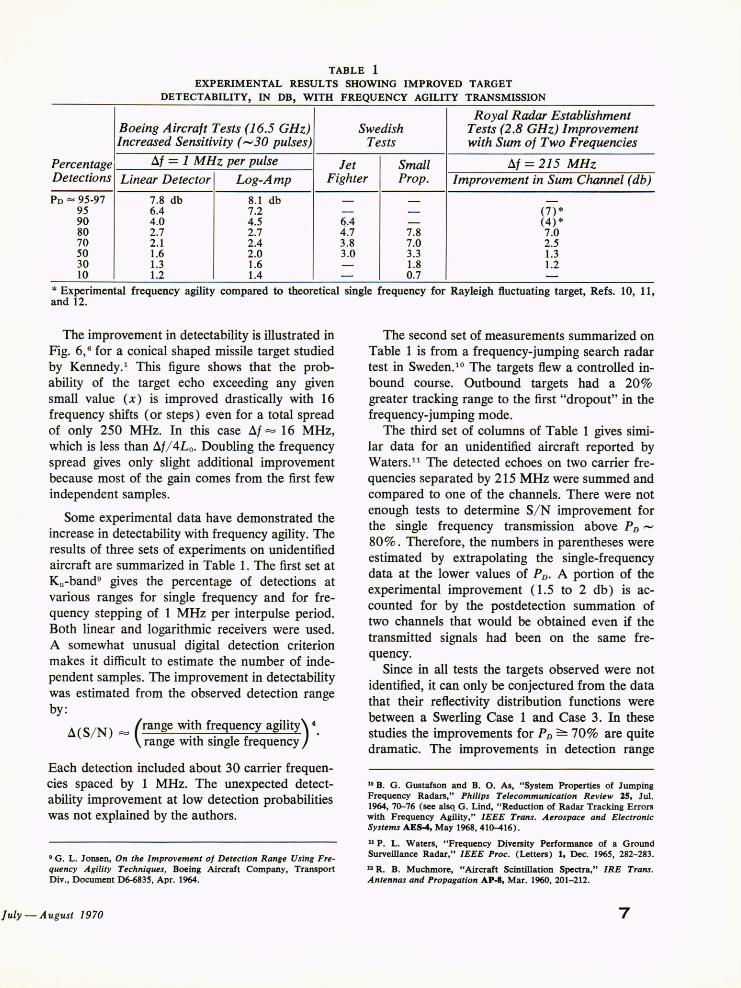
TABLE 1 EXPERIMENTAL RESULTS SHOWING IMPROVED TARGET
DETECTABILITY, IN DB, WITH FREQUENCY AGILITY TRANSMISSION
Royal Radar Establishment Boeing Aircralt Tests (16.5 GHz) Swedish Tests (2.8 GHz) Improvement Increased Sensitivity (,...,30 pulses) Tests with Sum 01 Two Frequencies
Percentage III = 1 MHz per pulse Jet Small III = 215 MHz Detections Linear Detector Log-Amp Fighter Prop. Improvement in Sum Channel (db)
PD = 95-97 7.8 db 8.1 db - - -95 6.4 7.2 - - (7) * 90 4.0 4.5 6.4 - (4)* 80 2.7 2.7 4.7 7.8 7.0 70 2.1 2.4 3.8 7.0 2.5 50 1.6 2.0 3.0 3.3 1.3 30 1.3 1.6 - 1.8 1.2 10 1.2 1.4 - 0.7 -
* Experimental frequency agility compared to theoretical single frequency for Rayleigh fluctuating target, Refs. 10, 11, and 12.
The improvement in detectability is illustrated in Fig. 6,6 for a conical shaped missile target studied by Kennedy.l This figure shows that the probability of the target echo exceeding any given small value (x) is improved drastically with 16 frequency shifts (or steps) even for a total spread of only 250 MHz. In this case III = 16 MHz, which is less than IlI/ 4Lo. Doubling the frequency spread gives only slight additional improvement because most of the gain comes from the first few independent samples.
Some experimental data have demonstrated the increase in detectability with frequency agility. The results of three sets of experiments on unidentified aircraft are summarized in Table 1. The first set at Ku-band9 gives the percentage of detections at various ranges for single frequency and for frequency stepping of 1 MHz per interpulse period. Both linear and logarithmic receivers were used. A somewhat unusual digital detection criterion makes it difficult to estimate the number of independent samples. The improvement in detectability was estimated from the observed detection range by:
Il(S/ N) = (range wi.th f~equency agility) 4.
range With smgle frequency
Each detection included about 30 carrier frequencies spaced by 1 MHz. The unexpected detectability improvement at low detection probabilities was not explained by the authors.
9 G. L. Jonsen, On the Improvement oj Detection Range Using Frequency Agility Techniques, Boeing Aircraft Company, Transport Div., Document D6-6835, Apr. 1964.
July-August 1970
The second set of measurements summarized on Table 1 is from a frequency-jumping search radar test in Sweden.10 The targets flew a controlled inbound course. Outbound targets had a 20% greater tracking range to the first "dropout" in the frequency-jumping mode.
The third set of columns of Table 1 gives similar data for an unidentified aircraft reported by Waters.11 The detected echoes on two carrier frequencies separated by 215 MHz were summed and compared to one of the channels. There were not enough tests to determine SI N improvement for the single frequency transmission above P D ,...,
80%. Therefore, the numbers in parentheses were estimated by extrapolating the single-frequency data at the lower values of PD' A portion of the experimental improvement (1.5 to 2 db) is accounted for by the postdetection summation of two channels that would be obtained even if the transmitted signals had been on the same frequency.
Since in all tests the targets observed were not identified, it can only be conjectured from the data that their reflectivity distribution functions were between a Swerling Case 1 and Case 3. In these studies the improvements for P D ~ 70% are quite dramatic. The improvements in detection range
10 B. G. Gustafson and B. O. As, "System Properties of Jumping Frequency Radars," Philips Telecommunication Review 15, JuI. 1964, 70-76 (see alsq G. Lind, "Reduction of Radar Tracking Errors with Frequency Agility," IEEE Trans. Aerospace and Electronic Systems AES-4, May 1968,410-416).
11 P. L. Waters, "Frequency Diversity Performance of a Ground Surveillance Radar," IEEE Proc. (Letters) 1, Dec. 1965, 282-283.
12 R. B. Muchmore, "Aircraft Scintillation Spectra," IRE Trans. Antennas and Propagation AP-8, Mar. 1960,201-212.
7
(expressed in db) may be determined by dividing the detectability improvements of Table 1 by 4. Similar improvements are expected for satellite and missile targets. Improvements from frequency agility will be considerably less if the targets fluctuate during a single scan or if only the cumulative detection probability need be high (PD per scan is low).
Glint Reduction with Frequency Diversity
Angle and range "glint" errors will also be reduced with frequency agility, but it is more difficult to quantify the expected improvement. If the target can be represented by a line of scatterers perpendicular to the line of sight, there will be a "time-correlated" angle error signal for a single frequency radar with the spectral energy of the error signal concentrated near zero frequency. (Receiver noise and fading errors are neglected in this discussion.) Since the time constants of angle tracking loops are generally quite long, the angle error signals will follow the slowly varying phase front of the complex target echo. Frequency agility essentially spreads the "glint" spectral energy outside the angle servo bandwidth. Another way of viewing this effect is that frequency agility allows a number of independent samples of the angle of arrival to be averaged within the pass-band of the angle servos. 6 Methods of analysis of the reduction in angle error variance are given by Birkemeier and Wallace4 and Ray. 5 Under certain conditions the maximum reduction in the angle error variance caused by glint can equal the number of frequencies transmitted. This assumes that the separation between adjacent frequencies is greater than cl 2L cosO.
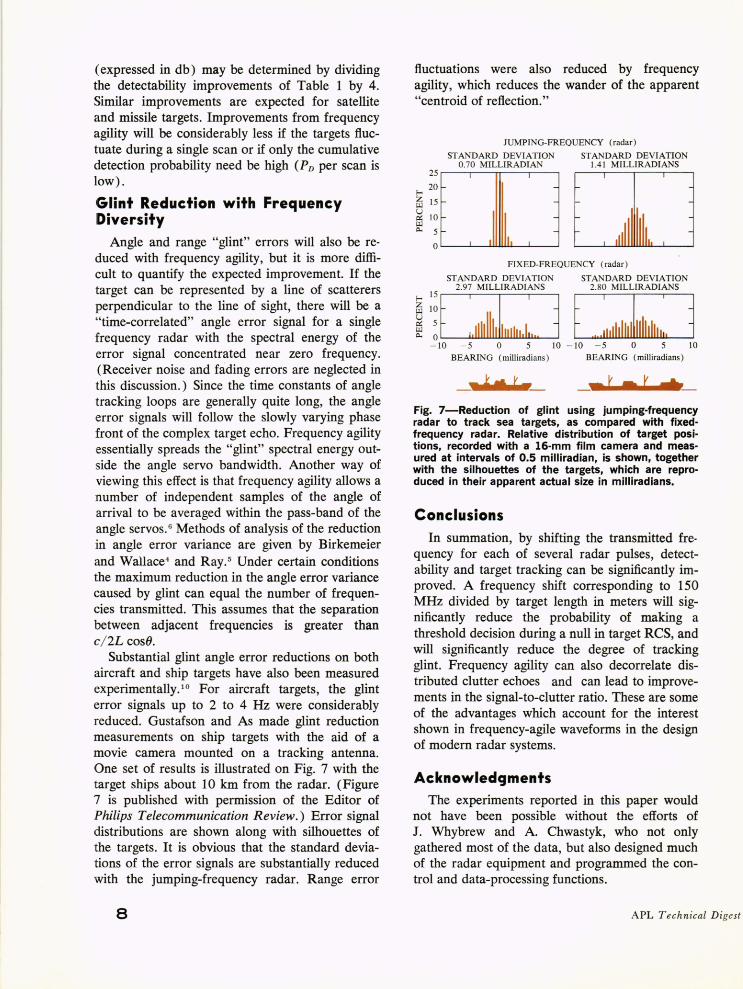
Substantial glint angle error reductions on both aircraft and ship targets have also been measured experimentally. 10 For aircraft targets, the glint error signals up to 2 to 4 Hz were considerably reduced. Gustafson and As made glint reduction measurements on ship targets with the aid of a movie camera mounted on a tracking antenna. One set of results is illustrated on Fig. 7 with the target ships about 10 km from the radar. (Figure 7 is published with permission of the Editor of Philips Telecommunication Review.) Error signal distributions are shown along with silhouettes of the targets. It is obvious that the standard deviations of the error signals are substantially reduced with the jumping-frequency radar. Range error
8
fluctuations were also reduced by frequency agility, which reduces the wander of the apparent "centroid of reflection."
JUMPING-FREQUENCY (radar)
ST ANDARD DEVIA TIO STANDARD DEVIATION 0.70 MILLIRADIA 1.41 MILLIRADIANS
25
f-< 20
Z 15 UJ u ~ 10 UJ Q.. 5
0
FIXED-FREQUE CY (radar )
STANDARD DEVIATIO STANDARD DEVIATION 2.97 MILLIRADIANS 2.80 MILLIR ADIANS
f-<
:~~ :,111111111111111101:,,, ~ ~ , ,:llIhllllllllhllll:, ]
z UJ U ~ UJ Q..
-10 - 5 0 5 10 - 10 - 5 0 \0
BEARING (mill iradians ) BEARING (mill iradians)
TV • r rt
Fig. 7-Reduction of glint using jumping-frequency radar to track sea targets, as compared with fixedfrequency radar. Relative distribution of target positions, recorded with a 16-mm film camera and measured at intervals of 0.5 milliradian, is shown, together with the silhouettes of the targets, which are reproduced in their apparent actual size in milliradians.
Conclusions In summation, by shifting the transmitted fre
quency for each of several radar pulses, detectability and target tracking can be significantly improved. A frequency shift corresponding to 150 MHz divided by target length in meters will significantly reduce the probability of making a threshold decision during a null in target RCS, and will significantly reduce the degree of tracking glint. Frequency agility can also decorrelate distributed clutter echoes and can lead to improvements in the signal-to-clutter ratio. These are some of the advantages which account for the interest shown in frequency-agile waveforms in the design of modern radar systems.
Acknowledgments The experiments reported in this paper would
not have been possible without the efforts of J. Whybrew and A. Chwastyk, who not only gathered most of the data, but also designed much of the radar equipment and programmed the control and data-processing functions.
APL Technical D igest


![Краткое623/ PJ-662/PJ-663 PJ-622/PJ- принтерdownload.brother.com/welcome/docp100003/cv_pj600_rus_qrg_lbd103001.pdfпункты [Пуск], [Панель управления],](https://img.pdfslide.net/doc/110x75/5f93025305e3fc02e51ef56b/623-pj-662pj-663-pj-622pj-f-f.jpg)


![PJ-700 Series - Brother Romania · PJ-722 PJ-723 PJ-762 PJ-763 PJ-773 203 x 200dpi 300 x 300dpi Direct thermal Ave.: 8ppm (under Brother standard environment) [1] Manual paper feed](https://img.pdfslide.net/doc/110x75/6011125cfd957b084207e3b2/pj-700-series-brother-romania-pj-722-pj-723-pj-762-pj-763-pj-773-203-x-200dpi.jpg)