Embed Size (px)
Citation preview

Version 2.0.
pKa Estimator Elite™
User Manual
pKa Analysis Software for Capillary Electrophoresis
pKa Estimator Elite™ Software Manual. Version 2.0. Copyright 2005. CombiSep, Inc.
ii
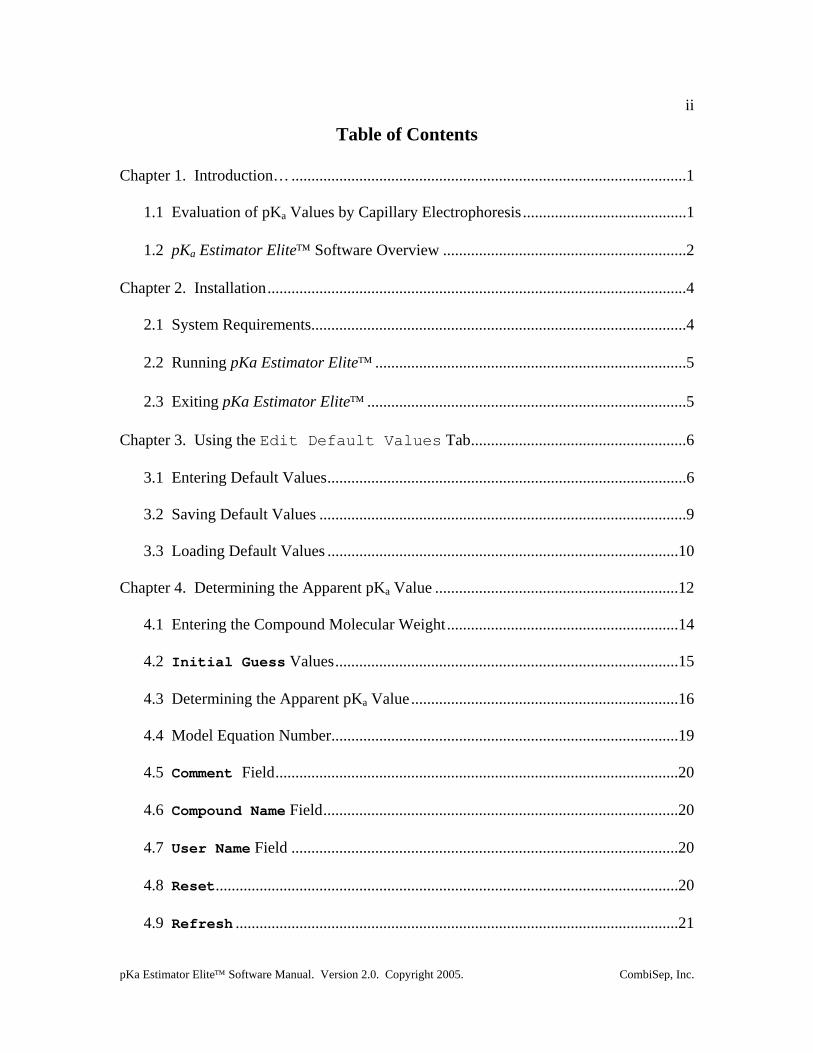
Table of Contents
Chapter 1. Introduction… ...................................................................................................1
1.1 Evaluation of pKa Values by Capillary Electrophoresis .........................................1
1.2 pKa Estimator Elite™ Software Overview .............................................................2
Chapter 2. Installation.........................................................................................................4
2.1 System Requirements..............................................................................................4
2.2 Running pKa Estimator Elite™ ..............................................................................5
2.3 Exiting pKa Estimator Elite™ ................................................................................5
Chapter 3. Using the Edit Default Values Tab......................................................6
3.1 Entering Default Values..........................................................................................6
3.2 Saving Default Values ............................................................................................9
3.3 Loading Default Values ........................................................................................10
Chapter 4. Determining the Apparent pKa Value .............................................................12
4.1 Entering the Compound Molecular Weight..........................................................14
4.2 Initial Guess Values......................................................................................15
4.3 Determining the Apparent pKa Value...................................................................16
4.4 Model Equation Number.......................................................................................19
4.5 Comment Field.....................................................................................................20
4.6 Compound Name Field.........................................................................................20
4.7 User Name Field .................................................................................................20
4.8 Reset....................................................................................................................20
4.9 Refresh ...............................................................................................................21
pKa Estimator Elite™ Software Manual. Version 2.0. Copyright 2005. CombiSep, Inc.
iii
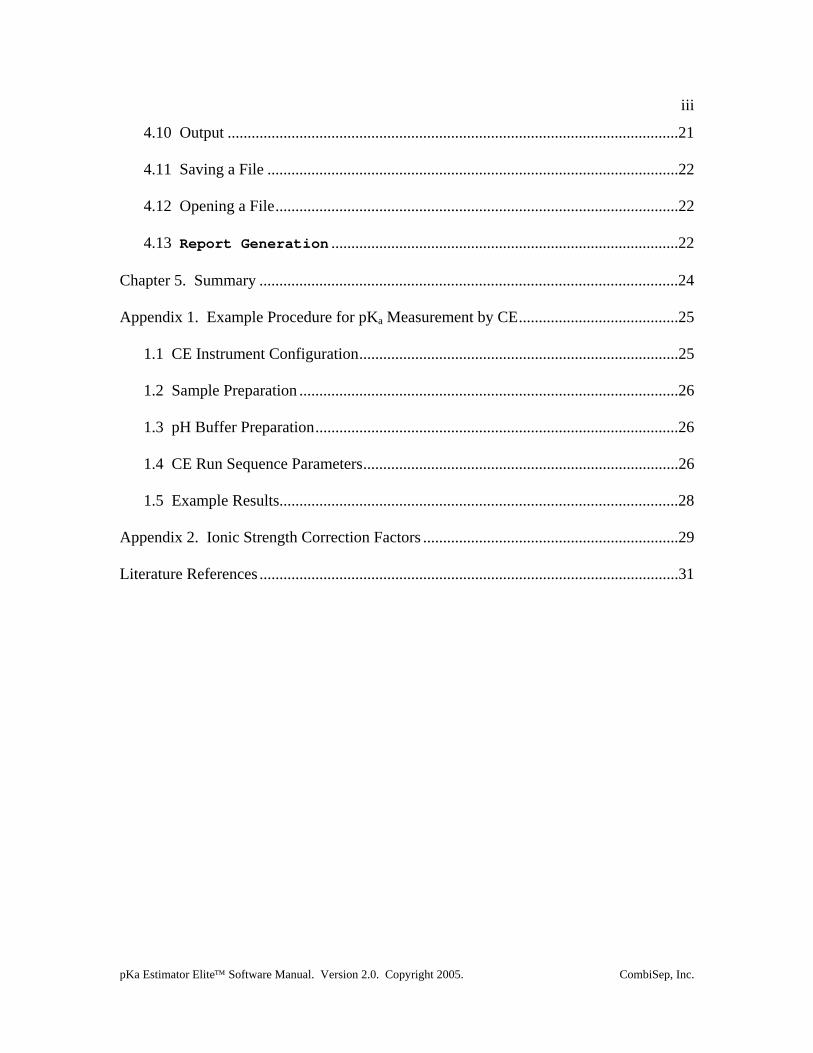
4.10 Output .................................................................................................................21
4.11 Saving a File .......................................................................................................22
4.12 Opening a File.....................................................................................................22
4.13 Report Generation .......................................................................................22
Chapter 5. Summary .........................................................................................................24
Appendix 1. Example Procedure for pKa Measurement by CE........................................25
1.1 CE Instrument Configuration................................................................................25
1.2 Sample Preparation ...............................................................................................26
1.3 pH Buffer Preparation...........................................................................................26
1.4 CE Run Sequence Parameters...............................................................................26
1.5 Example Results....................................................................................................28
Appendix 2. Ionic Strength Correction Factors ................................................................29
Literature References .........................................................................................................31
pKa Estimator Elite™ Software Manual. Version 2.0. Copyright 2005. CombiSep, Inc.
iv
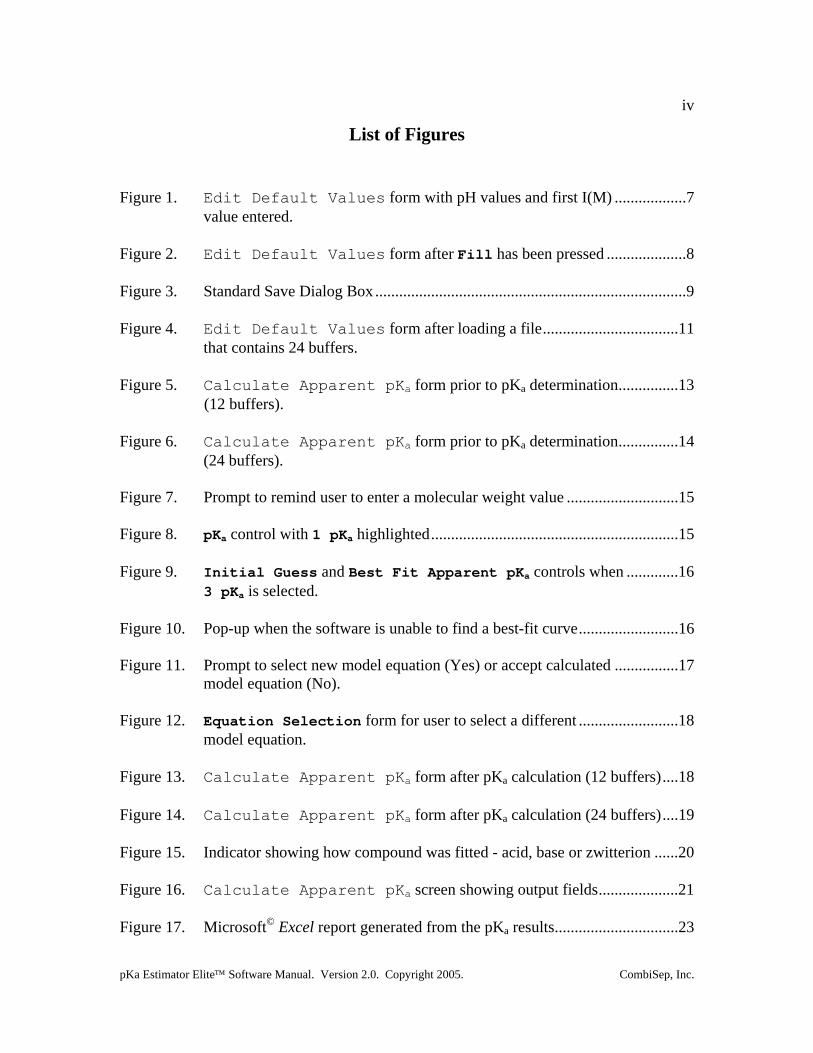
List of Figures
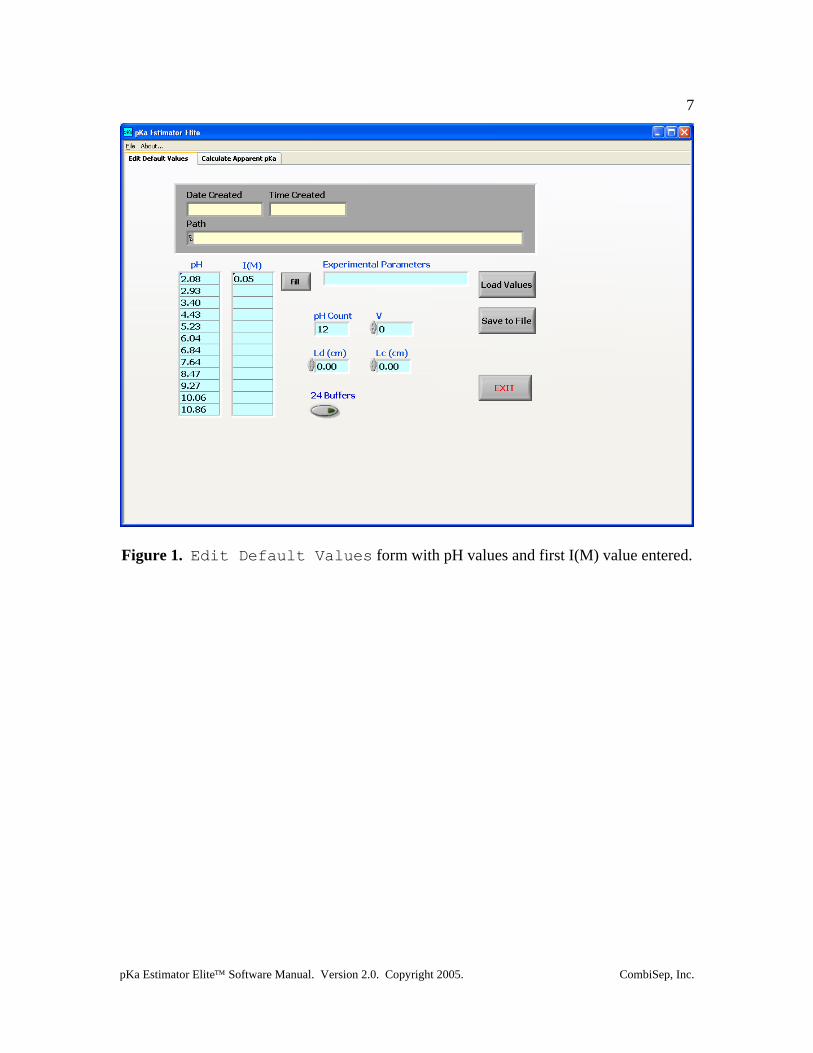
Figure 1. Edit Default Values form with pH values and first I(M) ..................7 value entered.
Figure 2. Edit Default Values form after Fill has been pressed ....................8
Figure 3. Standard Save Dialog Box ..............................................................................9
Figure 4. Edit Default Values form after loading a file..................................11 that contains 24 buffers.
Figure 5. Calculate Apparent pKa form prior to pKa determination...............13 (12 buffers).
Figure 6. Calculate Apparent pKa form prior to pKa determination...............14 (24 buffers).
Figure 7. Prompt to remind user to enter a molecular weight value ............................15
Figure 8. pKa control with 1 pKa highlighted..............................................................15
Figure 9. Initial Guess and Best Fit Apparent pKa controls when .............16 3 pKa is selected.
Figure 10. Pop-up when the software is unable to find a best-fit curve.........................16 Figure 11. Prompt to select new model equation (Yes) or accept calculated ................17 model equation (No).
Figure 12. Equation Selection form for user to select a different .........................18 model equation.
Figure 13. Calculate Apparent pKa form after pKa calculation (12 buffers)....18 Figure 14. Calculate Apparent pKa form after pKa calculation (24 buffers)....19 Figure 15. Indicator showing how compound was fitted - acid, base or zwitterion ......20 Figure 16. Calculate Apparent pKa screen showing output fields....................21
Figure 17. Microsoft© Excel report generated from the pKa results...............................23
pKa Estimator Elite™ Software Manual. Version 2.0. Copyright 2005. CombiSep, Inc.
v
List of Tables
Table 1. Instrument Configuration for pKa Measurement by CE ...............................25 Table 2. Approximate CE Run Parameters for Generic CE pKa Method...................27
Table 3. Experimental Results for pKa Determination by CE ....................................28
Table 4. Ionic Strength Corrections (Apparent pKa to Thermodynamic pKa)............30

pKa Estimator Elite™ Software Manual. Version 2.0. Copyright 2005. CombiSep, Inc.
vi
Document Notation
Within this document the following conventions are used:
Courier New : Used to denote file path names and form names in
CombiSep’s pKa Estimator Elite™ software.
Italics: Software names, File names and extensions are denoted with
italics.
bold, Courier New: Used to denote Windows™ commands and names of fields
and buttons in pKa Estimator Elite™.
General Software Information
Throughout the software, fields with a blue background are fields that require user
input. Fields with a yellow background are fields that the software will use to display
computed values. For example, in Figure 1, the Date Created, Time Created and
Path fields will be filled in by the software. The other fields shown require user input.
pKa Estimator Elite™ Software Manual. Version 2.0. Copyright 2005. CombiSep, Inc.
1
1. Introduction
1.1 Evaluation of pKa Values by Capillary Electrophoresis
The acid dissociation constant (pKa value) of an ionizable compound is defined as
the pH value at which the dissociated and undissociated species are of equal equilibrium
concentration, and is a fundamental physicochemical property that strongly influences
many properties. For example, the neutral form of the compound is less water soluble,
more lipophilic, and possesses higher membrane permeability than the ionized form.
Experimental knowledge of compound pKa values provides a measure of the extent of
compound ionization across the pH range of pharmaceutical relevance, and is highly
beneficial for predicting compound absorption, distribution, metabolism, and excretion
(ADME) properties. The pKa value also plays an important role in the development of
drug delivery formulations.
Over the past decade, capillary electrophoresis (CE) has emerged as a valuable tool
for the evaluation of compound pKa values, as it possesses many favorable qualities:
• Potential impurities and degradants can be separated from the target compound
• Intimate knowledge of sample concentration is not required for analysis
• Sparingly soluble compounds with a suitable UV chromophore can be analyzed
• No changes in spectral properties are required for detection of a pKa value
• Minimal sample amounts are required for analysis (µg amounts)
Numerous publications have appeared describing the use of CE for pKa analysis
including a recent review [1]. Several of these references are listed at the end of this
pKa Estimator Elite™ Software Manual. Version 2.0. Copyright 2005. CombiSep, Inc.
2
manual. Users are encouraged to study these articles to improve their knowledge of CE-
based pKa analysis, and best understand the strengths and limitations of the technique.
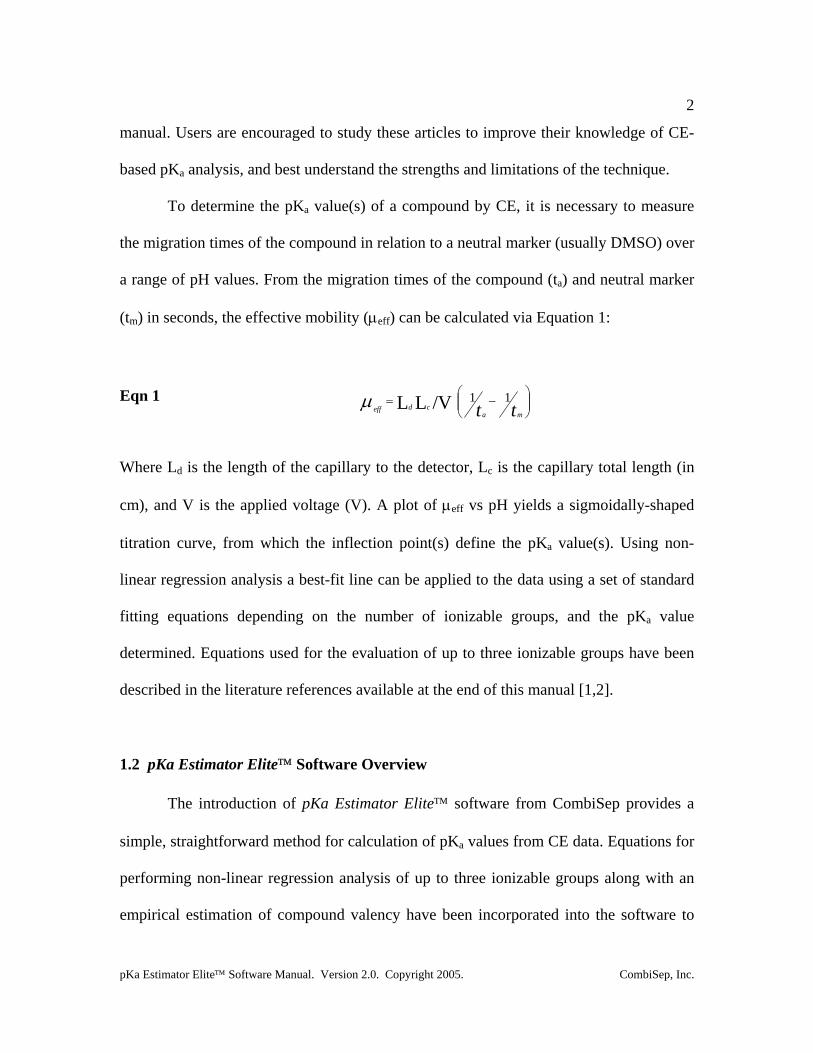
To determine the pKa value(s) of a compound by CE, it is necessary to measure
the migration times of the compound in relation to a neutral marker (usually DMSO) over
a range of pH values. From the migration times of the compound (ta) and neutral marker
(tm) in seconds, the effective mobility (µeff) can be calculated via Equation 1:
Eqn 1 ⎟⎟⎠
⎞⎜⎜⎝
⎛−= tt ma
cdeff11/VLLµ
Where Ld is the length of the capillary to the detector, Lc is the capillary total length (in
cm), and V is the applied voltage (V). A plot of µeff vs pH yields a sigmoidally-shaped
titration curve, from which the inflection point(s) define the pKa value(s). Using non-
linear regression analysis a best-fit line can be applied to the data using a set of standard
fitting equations depending on the number of ionizable groups, and the pKa value
determined. Equations used for the evaluation of up to three ionizable groups have been
described in the literature references available at the end of this manual [1,2].
1.2 pKa Estimator Elite™ Software Overview
The introduction of pKa Estimator Elite™ software from CombiSep provides a
simple, straightforward method for calculation of pKa values from CE data. Equations for
performing non-linear regression analysis of up to three ionizable groups along with an
empirical estimation of compound valency have been incorporated into the software to
pKa Estimator Elite™ Software Manual. Version 2.0. Copyright 2005. CombiSep, Inc.
3
simplify data analysis. All that is required of the user is to enter the migration times of the
compound being evaluated and the neutral marker, compound molecular weight, and
experimental information regarding capillary lengths and voltage. The pKa Estimator
Elite™ program then generates a plot of µeff vs pH, and using a previously described
empirical relationship between µeff and molecular weight [2], determines which
ionization equation best fits the data. A best-fit line is then plotted and the apparent pKa
value (pKa’) is displayed, along with a goodness of fit (R2 value). Version 2.0 of pKa
Estimator Elite™ provides additional reporting capabilities. Comments describing the
experiment can be entered and saved with the pKa result, along with entries for the
compound name and analyst name. Report generation capabilities have been added
allowing the user to generate a printable Excel-based report. The single page report
contains all pertinent experimental information and results and also contains a field for
the user to paste in a compound structure image file if desired. The Excel format provides
a means to export the numerical results to a user defined database and better archive
experimental results.
By utilizing the automated capabilities of pKa Estimator Elite™, users can save
valuable time and resources otherwise required for data analysis of pKa values by CE.
The remainder of the manual provides the user a complete description of the various
functions and operations of the pKa Estimator Elite™ software. At the end of the manual,
a generic experimental CE protocol with example results is described for collecting
migration time data necessary for pKa determination.
pKa Estimator Elite™ Software Manual. Version 2.0. Copyright 2005. CombiSep, Inc.
4
Chapter 2. Installation
2.1 System Requirements
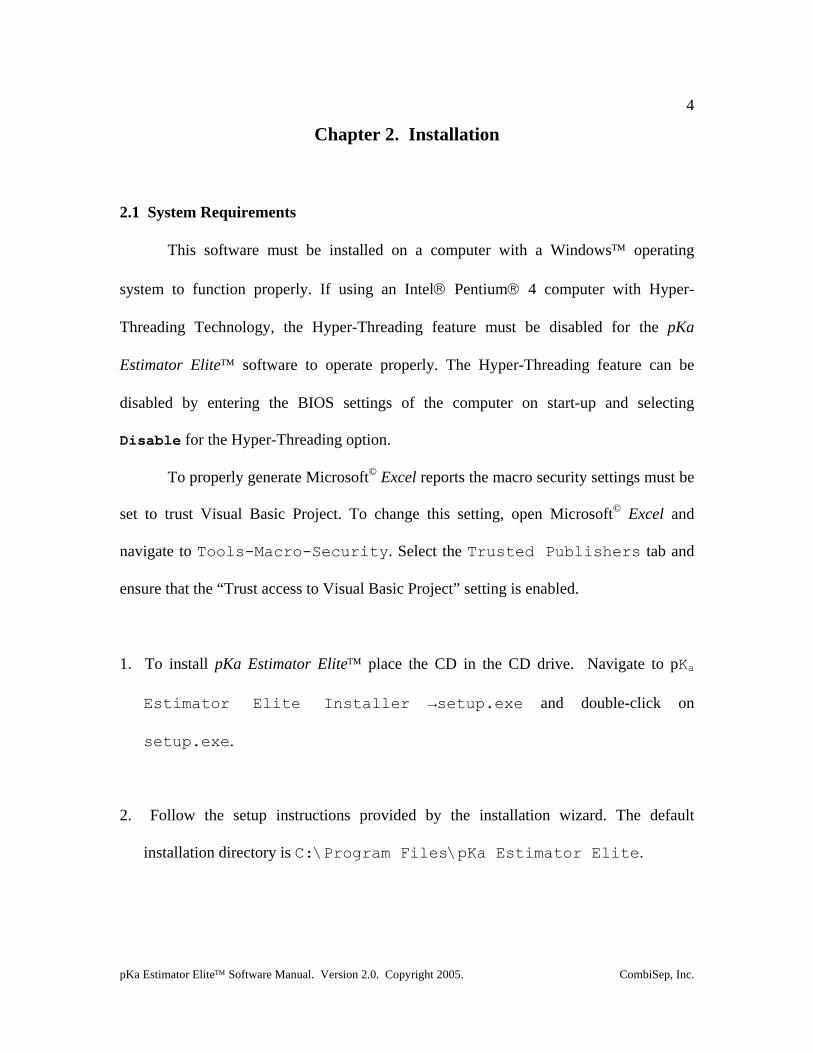
This software must be installed on a computer with a Windows™ operating
system to function properly. If using an Intel® Pentium® 4 computer with Hyper-
Threading Technology, the Hyper-Threading feature must be disabled for the pKa
Estimator Elite™ software to operate properly. The Hyper-Threading feature can be
disabled by entering the BIOS settings of the computer on start-up and selecting
Disable for the Hyper-Threading option.
To properly generate Microsoft© Excel reports the macro security settings must be
set to trust Visual Basic Project. To change this setting, open Microsoft© Excel and
navigate to Tools-Macro-Security. Select the Trusted Publishers tab and
ensure that the “Trust access to Visual Basic Project” setting is enabled.
1. To install pKa Estimator Elite™ place the CD in the CD drive. Navigate to pKa
Estimator Elite Installer →setup.exe and double-click on
setup.exe.
2. Follow the setup instructions provided by the installation wizard. The default
installation directory is C:\Program Files\pKa Estimator Elite.
pKa Estimator Elite™ Software Manual. Version 2.0. Copyright 2005. CombiSep, Inc.
5
2.2 Running pKa Estimator Elite™
Using the Start button on the computer navigate to Programs→pKa
Estimator Elite→pKa Estimator (or the directory the user installed it to if the
default directory was not used) and select.
2.3 Exiting pKa Estimator Elite™
An Exit button is available on each tab of pKa Estimator Elite™ for exiting the
program. To stop running the software click the Exit button and the software will close
automatically.
pKa Estimator Elite™ Software Manual. Version 2.0. Copyright 2005. CombiSep, Inc.
6
Chapter 3. Using the Edit Default Values Tab
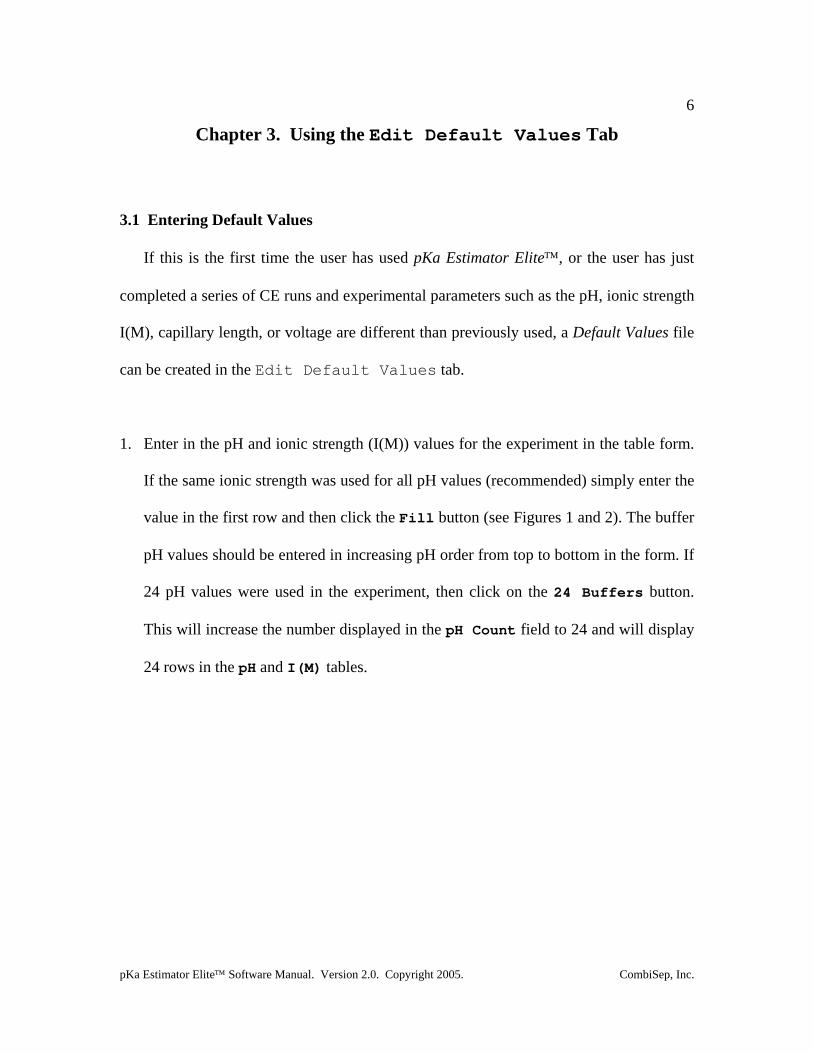
3.1 Entering Default Values
If this is the first time the user has used pKa Estimator Elite™, or the user has just
completed a series of CE runs and experimental parameters such as the pH, ionic strength
I(M), capillary length, or voltage are different than previously used, a Default Values file
can be created in the Edit Default Values tab.
1. Enter in the pH and ionic strength (I(M)) values for the experiment in the table form.
If the same ionic strength was used for all pH values (recommended) simply enter the
value in the first row and then click the Fill button (see Figures 1 and 2). The buffer
pH values should be entered in increasing pH order from top to bottom in the form. If
24 pH values were used in the experiment, then click on the 24 Buffers button.
This will increase the number displayed in the pH Count field to 24 and will display
24 rows in the pH and I(M) tables.
pKa Estimator Elite™ Software Manual. Version 2.0. Copyright 2005. CombiSep, Inc.
7
Figure 1. Edit Default Values form with pH values and first I(M) value entered.
pKa Estimator Elite™ Software Manual. Version 2.0. Copyright 2005. CombiSep, Inc.
8
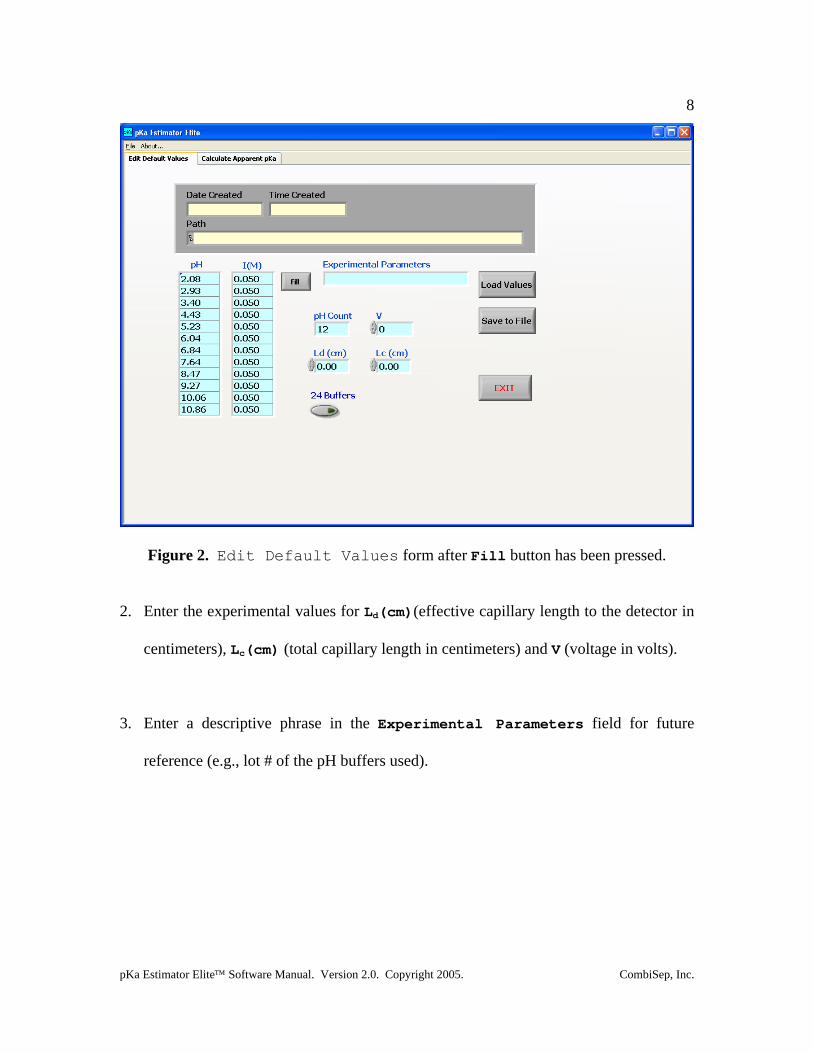
Figure 2. Edit Default Values form after Fill button has been pressed.
2. Enter the experimental values for Ld(cm)(effective capillary length to the detector in
centimeters), Lc(cm) (total capillary length in centimeters) and V (voltage in volts).
3. Enter a descriptive phrase in the Experimental Parameters field for future
reference (e.g., lot # of the pH buffers used).
pKa Estimator Elite™ Software Manual. Version 2.0. Copyright 2005. CombiSep, Inc.
9
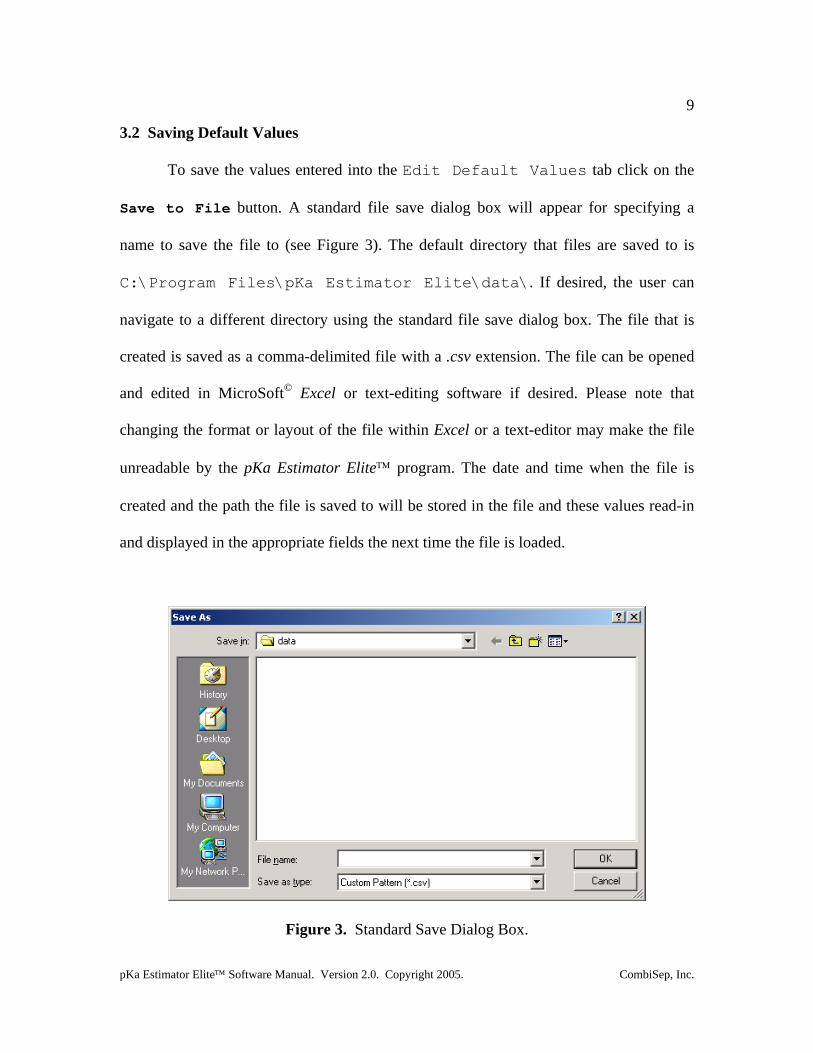
3.2 Saving Default Values
To save the values entered into the Edit Default Values tab click on the
Save to File button. A standard file save dialog box will appear for specifying a
name to save the file to (see Figure 3). The default directory that files are saved to is
C:\Program Files\pKa Estimator Elite\data\. If desired, the user can
navigate to a different directory using the standard file save dialog box. The file that is
created is saved as a comma-delimited file with a .csv extension. The file can be opened
and edited in MicroSoft© Excel or text-editing software if desired. Please note that
changing the format or layout of the file within Excel or a text-editor may make the file
unreadable by the pKa Estimator Elite™ program. The date and time when the file is
created and the path the file is saved to will be stored in the file and these values read-in
and displayed in the appropriate fields the next time the file is loaded.
Figure 3. Standard Save Dialog Box.
pKa Estimator Elite™ Software Manual. Version 2.0. Copyright 2005. CombiSep, Inc.
10
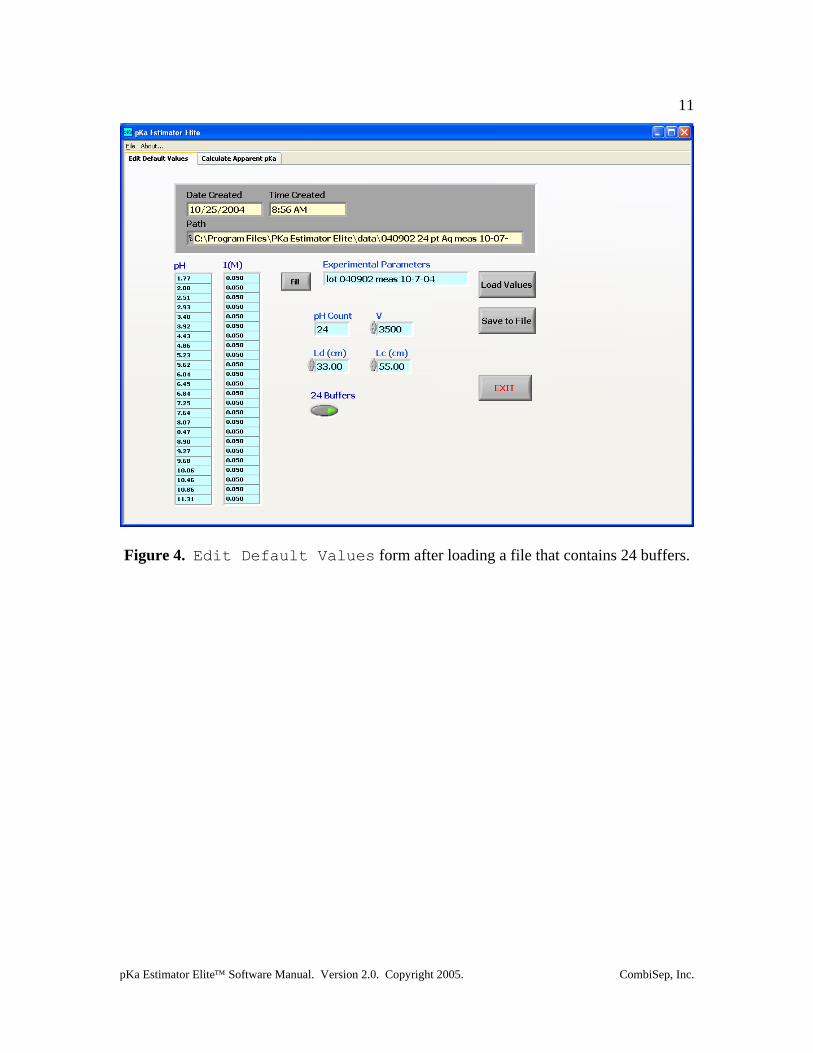
3.3 Loading Default Values
To load experimental parameters from an existing .csv file click on the Load
Values button and use the standard file open dialog box to navigate to the folder the file
is in and select it. The default directory that files are read from is C:\Program
Files\pKa Estimator Elite\data\. The software will automatically
determine from the .csv file that is loaded whether 12 or 24 pH buffers were used, thus
the user does not need to click the 24 Buffers button prior to loading a file that
contains 24 buffers. The 24 Buffers button will be set to True automatically when a
file containing 24 buffers is loaded (see Figure 4). Note: The user must use the Load
Values button to open a saved default values file for the information on the Edit
Default Values tab to be transferred to the Calculate Apparent pKa tab.
Alternatively, the user can enter this information directly in the Calculate
Apparent pKa tab without creating a default values file.
pKa Estimator Elite™ Software Manual. Version 2.0. Copyright 2005. CombiSep, Inc.
11
Figure 4. Edit Default Values form after loading a file that contains 24 buffers.
pKa Estimator Elite™ Software Manual. Version 2.0. Copyright 2005. CombiSep, Inc.
12
Chapter 4. Determining the Apparent pKa Value
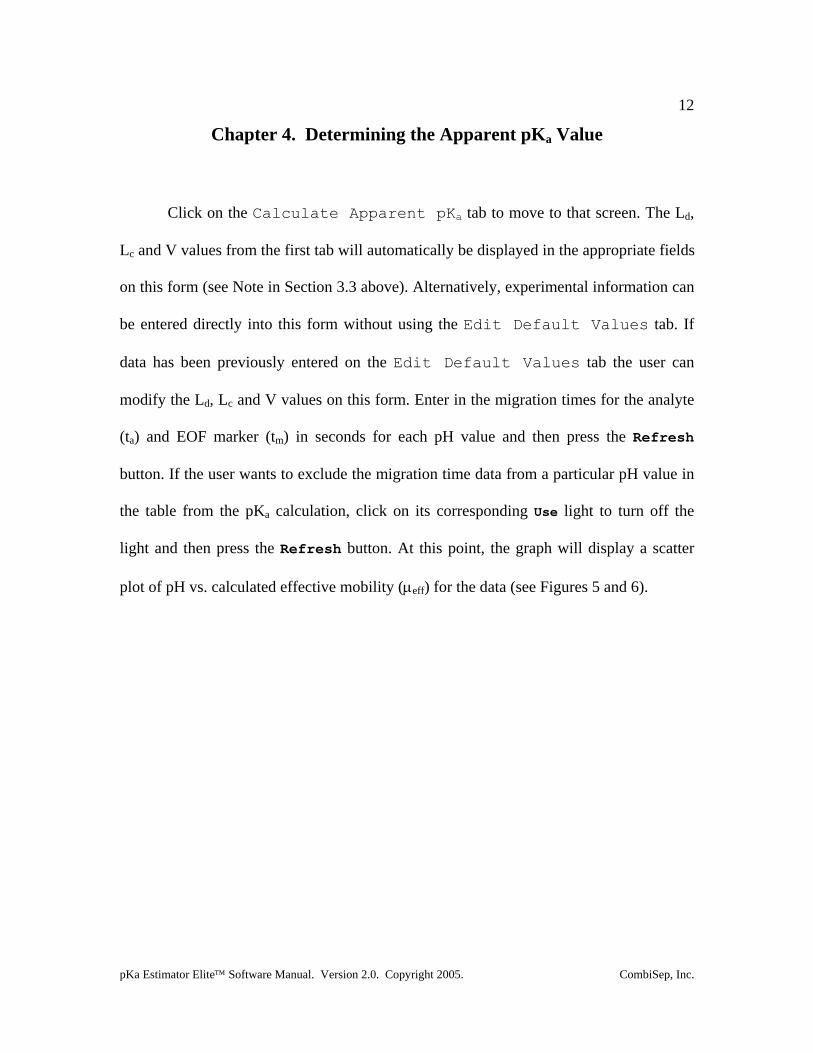
Click on the Calculate Apparent pKa tab to move to that screen. The Ld,
Lc and V values from the first tab will automatically be displayed in the appropriate fields
on this form (see Note in Section 3.3 above). Alternatively, experimental information can
be entered directly into this form without using the Edit Default Values tab. If
data has been previously entered on the Edit Default Values tab the user can
modify the Ld, Lc and V values on this form. Enter in the migration times for the analyte
(ta) and EOF marker (tm) in seconds for each pH value and then press the Refresh
button. If the user wants to exclude the migration time data from a particular pH value in
the table from the pKa calculation, click on its corresponding Use light to turn off the
light and then press the Refresh button. At this point, the graph will display a scatter
plot of pH vs. calculated effective mobility (µeff) for the data (see Figures 5 and 6).
pKa Estimator Elite™ Software Manual. Version 2.0. Copyright 2005. CombiSep, Inc.
13
Figure 5. Calculate Apparent pKa form prior to pKa determination (12 buffers).
pKa Estimator Elite™ Software Manual. Version 2.0. Copyright 2005. CombiSep, Inc.
14
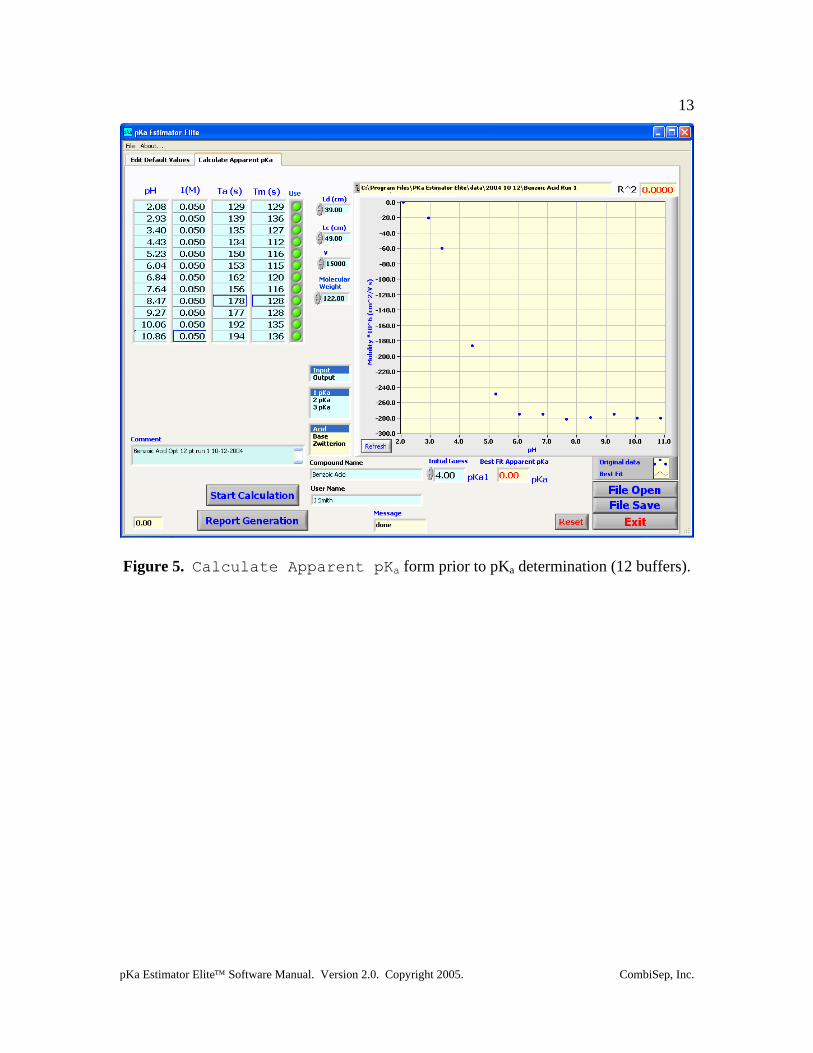
Figure 6. Calculate Apparent pKa form prior to pKa determination (24 buffers).
4.1 Entering the Compound Molecular Weight
The pKa Estimator Elite™ software selects from nine different model equations
for determining a best-fit line to the data. The software applies the best fitting equation to
the migration data based on the maximum positive and/or negative effective mobility of
the sample compound along with its molecular weight. Therefore, for the calculation to
determine which model equation to use (monobase, dibase, etc.), the molecular weight of
the compound should be entered into the Molecular Weight field. Contributions from
counter ions should be subtracted from the total molecular weight if a salt form is being
pKa Estimator Elite™ Software Manual. Version 2.0. Copyright 2005. CombiSep, Inc.
15
analyzed. If the user attempts to calculate the pKa value without first entering a molecular
weight a prompt will appear reminding the user to input a value (see Figure 7).
Figure 7. Prompt to remind user to enter a molecular weight value.
4.2 Initial Guess Values
Below the scatter plot is a column of one or more fields labeled Initial
Guess. These values are used as initial seed values for the non-linear regression analysis.
The use of initial guess values may aid the software in situations where a best-fit solution
is not easily calculated (see below). To change the values in the Initial Guess field(s)
before calculation select the number of fields (pKa values) to display by selecting 1 pKa,
2 pKa or 3 pKa in the pKa control to the left of the plot (see Figure 8) and enter new
values in the Initial Guess fields (see Figure 9). If a pKa calculation has already
occurred, simply press the Start Calculation button again after changing the initial
guess values to re-determine the best-fit line.
Figure 8. pKa control with 1 pKa highlighted.
pKa Estimator Elite™ Software Manual. Version 2.0. Copyright 2005. CombiSep, Inc.
16
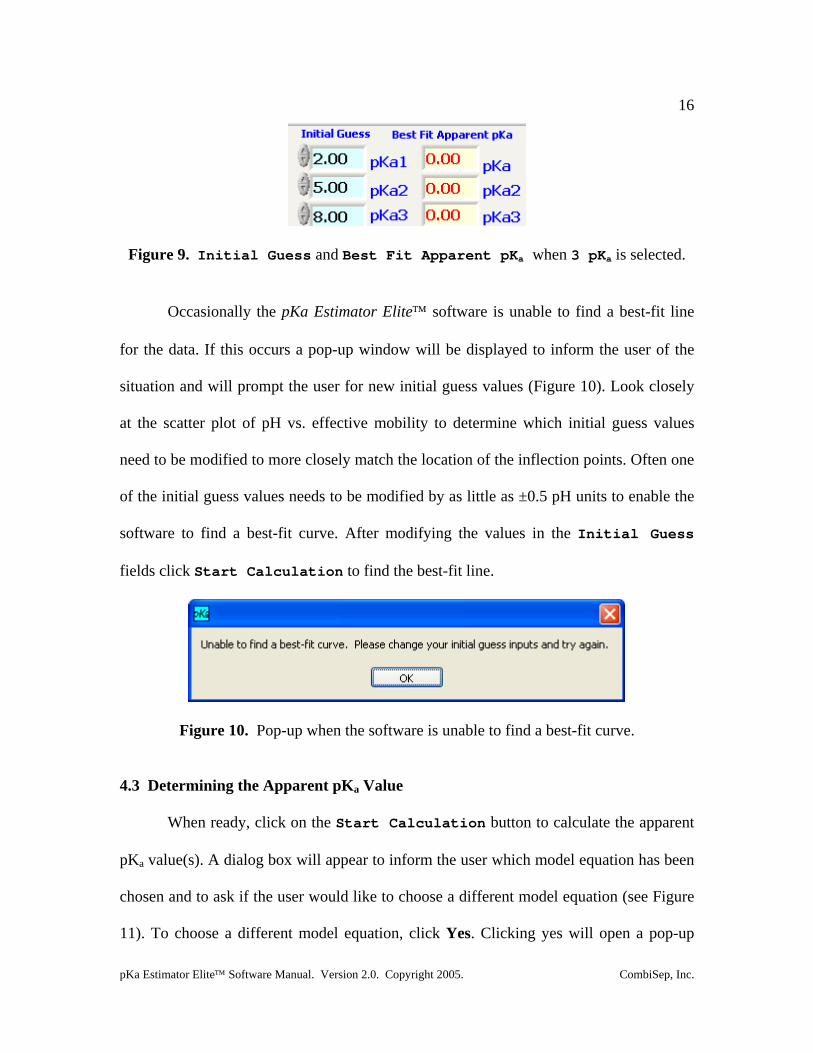
Figure 9. Initial Guess and Best Fit Apparent pKa when 3 pKa is selected.
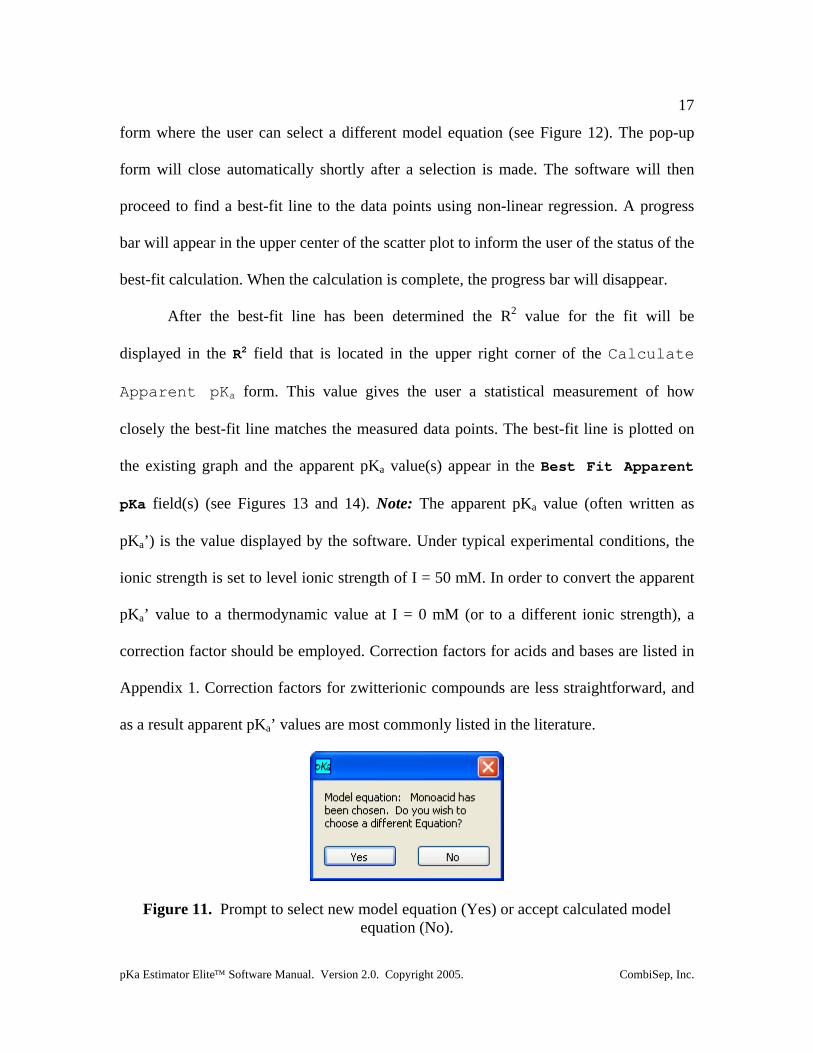
Occasionally the pKa Estimator Elite™ software is unable to find a best-fit line
for the data. If this occurs a pop-up window will be displayed to inform the user of the
situation and will prompt the user for new initial guess values (Figure 10). Look closely
at the scatter plot of pH vs. effective mobility to determine which initial guess values
need to be modified to more closely match the location of the inflection points. Often one
of the initial guess values needs to be modified by as little as ±0.5 pH units to enable the
software to find a best-fit curve. After modifying the values in the Initial Guess
fields click Start Calculation to find the best-fit line.
Figure 10. Pop-up when the software is unable to find a best-fit curve.
4.3 Determining the Apparent pKa Value
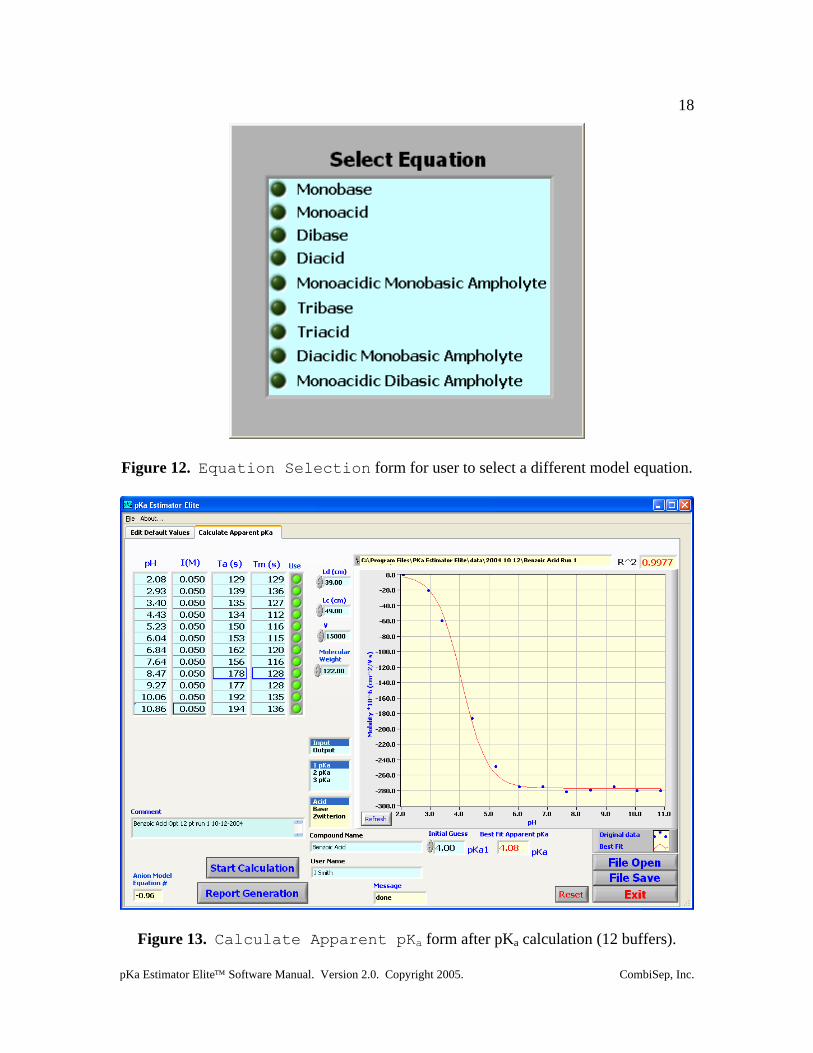
When ready, click on the Start Calculation button to calculate the apparent
pKa value(s). A dialog box will appear to inform the user which model equation has been
chosen and to ask if the user would like to choose a different model equation (see Figure
11). To choose a different model equation, click Yes. Clicking yes will open a pop-up
pKa Estimator Elite™ Software Manual. Version 2.0. Copyright 2005. CombiSep, Inc.
17
form where the user can select a different model equation (see Figure 12). The pop-up
form will close automatically shortly after a selection is made. The software will then
proceed to find a best-fit line to the data points using non-linear regression. A progress
bar will appear in the upper center of the scatter plot to inform the user of the status of the
best-fit calculation. When the calculation is complete, the progress bar will disappear.
After the best-fit line has been determined the R2 value for the fit will be
displayed in the R2 field that is located in the upper right corner of the Calculate
Apparent pKa form. This value gives the user a statistical measurement of how
closely the best-fit line matches the measured data points. The best-fit line is plotted on
the existing graph and the apparent pKa value(s) appear in the Best Fit Apparent
pKa field(s) (see Figures 13 and 14). Note: The apparent pKa value (often written as
pKa’) is the value displayed by the software. Under typical experimental conditions, the
ionic strength is set to level ionic strength of I = 50 mM. In order to convert the apparent
pKa’ value to a thermodynamic value at I = 0 mM (or to a different ionic strength), a
correction factor should be employed. Correction factors for acids and bases are listed in
Appendix 1. Correction factors for zwitterionic compounds are less straightforward, and
as a result apparent pKa’ values are most commonly listed in the literature.
Figure 11. Prompt to select new model equation (Yes) or accept calculated model equation (No).
pKa Estimator Elite™ Software Manual. Version 2.0. Copyright 2005. CombiSep, Inc.
18
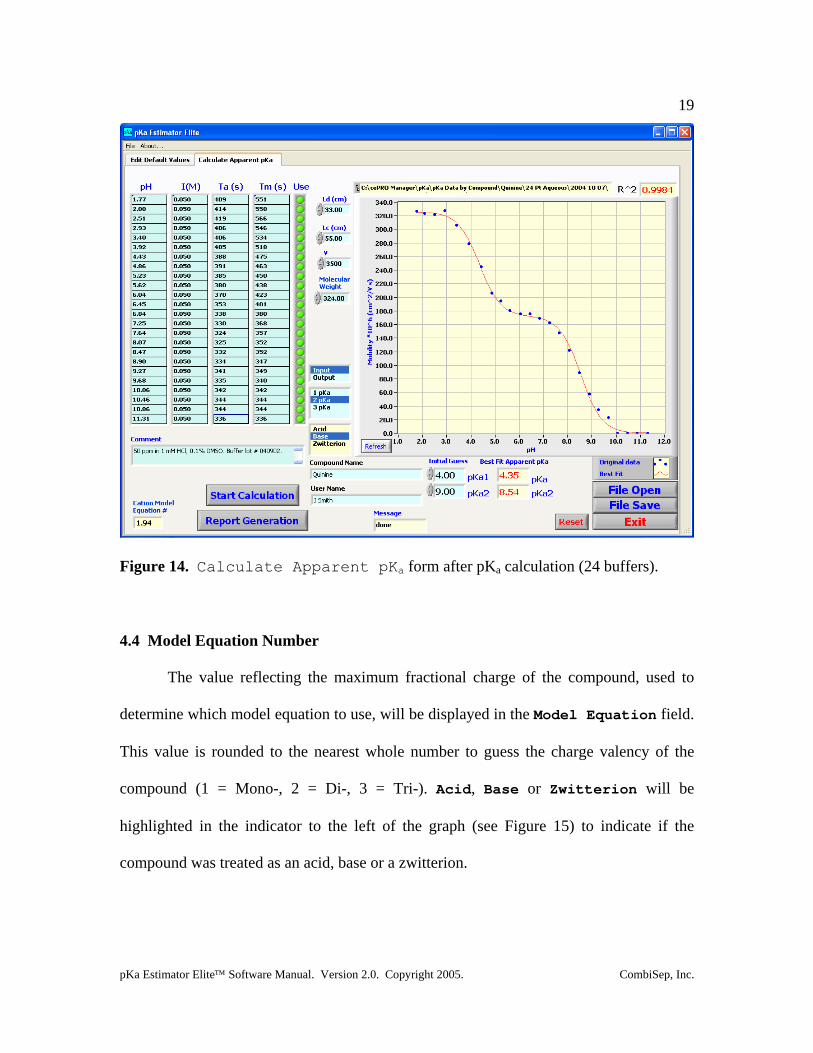
Figure 12. Equation Selection form for user to select a different model equation.
Figure 13. Calculate Apparent pKa form after pKa calculation (12 buffers).
pKa Estimator Elite™ Software Manual. Version 2.0. Copyright 2005. CombiSep, Inc.
19
Figure 14. Calculate Apparent pKa form after pKa calculation (24 buffers).
4.4 Model Equation Number
The value reflecting the maximum fractional charge of the compound, used to
determine which model equation to use, will be displayed in the Model Equation field.
This value is rounded to the nearest whole number to guess the charge valency of the
compound (1 = Mono-, 2 = Di-, 3 = Tri-). Acid, Base or Zwitterion will be
highlighted in the indicator to the left of the graph (see Figure 15) to indicate if the
compound was treated as an acid, base or a zwitterion.
pKa Estimator Elite™ Software Manual. Version 2.0. Copyright 2005. CombiSep, Inc.
20
Figure 15. Indicator showing how compound was fitted - as an acid, base or zwitterion.
4.5 Comment Field
Information about the pKa experimental results (e.g., sample diluent, pH points
used, buffer lot #) can be entered and edited using the Comment field. This information
will be saved with the .pka file and will be displayed whenever the file is reopened.
4.6 Compound Name Field
The compound name or identifier can be entered into the Compound Name field.
This information will be saved with the .pka file and will be displayed whenever the file
is reopened.
4.7 User Name Field
If desired, the name of the analyst performing the pKa experiment can be entered
into the User Name field. This information will be saved with the .pka file and will be
displayed whenever the file is reopened.
4.8 Reset
The Reset button will clear the table and graph on the Calculate
Apparent pKa tab. Likewise, if the user loads a new .pka file (see Section 4.12) the
values will be cleared and replaced with the new values.
pKa Estimator Elite™ Software Manual. Version 2.0. Copyright 2005. CombiSep, Inc.
21
4.9 Refresh
The Refresh button on the graph clears the best-fit line from the graph, leaving
only the scatter plot of pH vs. effective mobility.
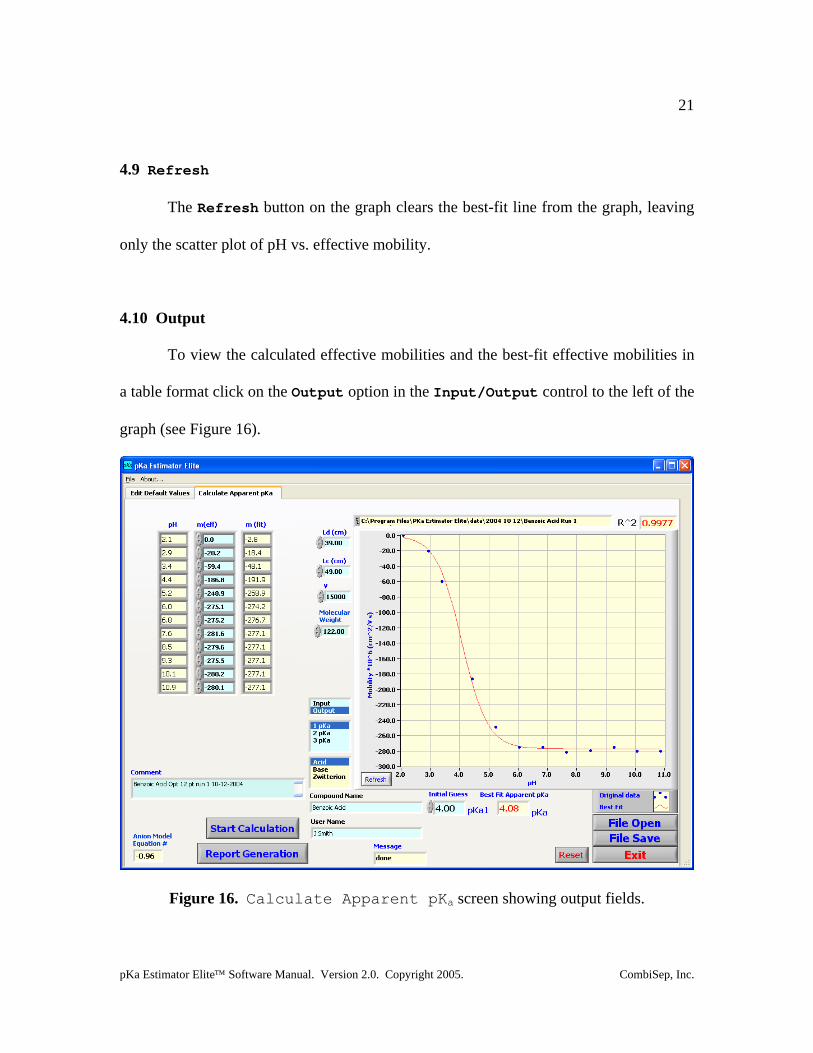
4.10 Output
To view the calculated effective mobilities and the best-fit effective mobilities in
a table format click on the Output option in the Input/Output control to the left of the
graph (see Figure 16).
Figure 16. Calculate Apparent pKa screen showing output fields.
pKa Estimator Elite™ Software Manual. Version 2.0. Copyright 2005. CombiSep, Inc.
22
4.11 Saving a File
To save all of the experimental information (migration times, pH values, Ld, Lc,
V, molecular weight value, comments, compound name, user name and pKa results) to a
file click the File Save button. A standard file save dialog box will appear for
specifying the name to save the file to. As with the Default Values files, the default
directory is C:\Program Files\pKa Estimator Elite\data\. The file that
is created is a comma-delimited file, however, it is given a .pka extension by the
software.
4.12 Opening a File
To open an existing .pka file click on the File Open button. A standard file open
dialog box will appear for selecting the file to open. The default directory is
C:\Program Files\pKa Estimator Elite\data\. All of the experimental
information will be loaded along with the pKa results. To work with an existing .pka file
the user does not need to go through the step of entering the default values.
4.13 Report Generation
Version 2.0 of the pKa Estimator Elite™ software introduces the capability to
create a report of the pKa results in a Microsoft© Excel format. To generate a report, press
the Report Generation button. A standard file save dialog box will appear for
specifying the name to save the file to. As with the Default Values files, the default
pKa Estimator Elite™ Software Manual. Version 2.0. Copyright 2005. CombiSep, Inc.
23
directory is C:\Program Files\pKa Estimator Elite\data\. The file that
is created is given an .xls extension by the software.
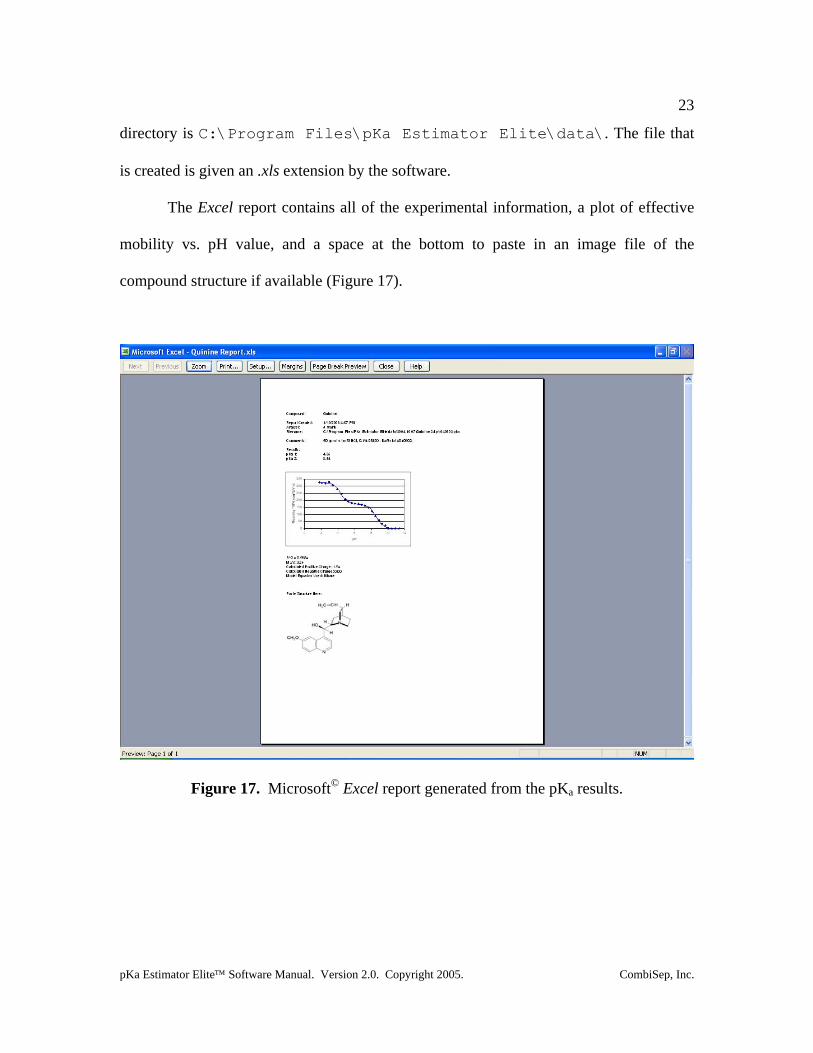
The Excel report contains all of the experimental information, a plot of effective
mobility vs. pH value, and a space at the bottom to paste in an image file of the
compound structure if available (Figure 17).
Figure 17. Microsoft© Excel report generated from the pKa results.
pKa Estimator Elite™ Software Manual. Version 2.0. Copyright 2005. CombiSep, Inc.
24
Chapter 5. Summary
This manual walks the user through how to use CombiSep’s pKa Estimator
Elite™ software. This software enables the user to easily consolidate experimental
conditions with CE migration time data. The consolidated data is then used to find a non-
linear, best-fit line to the pH vs. effective mobility plot from which a compound’s
apparent pKa value can be obtained. Microsoft© Excel reports can be generated and saved
to better archive experimental results. Appendix 1 provides a generic CE protocol to help
the user get started generating data and become familiar with pKa determination by CE.
For further questions regarding the use of pKa Estimator Elite™ software, please contact
CombiSep technical support at 1-888-822-7949 (toll free) or by email at tech-
pKa Estimator Elite™ Software Manual. Version 2.0. Copyright 2005. CombiSep, Inc.
25
Appendix 1. Example Procedure for pKa Measurement by CE
The following is a generic procedure for pKa measurement by CE. It was adapted
from several previously published literature protocols [1-3]. This method is intended to
serve as a starting point for users gaining experience in using CE for pKa determination,
and can be readily adapted to different instruments, capillary lengths, and pH buffer
systems. It is assumed the user has a working knowledge of CE.
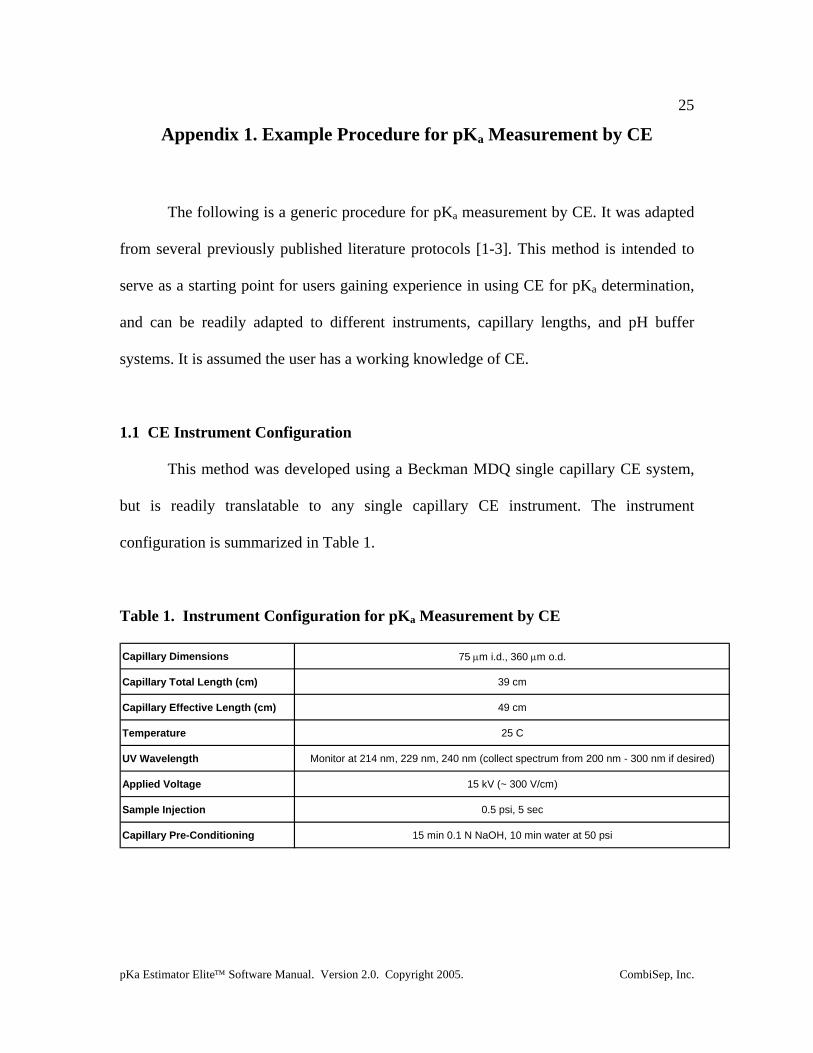
1.1 CE Instrument Configuration
This method was developed using a Beckman MDQ single capillary CE system,
but is readily translatable to any single capillary CE instrument. The instrument
configuration is summarized in Table 1.
Table 1. Instrument Configuration for pKa Measurement by CE
Capillary Dimensions 75 µm i.d., 360 µm o.d.
Capillary Total Length (cm) 39 cm
Capillary Effective Length (cm) 49 cm
Temperature 25 C
UV Wavelength Monitor at 214 nm, 229 nm, 240 nm (collect spectrum from 200 nm - 300 nm if desired)
Applied Voltage 15 kV (~ 300 V/cm)
Sample Injection 0.5 psi, 5 sec
Capillary Pre-Conditioning 15 min 0.1 N NaOH, 10 min water at 50 psi
pKa Estimator Elite™ Software Manual. Version 2.0. Copyright 2005. CombiSep, Inc.
26
1.2 Sample Preparation
Weigh out 0.1 mg/ml of compound into a tared vial. Dissolve basic compounds in
1 mM HCl and acidic compounds in 1 mM NaOH, and add 0.1% (v/v) DMSO (neutral
marker). Sonicate and filter if necessary for compounds that are not fully dissolved. If the
sample is presented as a 10 mM stock solution in DMSO, dilute to 0.2 mM (20x), 2%
DMSO sample concentration with 1 mM HCl (bases) or 1 mM NaOH (acids) and
monitor at 229 nm and/or 240 nm.
1.3 pH Buffer Preparation
Add 1.25 ml each of 12 different pH buffers of equal ionic strength (kits available
from Microsolv or CombiSep) to a series of inlet and outlet vials (2 vials per pH, 24 vials
total). Load the different pH buffer vials into the instrument autosampler such that the
highest pH value buffer is analyzed first and subsequent pH buffers are analyzed in order
to the lowest pH value. Analysis of the highest pH value first will serve to minimize
changes in pH due to absorbed CO2 from the environment throughout the time interval of
the experiment.
1.4 CE Run Sequence Parameters
It has been demonstrated that the use of pressure-assisted CE can significantly
reduce migration times while preserving data quality for pKa analysis [1-5]. Table 2 lists
example pressure settings as function of pH under the above instrument configuration,
along with approximate migration times for a neutral marker (EOF) and current levels for
a buffer series of I = 50 mM.

pKa Estimator Elite™ Software Manual. Version 2.0. Copyright 2005. CombiSep, Inc.
27
Table 2. Approximate CE Run Parameters for Generic CE pKa Method
pH Value Pressure Level (psi) Migration Time for EOF (min) Total Current (µA)
2.1 1.0 2.2 105
2.9 0.9 2.3 85
3.4 0.9 2.2 80
4.4 0.8 1.9 50
5.2 0.7 2.0 55
6.0 0.7 2.0 50
6.8 0.6 2.0 50
7.6 0.6 2.0 50
8.4 0.6 1.9 75
9.2 0.6 1.9 60
10.0 0.6 1.9 50
10.8 0.6 1.9 50
Using the above parameters, the analysis of basic compounds can be completed in
approximately 2.5 min per CE run/pH value, and acidic compounds can be analyzed in
approximately 3 min per CE run/pH value. The resulting total time to complete an
unattended analysis at 12 different pH points (using a 3 min CE run time) was ~80 min.
The above method was found to provide a reasonable compromise between speed and
separation resolution. An increase in the pressures used in conjunction with CE can
slightly decrease the total analysis time, at the expense of reduced resolution between the
analyte and EOF marker.
pKa Estimator Elite™ Software Manual. Version 2.0. Copyright 2005. CombiSep, Inc.
28
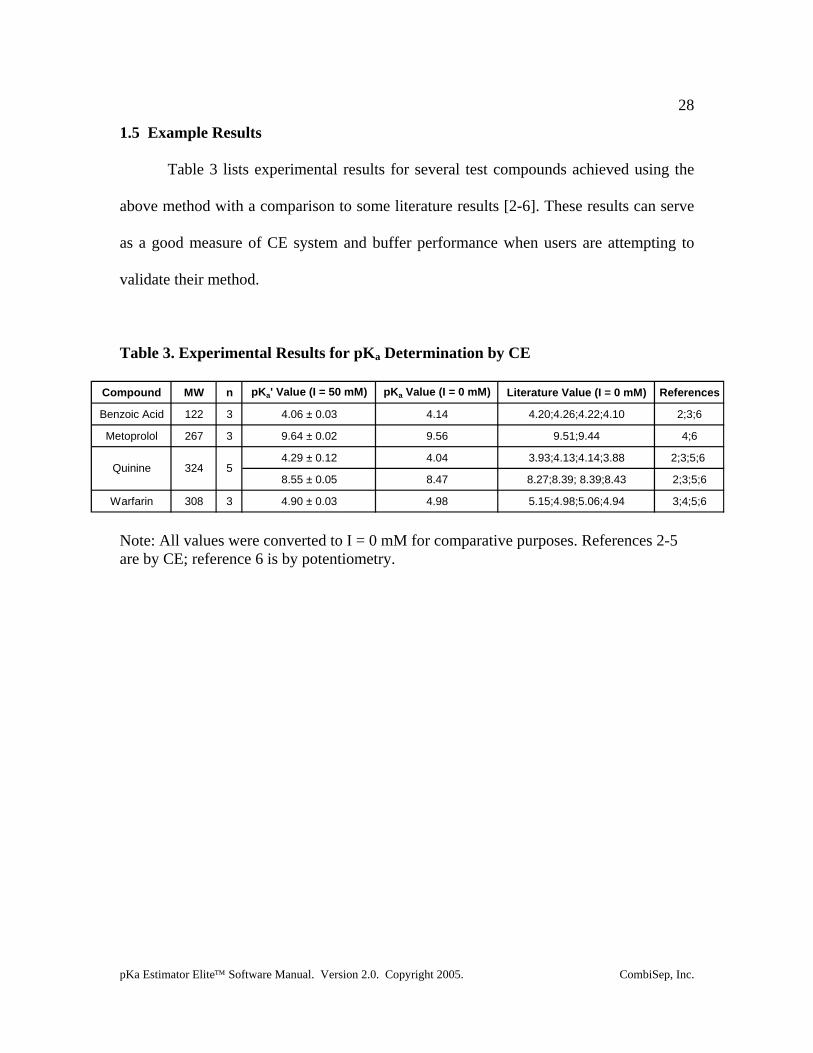
1.5 Example Results
Table 3 lists experimental results for several test compounds achieved using the
above method with a comparison to some literature results [2-6]. These results can serve
as a good measure of CE system and buffer performance when users are attempting to
validate their method.
Table 3. Experimental Results for pKa Determination by CE
Compound MW n pKa' Value (I = 50 mM) pKa Value (I = 0 mM) Literature Value (I = 0 mM) References
Benzoic Acid 122 3 4.06 ± 0.03 4.14 4.20;4.26;4.22;4.10 2;3;6
Metoprolol 267 3 9.64 ± 0.02 9.56 9.51;9.44 4;6
4.29 ± 0.12 4.04 3.93;4.13;4.14;3.88 2;3;5;6
8.55 ± 0.05 8.47 8.27;8.39; 8.39;8.43 2;3;5;6
Warfarin 308 3 4.90 ± 0.03 4.98 5.15;4.98;5.06;4.94 3;4;5;6
Quinine 324 5
Note: All values were converted to I = 0 mM for comparative purposes. References 2-5 are by CE; reference 6 is by potentiometry.
pKa Estimator Elite™ Software Manual. Version 2.0. Copyright 2005. CombiSep, Inc.
29
Appendix 2. Ionic Strength Correction Factors
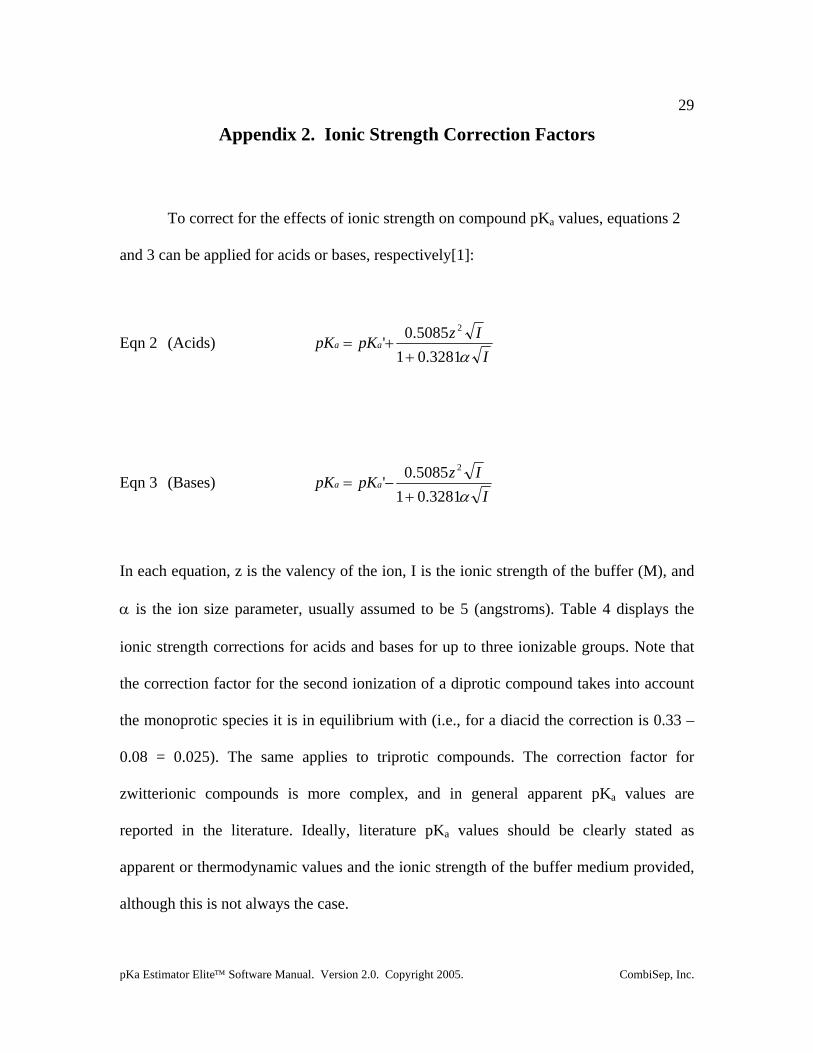
To correct for the effects of ionic strength on compound pKa values, equations 2
and 3 can be applied for acids or bases, respectively[1]:
Eqn 2 (Acids) I
IzpKpK aaα3281.01
5085.0'2
++=
Eqn 3 (Bases) I
IzpKpK aaα3281.01
5085.0'2
+−=
In each equation, z is the valency of the ion, I is the ionic strength of the buffer (M), and
α is the ion size parameter, usually assumed to be 5 (angstroms). Table 4 displays the
ionic strength corrections for acids and bases for up to three ionizable groups. Note that
the correction factor for the second ionization of a diprotic compound takes into account
the monoprotic species it is in equilibrium with (i.e., for a diacid the correction is 0.33 –
0.08 = 0.025). The same applies to triprotic compounds. The correction factor for
zwitterionic compounds is more complex, and in general apparent pKa values are
reported in the literature. Ideally, literature pKa values should be clearly stated as
apparent or thermodynamic values and the ionic strength of the buffer medium provided,
although this is not always the case.
pKa Estimator Elite™ Software Manual. Version 2.0. Copyright 2005. CombiSep, Inc.
30
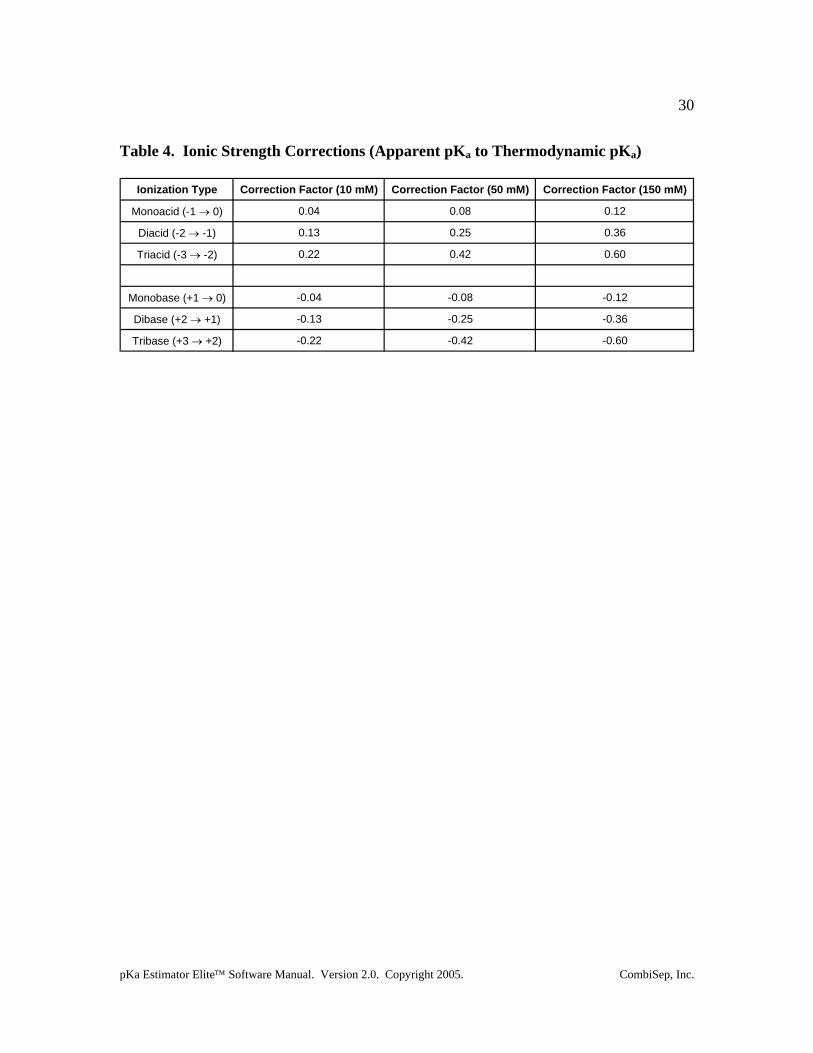
Table 4. Ionic Strength Corrections (Apparent pKa to Thermodynamic pKa)
Ionization Type Correction Factor (10 mM) Correction Factor (50 mM) Correction Factor (150 mM)
Monoacid (-1 → 0) 0.04 0.08 0.12
Diacid (-2 → -1) 0.13 0.25 0.36
Triacid (-3 → -2) 0.22 0.42 0.60
Monobase (+1 → 0) -0.04 -0.08 -0.12
Dibase (+2 → +1) -0.13 -0.25 -0.36
Tribase (+3 → +2) -0.22 -0.42 -0.60
pKa Estimator Elite™ Software Manual. Version 2.0. Copyright 2005. CombiSep, Inc.
31
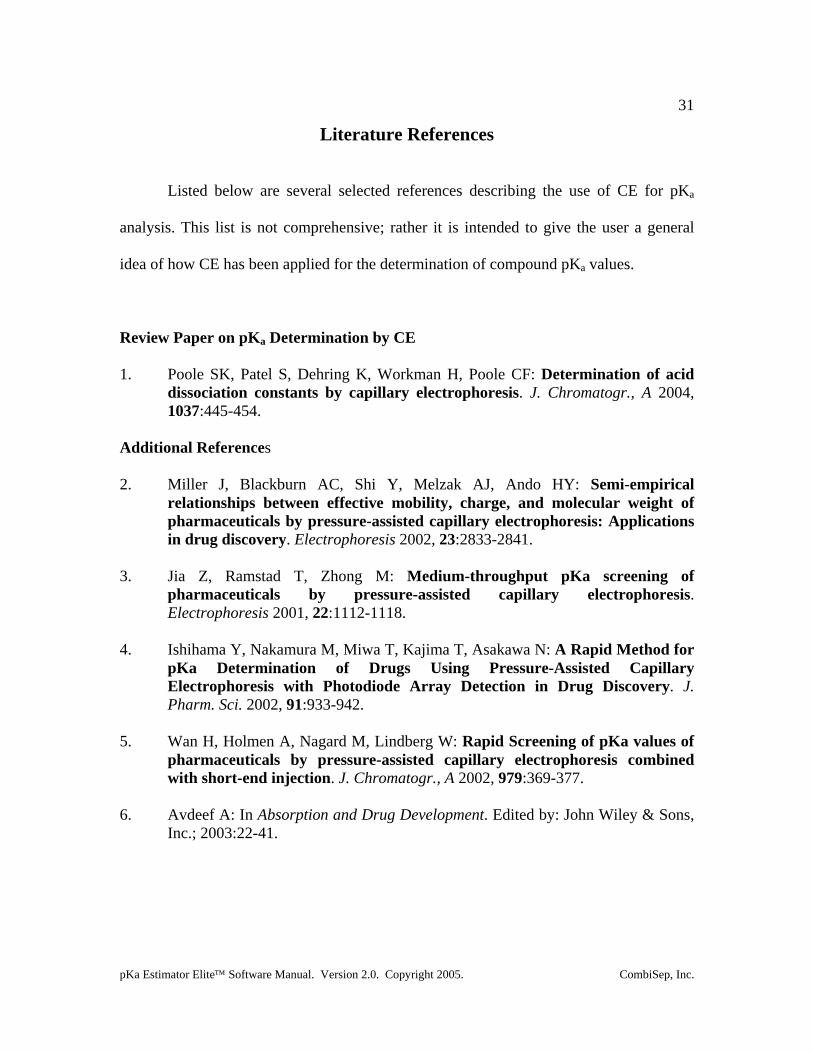
Literature References
Listed below are several selected references describing the use of CE for pKa
analysis. This list is not comprehensive; rather it is intended to give the user a general
idea of how CE has been applied for the determination of compound pKa values.
Review Paper on pKa Determination by CE 1. Poole SK, Patel S, Dehring K, Workman H, Poole CF: Determination of acid
dissociation constants by capillary electrophoresis. J. Chromatogr., A 2004, 1037:445-454.
Additional References 2. Miller J, Blackburn AC, Shi Y, Melzak AJ, Ando HY: Semi-empirical
relationships between effective mobility, charge, and molecular weight of pharmaceuticals by pressure-assisted capillary electrophoresis: Applications in drug discovery. Electrophoresis 2002, 23:2833-2841.
3. Jia Z, Ramstad T, Zhong M: Medium-throughput pKa screening of
pharmaceuticals by pressure-assisted capillary electrophoresis. Electrophoresis 2001, 22:1112-1118.
4. Ishihama Y, Nakamura M, Miwa T, Kajima T, Asakawa N: A Rapid Method for
pKa Determination of Drugs Using Pressure-Assisted Capillary Electrophoresis with Photodiode Array Detection in Drug Discovery. J. Pharm. Sci. 2002, 91:933-942.
5. Wan H, Holmen A, Nagard M, Lindberg W: Rapid Screening of pKa values of
pharmaceuticals by pressure-assisted capillary electrophoresis combined with short-end injection. J. Chromatogr., A 2002, 979:369-377.
6. Avdeef A: In Absorption and Drug Development. Edited by: John Wiley & Sons,
Inc.; 2003:22-41.