Embed Size (px)
Citation preview
Placing and Passing: Evidence from Uganda on Ethnic Identification and Ethnic Deception*
James Habyarimana Georgetown University
Daniel N. Posner
University of California, Los Angeles
Macartan Humphreys Columbia University
Jeremy M. Weinstein Stanford University
August 2007
Abstract
Micro-level theories of ethnic politics commonly assume that individuals can identify the ethnic backgrounds of the people with whom they interact. However, this assumption is difficult to reconcile with anecdotal evidence and with theoretical work that points to the importance of signaling and mimicry in social interaction. To what extent are placing (i.e., correct identification) and passing (i.e., deceiving others so as to prevent correct identification) possible? This paper proposes a theoretical structure for answering these questions and employs experimental methods to assess patterns of placing and passing among subjects recruited from an ethnically diverse neighborhood of Kampala, Uganda. When confronted with signs of group membership that cannot be manipulated, we find that subjects are less able to place others into ethnic categories than theories of ethnic politics assume. Although co-ethnics have a marked advantage in placing one another, subjects still miscode in-group members 33% of the time and out-group members 65% of the time. Moreover, the errors subjects make are systematic: some groups are rarely mistaken for each other while others are constantly mixed up. These errors provide the basis for constructing a new measure of group distinctness. We use this measure to examine the potential for passing through the strategic use of signals, and find that successful passing is more likely when individuals attempt to pass into groups that are “similar” to their own but “distinct” from the group of the person who is trying to place them. We also find that, contrary to expectations from theories of rational updating, observers do worse when incorporating new information from signals sent by individuals that may, with a known probability, be attempting to pass. * This paper was prepared for presentation at the annual meeting of the American Political Science Association, Chicago, 2007. The authors thank Claire Adida, Bernd Beber, Pepine Bulambo, Deo Byabagambi, Elizabeth Carlson, Chris Crabbe, Kenneth Ekode, Nathan Falck, Alex Kunobwa, Sylvester Mubiru, Douglas Musonga, Winfred Nabulo, Ruth Nagawa, Susan Najjuuko, Brenda Nakkazi, Harriet Nambi, Winfred Naziwa, Livingstone Ntensibe, Alex Odwong, Alexandra Scacco, Geoff Sentongo, Simon Ssenyimba, Elizabeth Suubi, Alex Tindyebwa, Sheila Watuwa and Daniel Young for their extraordinary contributions and the Harvard Academy for International and Area Studies, the Russell Sage Foundation, and the Harry Frank Guggenheim Foundation for financial support.
1
1 INTRODUCTION
Micro-level theories of ethnic politics commonly assume that individuals can identify the ethnic backgrounds
of the people with whom they interact. This assumption is difficult to reconcile both with anecdotal evidence
suggesting large variation in the ability of individuals to identify others within given social schemas (e.g.,
Kuruvilla 2006) and with research on signaling and mimicry that emphasizes the ability of individuals to use
information about their identities strategically (e.g., Gambetta 2005). Unfortunately, there has been very little
systematic research to date to uncover the informational and strategic conditions under which “placing” (i.e.,
correctly identifying a person’s ethnic background) or “passing” (i.e., deceiving others so as to prevent correct
identification) are possible.
An obstacle to identifying such conditions—and a key reason why research on this topic is not
further advanced—is the theoretical complexity of the notion of ethnic identifiability. To say that a person’s
ethnic background has been “correctly identified” implies the existence of a set of criteria for evaluating the
accuracy of a placement decision in a given instance. But there are no such universal criteria, and the
appropriateness of ad hoc criteria used in any given situation will likely be dependent on the strategic context
of the placing. Moreover, even if we have clear criteria for correct placement, determining whether a rate of
correct identification under any information condition is ‘high’ or ‘low’ depends on base rates, which
themselves are likely to be highly sensitive to contextual factors. Beyond these theoretical issues of
interpretation, difficulties also arise in observing empirically how individuals classify others, or if indeed such
classifications are even made. The result is that we know little about the extent to which placing and passing
are possible, or about how the ability to do each of these things depends on informational environments.
This paper seeks to fill this gap by proposing a theoretical structure for making meaningful
statements about identifiability. Then, drawing on a sample of 300 randomly sampled Ugandans from an
ethnically diverse community in Kampala, Uganda, we use experimental methods to explore the determinants
of identifiability and successful passing within this population. Specifically, we measure the ability of
individuals to place individuals (whose images they are shown) into the ethnic categories with which those
individuals self-identify. We examine how the characteristics of the person viewing the images, the
characteristics of the person whose images are viewed, and the degree of information that the former has
about the latter affect the probability of a correct ethnic identification. We then explore the contribution to
identification made by physical “signs”—by which we mean aspects of the individual that are not subject to
manipulation, at least in the short run—and “signals”—by which we mean information that is more readily
under an individual’s control and can be used to either communicate or hide their ethnic identity. The latter
enables us to analyze the factors that permit individuals to pass as members of groups other than their own.
Our effort to document patterns of placing and passing is more than an empirical exercise. Variation
in ethnic identifiability has substantive implications for theoretical and empirical work on ethnic politics. To
the extent that ethnic identifiability varies systematically across ethnic groups, their ability to achieve collective
ends should vary as well. The fact that passing may be easier for some individuals and groups than for others
2
has implications for the permeability of group boundaries, the ability of groups to police them, and the
collective benefits that flow from policing. Because the costs and benefits of gathering information about the
ethnic identify of individuals may vary across groups, theories of ethnic mobilization and discrimination must
take account of these differences.
2 MOTIVATION: THE PROBLEM OF ETHNIC IDENTIFICATION
From theories of in-group sanctioning (Greif 1989; Fearon and Laitin 1996) to theories that emphasize the
ability of ethnic groups to police their boundaries (Barth 1969; Laitin 1995; Fearon 1999) to theories of ethnic
or racial discrimination (Akerlof 1976; Becker 1971) to experimental treatments of minimal groups (Tajfel,
Billig, and Bundy 1971), models of face-to-face ethnic interaction generally assume that actors can distinguish
accurately between in-group members and outsiders. Even in more recent models inspired by constructivism,
such as that found in Caselli and Coleman (2002) in which actors can take costly actions to change their
identities, once changed, an actor’s identity is assumed to be self-evident to the other players in the game.
Other constructivist work that has emphasized the willingness of actors to employ different identities at
different times has been quiet about the likelihood that these different roles will be recognized by others.
The assumption that individuals can seamlessly identify the ethnic backgrounds of the people they
encounter—or, at the very least, unproblematically distinguish in-group members from out-group
members—although common, presents both theoretical and empirical problems. We consider the empirical
problems first and then turn to the theoretical challenges which render difficult attempts to address the
empirical question.
Empirical Concerns
Anecdotal evidence suggests that people’s ethnic backgrounds are oftentimes difficult to pin down. In one
evocative example, Horowitz relates the following story from Sri Lanka:
Sinhalese rioters suspected a man in a car of being a Tamil. Having stopped the car, they inquired about his peculiar accent in Sinhala, which he explained by his lengthy stay in England and his marriage to an English woman. Uncertain, but able to prevent his escape, the rioters went off to kill other Tamils, returning later to question the prospective victim further. Eventually, he was allowed to proceed on his way, even though the mob knew it risked making a mistake, which in fact it had: the man was a Tamil (2001: 130).
In this example, the attackers had difficulty coding the ethnic background of their would-be victim. Their
concern was to ensure that they would not err by identifying an in-group member as an out-group member.
In other contexts, the concern is to ensure that out-group members are not mistakenly identified as in-group
members. Recent reports about the practice of social profiling in the United States highlight the difficulties of
correctly identifying out-group members. For example, Human Rights Watch documents an estimated two
thousand backlash incidents targeted at Muslims and people of Arab descent in the aftermath of the
3
September 11 terrorist attacks (Human Rights Watch 2002). More often than not, the victims of these hate
crimes turned out not to be Muslims or Arabs at all, but Sikhs, Indians, Pakistanis, Coptic Christians, and, in
one case, an Iranian Jew.1 Other reports have documented the tendency for “brown-skinned men with beards
and women with head scarves [to be] seen as ‘Muslims’—regardless of their actual faith or nationality”
(Kuruvilla 2006). The great lengths to which governments have historically gone to make members of
particular ethnic groups more readily identifiable—through, for example, the requirement that Jews wear the
Star of David or that Japanese-Americans wear markers indicating their Japanese descent, or that Rwandese
citizens have their official ethnic identities marked on their identity cards—further underscores the difficulty
that ethnic identification often presents, as well as the centrality that identifiability can hold for political
action.
Theoretical Concerns
Any effort to measure ethnic identifiability rapidly encounters a host of deep theoretical issues which
challenge the notion of correct or incorrect placement and indeed the very idea of groups. Research on ethnic
politics generally emphasizes the constructed nature of social categories (for a summary, see Chandra 2001).
Some scholars focus explicitly on the characteristics that distinguish ethnic categories from other types of
social categories (Chandra 2004). This literature raises a difficult question: in what sense is it meaningful to
say that distinct groups exist? The argument that groups are constructed presupposes that they exist in some
sense. Yet both biological arguments suggesting fundamental differences across groups and arguments that
invoke features such as common ancestry or shared history to define groups run into logical or empirical
problems (Appiah 1992). These difficulties in providing foundations for the objective existence of races
extend also to ethnic groups.
Anderson (1991) seeks to establish the existence of groups by placing it on inter-subjective
foundations. What is important, he argues of a nation, is that “in the minds of each [member] lives the image
of their communion.” This vision of group existence is useful since, even if a primordialist position is
logically untenable, it is quite possible that people act as if they live in a primordialist world. But it is
deceptively difficult to operationalize. The problem with Anderson’s approach is that images of group
boundaries may be neither crisp nor shared. These boundaries may be subject to contestation, as in
disagreements among in-group members about what are the limits of their group. Even if there is consensus
on common membership of a collection of individuals in a community, this group may not itself be
recognized by out-group members, some of whom may have competing criteria for what constitutes the
group. Consequently, statements about whether a person belongs to a given identity group may involve
adopting one individual’s perspective over another’s.
1 We cannot rule out the possibility that the perpetrators of these anti-Muslim acts simply did not know that the Sikhs, Indians, and Pakistanis, and the others they attacked were not Arab Muslims, in which case the miscodings would not be examples of ethnic misidentification as we treat it in this paper but simply of not being aware that there were different categories into which the would-be victims might be coded.
4
These theoretical concerns present significant problems for an empirical study of ethnic identifiability
that might permit us to move beyond the anecdotes of misidentification described earlier to learn something
general about the determinants of correct and incorrect ethnic identification. The absence of solid
foundations for the objective existence of ethnic groups does not imply, however, that people do not act as if
social groups exist. The challenge for researchers is to engage directly with the richness that is introduced to
the study of ethnic politics when one recognizes the importance of subjective and possibly incompatible
beliefs rather than objective categories and of contextual contingency rather than primordial permanence.
3 DEFINITIONS
To address these concerns, we propose a notion of social classification that generates measures of
identifiability from binary relationship between individuals conditional on arbitrary benchmark classification
rules.
We begin by defining a social demography. Given a triple <N, I, f> in which N denotes a population,
I denotes a set of categories, and f denotes a mapping from N to I (a classification rule), we say that <N, I, f>
is a “social demography” if f is a function that places each individual in one and only one category.2 The
restrictions on the placement rule are clearly weak and do not imply any “objective” membership of a
category. Membership depends entirely on how f is defined. Examples of f include “i is a member of category
j in I if i’s mother was a member of that category” or “f(i) is the category into which i places herself when
filling out a census form.”
In any given context however individuals may have personal rules, cj, for placing player i, given N and
I, that may or may not be very different to f. For example cj may place an individual i in group B if in j’s
estimation, i looks like a “typical B” or perhaps if j believes that i is likely to self-place as a B. We exploit this
feature in order to construct notions of pairwise identifiability, group identifiability, errors of inclusion and
exclusion, and group distinctness. To do so we explicitly privilege some particular rule f and generate
measures of correct classification (given f) based on the congruence of such personal rules and f.3
Pairwise Identifiability
We define correct identification as follows. Given a social demography <N, I, f> , and a rule c, that maps
from N to I, we say that the rule c correctly identifies i if c and f place i in the same category of I, that is, if c(i | N,
I) = f(i |N, I). In a world of uncertainty, we treat the notion of identifiability as a probability. Thus we define
2 The requirement that each individual falls within only one category is not onerous. It allows for the possibility of membership in categories along multiple dimensions of identity, and it allows for membership in two or more categories along a single dimension of identity. By the same token, should an individual not be classifiable under any category in some set, then she can be classified as unclassifiable in an expanded set of categories. Note further that the notion employed here does not imply any substantive consistency between the categories in I; for example that all elements in I be regional, religious or ethnic groups; indeed to incorporate the possibility that individuals have portfolios of identities, any element in I may be a combination of multiple categories on seemingly disparate dimensions of identity.
5
the pairwise identifiability of i by j under demography <N, I, f> and private placement rule cj as the probability
with which j correctly places i: g(i,j,cj| N, I )=Pr[cj(i | N, I) = f(i |N, I)]. For example, if f is the self placement
criterion, c is “player j’s best guess about i’s ethnicity within a given set of ethnic categories under a given
informational context” then we can say that the identifiability of i for j, is the probability that j’s best guess
about i’s ethnicity after learning i’s name, corresponds to i’s self-placement.4
Group Identifiability
With this foundation, we can move to more abstract statements about group identifiability. Define the
identifiability of group k (under f), for an individual j as the probability with which j codes a random member
group k in group k. Define the identifiability of a given group A, for a given group, B, as the probability that
a random member of member of A (under f) codes a random member of B (under f) as a member of B. As a
special case, we refer below to group A’s identifiability by N simply as the group’s “identifiability.”
Errors of Exclusion and Inclusion
We can also generate measures that describe the types of errors that individuals make in classification.
Consider the question of whether a given individual is an in-group member. We refer to the hypothesis that
player i is an in-group member for a player j as j’s in-group null regarding i. Given an in-group null, we say
that an error of exclusion occurs if j incorrectly identifies in-group member i as an out-group member. We
say that an error of inclusion occurs if player i is an out-group member who is incorrectly identified as an in-
group member. The probability of not making an error of exclusion, is simply the identifiability of (in-group
member) i, for j.
Group Distinctness
Finally, we define the distinctness of groups A and B for an arbitrary member j of group C, DC(A,B), as the
(expected) probability that j will identify an arbitrary individual from group A as a member of group A, given
that j classifies the individual as an A or a B, plus the (expected) probability that j will identify an arbitrary
individual from group B as a member of group B, given that j classifies the individual as an A or a B minus 1.5
The measure ranges from 1 to −1. If members of group A are never confused with each other, then
DC(A,B)=1. If guesses are independent of the true identity of the subjects (for example if placement is
decided by a coin toss), then DC(A,B)=0. Values between 0 and −1 may arise if players do worse than chance.
The score is undefined if players always classify members of A or B as members of groups other than A or B.
3 Note that the personal placement considered here are also mappings from N to I. implicitly then we exclude from analysis the congruence of rules that map to sets of categories different from I. 4 Note that whereas others (for example Chandra 2004) argue that identifiability may be a defining characteristic of an ethnic category, we treat identifiability as an empirical property of an arbitrary social demography, that may or may not obtain in practice. We use experimental methods specifically to allow us to measure how identifiability varies with informational and strategic context. 5 Although Casselli and Coleman (2002) base a theoretical model of conflict on a similar notion of distinctness, we know of no attempts to measure distinctness in this way empirically.
6
Note that two groups may not be highly distinct yet individuals from group A may still find particular
individuals from B highly identifiable. We illustrate the notion of distinctness and the distinction between
group distinctness and individual identifiability with an example.6
Consider the case where player i is drawn from group A with probability p, and from group B with
probability 1−p. Assume that A types all possess some characteristic θ, that is held by B types only with
probability q. We let X denote the treatment wherein some viewer j observes whether or not i possesses θ.
Let j’s private placement rule be given by cj(i,X) = A if and only if j’s posterior assessment that i is a member
of group A exceeds .5. Using Bayes’ rule, j’s posterior is given by: Pr(i∈A|θ) = p/(p + q(1 − p)) and
Pr(i∈A|0) = 0.
What then, is the distinctness of A and B for i under informational treatment X? There are two cases
of interest. In the first case Pr(i∈A|θ)≤.5. In this case, no matter what signal is received, i believes j to be a
member of group B. In this case, D(A,B) = 1 + 0 − 1 =0. The signal is too weak relative to the prior to allow
the player to distinguish between the groups. In the second case, Pr(i∈A|θ)>.5, and so, upon observing θ, j
infers that i is in group A. In this case if i is an A, he will never be classified as a B; however if he is a B then
he will be classified as an A with probability q. Therefore D(A,B) = 1+(1-q) − 1 = 1 − q. The groups are
perfectly distinct only if q = 0. Two features of this example are especially noteworthy. The first is that even if
distinctness is imperfect, individual members of group B may be perfectly identifiable whenever θ is not
observed (but not when it is). The second is that the notion of distinctness is context rather than simply
attribute dependent, it depends explicitly on an individual’s priors; thus A and B, though “objectively”
identical may yield different distinctness measures depending on the social demography.
Signs and Signals The identifiability of individuals depends then on the information that viewers have at their disposal and the
way they choose to act on this information. In many politically relevant contexts, the availability of this
information is itself a choice and may be subject to strategic manipulation by the person to be identified. To
study this feature of social interaction, we draw on a useful distinction between signs and signals of group
membership developed by Gambetta (2005). Although the distinction is imperfect, we use “sign” to denote a
manifestation of group membership that is beyond an individual’s control, at least in the short run, and we
use “signal” to denote an action taken by an individual in order to communicate membership of an identity
group. In the language used by Gambetta, passing implies a three way relationship, between the would-be
passer—the agent, the individual that the agent is trying to convince—the target, and the type that the agent
is trying to pass as—the model. Signaling theory suggests that the use of signals can lead to successful
6 It is of interest to note that this definition of distinctness is equivalent to the determinant of the 2×2 matrix P in which each cell entry, pij, denotes the probability with which a row type is classified as a column type given that it is classified among some column type. In this case the determinant is given by p11p22 − p12p21 =p11p22 − (1−p11)(1−p22) = p11+p22 −1. Thus the distinctness measure is a natural measure of the extent to which this matrix diverges from the identity matrix.
7
passing in situations in which the signal is available to agents from multiple groups but at different rates. If a
signal is available to all individuals then it may not carry any information about group membership; if it is
only available to one group, then it cannot be used by another to pass as members of that group (Bacharach
and Gambetta 2001).
While signaling can lead to successful passing, its impact on identification will depend on the relative
costs to individuals of making different types of errors. An example in the appendix describes the logic in
more detail and illustrates how the introduction of the possibility of signaling can result—even in a context of
optimal signal extraction—in either a rise or fall in the identifiability of a given group and, correspondingly, to
either a rise or fall in the occurrence of different types of errors. While either type of error can increase based
on the distribution of signals and the player’s priors, in a context with uniform priors over membership, the
introduction of new information should not result in a net rise in both types of error.
The formal definition of these notions of identifiability, errors in placement, distinctness, and signs
and signals, allows us to make progress in the measurement of identifiability. As emphasized above, and as
indicated by the formal expressions we use, a group’s identifiability is radically contingent—it is a function of
the information available, the characteristics of identifiers and identified, and, crucially, the social demography
invoked. This is why, throughout the paper, when we refer to identifiability we do so for a given social
demography. This contingency means that the specifics of our empirical frame are important for interpreting
our results. It also means, however, that we can seek to make more general statements about identification
processes as a function of the empirical frame employed. In particular, we can examine how the identifiability or
distinctness of groups change as a function of the set of categories used, the criteria for membership of
groups, the population under consideration, and most germane for our work in this paper, of the information
made available to—and/or by—individuals.
4 EXPERIMENTAL DESIGN
We now describe an experimental design that fixes a particular social demography and attempts to measure
the identifiability of individuals within this demography. Our design builds on experimental protocols
pioneered by social psychologists interested in how individuals assign people to social categories (Allport and
Kramer 1946; Secord 1959; Blasovich, Wyer, Swart, and Kibler 1997; Harris 2002). The experimental set-up
permits us to assess, first, the ability of individuals to place others conditional on a controlled set of signs. On
the basis of these measures of identifiability, we can describe the propensity of in-group members to make
errors of exclusion and inclusion and produce empirical measures of the distinctness of different groups. Our
experimental approach also introduces an innovation not included in previous studies: the possibility of
strategic signals about identity. From this data, we can examine the potential for passing and explore how
individuals incorporate the information provided by noisy signals, given the signs already available to them.
8
Ethnic Demography of Uganda
Our subjects were drawn from among the diverse ethnic groups of Uganda. We employ a benchmark
demography that uses the ethnic categories and figures contained in the 2000 Ugandan census.7 The census
categories generally mirror linguistic divisions and, in most cases, reflect the distribution of previously
autonomous societies. The major divisions, based on language groups, are between the Nilo-Saharan
languages in the North, themselves subdivided into Eastern Nilotic (including the Iteso and the Karamojong),
Western Nilotic (Acholi, Langi, and Alur,), Central Sudanic (Lugbara); the Bantu languages of the South,
themselves divided into the Eastern Lacustrine (Baganda and Basoga), and the Western Lacustrine (Banyoro,
Batoro, and Banyankole); and the smaller Kuliak languages, including the Ik and Soo. The capital, Kampala,
which is located in the center of the country, is populated by people who (or whose parents) migrated from
all regions of the country.
With so many different groups of different sizes it is difficult to construct a simple measure of the
ethnic structure of a population. One measure that is commonly used by social scientists (although flawed8) is
the index of ethno-linguistic fragmentation (ELF), which is calculated as the probability that two randomly
drawn people in a given environment will be from different groups. In a perfectly homogenous society, it
takes a score of zero; in a perfectly heterogeneous society, it takes a value of one. Unsurprisingly, given the
large number of different ethnic groups in the country and the small size of even the largest, the figure for
Uganda, calculated using the 73 groups enumerated in the census as the ethnic units, is 0.93. By any account,
this represents an extremely high level of ethnic diversity, placing Uganda near the top of the global ranking
by ELF, second only to Tanzania.
Importantly, however, a country’s ethnic diversity at the national level does not imply diversity at the
local level. There are in Uganda many homogenous areas but others that are also locally diverse. Among
these, Kampala is the largest; it is also one of the most diverse, ranking sixth in terms of ethnic diversity. Our
subjects were drawn from the Kawempe division of Kampala in an area that we call Mulago-Kyebando. The
four parishes that make up Mulago-Kyebando are more diverse than other parts of the country. Yet defined
more locally in terms of the 26 local council units (LC1s) that make up these four parishes, they exhibit less
diversity than Kampala as a whole and are considerably less diverse than Uganda as a whole. Figure 1 uses
census data (and thus census categories) to present the relative sizes of the fifteen largest ethnic groups in
Mulago-Kyebando. The blue bars (on the left) represent the proportion of each group in our study area; for
comparison, the red bars (on the right) capture the proportion of that same group in Uganda as a whole. The
7 For the most part, there is little disagreement over what formal categories should be included in the Uganda census. Some do argue, however, that the use of any such categories reifies boundaries between the citizens of a country. For this reason, questions about ethnic identity were removed from censuses in 1969 and in 1980. 8 Posner (2004) enumerates a number of facets of ethnic demography that ELF fails to adequately capture including different distributions in the size of ethnic groups (many of which, when summarized in ELF, produce the same value), the spatial distribution of groups, and the depth of divisions among different ethnic groups.
9
Baganda are the dominant ethnic group in Mulago-Kyebando, as they are throughout Kampala. They are
followed in the distribution by two sizeable western groups, the Banyankole and the Bafumbira, and one
eastern group, the Basoga. Other western groups (including the Bakiga and Batoro) are also present, as are a
small number of residents from northern groups.
(Figure 1)
Ethnic Demography of Subjects
Now, let us consider the benchmark demography of our subject population. When we prepared to recruit
subjects in Mulago-Kyebando, we were faced with two conflicting goals. One was to draw a fully
representative sample. Since most experiments employ university students or non-representative samples of
volunteers, a truly representative sampling strategy would put us in a position to do something that few
studies have been able to accomplish: to make inferences from the results of our experiments about the real
world that our subjects inhabit.9 We felt this to be especially important given that the behavior under study—
how people understand the ethnicity of people with whom they interact—is almost certainly affected by the
local environment in which people live (and specifically by their priors about the distribution of groups in the
population). With a representative sample, we knew we would be in a stronger position to ensure that
people’s prior with respect to the identities of their partners would be broadly consistent.
A second (and, unfortunately, incompatible) goal was to maximize statistical power. Because we are
interested in patterns of in-group and out-group identification and were committed to a random matching of
subjects, we needed to ensure that our sample demographics would permit us to observe a reasonable
number of in-group and out-group pairings across different ethnic groups. Given the demographic profile of
Mulago-Kyebando, a simple random sample would have resulted in many in-group pairings among the
Baganda, many out-group pairings that included Baganda, and very few in-group pairings of any other kind.
The second largest group in Mulago-Kyebando, the Banyankole, represents just 7% of the population. With
random matching, we would expect only 0.5% of our pairings to involve Banyankole co-ethnics. A simple
random sample with randomized matching would have prevented us from observing the number of pairings
we needed to work out the impact of shared group membership (independent of patterns of interaction
among Baganda).
One response would have been to abandon random sampling entirely and select subjects simply on
the basis of their ethnic group—for example, by sampling such that our subject pool contained members of
only three ethnic groups of equal sizes. However, that approach would have meant that the demography in
our experiment would not match any demography that our subjects were likely to encounter in the real world.
Their prior beliefs about the types of people they would encounter would have matched poorly with the
9 Bahry and Wilson’s (forthcoming) study of fairness norms in Russian republics provides a rare but important counterexample to the tradition of employing non-random samples.
10
individuals they would actually see in the experiment, making our subsequent interpretation of the results
more difficult.
With two worthy goals but only one sample to draw, we selected a middle ground. Using data from a
key informant survey, we identified a subset of local council units (LC1s) in Mulago-Kyebando that include
somewhat higher proportions of the Banyankole and Bafumbira (the second and third most common ethnic
groups). We then set sampling targets for each LC1 such that random sampling techniques within each LC1
would yield a sample population with a slightly smaller share of the largest group in Mulago-Kyebando, the
Baganda, and larger shares of the Banyankole and the Bafumbira (and the Banyarwanda as well, a group
considered similar ethnically to the Bafumbira).
Using this technique, we drew a total sample of 300 subjects from this area.10 The resulting ethnic
demography of our subject population is shown in Figure 2. The horizontal axis indicates the share of the
group in Mulago-Kyebando (based on census data) and the vertical axis indicates the share of the group in
our sample (based on the self-identification of subjects as belonging to particular census categories). We see
that our sampling strategy yielded a slight underrepresentation of the largest group, the Baganda and an
overrepresentation of the smaller groups, notably the Bafumbira and Banyakole. The Banyarawanda comprise
5% of our sample for example (16 subjects) whereas they comprise only 1.5% of the population of Mulago-
Kyebando. The Alur, on the other hand, comprise 3% of the Mulago-Kyebando population but only 1% of
our sample (3 subjects). Overall, the distribution of ethnic groups in the sample population and the true
population are similar. Consequently, we can be confident that subjects playing our games encounter other
subjects in proportions nearly identical to those they would encounter in random everyday interactions in
their local environment.
(Figure 2)
Experimental Protocol
Since our primary interest is in working out how people categorize one another, our experimental design is
relatively straightforward. As a “benchmark” classification rule we use information about how our subjects
identify their ethnic group membership in a pre-experiment questionnaire (given the categories enumerated in
the census). We then invited other subjects to guess the identities of a set of randomly selected partners,
rewarding them when their guess corresponded with how the partner identified him or herself. Importantly,
we manipulated experimentally the information about partners available to those participating in the exercise.
For each subject, we collected five different images with a digital camera, each providing those viewing the
images with different levels of information that could be used to make an inference about the subject’s ethnic
10 Random sampling was conducted using a random compass. Teams entered each LC1 at a central point and chose random directions and a random walking period. At the designated stopping time, they selected the closest house and created a basic roster of household members. Stratifying by gender, a household member was then selected at random and invited to participate in the games. Members were invited whether or not they were present at the time of the selection. In such cases, their names and ages were recorded and these confirmed upon registration. Using this approach, we had a very low non participation rate: more than 75% of those we selected agreed to participate in the study.
11
background. Information level 1 was a simple headshot. Information levels 2 and 3 involved two short videos
in which the subject greeted the camera, respectively, in Luganda (Kampala’s lingua franca) and in the
respondent’s primary language. Information levels 4 and 5 involved video images, like those in 2 and 3, but in
which the subject also provided his or her given and family names.11
Note that these images are only partially ordered with respect to the level of information they
provide about the subject’s ethnic background. Information level 5 is greater than 3 which is in turn greater
than 1; information level 4 is greater than 2 which is also greater than 1. Whether or not the information
contained in 5 is greater than the information in 4, however, depends on the ability of an observer to extract a
name from a statement even if he or she does not understand the language spoken. Whether or not
information level 4 provides more information than level 3 depends on whether a name caries more
information than the use of a primary language. By exposing participants to an image of a partner at a
randomly selected level of information, and asking them to guess that individual’s ethnic background, we are
able to measure the impact of informational contexts on ethnic identifiability and to examine how
identifiability depends on observer characteristics and ethnic group membership.
The structure of the experiment worked as follows (further details, along with the specific proctor
instructions, are available from the authors). Participants were told that they would see a random sample of
about 50 images/videos of people drawn from the project’s subject pool. We explained that the ethnic
backgrounds of the individuals whose images they would see matched the baseline demography of Mulago-
Kyebando. To ensure that all subjects had the same prior beliefs about the distribution of ethnic groups in
the area, we described explicitly the approximate distribution of ethnic groups in Mulago-Kyebando. We then
assigned subjects to randomly selected computers and enumerators. After (privately) seeing each image on a
computer screen, subjects were asked to guess the way that person would have classified him or herself, if
they were asked. For every correct guess, participants received 100 USh; their total potential winnings were
5000 USh (approximately three dollars). Two hundred and seventy-four subjects participated in the
identification game, producing a total of 15,265 guesses.
To explore how the introduction of signals impacts identifiability, we developed a treatment (which
we call “SIMDIS”) as follows. Subjects (128 in total) that took part in the first 50% of sessions of the
identification exercise were asked to record four further videos in which they would attempt to convince
viewers (targets) either of their true or of a false identity. These videos were longer videos (up to 30 seconds in
length) and in almost all cases included an explicit statement of the ethnic group to which the individual was
claiming to belong. Two versions were recorded in which subjects attempted to convince targets of their true
identities (we call these “simulation” videos); one of these was addressed specifically to a co-ethnic and the
other to a general, mixed audience. Another two videos were then recorded in which subjects tried to
11 Both Isaacs (1975) and Chandra (2004) emphasize the importance of the information contained in a name. In Fershtman and Gneezy (2001), names are employed as the sole marker of ethnic group affiliation in experiments that seek to uncover patterns of inter- and intra-ethnic interaction. Charness and Gneezy (forthcoming) measure the more general impact of names on behavior in dictator and ultimatum games.
12
convince people of a false identity, selected for them by us (we call these “dissimulation” videos). In the first,
subjects tried to convince a member of group B that they are in fact members of group B; in the second, they
try to convince a general audience that they are in fact members of group B.
The models used for the dissimulation videos were selected with probability proportionate to the
relative size of a group in the subject population, excluding the group of the subject being recorded. This
probability is useful in that it results in an approximately equal probability that a given individual is
dissimulating conditional upon the group of which he claims to be a member, although it leads to a somewhat
lower share of dissimulation videos among those claiming to be Baganda.12 Importantly, by controlling the
distribution of models, we are in a position to estimate not simply whether agents can pass in general but
what the prospects are for passing across each agent-target-model combination.
In all cases, subjects were given a short amount of time to think about how they wanted to present
themselves for the simulation and dissimulation videos; beyond being asked to state the group to which they
were claiming membership, they were free to use any signals available to them. In addition, players were given
an incentive in the dissimulation videos to “try hard”; specifically, they were told that “For every person that
you are able to convince that you are “Y”, you will be paid 500 USh. This means that if you try hard, you
could earn up to 4000 USh.”
For the second set of sessions, 139 subjects played both the identification game and the
“dissimulation” game. Note that none of the players that took part in the identification game, in the first or
second sessions, had previously recorded simulation and dissimulation videos. For the identification game
they were shown a set of on average 23 images, producing approximately 3000 data points. Subjects then
viewed simulation/dissimulation videos for the same sets of subjects. Enumerators advised subjects that (a)
about half the time people in the videos were telling the truth and half the time people were trying to pass (b)
that the true distribution of groups was as in the population of Mulago-Kyebando. A general recap of this
population profile was also given. The images themselves were grouped together into the types into which
players were claiming membership and these types were stated explicitly by the assistants (“You will now see
a set of videos of people claiming to be from Group X). After (privately) seeing each image on a computer
screen, subjects were asked to guess the way that that person would have classified him or herself, if asked.
Again for every correct guess, viewers received 100 USh; their total potential winnings were 5000 USh.
12 That is, if an individual of group k dissimulates (“Dis”) (an event which occurs with probability .5ak) then he claims to be a member of group j (“states j”) with probability aj /(1- ak). An application of Bayes’ rule then yields: Pr(Dis | States j) = 1 - .5aj / (.5aj +Σ-j.5akaj /(1- ak)) =1 - 1 / (1 + Σ-j(ak /(1- ak))). For example, if all groups are of approximately equal size, then Pr(Dis | States j)=.5. If all groups are small then Pr(Dis | States j) is close to .5. If however there is one larger group then it is in fact more likely that when this group is stated that the truth is being told. To see the logic consider a group X of size 60/100. This group will produce truthful statements about X 60/2=30 times. The remaining groups will provide false statements regarding membership of X at most 40/2=20 times. Thus most statements (at least 60% of statements) about membership in X will be true statements. Given the distribution of types in our sample, the expected Pr(Dis | States “Baganda”) is 37% while for all other groups it is 57%-58%. In the empirically sampled set of interactions, Pr(Dis | States “Baganda”)=42% while for other groups it is 58%.
13
5 EMPIRICAL RESULTS
5.1 VARIATION IN IDENTIFIABILITY
We begin with the issue of how our subjects understand the demographic environment in which they live. In
particular, we ask whether the subjective ethnic demography of Mulago-Kyebando, as measured by the way
our subjects perceive and classify one another, corresponds to the benchmark demography, based on how
our subjects identify themselves. A striking finding is that, in the aggregate, our subjects’ estimations of the
ethnic demography approximate the benchmark demography very closely.
(Figure 3)
As one can see in Figure 3, the benchmark share of each of the ethnic groups in our sample closely
tracks the relative frequency with which subjects guessed others to be members of that group. In a number of
cases – including for the Baganda and the Bafumbira – the share of guesses for these groups corresponds
exactly to the actual self-reported share of these groups in the sample.
It would be wrong, however, to conclude that our subjects are perfectly or even near perfectly
identifiable. It is possible for subjective demographies to approximate the benchmark demography on
average, without saying anything about whether people are correct in their individual guesses. For example, if
all individuals mistakenly assumed that every individual that they encountered was a co-ethnic, then the
average subjective demography would reflect exactly the benchmark demography, even though each
individual’s subjective demography would diverge radically from the benchmark. Alternatively, each individual
could guess wildly using information drawn from their knowledge of the benchmark demography, but
ignoring information from the video imagery, and the aggregate outcome would be the same.13 Something
like this better explains why aggregate benchmark and subjective demographies converge in our sample:
although guesses are correct on average, they are consistently wrong in the particulars.
Table 1(a) reports how individuals from different ethnic groups are classified (on average). Each cell
entry shows the percentage of viewings in which an individual of a row type is classified as an individual of
the column type. A quick look at the off-diagonal elements provides evidence of the extent to which people
miscode. If classifications were always correct, this matrix would be an identity matrix—all the diagonals
would contain a one and the off-diagonals a zero. The difference between this matrix and the identity matrix
is a measure of the degree of misclassification. For example, a Banyankole is correctly classified as a
Banyankole 41% of the time (upper left cell). When mistakes are made, Banyankole are most likely to be
classified as members of the most populous group, the Baganda (17% of the time). Banyankole are also often
thought to be members of other western groups, including the Bakiga (14% of the time), Batoro (8% of the
time), and Bafumbira (10% of the time). In a number of cases, individuals from one group are classified in
13 If players could gain no additional information from the video images, an optimal guessing strategy would involve all groups guessing Baganda all of the time. The result would be an aggregate subjective demography quite different from the benchmark demography.
14
another category at least as often as they are correctly coded. The Bakiga and the Batoro, for example, are
guessed to be Banyankole more frequently than they are classified correctly.
(Table 1)
While Table 1(a) offers a picture of how individuals are misclassified, Table 1(b) provides detail about
who does the misclassification. The cells report the frequency of correct identification, averaged across all
information levels and for each pair-wise combination of groups. Consider first the final column on the right
hand side of the table. The numbers in this column reflect how often, on average, individuals in each of the
benchmark ethnic categories correctly identify others: about 50% of the time. Interestingly, there is not much
variation across groups in their ability to correctly identify the ethnic backgrounds of others. The Banyankole
and Batoro are most successful and the Basoga are least successful, but these differences are not substantially
large and from a statistical point of view we cannot reject the null hypothesis that there are no differences
across groups in their guessing ability. There is significantly more variation across the bottom row of the
table. This row captures the likelihood that an arbitrary member of each of the column types is successfully
identified. The Banyoro, for example, are almost never identified correctly as Banyoro. The group that is
most commonly correctly identified is the Baganda—68% of the time.
So far we have focused only on how groups vary in how easily they can be identified and how well
others can identify them, on average. But the variation within Table 1(b) is perhaps more interesting. First,
compare the numbers in the diagonal of the table (shaded grey) with those that are located off the diagonal.
We can see immediately that individuals are more likely to be correctly identified by members of their own
group than by those that are not. Reading down each column, the number on the diagonal is consistently one
of the highest. For five groups, it is the highest; in two others, it is the second highest. Statistically speaking,
this pattern is strong: controlling both for the ethnic group of the viewer and the ethnic group of the
individual being viewed, co-ethnicity increases the likelihood of correct identification by 9 percentage
points.14
There is much to be learned as well from those cases in which other groups seem to do particularly
well. Consider the Bafumbira, who correctly identify other Bafumbira 55% of the time. But other groups do
quite well also, most notably the Banyankole. As we saw in Table 1(a), the Banyankole are “close” to the
Bafumbira in the sense that others often misidentify them as Bafumbira. It appears that not only do co-
ethnics have an advantage in identifying members of their own groups, but also that members of groups that
are often confused are particularly good at sorting one another into the correct categories.
As we noted earlier, any assessment of the degree of correct identification depends on the
informational environment. As one might expect, people are much more successful in the identification
exercise as they gain access to more information about the people whose group membership they are trying
to discern. Beyond the obvious impact of more information, it is natural to ask how different types of
14 Employing a probit model with correct identification as the dependent variable and fixed effects for each ethnic group viewing and each ethnic group being viewed (and clustering over all the guesses of each player), the associated z statistic for the coefficient on co-ethnicity is 4.8.
15
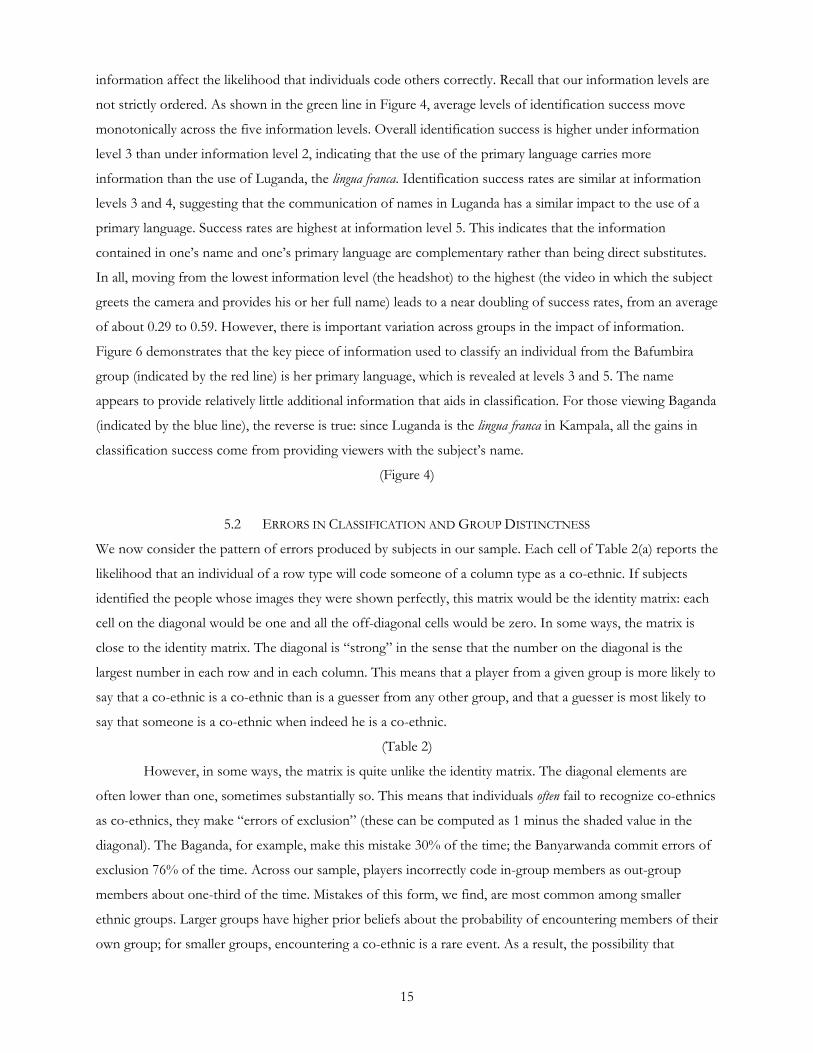
information affect the likelihood that individuals code others correctly. Recall that our information levels are
not strictly ordered. As shown in the green line in Figure 4, average levels of identification success move
monotonically across the five information levels. Overall identification success is higher under information
level 3 than under information level 2, indicating that the use of the primary language carries more
information than the use of Luganda, the lingua franca. Identification success rates are similar at information
levels 3 and 4, suggesting that the communication of names in Luganda has a similar impact to the use of a
primary language. Success rates are highest at information level 5. This indicates that the information
contained in one’s name and one’s primary language are complementary rather than being direct substitutes.
In all, moving from the lowest information level (the headshot) to the highest (the video in which the subject
greets the camera and provides his or her full name) leads to a near doubling of success rates, from an average
of about 0.29 to 0.59. However, there is important variation across groups in the impact of information.
Figure 6 demonstrates that the key piece of information used to classify an individual from the Bafumbira
group (indicated by the red line) is her primary language, which is revealed at levels 3 and 5. The name
appears to provide relatively little additional information that aids in classification. For those viewing Baganda
(indicated by the blue line), the reverse is true: since Luganda is the lingua franca in Kampala, all the gains in
classification success come from providing viewers with the subject’s name.
(Figure 4)
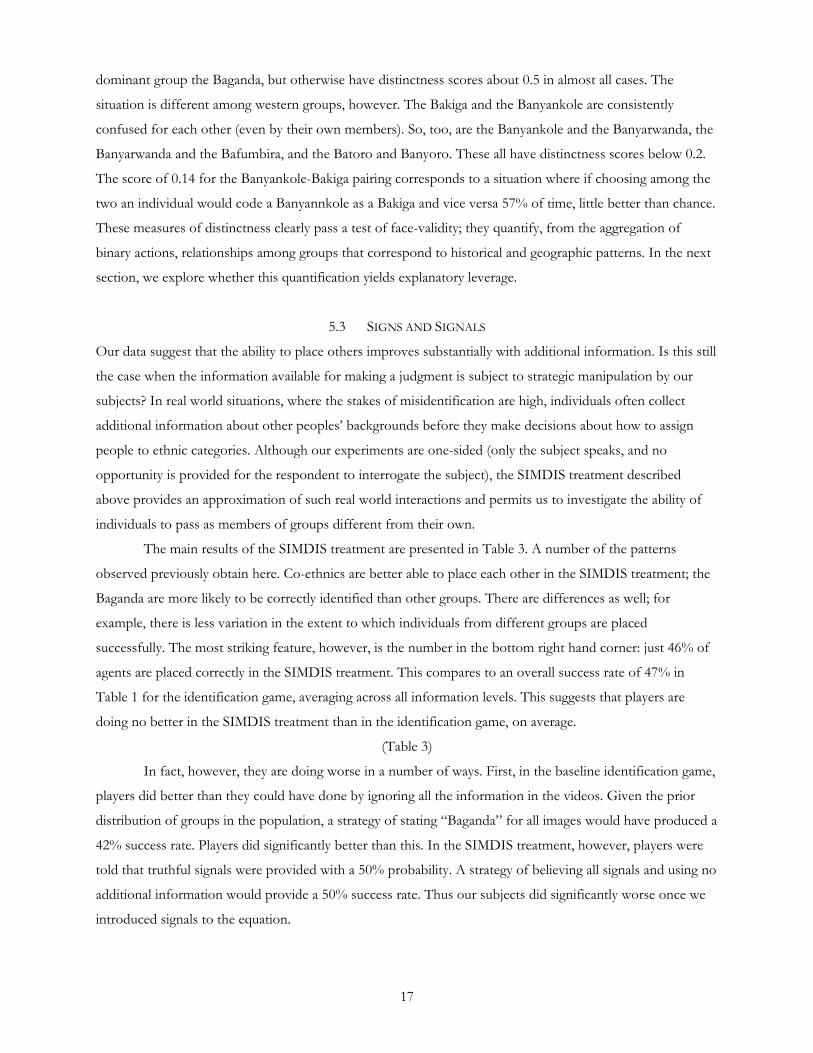
5.2 ERRORS IN CLASSIFICATION AND GROUP DISTINCTNESS
We now consider the pattern of errors produced by subjects in our sample. Each cell of Table 2(a) reports the
likelihood that an individual of a row type will code someone of a column type as a co-ethnic. If subjects
identified the people whose images they were shown perfectly, this matrix would be the identity matrix: each
cell on the diagonal would be one and all the off-diagonal cells would be zero. In some ways, the matrix is
close to the identity matrix. The diagonal is “strong” in the sense that the number on the diagonal is the
largest number in each row and in each column. This means that a player from a given group is more likely to
say that a co-ethnic is a co-ethnic than is a guesser from any other group, and that a guesser is most likely to
say that someone is a co-ethnic when indeed he is a co-ethnic.
(Table 2)
However, in some ways, the matrix is quite unlike the identity matrix. The diagonal elements are
often lower than one, sometimes substantially so. This means that individuals often fail to recognize co-ethnics
as co-ethnics, they make “errors of exclusion” (these can be computed as 1 minus the shaded value in the
diagonal). The Baganda, for example, make this mistake 30% of the time; the Banyarwanda commit errors of
exclusion 76% of the time. Across our sample, players incorrectly code in-group members as out-group
members about one-third of the time. Mistakes of this form, we find, are most common among smaller
ethnic groups. Larger groups have higher prior beliefs about the probability of encountering members of their
own group; for smaller groups, encountering a co-ethnic is a rare event. As a result, the possibility that

16
someone is a co-ethnic is discounted, even if he is in fact a co-ethnic. The likelihood of making these errors
also depends on the information available. Based only on the information contained in a headshot, the overall
likelihood of committing an error of exclusion is 75%, these errors drop to just 15% of viewings at the
highest level of information.
The matrix also differs from the identity matrix because of its off-diagonal elements. A positive
number in an off-diagonal cell means that people are coding out-group members as in-group members. For
example, Banyankole classify Bakiga as Banyankole about 44% of the time, only slightly less than they do
other Banyankole. Bakiga also tend to confuse Banyankole for Bakiga, but not to the same extent—they code
Banyankole as Bakiga 20% of the time. In Uganda, Bakiga and Banyankole are often considered related
groups, and these patterns of misclassification are consistent with that fact. Banyarwanda code Bafumbira as
Banyarwanda slightly more often then they code self-declared Banyarwanda as Banyarwanda. In effect, it
appears that Banyarwanda do not tend to discriminate between Banyarwanda and Bafumbira when coding in-
group members. Self-declared Bafumbira, however, are three times more likely to code Bafumbira as
Bafumbira, as they are to code Banyarwanda as Bafumbira. Again, these two groups are considered closely
related and they speak the same language. The patterns of miscodings we observe in our data seem to reflect
this fact.
Other groups that are closely related also make such errors of inclusion, although, as with the
Banyarwanda and Bafumbira, there are often asymmetries. In contrast with errors of exclusion, the incidence
of these miscodings is relatively low (see the last column of Table 2a). Overall, they occur just 11% of the
time in our sample. Errors of inclusion tend to be most common among larger groups: the Baganda miscode
out-group members as co-ethnics approximately one in every five viewings. Among smaller groups, the
incidence is much lower: Bafumbira or Banyarwanda, for example, make this mistake in only 5% of their
viewings. More generally, it is clear that the nature of boundary errors is correlated with group size. Whereas
errors of exclusion are more common among smaller groups, errors of inclusion are much more common
among larger groups. Again, as we would expect, the incidence of these errors declines substantially with
increases in information.
We focus on how our subjects miscode one another because the errors they make form the basis for
an empirical assessment of the distinctness of groups. For each of the pair-wise relationships among groups
(i.e. Banyankole-Baganda, Banyankole-Banyankole, and so on), we construct the frequency with which
subjects in our sample miscode members of dyads into each other’s groups (conditional upon coding into this
pair of categories) to create the distinctness measure as described earlier (with our entire sample playing the
role of group C). The results of this exercise are presented in Table 2(b).
Strikingly all the cell entries in Table 2(b) are positive: the ability of our population on average to
distinguish any two groups is better than chance. The lowest scores are for clusters of groups that share
regional connections. The three main eastern groups, the Bagisu, the Basoga and the Iteso are largely distinct
from all other groups and from one another; in each case they are most likely to be confused with the
17
dominant group the Baganda, but otherwise have distinctness scores about 0.5 in almost all cases. The
situation is different among western groups, however. The Bakiga and the Banyankole are consistently
confused for each other (even by their own members). So, too, are the Banyankole and the Banyarwanda, the
Banyarwanda and the Bafumbira, and the Batoro and Banyoro. These all have distinctness scores below 0.2.
The score of 0.14 for the Banyankole-Bakiga pairing corresponds to a situation where if choosing among the
two an individual would code a Banyannkole as a Bakiga and vice versa 57% of time, little better than chance.
These measures of distinctness clearly pass a test of face-validity; they quantify, from the aggregation of
binary actions, relationships among groups that correspond to historical and geographic patterns. In the next
section, we explore whether this quantification yields explanatory leverage.
5.3 SIGNS AND SIGNALS
Our data suggest that the ability to place others improves substantially with additional information. Is this still
the case when the information available for making a judgment is subject to strategic manipulation by our
subjects? In real world situations, where the stakes of misidentification are high, individuals often collect
additional information about other peoples’ backgrounds before they make decisions about how to assign
people to ethnic categories. Although our experiments are one-sided (only the subject speaks, and no
opportunity is provided for the respondent to interrogate the subject), the SIMDIS treatment described
above provides an approximation of such real world interactions and permits us to investigate the ability of
individuals to pass as members of groups different from their own.
The main results of the SIMDIS treatment are presented in Table 3. A number of the patterns
observed previously obtain here. Co-ethnics are better able to place each other in the SIMDIS treatment; the
Baganda are more likely to be correctly identified than other groups. There are differences as well; for
example, there is less variation in the extent to which individuals from different groups are placed
successfully. The most striking feature, however, is the number in the bottom right hand corner: just 46% of
agents are placed correctly in the SIMDIS treatment. This compares to an overall success rate of 47% in
Table 1 for the identification game, averaging across all information levels. This suggests that players are
doing no better in the SIMDIS treatment than in the identification game, on average.
(Table 3)
In fact, however, they are doing worse in a number of ways. First, in the baseline identification game,
players did better than they could have done by ignoring all the information in the videos. Given the prior
distribution of groups in the population, a strategy of stating “Baganda” for all images would have produced a
42% success rate. Players did significantly better than this. In the SIMDIS treatment, however, players were
told that truthful signals were provided with a 50% probability. A strategy of believing all signals and using no
additional information would provide a 50% success rate. Thus our subjects did significantly worse once we
introduced signals to the equation.
18
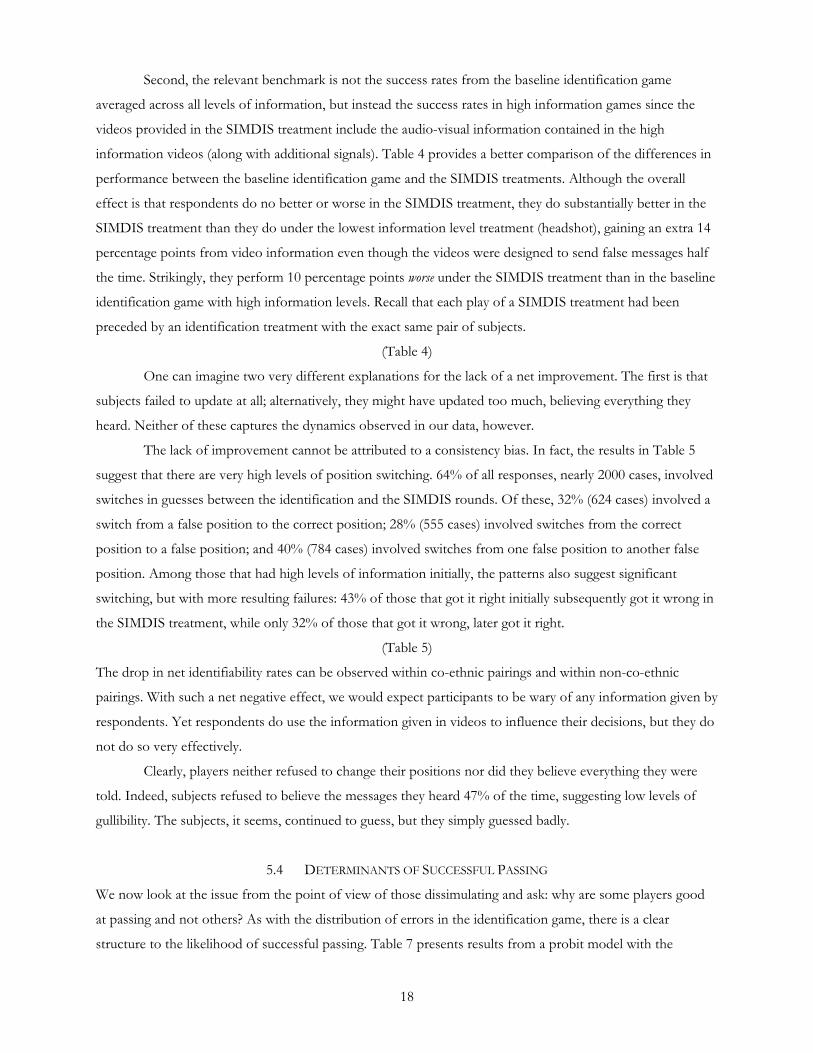
Second, the relevant benchmark is not the success rates from the baseline identification game
averaged across all levels of information, but instead the success rates in high information games since the
videos provided in the SIMDIS treatment include the audio-visual information contained in the high
information videos (along with additional signals). Table 4 provides a better comparison of the differences in
performance between the baseline identification game and the SIMDIS treatments. Although the overall
effect is that respondents do no better or worse in the SIMDIS treatment, they do substantially better in the
SIMDIS treatment than they do under the lowest information level treatment (headshot), gaining an extra 14
percentage points from video information even though the videos were designed to send false messages half
the time. Strikingly, they perform 10 percentage points worse under the SIMDIS treatment than in the baseline
identification game with high information levels. Recall that each play of a SIMDIS treatment had been
preceded by an identification treatment with the exact same pair of subjects.
(Table 4)
One can imagine two very different explanations for the lack of a net improvement. The first is that
subjects failed to update at all; alternatively, they might have updated too much, believing everything they
heard. Neither of these captures the dynamics observed in our data, however.
The lack of improvement cannot be attributed to a consistency bias. In fact, the results in Table 5
suggest that there are very high levels of position switching. 64% of all responses, nearly 2000 cases, involved
switches in guesses between the identification and the SIMDIS rounds. Of these, 32% (624 cases) involved a
switch from a false position to the correct position; 28% (555 cases) involved switches from the correct
position to a false position; and 40% (784 cases) involved switches from one false position to another false
position. Among those that had high levels of information initially, the patterns also suggest significant
switching, but with more resulting failures: 43% of those that got it right initially subsequently got it wrong in
the SIMDIS treatment, while only 32% of those that got it wrong, later got it right.
(Table 5)
The drop in net identifiability rates can be observed within co-ethnic pairings and within non-co-ethnic
pairings. With such a net negative effect, we would expect participants to be wary of any information given by
respondents. Yet respondents do use the information given in videos to influence their decisions, but they do
not do so very effectively.
Clearly, players neither refused to change their positions nor did they believe everything they were
told. Indeed, subjects refused to believe the messages they heard 47% of the time, suggesting low levels of
gullibility. The subjects, it seems, continued to guess, but they simply guessed badly.
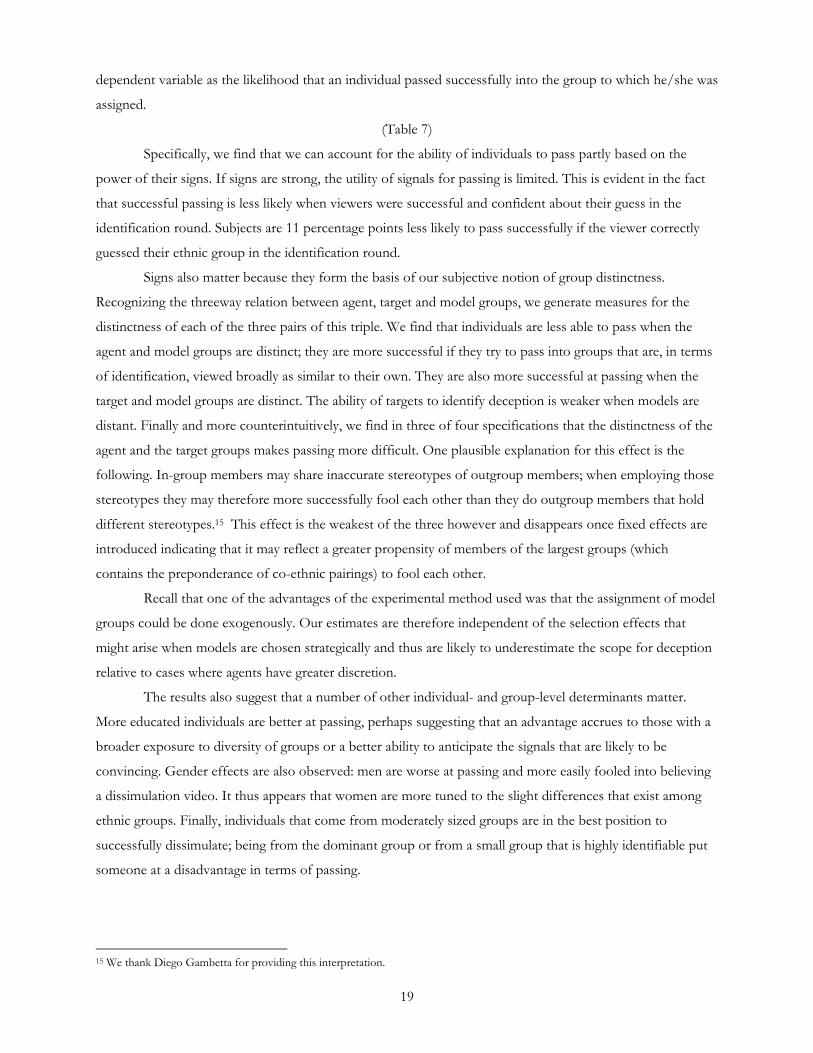
5.4 DETERMINANTS OF SUCCESSFUL PASSING
We now look at the issue from the point of view of those dissimulating and ask: why are some players good
at passing and not others? As with the distribution of errors in the identification game, there is a clear
structure to the likelihood of successful passing. Table 7 presents results from a probit model with the
19
dependent variable as the likelihood that an individual passed successfully into the group to which he/she was
assigned.
(Table 7)
Specifically, we find that we can account for the ability of individuals to pass partly based on the
power of their signs. If signs are strong, the utility of signals for passing is limited. This is evident in the fact
that successful passing is less likely when viewers were successful and confident about their guess in the
identification round. Subjects are 11 percentage points less likely to pass successfully if the viewer correctly
guessed their ethnic group in the identification round.
Signs also matter because they form the basis of our subjective notion of group distinctness.
Recognizing the threeway relation between agent, target and model groups, we generate measures for the
distinctness of each of the three pairs of this triple. We find that individuals are less able to pass when the
agent and model groups are distinct; they are more successful if they try to pass into groups that are, in terms
of identification, viewed broadly as similar to their own. They are also more successful at passing when the
target and model groups are distinct. The ability of targets to identify deception is weaker when models are
distant. Finally and more counterintuitively, we find in three of four specifications that the distinctness of the
agent and the target groups makes passing more difficult. One plausible explanation for this effect is the
following. In-group members may share inaccurate stereotypes of outgroup members; when employing those
stereotypes they may therefore more successfully fool each other than they do outgroup members that hold
different stereotypes.15 This effect is the weakest of the three however and disappears once fixed effects are
introduced indicating that it may reflect a greater propensity of members of the largest groups (which
contains the preponderance of co-ethnic pairings) to fool each other.
Recall that one of the advantages of the experimental method used was that the assignment of model
groups could be done exogenously. Our estimates are therefore independent of the selection effects that
might arise when models are chosen strategically and thus are likely to underestimate the scope for deception
relative to cases where agents have greater discretion.
The results also suggest that a number of other individual- and group-level determinants matter.
More educated individuals are better at passing, perhaps suggesting that an advantage accrues to those with a
broader exposure to diversity of groups or a better ability to anticipate the signals that are likely to be
convincing. Gender effects are also observed: men are worse at passing and more easily fooled into believing
a dissimulation video. It thus appears that women are more tuned to the slight differences that exist among
ethnic groups. Finally, individuals that come from moderately sized groups are in the best position to
successfully dissimulate; being from the dominant group or from a small group that is highly identifiable put
someone at a disadvantage in terms of passing.
15 We thank Diego Gambetta for providing this interpretation.
20
6 DISCUSSION: WHY DO PEOPLE DO WORSE WITH MORE INFORMATION?
It is surprising that the introduction of signals, in addition to signs, appears to weaken people’s ability to
identify the ethnic groups of those with whom they interact. In our experiment, the extra information
provided to viewers in the SIMDIS treatment is complex, but it should be informative. It consists of (a) the
new information provided to the viewer in the video recorded by individuals attempting to pass and (b) the
knowledge that individuals are attempting to pass with some fixed probability (50%). Provided that priors are
correct, Bayesian updaters should combine these pieces of information to develop a posterior that is on
average more accurate than a player’s priors. Why might they fail?
One possibility is that, for each group of videos that players saw (organized by the ethnic group to
which players claimed to belong), they inferred falsely that people were telling the truth 50% of the time and
dissimulating the other 50%. In fact, as we describe in footnote 12, despite the equal probability of
dissimulation across all images viewed, the probability of being Baganda if one claims to be Baganda is greater
than .5; for all other groups, the probability that that a person is a member of a group other than the Baganda
in which they claim membership is less than .5. If players treat exactly half of each group of statements as
being true and half as being false, this would result in false rejections of true claims from Baganda and a
surplus of false acceptances of claims by individuals claiming not to be Baganda. Although on average our
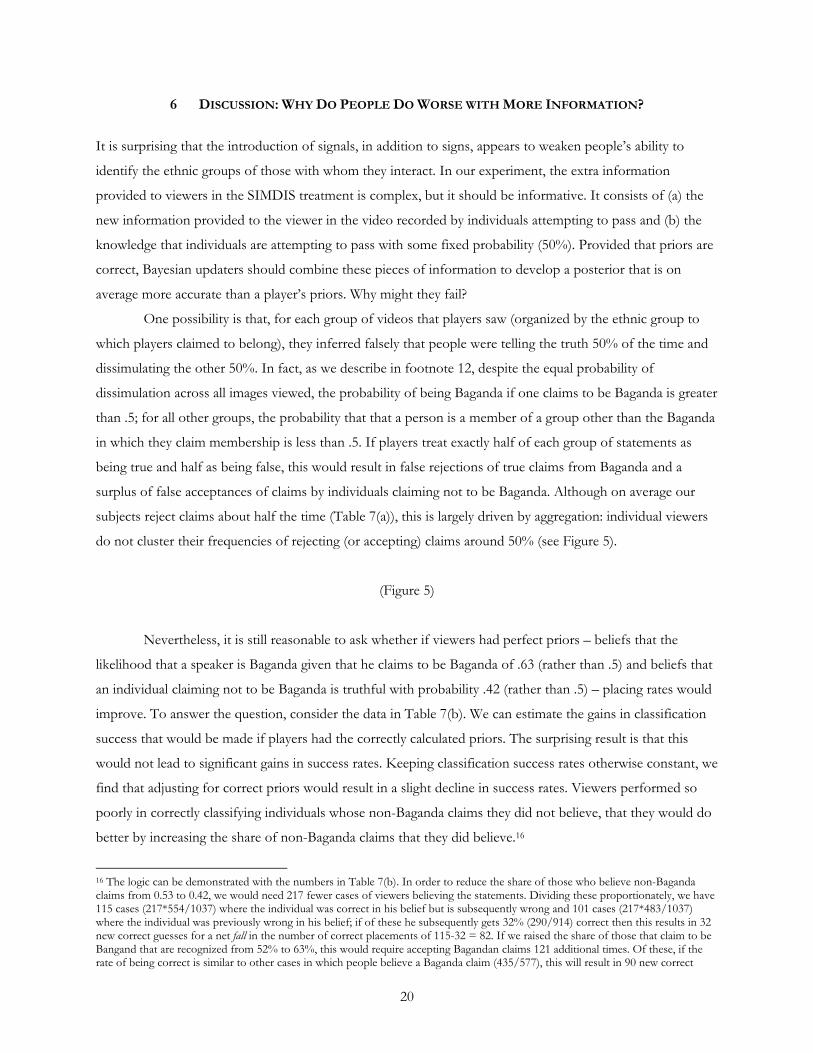
subjects reject claims about half the time (Table 7(a)), this is largely driven by aggregation: individual viewers
do not cluster their frequencies of rejecting (or accepting) claims around 50% (see Figure 5).
(Figure 5)
Nevertheless, it is still reasonable to ask whether if viewers had perfect priors – beliefs that the
likelihood that a speaker is Baganda given that he claims to be Baganda of .63 (rather than .5) and beliefs that
an individual claiming not to be Baganda is truthful with probability .42 (rather than .5) – placing rates would
improve. To answer the question, consider the data in Table 7(b). We can estimate the gains in classification
success that would be made if players had the correctly calculated priors. The surprising result is that this
would not lead to significant gains in success rates. Keeping classification success rates otherwise constant, we
find that adjusting for correct priors would result in a slight decline in success rates. Viewers performed so
poorly in correctly classifying individuals whose non-Baganda claims they did not believe, that they would do
better by increasing the share of non-Baganda claims that they did believe.16
16 The logic can be demonstrated with the numbers in Table 7(b). In order to reduce the share of those who believe non-Baganda claims from 0.53 to 0.42, we would need 217 fewer cases of viewers believing the statements. Dividing these proportionately, we have 115 cases (217*554/1037) where the individual was correct in his belief but is subsequently wrong and 101 cases (217*483/1037) where the individual was previously wrong in his belief; if of these he subsequently gets 32% (290/914) correct then this results in 32 new correct guesses for a net fall in the number of correct placements of 115-32 = 82. If we raised the share of those that claim to be Bangand that are recognized from 52% to 63%, this would require accepting Bagandan claims 121 additional times. Of these, if the rate of being correct is similar to other cases in which people believe a Baganda claim (435/577), this will result in 90 new correct
21
A second possibility is that players, upon learning that the SIMDIS images were deceptive with
known probability, then (falsely) inferred that the original identification images were also possibly false and as
a result reevaluated their confidence in the baseline information we had provided. If this were the case,
however, we would expect individuals to fall back on their priors with a corresponding increase in guesses
that subjects are from the plurality group, the Baganda. In fact, this is not what we observe: whereas in the
baseline identification game, 43% of guesses placed subjects as Baganda, only 33% placed subjects as Baganda
in the SIMDIS treatment. Players effectively placed less weight on their priors, and more weight on the
information contained in the videos. Viewers disregarded the claims of those that claimed to be non-Baganda
about half the time, but they only placed them as Baganda 20% of the time.
Finally, it is possible that people had correct priors but that they systematically misapplied Bayes’
rule: they are, simply not good at making such calculations. A common way in which Bayes’ rule is misapplied
is by putting too little weight on priors. People infer that if a test correctly identifies the presence of a rare
disease 99% of the time then a positive reading implies a 99% chance that a patient has the disease. Here, too,
subjects place insufficient weight on their priors. As a result, they give too much weight to the wrong kinds of
signals, even though they know them to be false. This sort of process has been found in other studies of
political information as well. For example, in one recent study of the perverse effects of additional
information, Benjamin and Shapiro (2006) asked subjects to view unfamiliar gubernatorial debates with the
sound turned off and asked them to predict the electoral outcomes. Subjects’ guesses were able to explain
approximately 20% of the variation in electoral outcomes. Strikingly, however, when the sound was turned
on, subjects’ guesses became weaker predictors of electoral outcomes. Their results suggest that visual
information, such as body language and looks, contain higher quality information about electability than
verbal content, but that when given access to verbal signals, subjects reduce their reliance on the higher
quality information. Our results suggest that similar behavior may be occurring in the context of ethnic
profiling. As players attempt to make sense of strategic signals, they undervalue information they had gleaned
already from less manipulable signs.
7 CONCLUSION: IMPLICATIONS FOR THEORIES OF ETHNIC POLITICS
Despite the theoretical complexities associated with the notions of group membership and the “correct”
placement of individuals into socially constructed categories, we argue that it is possible to develop a
meaningful notion of ethnic identification and group distinctness, based on binary relations between
individuals. Using the theoretical apparatus we develop to achieve this end and assigning a privileged position
to the self placement criterion, we document that, contrary to the assumption of easy identifiability implicit or
claims. And if the rate of being correct for these cases when individuals classify them as non-Baganda is similar to others (88/531), then this will result in a loss of 20 previously correct classifications for a total gain of 70 correct classifications. The net outcome of such revisions in priors would in fact be a net fall in correct classification of 82-70 = 12, rather than a net rise. These calculations are approximations as they rely on preserving proportions as shares change, but they do suggest that these small errors in priors are unlikely to be what accounts for poor placement in the SIMDIS treatment.
22
explicit in much micro-level theoretical work on ethnic politics, there is substantial variability both within and
between groups in the identifiability of members. Beyond describing the existence of substantial variation, we
demonstrate that there is a structure to the successes and errors that people make, and we argue that these
systematic errors can be important to models of collective action, at least in contexts where identification
based on limited information is germane.
The structure of errors in the identification game allows us to generate a new measure of the
distinctness of groups and which we use to help account for variation in rates of passing. In general, we find,
individuals are weak at incorporating new information from verbal signals sent by possible dissimulators. The
net effect of introducing signals is a decline in identifiability, contrary to expectations from rational updating.
Even still, some types of passing are easier than others. Individuals find it much easier to pass when they
come from groups that are more difficult to identify on the basis of signs alone and when they attempt to
pass into groups similar to their own but distinct from the group of the observer.
Such variation has substantive implications for collective action within and between groups. It
suggests one reason why collective action may be easier for some ethnic groups than for others. If
identifiability is imperfect, then the ability of groups to police their members will be weakened and the
advantage that ethnic groups have for collective action, particularly in anonymous environments, will
disappear. To the extent that identifiability varies systematically across ethnic groups, the ability of ethnic
groups to achieve collective ends should vary as well. Furthermore, the results suggest that discrimination
against some groups may be easier than against others. The fact that passing may be easier for some individuals
and groups than for others has implications for the permeability of group boundaries and the ability of
groups to police them, and for the collective action benefits that come from such policing. All of these
features depend on the level of information available to individuals. Information, however, has distinct
implications for different types of bilateral interaction. In particular, the costs and benefits involved in gathering
information about the ethnic identity of individuals may vary across groups, with information adding especially in the case
of in-group out-group identifications and when subjects are from difficult to identify groups.
For scholars, this research has implications for both empirical and theoretical work. For empirical
work, our research serves as a demonstration of a methodology for collecting rich information about one
important aspect of ethnic structures. Cross-national studies of the implications of ethnic structures on
various political and economic outcomes have been hampered by the weakness of data on ethnicity. Much of
the data that exists relies on a reified notion of what groups are, but also fails to capture any aspects of ethnic
structures beyond the number and relative sizes of groups. Our measures of identifiability and the distinctness
of groups provide a richer class of measures of group structure. The methodology employed here also
suggests a way of taking seriously the notion that categorization depends on context and moving from there
to generating measures of the impact of context on categories.
The arguments developed in this paper also have implications for theoretical work. While the
assumption that the ethnic backgrounds of individuals are readily apparent has facilitated theoretical analysis,

23
it has also limited the study of important aspects of ethnic processes that should no longer be overlooked.
Variation in identifiability may have real consequences, as the account of ethnic identification failure in Sri
Lanka provided earlier suggests. Taking these differences seriously—and incorporating them into models of
ethnic politics—is a critical next step in producing better theories that link ethnicity to cooperation and
conflict.
24
References
Appiah, Anthony Kwame. 1992.. In My Father’s House. New York: Oxford University Press.
Akerlof, George. 1976. “The Economics of Caste and of the Rat Race and Other Woeful Tales.” Quarterly
Journal of Economics 90: 599-617.
Allport, Gordon and Bernard Kramer. 1946. “Some Roots of Prejudice.” The Journal of Psychology 22: 9-39.
Anderson, Benedict. 1991. Imagined Communities: Reflections on the Origin and Spread of Nationalism. Revised
Edition ed. London and New York: Verso.
Bahry, Donna and Rick Wilson. Forthcoming. “Confusion or Fairness in the Field? Rejections in the
Ultimatum Game under the Strategy Method.” Journal of Economic Behavior and Organization.
Barth, Fredrik. 1969. Ethnic Groups and Boundaries. Boston: Little Brown.
Bacharach, Michael and Diego Gambetta. 2001. “Trust in Signs.” In Karen Cook (ed.) Trust and Society. New
York: Russell Sage Foundation.
Benjamin, Daniel and Jesse Shapiro. 2006. “Thin-Slice Forecasts of Gubernatorial Elections” Working Paper.
Blasovich, Jim, Natalie Wyer, Laura Swart, and Jeffrey Kibler. 1997. “Racism and Racial Categorization.”
Journal of Personality and Social Psychology 72: 1364-1372.
Becker, Gary S. 1971. The Economics of Discrimination. Chicago: University of Chicago Press.
Caselli, Francseco and Wilbur John Coleman. 2002. “On the Theory of Ethnic Conflict.” Typescript. Harvard
University.
Chandra, Kanchan. 2001 “Cumulative Findings in the Study of Ethnic Politics.” APSA-CP, Vol. 12 (1), 2001:
7-11.
Chandra, Kanchan. 2004. Why Ethnic Parties Succeed: Patronage and Ethnic Headcounts in India. New York:
Cambridge University Press.
Charness, Gary and Uri Gneezy. Forthcoming. “What’s in a Name? Anonymity and Social Distance in
Dictator and Ultimatum games.” Journal of Economic Behavior and Organization.
Fearon, James D. 1999. “Why Ethnic Politics and ‘Pork’ Tend to Go Together.” Typescript. Stanford
University.
Fearon, James D. and David D. Laitin. 1996. “Explaining Interethnic Cooperation.” American Political Science
Review 90, 4: 715-35.
Fershtman, Chaim and Uri Gneezy. 2001. “Discrimination in a Segmented Society: An Experimental
Approach.” Quarterly Journal of Economics 116, 1: 351-377.
Gambetta, Diego. 2005. “Deceptive Mimicry in Humans.” In S. Hurley and N. Chater (eds.) Perspective on
Imitation: From Cognitive Neuroscience to Social Science. Cambridge: MIT Press: pp. 221-241
Greif, Avner. 1989. “Reputation and Coalitions in Medieval Trade.” Journal of Economic History 49 (December):
857-882.
25
Harris, David. 2002. “In the Eye of the Beholder: Observed Race and Observer Characteristics.” PSC
Research Report No. 02-522. Population Studies Center. University of Michigan.
Horowitz, Donald L. 2001. The Deadly Ethnic Riot. Berkeley and Los Angeles: University of California Press.
Human Rights Watch. 2002. “‘We Are Not the Enemy’: Hate Crimes Against Arabs, Muslims, and Those
Perceived to be Arab or Muslim After September 11.” 14, 6 (November).
Isaacs, Harold. 1975. “Idols of the Tribe.” In Nathan Glazer and Daniel P. Moynihan. Ethnicity: Theory and
Experience. Cambridge, MA: Harvard University Press: 29-52.
Kuruvilla, Matthai Chakko. 2006. “9/11 Five Years Later: Typecasting Muslims as a Race.” San Francisco
Chronicle, 3 September.
Laitin, David D. 1995. “Marginality: A Microperspective.” Rationality and Society 7 (January): 31-57.
Posner, Daniel N. 2004. “Measuring Ethnic Fractionalization in Africa.” American Journal of Political Science 48
(October): 849-863.
Secord, Paul. 1959. “Stereotyping and Favorableness in the Perception of Negro Faces.” Journal of Abnormal
Social Psychology 59: 309-315.
Tajfel, H., Billig, M. G., Bundy, R. P., and Flament, C. 1971. “Social Categorization and Intergroup
Behavior.” European Journal of Social Psychology 1: 149-178.
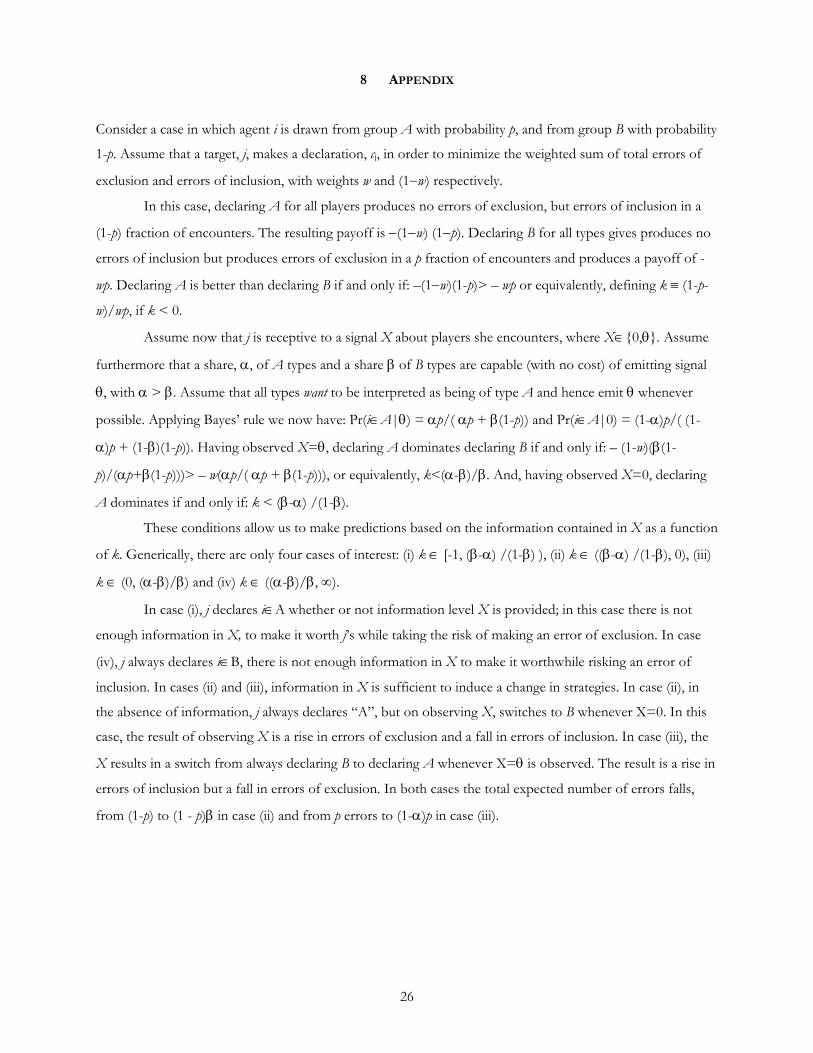
26
8 APPENDIX
Consider a case in which agent i is drawn from group A with probability p, and from group B with probability
1-p. Assume that a target, j, makes a declaration, cj, in order to minimize the weighted sum of total errors of
exclusion and errors of inclusion, with weights w and (1−w) respectively.
In this case, declaring A for all players produces no errors of exclusion, but errors of inclusion in a
(1-p) fraction of encounters. The resulting payoff is −(1−w) (1−p). Declaring B for all types gives produces no
errors of inclusion but produces errors of exclusion in a p fraction of encounters and produces a payoff of -
wp. Declaring A is better than declaring B if and only if: –(1−w)(1-p)> – wp or equivalently, defining k ≡ (1-p-
w)/wp, if k < 0.
Assume now that j is receptive to a signal X about players she encounters, where X∈{0,θ}. Assume
furthermore that a share, α, of A types and a share β of B types are capable (with no cost) of emitting signal
θ, with α > β. Assume that all types want to be interpreted as being of type A and hence emit θ whenever
possible. Applying Bayes’ rule we now have: Pr(i∈A|θ) = αp/( αp + β(1-p)) and Pr(i∈A|0) = (1-α)p/( (1-
α)p + (1-β)(1-p)). Having observed X=θ, declaring A dominates declaring B if and only if: – (1-w)(β(1-
p)/(αp+β(1-p)))> – w(αp/( αp + β(1-p))), or equivalently, k<(α-β)/β. And, having observed X=0, declaring
A dominates if and only if: k < (β-α) /(1-β).
These conditions allow us to make predictions based on the information contained in X as a function
of k. Generically, there are only four cases of interest: (i) k ∈ [-1, (β-α) /(1-β) ), (ii) k ∈ ((β-α) /(1-β), 0), (iii)
k ∈ (0, (α-β)/β) and (iv) k ∈ ((α-β)/β, ∞).
In case (i), j declares i∈A whether or not information level X is provided; in this case there is not
enough information in X, to make it worth j’s while taking the risk of making an error of exclusion. In case
(iv), j always declares i∈B, there is not enough information in X to make it worthwhile risking an error of
inclusion. In cases (ii) and (iii), information in X is sufficient to induce a change in strategies. In case (ii), in
the absence of information, j always declares “A”, but on observing X, switches to B whenever X=0. In this
case, the result of observing X is a rise in errors of exclusion and a fall in errors of inclusion. In case (iii), the
X results in a switch from always declaring B to declaring A whenever X=θ is observed. The result is a rise in
errors of inclusion but a fall in errors of exclusion. In both cases the total expected number of errors falls,
from (1-p) to (1 - p)β in case (ii) and from p errors to (1-α)p in case (iii).
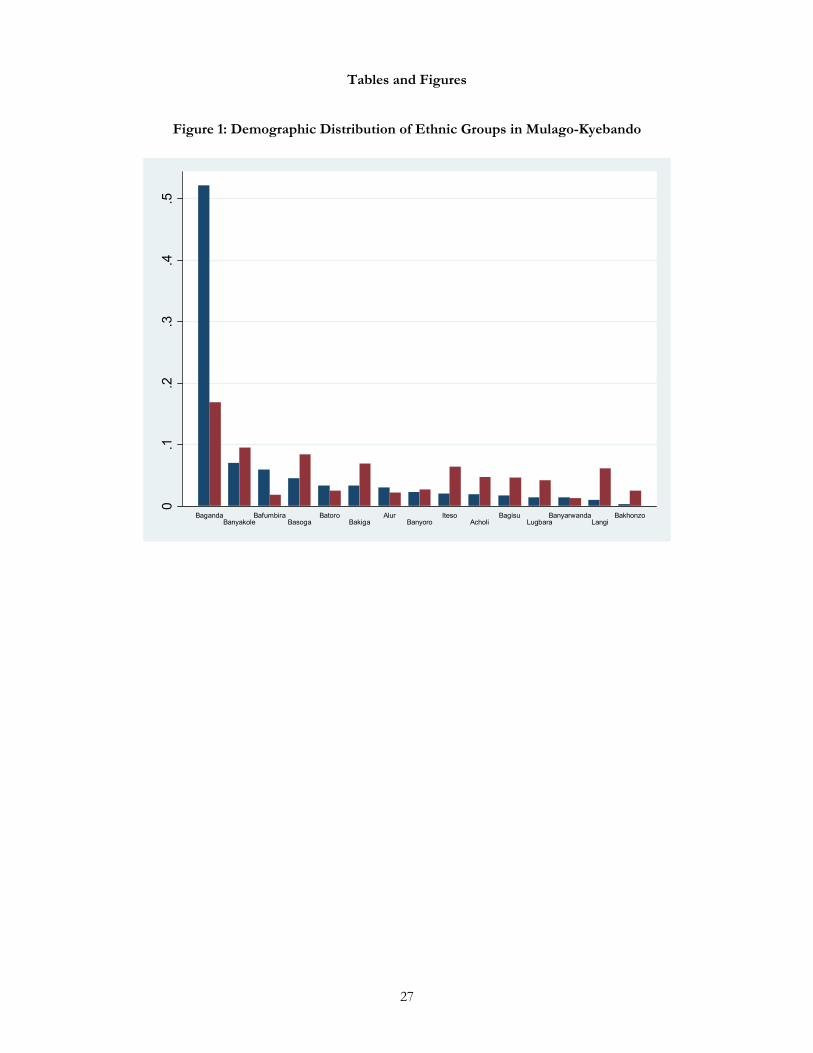
27
Tables and Figures
Figure 1: Demographic Distribution of Ethnic Groups in Mulago-Kyebando
0.1
.2.3
.4.5
BagandaBanyakole
BafumbiraBasoga
BatoroBakiga
AlurBanyoro
ItesoAcholi
BagisuLugbara
BanyarwandaLangi
Bakhonzo
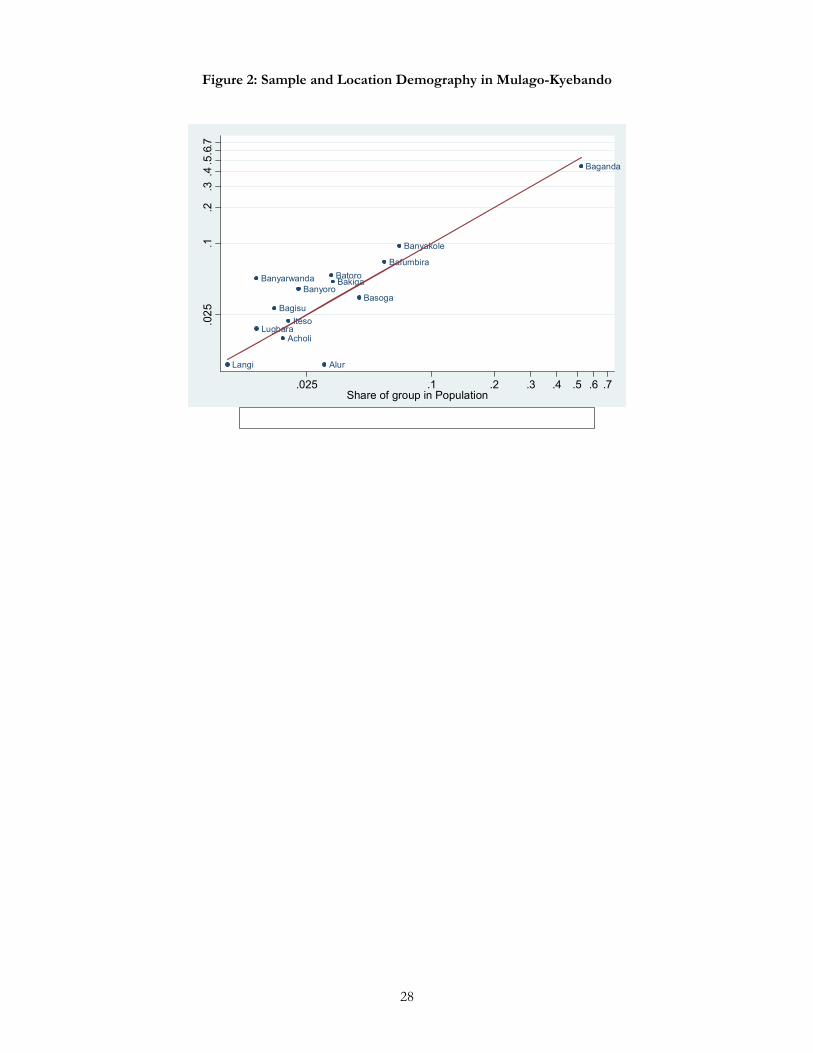
28
Figure 2: Sample and Location Demography in Mulago-Kyebando
Acholi
Alur
Bafumbira
Baganda
Bagisu
Bakiga
Banyakole
BanyarwandaBanyoro
Basoga
Batoro
Iteso
Langi
Lugbara
.025
.1.2
.3.4
.5.6
.7
.025 .1 .2 .3 .4 .5 .6 .7Share of group in Population
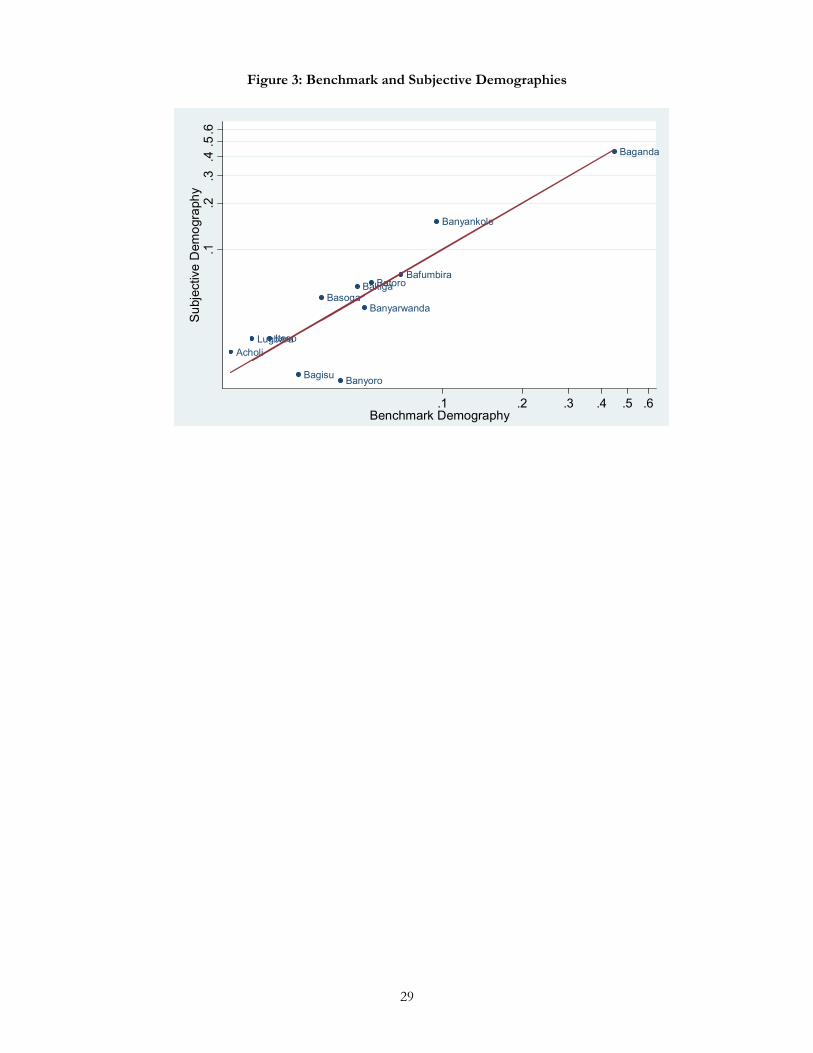
29
Figure 3: Benchmark and Subjective Demographies
Acholi
Banyankole
Baganda
Bagisu
Bakiga
BanyarwandaBasoga
Batoro
Banyoro
ItesoLugbara
Bafumbira
.1.2
.3.4
.5.6
Subj
ectiv
e D
emog
raph
y
.1 .2 .3 .4 .5 .6Benchmark Demography
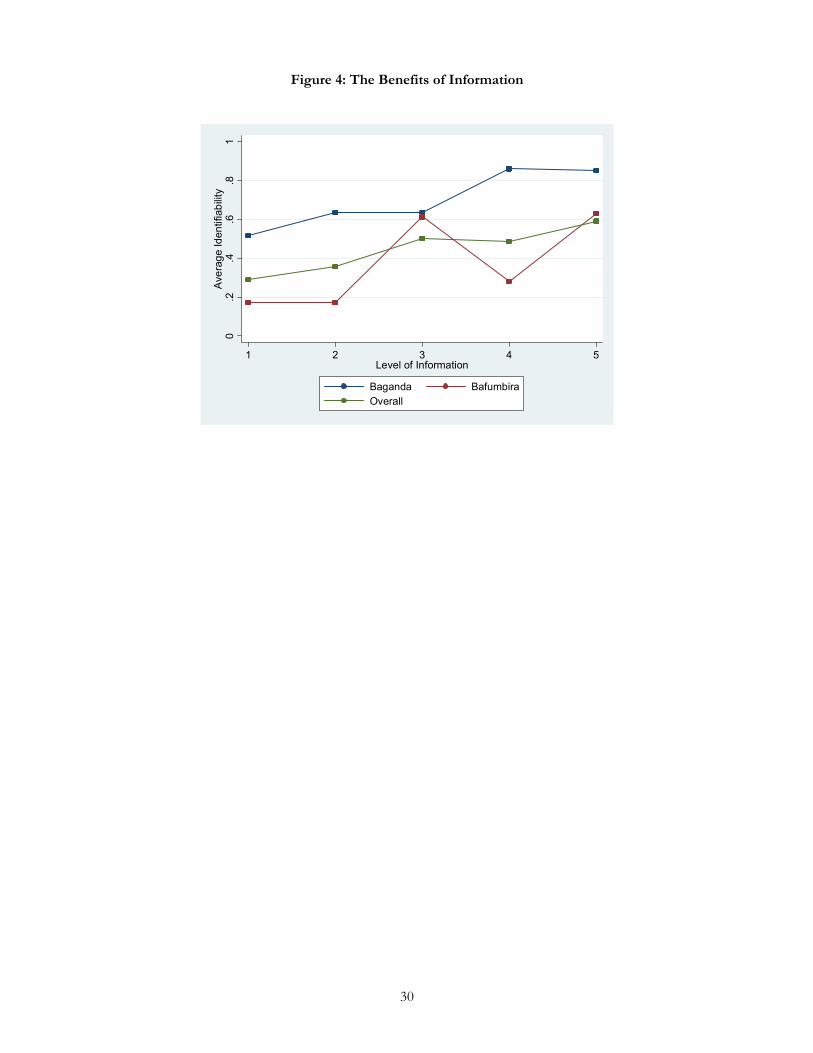
30
Figure 4: The Benefits of Information
0.2
.4.6
.81
Ave
rage
Iden
tifia
bilit
y
1 2 3 4 5Level of Information
Baganda BafumbiraOverall
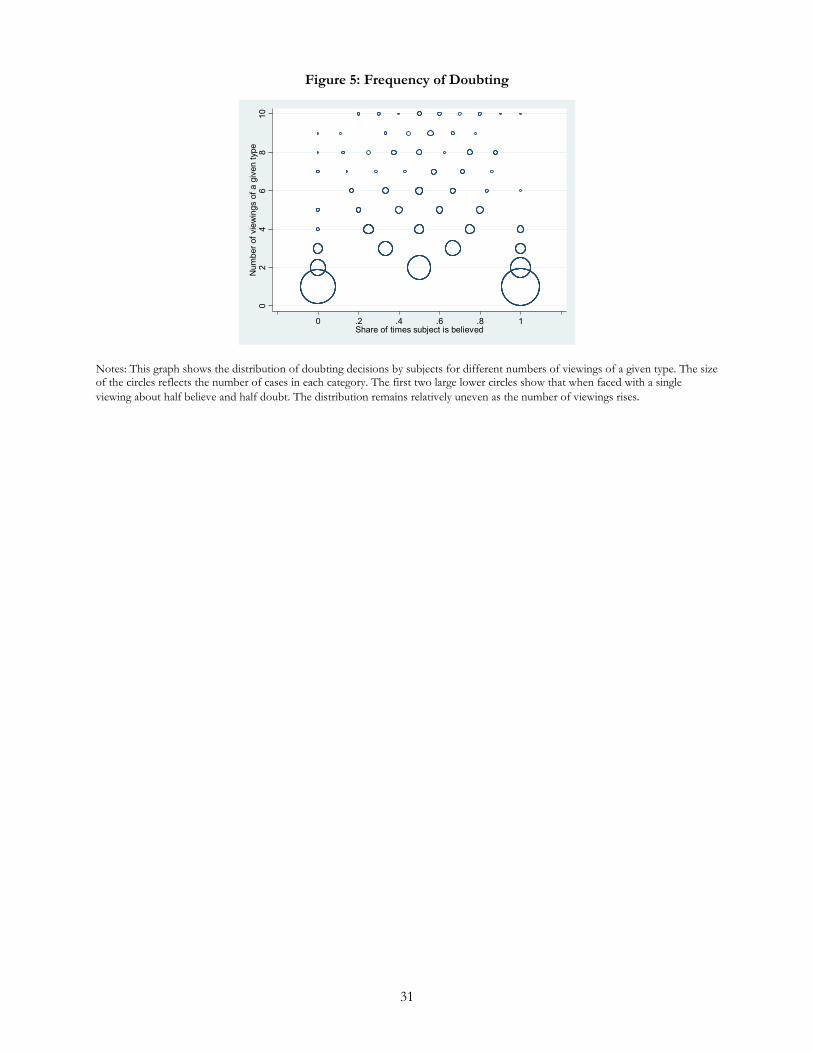
31
Figure 5: Frequency of Doubting
02
46
810
Num
ber o
f vie
win
gs o
f a g
iven
type
0 .2 .4 .6 .8 1Share of times subject is believed
Notes: This graph shows the distribution of doubting decisions by subjects for different numbers of viewings of a given type. The size of the circles reflects the number of cases in each category. The first two large lower circles show that when faced with a single viewing about half believe and half doubt. The distribution remains relatively uneven as the number of viewings rises.
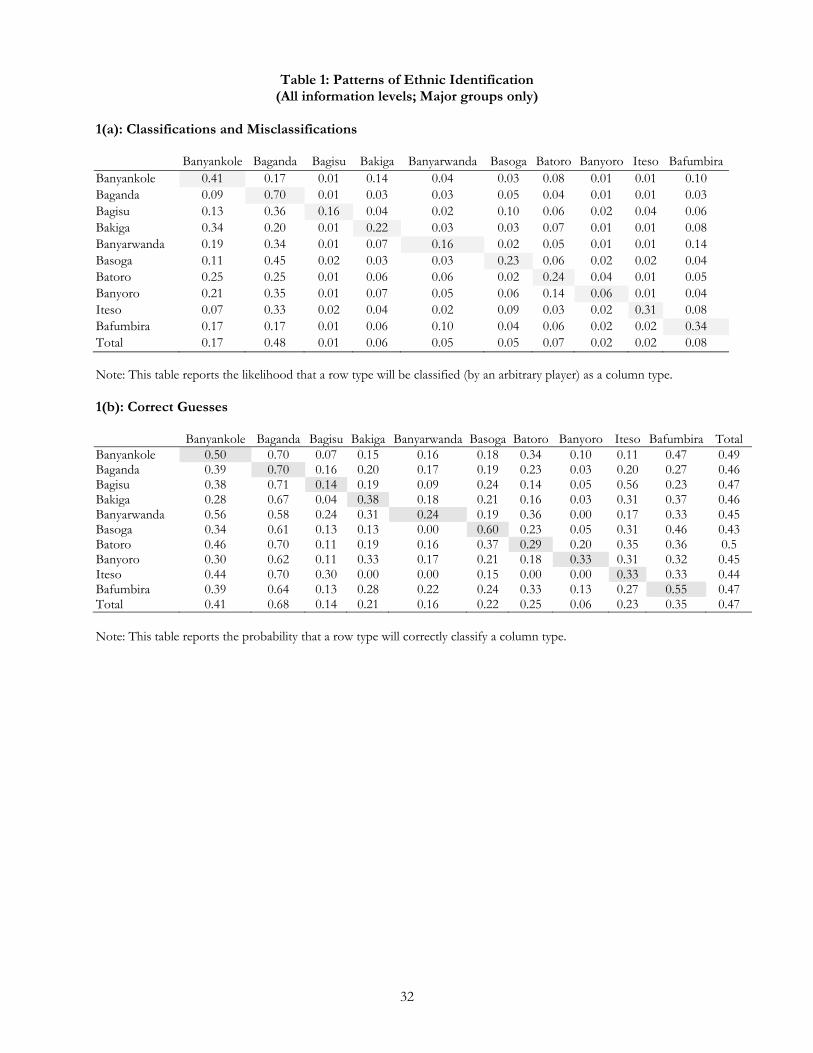
32
Table 1: Patterns of Ethnic Identification (All information levels; Major groups only)
1(a): Classifications and Misclassifications
Banyankole Baganda Bagisu Bakiga Banyarwanda Basoga Batoro Banyoro Iteso BafumbiraBanyankole 0.41 0.17 0.01 0.14 0.04 0.03 0.08 0.01 0.01 0.10Baganda 0.09 0.70 0.01 0.03 0.03 0.05 0.04 0.01 0.01 0.03Bagisu 0.13 0.36 0.16 0.04 0.02 0.10 0.06 0.02 0.04 0.06Bakiga 0.34 0.20 0.01 0.22 0.03 0.03 0.07 0.01 0.01 0.08Banyarwanda 0.19 0.34 0.01 0.07 0.16 0.02 0.05 0.01 0.01 0.14Basoga 0.11 0.45 0.02 0.03 0.03 0.23 0.06 0.02 0.02 0.04Batoro 0.25 0.25 0.01 0.06 0.06 0.02 0.24 0.04 0.01 0.05Banyoro 0.21 0.35 0.01 0.07 0.05 0.06 0.14 0.06 0.01 0.04Iteso 0.07 0.33 0.02 0.04 0.02 0.09 0.03 0.02 0.31 0.08Bafumbira 0.17 0.17 0.01 0.06 0.10 0.04 0.06 0.02 0.02 0.34Total 0.17 0.48 0.01 0.06 0.05 0.05 0.07 0.02 0.02 0.08 Note: This table reports the likelihood that a row type will be classified (by an arbitrary player) as a column type. 1(b): Correct Guesses Banyankole Baganda Bagisu Bakiga Banyarwanda Basoga Batoro Banyoro Iteso Bafumbira TotalBanyankole 0.50 0.70 0.07 0.15 0.16 0.18 0.34 0.10 0.11 0.47 0.49Baganda 0.39 0.70 0.16 0.20 0.17 0.19 0.23 0.03 0.20 0.27 0.46Bagisu 0.38 0.71 0.14 0.19 0.09 0.24 0.14 0.05 0.56 0.23 0.47Bakiga 0.28 0.67 0.04 0.38 0.18 0.21 0.16 0.03 0.31 0.37 0.46Banyarwanda 0.56 0.58 0.24 0.31 0.24 0.19 0.36 0.00 0.17 0.33 0.45Basoga 0.34 0.61 0.13 0.13 0.00 0.60 0.23 0.05 0.31 0.46 0.43Batoro 0.46 0.70 0.11 0.19 0.16 0.37 0.29 0.20 0.35 0.36 0.5Banyoro 0.30 0.62 0.11 0.33 0.17 0.21 0.18 0.33 0.31 0.32 0.45Iteso 0.44 0.70 0.30 0.00 0.00 0.15 0.00 0.00 0.33 0.33 0.44Bafumbira 0.39 0.64 0.13 0.28 0.22 0.24 0.33 0.13 0.27 0.55 0.47Total 0.41 0.68 0.14 0.21 0.16 0.22 0.25 0.06 0.23 0.35 0.47 Note: This table reports the probability that a row type will correctly classify a column type.
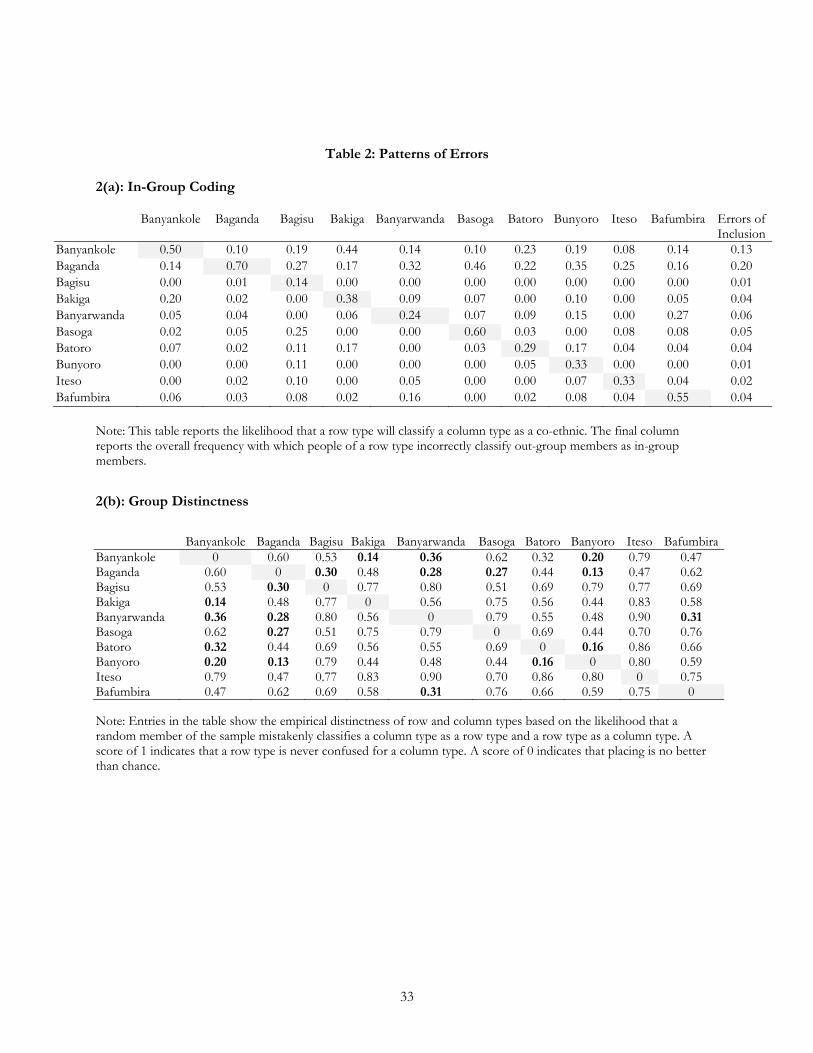
33
Table 2: Patterns of Errors
2(a): In-Group Coding
Banyankole Baganda Bagisu Bakiga Banyarwanda Basoga Batoro Bunyoro Iteso Bafumbira Errors of Inclusion
Banyankole 0.50 0.10 0.19 0.44 0.14 0.10 0.23 0.19 0.08 0.14 0.13Baganda 0.14 0.70 0.27 0.17 0.32 0.46 0.22 0.35 0.25 0.16 0.20Bagisu 0.00 0.01 0.14 0.00 0.00 0.00 0.00 0.00 0.00 0.00 0.01Bakiga 0.20 0.02 0.00 0.38 0.09 0.07 0.00 0.10 0.00 0.05 0.04Banyarwanda 0.05 0.04 0.00 0.06 0.24 0.07 0.09 0.15 0.00 0.27 0.06Basoga 0.02 0.05 0.25 0.00 0.00 0.60 0.03 0.00 0.08 0.08 0.05Batoro 0.07 0.02 0.11 0.17 0.00 0.03 0.29 0.17 0.04 0.04 0.04Bunyoro 0.00 0.00 0.11 0.00 0.00 0.00 0.05 0.33 0.00 0.00 0.01Iteso 0.00 0.02 0.10 0.00 0.05 0.00 0.00 0.07 0.33 0.04 0.02Bafumbira 0.06 0.03 0.08 0.02 0.16 0.00 0.02 0.08 0.04 0.55 0.04
Note: This table reports the likelihood that a row type will classify a column type as a co-ethnic. The final column reports the overall frequency with which people of a row type incorrectly classify out-group members as in-group members.
2(b): Group Distinctness
Banyankole Baganda Bagisu Bakiga Banyarwanda Basoga Batoro Banyoro Iteso BafumbiraBanyankole 0 0.60 0.53 0.14 0.36 0.62 0.32 0.20 0.79 0.47Baganda 0.60 0 0.30 0.48 0.28 0.27 0.44 0.13 0.47 0.62Bagisu 0.53 0.30 0 0.77 0.80 0.51 0.69 0.79 0.77 0.69Bakiga 0.14 0.48 0.77 0 0.56 0.75 0.56 0.44 0.83 0.58Banyarwanda 0.36 0.28 0.80 0.56 0 0.79 0.55 0.48 0.90 0.31Basoga 0.62 0.27 0.51 0.75 0.79 0 0.69 0.44 0.70 0.76Batoro 0.32 0.44 0.69 0.56 0.55 0.69 0 0.16 0.86 0.66Banyoro 0.20 0.13 0.79 0.44 0.48 0.44 0.16 0 0.80 0.59Iteso 0.79 0.47 0.77 0.83 0.90 0.70 0.86 0.80 0 0.75Bafumbira 0.47 0.62 0.69 0.58 0.31 0.76 0.66 0.59 0.75 0 Note: Entries in the table show the empirical distinctness of row and column types based on the likelihood that a random member of the sample mistakenly classifies a column type as a row type and a row type as a column type. A score of 1 indicates that a row type is never confused for a column type. A score of 0 indicates that placing is no better than chance.
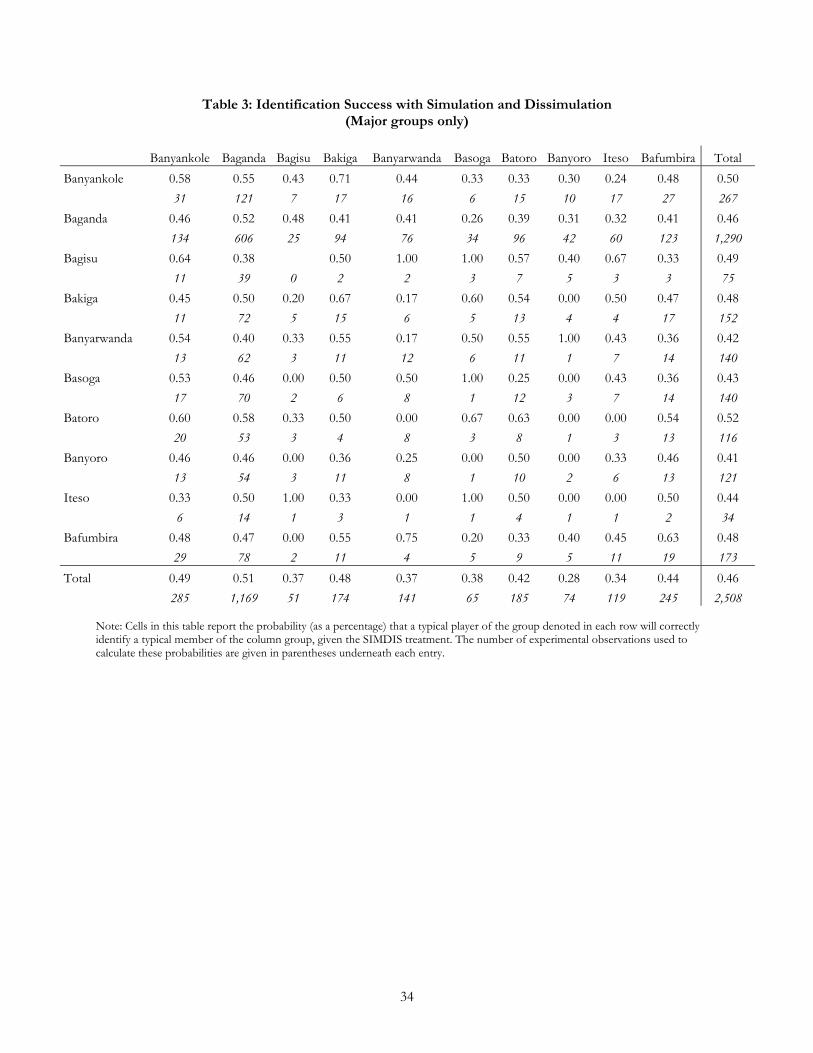
34
Table 3: Identification Success with Simulation and Dissimulation (Major groups only)
Banyankole Baganda Bagisu Bakiga Banyarwanda Basoga Batoro Banyoro Iteso Bafumbira Total Banyankole 0.58 0.55 0.43 0.71 0.44 0.33 0.33 0.30 0.24 0.48 0.50 31 121 7 17 16 6 15 10 17 27 267 Baganda 0.46 0.52 0.48 0.41 0.41 0.26 0.39 0.31 0.32 0.41 0.46 134 606 25 94 76 34 96 42 60 123 1,290 Bagisu 0.64 0.38 0.50 1.00 1.00 0.57 0.40 0.67 0.33 0.49 11 39 0 2 2 3 7 5 3 3 75 Bakiga 0.45 0.50 0.20 0.67 0.17 0.60 0.54 0.00 0.50 0.47 0.48 11 72 5 15 6 5 13 4 4 17 152 Banyarwanda 0.54 0.40 0.33 0.55 0.17 0.50 0.55 1.00 0.43 0.36 0.42 13 62 3 11 12 6 11 1 7 14 140 Basoga 0.53 0.46 0.00 0.50 0.50 1.00 0.25 0.00 0.43 0.36 0.43 17 70 2 6 8 1 12 3 7 14 140 Batoro 0.60 0.58 0.33 0.50 0.00 0.67 0.63 0.00 0.00 0.54 0.52 20 53 3 4 8 3 8 1 3 13 116 Banyoro 0.46 0.46 0.00 0.36 0.25 0.00 0.50 0.00 0.33 0.46 0.41 13 54 3 11 8 1 10 2 6 13 121 Iteso 0.33 0.50 1.00 0.33 0.00 1.00 0.50 0.00 0.00 0.50 0.44 6 14 1 3 1 1 4 1 1 2 34 Bafumbira 0.48 0.47 0.00 0.55 0.75 0.20 0.33 0.40 0.45 0.63 0.48 29 78 2 11 4 5 9 5 11 19 173 Total 0.49 0.51 0.37 0.48 0.37 0.38 0.42 0.28 0.34 0.44 0.46 285 1,169 51 174 141 65 185 74 119 245 2,508
Note: Cells in this table report the probability (as a percentage) that a typical player of the group denoted in each row will correctly identify a typical member of the column group, given the SIMDIS treatment. The number of experimental observations used to calculate these probabilities are given in parentheses underneath each entry.
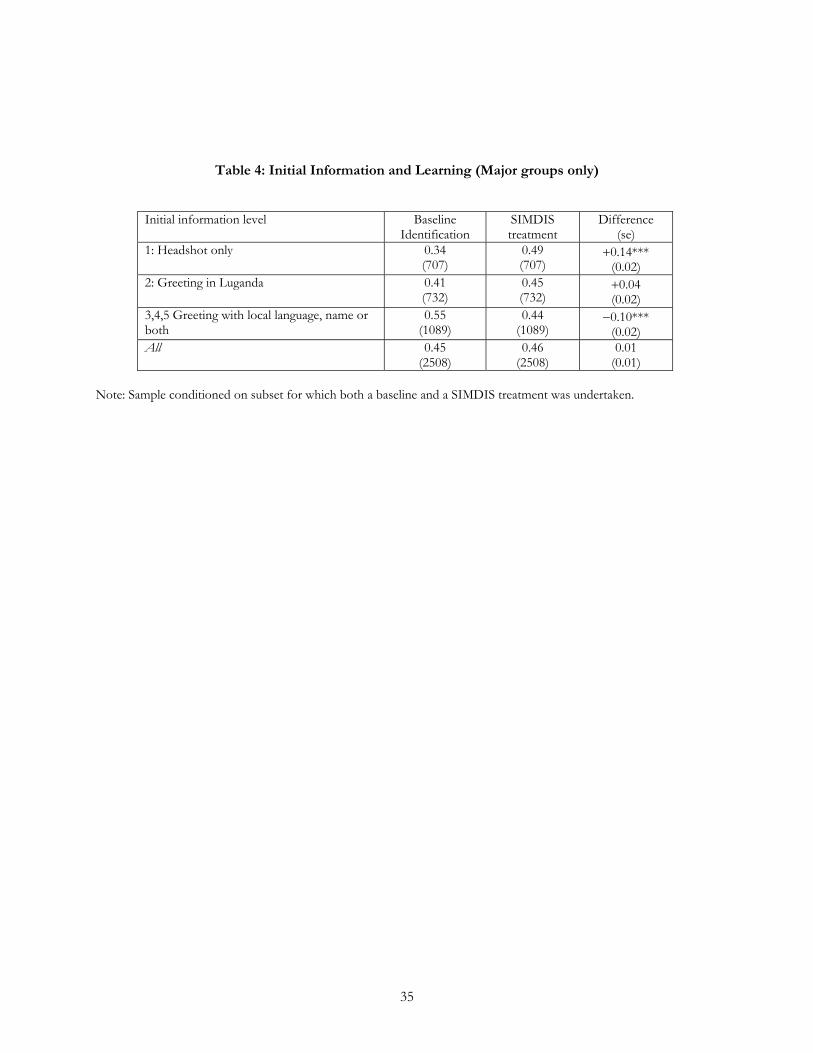
35
Table 4: Initial Information and Learning (Major groups only)
Initial information level Baseline Identification
SIMDIStreatment
Difference (se)
1: Headshot only 0.34(707)
0.49(707)
+0.14*** (0.02)
2: Greeting in Luganda 0.41(732)
0.45(732)
+0.04 (0.02)
3,4,5 Greeting with local language, name or both
0.55(1089)
0.44(1089)
−0.10*** (0.02)
All 0.45(2508)
0.46(2508)
0.01 (0.01)
Note: Sample conditioned on subset for which both a baseline and a SIMDIS treatment was undertaken.
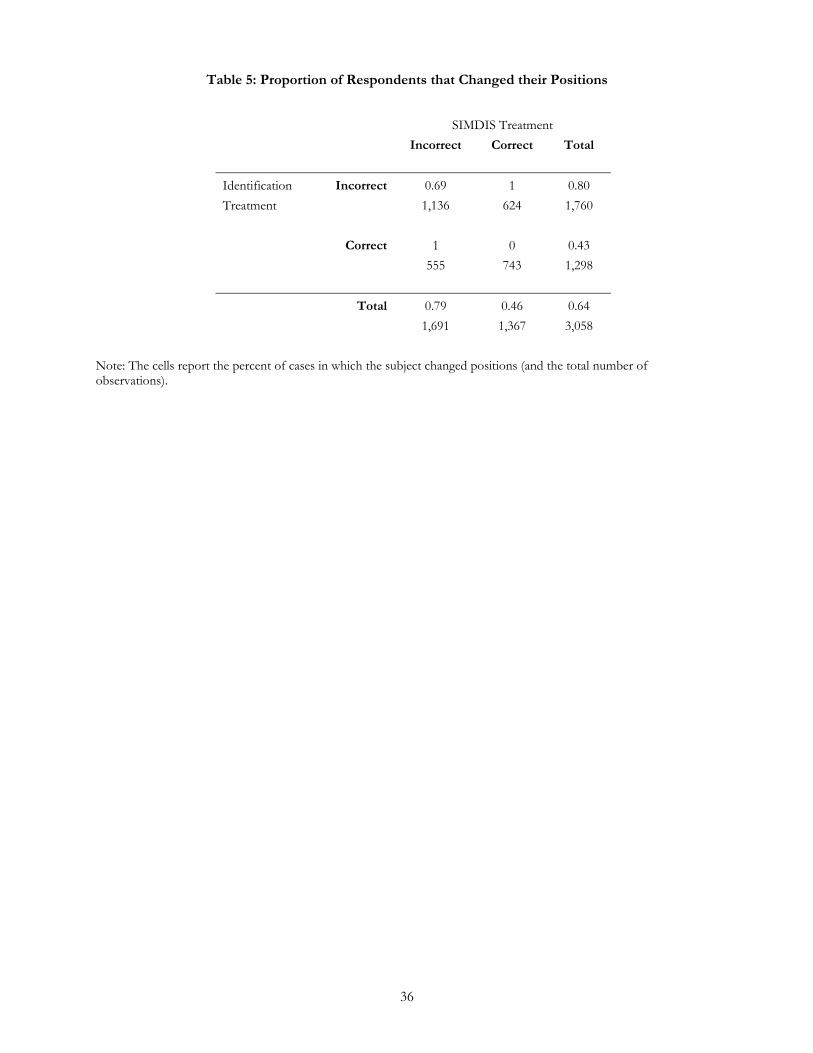
36
Table 5: Proportion of Respondents that Changed their Positions
SIMDIS Treatment Incorrect Correct Total
Identification Incorrect 0.69 1 0.80 Treatment 1,136 624 1,760
Correct 1 0 0.43 555 743 1,298 Total 0.79 0.46 0.64 1,691 1,367 3,058
Note: The cells report the percent of cases in which the subject changed positions (and the total number of observations).
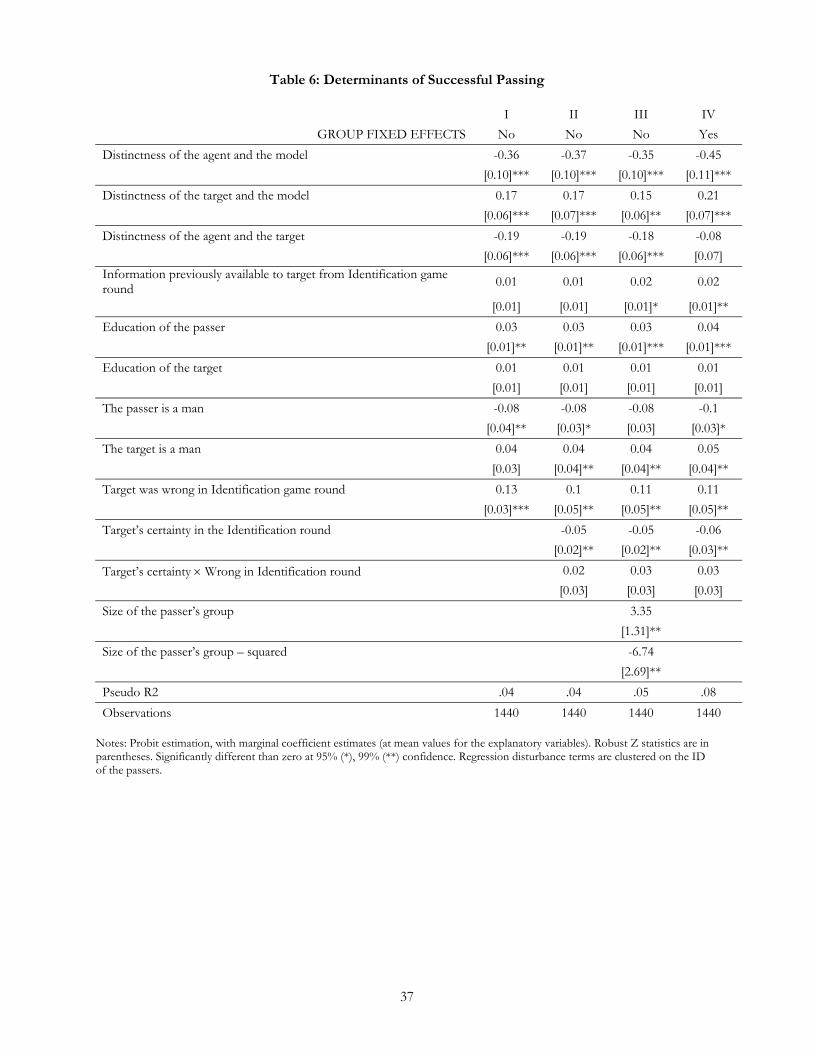
37
Table 6: Determinants of Successful Passing
I II III IV GROUP FIXED EFFECTS No No No Yes
Distinctness of the agent and the model -0.36 -0.37 -0.35 -0.45 [0.10]*** [0.10]*** [0.10]*** [0.11]*** Distinctness of the target and the model 0.17 0.17 0.15 0.21 [0.06]*** [0.07]*** [0.06]** [0.07]*** Distinctness of the agent and the target -0.19 -0.19 -0.18 -0.08 [0.06]*** [0.06]*** [0.06]*** [0.07] Information previously available to target from Identification game round 0.01 0.01 0.02 0.02
[0.01] [0.01] [0.01]* [0.01]** Education of the passer 0.03 0.03 0.03 0.04 [0.01]** [0.01]** [0.01]*** [0.01]*** Education of the target 0.01 0.01 0.01 0.01 [0.01] [0.01] [0.01] [0.01] The passer is a man -0.08 -0.08 -0.08 -0.1 [0.04]** [0.03]* [0.03] [0.03]* The target is a man 0.04 0.04 0.04 0.05 [0.03] [0.04]** [0.04]** [0.04]** Target was wrong in Identification game round 0.13 0.1 0.11 0.11 [0.03]*** [0.05]** [0.05]** [0.05]** Target’s certainty in the Identification round -0.05 -0.05 -0.06 [0.02]** [0.02]** [0.03]**
Target’s certainty × Wrong in Identification round 0.02 0.03 0.03 [0.03] [0.03] [0.03] Size of the passer’s group 3.35 [1.31]** Size of the passer’s group – squared -6.74 [2.69]** Pseudo R2 .04 .04 .05 .08 Observations 1440 1440 1440 1440
Notes: Probit estimation, with marginal coefficient estimates (at mean values for the explanatory variables). Robust Z statistics are in parentheses. Significantly different than zero at 95% (*), 99% (**) confidence. Regression disturbance terms are clustered on the ID of the passers.
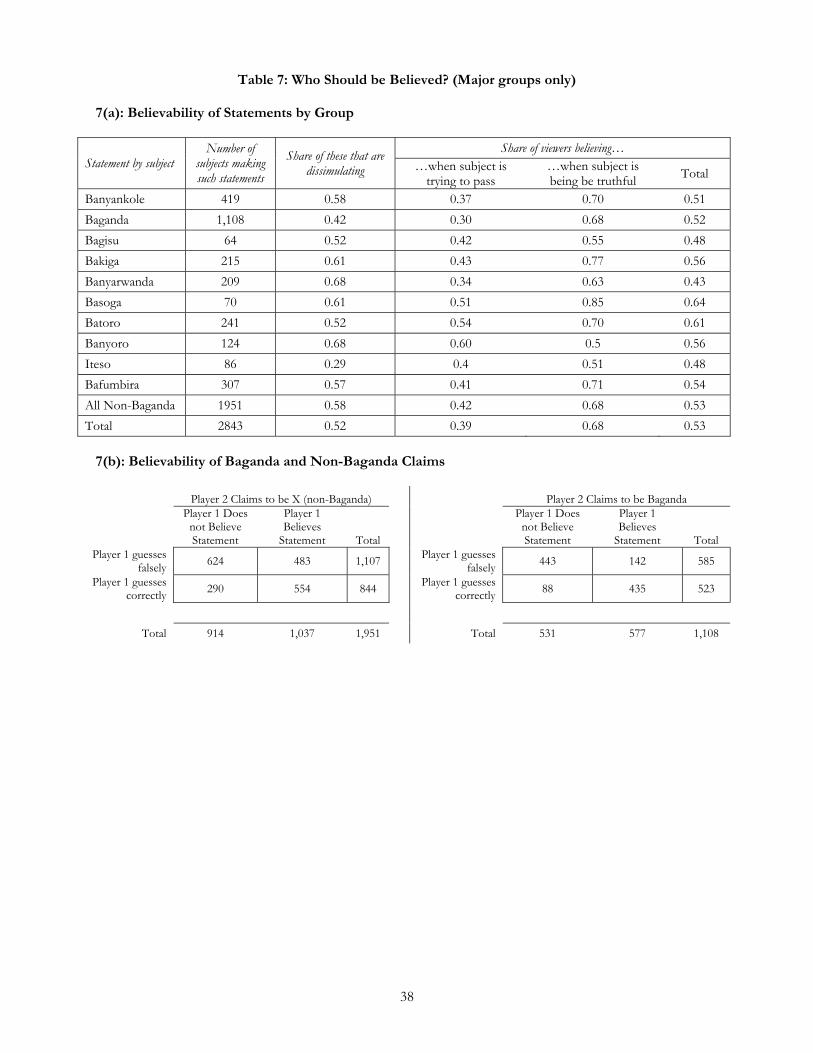
38
Table 7: Who Should be Believed? (Major groups only)
7(a): Believability of Statements by Group
Statement by subject Number of
subjects making such statements
Share of these that are dissimulating
Share of viewers believing… …when subject is
trying to pass …when subject is being be truthful Total
Banyankole 419 0.58 0.37 0.70 0.51 Baganda 1,108 0.42 0.30 0.68 0.52 Bagisu 64 0.52 0.42 0.55 0.48 Bakiga 215 0.61 0.43 0.77 0.56 Banyarwanda 209 0.68 0.34 0.63 0.43 Basoga 70 0.61 0.51 0.85 0.64 Batoro 241 0.52 0.54 0.70 0.61 Banyoro 124 0.68 0.60 0.5 0.56 Iteso 86 0.29 0.4 0.51 0.48 Bafumbira 307 0.57 0.41 0.71 0.54 All Non-Baganda 1951 0.58 0.42 0.68 0.53 Total 2843 0.52 0.39 0.68 0.53
7(b): Believability of Baganda and Non-Baganda Claims
Player 2 Claims to be X (non-Baganda) Player 2 Claims to be Baganda
Player 1 Does not Believe Statement
Player 1 Believes
Statement Total
Player 1 Does not Believe Statement
Player 1 Believes
Statement Total Player 1 guesses
falsely 624 483 1,107 Player 1 guesses falsely 443 142 585
Player 1 guesses correctly 290 554 844 Player 1 guesses
correctly 88 435 523
Total 914 1,037 1,951 Total 531 577 1,108