Embed Size (px)
Citation preview
CSP Today Markets
Report 2015 – India
Plan your CSP business strategy in India: market potential analysis,
project pipeline assessment and forecast to 2025
B U S I N E S S I N T E L L I G E N C E
Critical analysis of
India’s CSP market
Insight into key drivers and barriers,
CSP regulatory framework and
project pipeline to help you form a
clear business strategy.
Markets Scorecard and
Forecast to 2025
Assess the potential for CSP
deployment and find out projected
installed CSP capacity within the
next ten years to position your
business ahead of the curve.
Understanding the
local CSP ecosystem
Find out who the key local
stakeholders are, including
government players and major
financing bodies as well as developers,
EPCs and component suppliers.
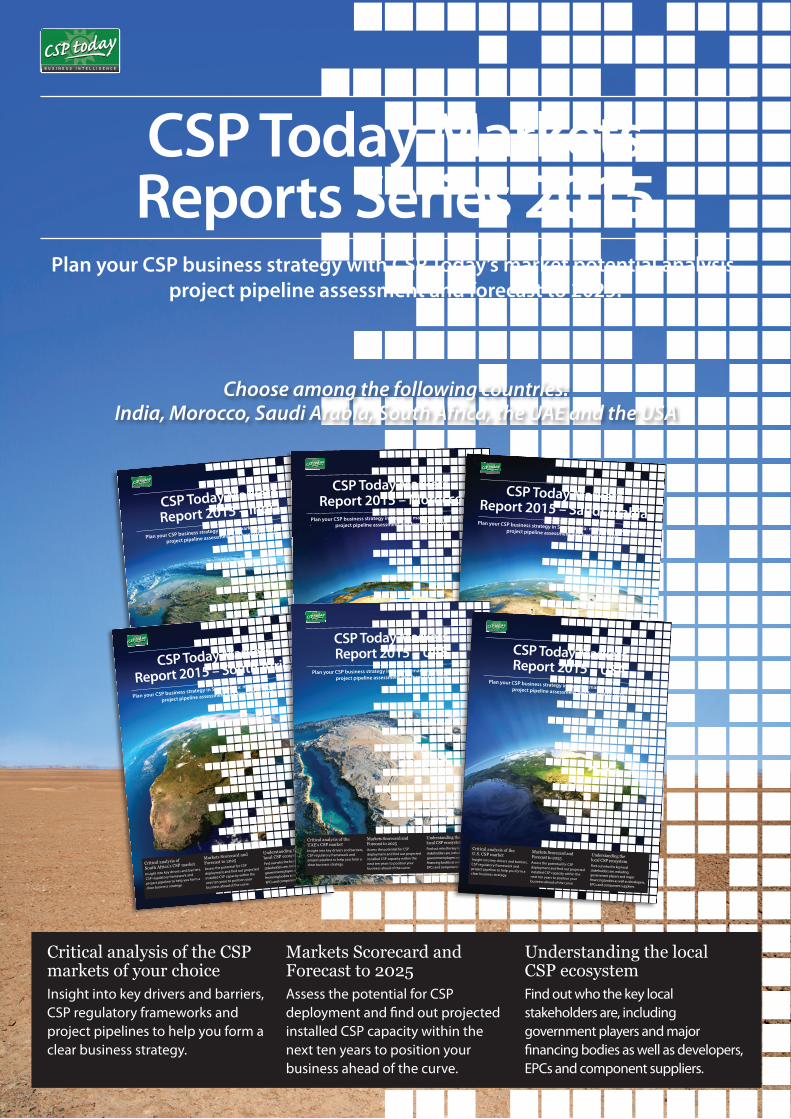
CSP Today Markets Reports Series 2015
Plan your CSP business strategy with CSP Today’s market potential analysis, project pipeline assessment and forecast to 2025.
Choose among the following countries: India, Morocco, Saudi Arabia, South Africa, the UAE and the USA
B U S I N E S S I N T E L L I G E N C E
CSP Today Markets Report 2015 – Morocco
Plan your CSP business strategy in Morocco: market potential analysis,
project pipeline assessment and forecast to 2025
B U S I N E S S I N T E L L I G E N C E
Critical analysis of Morocco’s CSP market Insight into key drivers and barriers,
CSP regulatory framework and
project pipeline to help you form a
clear business strategy.
Markets Scorecard and Forecast to 2025Assess the potential for CSP
deployment and find out projected
installed CSP capacity within the
next ten years to position your
business ahead of the curve.
Understanding the local CSP ecosystemFind out who the key local
stakeholders are, including
government players and major
financing bodies as well as developers,
EPCs and component suppliers.
CSP Today Markets
Report 2015 – South Africa
Plan your CSP business strategy in South Africa: market potential analysis,
project pipeline assessment and forecast to 2025
B U S I N E S S I N T E L L I G E N C E
Critical analysis of
South Africa’s CSP market
Insight into key drivers and barriers,
CSP regulatory framework and
project pipeline to help you form a
clear business strategy.
Markets Scorecard and
Forecast to 2025
Assess the potential for CSP
deployment and find out projected
installed CSP capacity within the
next ten years to position your
business ahead of the curve.
Understanding the
local CSP ecosystem
Find out who the key local
stakeholders are, including
government players and major
financing bodies as well as developers,
EPCs and component suppliers.
Critical analysis of the CSP markets of your choice Insight into key drivers and barriers, CSP regulatory frameworks and project pipelines to help you form a clear business strategy.
Markets Scorecard and Forecast to 2025Assess the potential for CSP deployment and find out projected installed CSP capacity within the next ten years to position your business ahead of the curve.
Understanding the local CSP ecosystemFind out who the key local stakeholders are, including government players and major financing bodies as well as developers, EPCs and component suppliers.
CSP Today Markets Report 2015 – Saudi ArabiaPlan your CSP business strategy in Saudi Arabia: market potential analysis, project pipeline assessment and forecast to 2025
B U S I N E S S I N T E L L I G E N C E
Critical analysis of Saudi Arabia’s CSP market Insight into key drivers and barriers, CSP regulatory framework and project pipeline to help you form a clear business strategy.
Markets Scorecard and Forecast to 2025Assess the potential for CSP deployment and find out projected installed CSP capacity within the next ten years to position your business ahead of the curve.
Understanding the local CSP ecosystemFind out who the key local stakeholders are, including government players and major financing bodies as well as developers, EPCs and component suppliers.
CSP Today Markets Report 2015 – UAE
Plan your CSP business strategy in the UAE: market potential analysis,
project pipeline assessment and forecast to 2025
B U S I N E S S I N T E L L I G E N C E
Critical analysis of the UAE’s CSP market Insight into key drivers and barriers,
CSP regulatory framework and
project pipeline to help you form a
clear business strategy.
Markets Scorecard and Forecast to 2025Assess the potential for CSP
deployment and find out projected
installed CSP capacity within the
next ten years to position your
business ahead of the curve.
Understanding the local CSP ecosystemFind out who the key local
stakeholders are, including
government players and major
financing bodies as well as developers,
EPCs and component suppliers.
CSP Today Markets Report 2015 – USA
Plan your CSP business strategy in the USA: market potential analysis, project pipeline assessment and forecast to 2025
B U S I N E S S I N T E L L I G E N C E
Critical analysis of the U.S. CSP market Insight into key drivers and barriers, CSP regulatory framework and project pipeline to help you form a clear business strategy.
Markets Scorecard and Forecast to 2025Assess the potential for CSP deployment and find out projected installed CSP capacity within the next ten years to position your business ahead of the curve.
Understanding the local CSP ecosystemFind out who the key local stakeholders are, including government players and major financing bodies as well as developers, EPCs and component suppliers.
www.csptoday.com CSP TODAY MARKETS REPORTS SERIES 2015 | 1
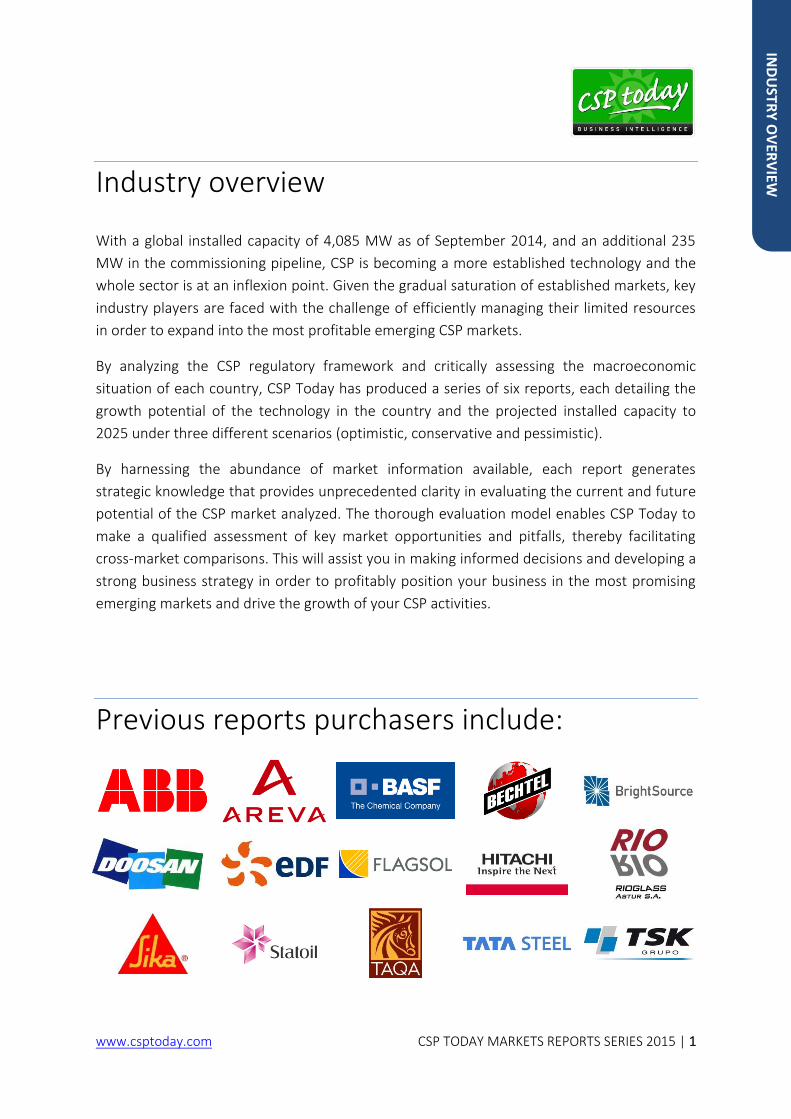
Industry overview
With a global installed capacity of 4,085 MW as of September 2014, and an additional 235
MW in the commissioning pipeline, CSP is becoming a more established technology and the
whole sector is at an inflexion point. Given the gradual saturation of established markets, key
industry players are faced with the challenge of efficiently managing their limited resources
in order to expand into the most profitable emerging CSP markets.
By analyzing the CSP regulatory framework and critically assessing the macroeconomic
situation of each country, CSP Today has produced a series of six reports, each detailing the
growth potential of the technology in the country and the projected installed capacity to
2025 under three different scenarios (optimistic, conservative and pessimistic).
By harnessing the abundance of market information available, each report generates
strategic knowledge that provides unprecedented clarity in evaluating the current and future
potential of the CSP market analyzed. The thorough evaluation model enables CSP Today to
make a qualified assessment of key market opportunities and pitfalls, thereby facilitating
cross-market comparisons. This will assist you in making informed decisions and developing a
strong business strategy in order to profitably position your business in the most promising
emerging markets and drive the growth of your CSP activities.
Previous reports purchasers include:
IND
USTR
Y O
VER
VIEW
www.csptoday.com CSP TODAY MARKETS REPORTS SERIES 2015 | 2
Key questions addressed in each report
What are the drivers of and barriers to the development of CSP in the country?
What is the current status of the CSP industry in the country analyzed?
Who are the main players in the CSP market?
How strong is the local supply and value chain?
How ready is the country for CSP? And what is the potential of its project pipeline?
How much installed CSP capacity can you expect by 2025?
Key reasons to buy these reports
Gain in depth analysis and insight into the CSP markets of your interest. Choose among
India, Morocco, Saudi Arabia, South Africa, the UAE and the USA.
Policies and incentives: Navigate the CSP regulatory framework and uncover how much
support is granted to CSP by the local government.
Detailed project pipelines: Understand what trends are driving the CSP market analyzed
with pipeline’s breakdowns by project status and technology and detailed project data.
Supply chain: For each country, find a list of key players and potential local partners
including government agencies, developers, EPCs and component suppliers.
CSP Today’s Markets Scorecard 2015: Identify the best opportunities for investors and
understand how and why a country is ready for CSP or not.
CSP Today’s Markets Forecast 2015: Discover the projected global installed capacity up to
2025 and analyze the growth potential of the specific CSP market in three scenarios
(optimistic, conservative and pessimistic).
KEY
REA
SON
S TO B
UY
www.csptoday.com CSP TODAY MARKETS REPORTS SERIES 2015 | 3
Who needs these reports
The CSP Today Markets Reports Series 2015 is primarily aimed at business development roles
within suppliers and developers looking to expand their businesses into new markets.
Suppliers
Make informed decisions and develop a strong business strategy to position your
business into the most profitable emerging CSP markets.
Assess your competitive landscape in the markets of choice: see who the main
component suppliers are and identify potential openings in the supply chain.
Estimate your projected demand by assessing how much installed CSP capacity you can
expect up to 2025.
Developers
Ensure your business plan targets the most valuable CSP markets.
Discover what market opportunities and pitfalls other developers see in the markets you
are entering.
Learn how local content requirements may affect your development strategy.
Find out which raw materials and components can be locally sourced and explore the list
of your potential local partners.
WH
O N
EEDS TH
ESE REP
OR
TS
www.csptoday.com CSP TODAY MARKETS REPORTS SERIES 2015 | 4
Local expertise
The CSP Today Markets Reports Series 2015 benefits from the contribution of key industry
experts with on-the-ground experience in the markets analyzed.
In-depth interviews have been conducted with top developers including Abengoa,
BrightSource Energy, Eskom, GDF Suez, Masdar, Reliance Power, SolarReserve and Sun & Life.
A number of experts from the most influential global organizations also contributed to the
quality of these reports, including the Asian Development Bank, the CSP Alliance, NREL, the
Solar Electric Power Association and the World Bank.
Swapnil Kumthekar, Business Development – Solar at Reliance Power, provided extremely
valuable insight into the report on CSP in India. Jonathan Walters, Senior Advisor at Castalia
Strategy, and previously a Director at the World Bank, peer reviewed the chapter on
Morocco, whilst Alexandre Allegue, General Manager at Sun & Life, contributed to the quality
of the report on Saudi Arabia.
CSP Today is also grateful to Daniel Schwab, Regional Director for Southern Africa,
BrightSource Energy for detailed feedback on the South African market, as well as Andrew
Wang, Director of Development, SolarReserve and Mary Grikas, Vice President of
Communications, SolarReserve, who acted as peer reviewers for the USA report.
LOC
AL EX
PER
TISE
www.csptoday.com CSP TODAY MARKETS REPORTS SERIES 2015 | 5
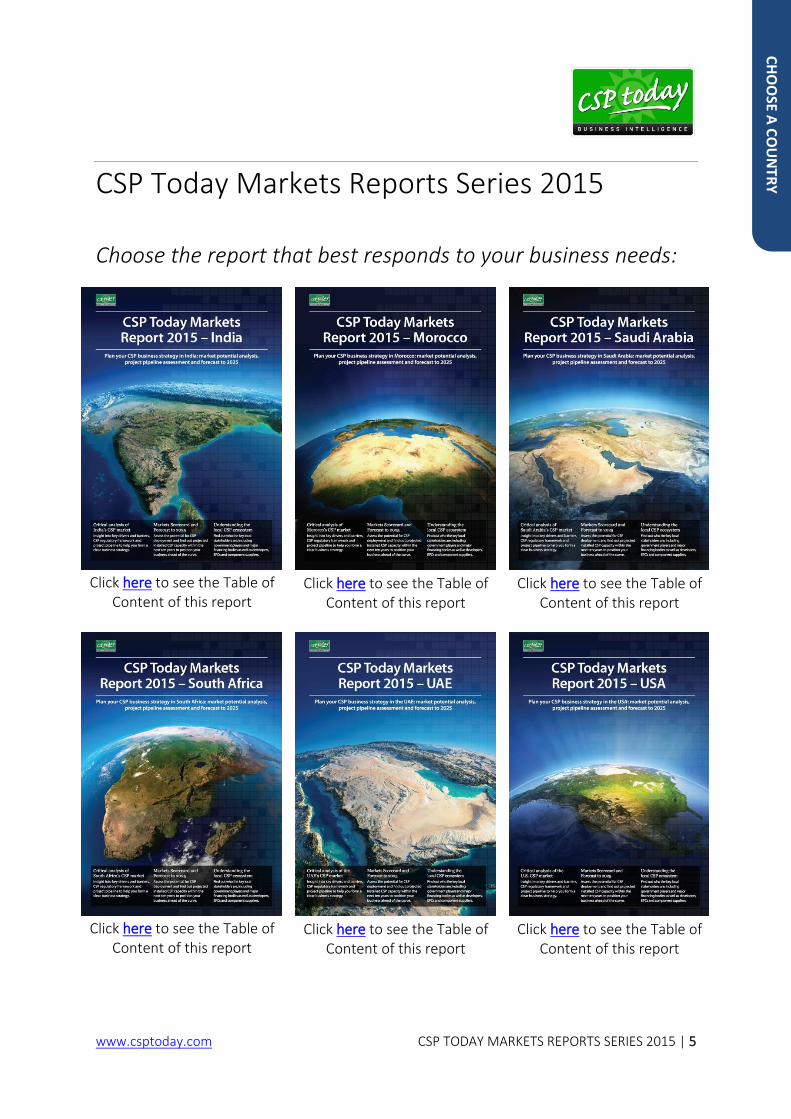
CSP Today Markets Reports Series 2015
Choose the report that best responds to your business needs:
Click here to see the Table of
Content of this report
Click here to see the Table of Content of this report
Click here to see the Table of Content of this report
Click here to see the Table of
Content of this report
Click here to see the Table of Content of this report
Click here to see the Table of Content of this report
CH
OO
SE A C
OU
NTR
Y
www.csptoday.com CSP TODAY MARKETS REPORTS SERIES 2015 | 6
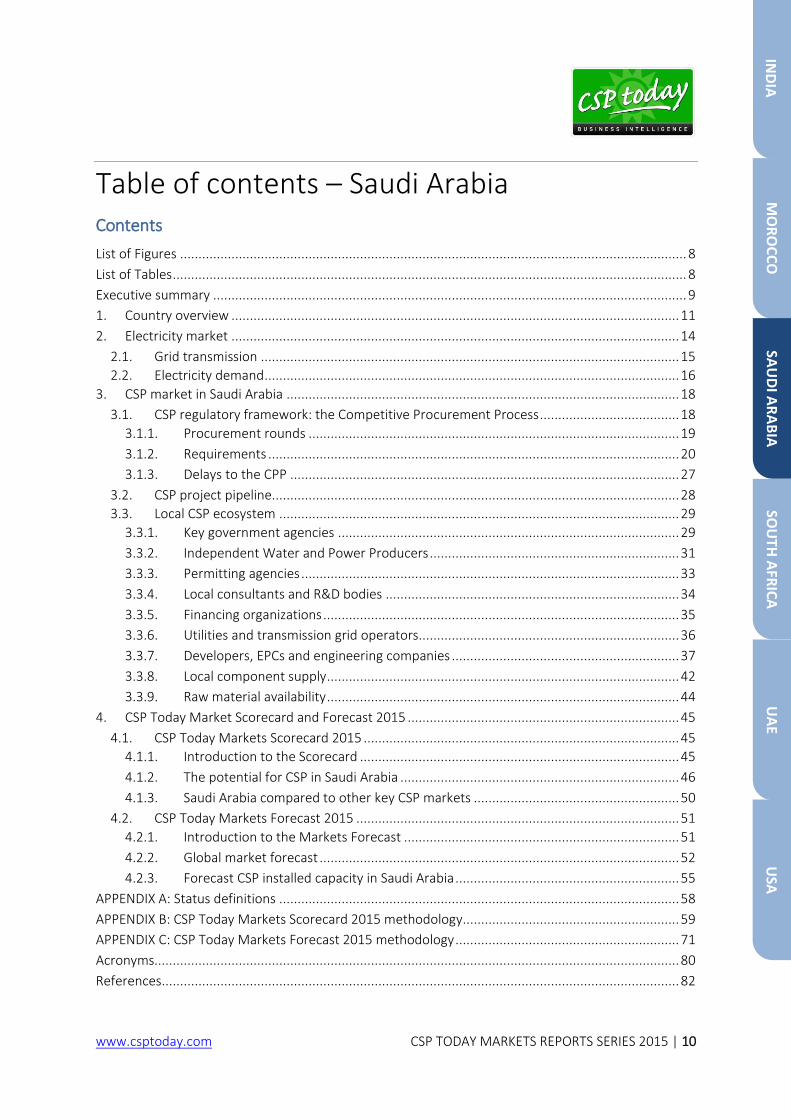
Table of contents – India
Contents
List of Figures .......................................................................................................................................... 8
List of Tables ............................................................................................................................................ 8
Executive summary ................................................................................................................................. 9
1. Country overview .......................................................................................................................... 11
2. Electricity market .......................................................................................................................... 14
2.1. Electricity demand ................................................................................................................. 17
3. CSP market in India ........................................................................................................................ 18
3.1. CSP regulatory framework ..................................................................................................... 18
3.1.1. Renewable Purchase Obligations and Renewable Energy Certificates .......................... 18
3.1.2. The Jawaharlal Nehru National Solar Mission ............................................................... 20
3.1.2.1. Phase I of JNNSM ................................................................................................... 21
3.1.2.2. Delays and extensions to Phase I ........................................................................... 22
3.1.3. Outside of JNNSM ......................................................................................................... 25
3.1.3.1. State-level initiatives ............................................................................................. 25
3.1.3.2. ADB-SECI innovation program ............................................................................... 27
3.1.3.3. CSP Research and Development center ................................................................ 27
3.1.4. Local content requirements .......................................................................................... 28
3.2. CSP project pipeline............................................................................................................... 29
3.3. Local CSP ecosystem ............................................................................................................. 31
3.3.1. Key government agencies ............................................................................................. 31
3.3.2. Independent Power Producers and utilities .................................................................. 33
3.3.3. Permitting agencies and feasibility study providers ...................................................... 34
3.3.4. Local consultants and R&D bodies ................................................................................ 36
3.3.5. Financing organizations ................................................................................................. 38
3.3.6. Developers and EPC Firms ............................................................................................. 42
3.3.7. Local component suppliers ............................................................................................ 44
3.3.8. Raw materials availability .............................................................................................. 48
4. CSP Today Market Scorecard and Forecast 2015 .......................................................................... 50
4.1. CSP Today Markets Scorecard 2015 ...................................................................................... 50
4.1.1. Introduction to the Scorecard ....................................................................................... 50
4.1.2. The potential for CSP in India ........................................................................................ 51
4.1.3. India compared to other key CSP markets .................................................................... 55
4.2. CSP Today Markets Forecast 2015 ........................................................................................ 56
4.2.1. Introduction to the Markets Forecast ........................................................................... 56
4.2.2. Global market forecast .................................................................................................. 57
4.2.3. Forecast CSP installed capacity in India ......................................................................... 60
APPENDIX A: List of CSP plants in the India ........................................................................................... 63
IND
IA
MO
RO
CC
O
SAU
DI A
RA
BIA
SO
UTH
AFR
ICA
U
AE
USA
www.csptoday.com CSP TODAY MARKETS REPORTS SERIES 2015 | 7
APPENDIX B: Status definitions.............................................................................................................. 64
APPENDIX C: CSP Today Markets Scorecard 2015 methodology ........................................................... 65
APPENDIX D: CSP Today Markets Forecast 2015 methodology............................................................. 77
Acronyms............................................................................................................................................... 86
References ............................................................................................................................................. 88
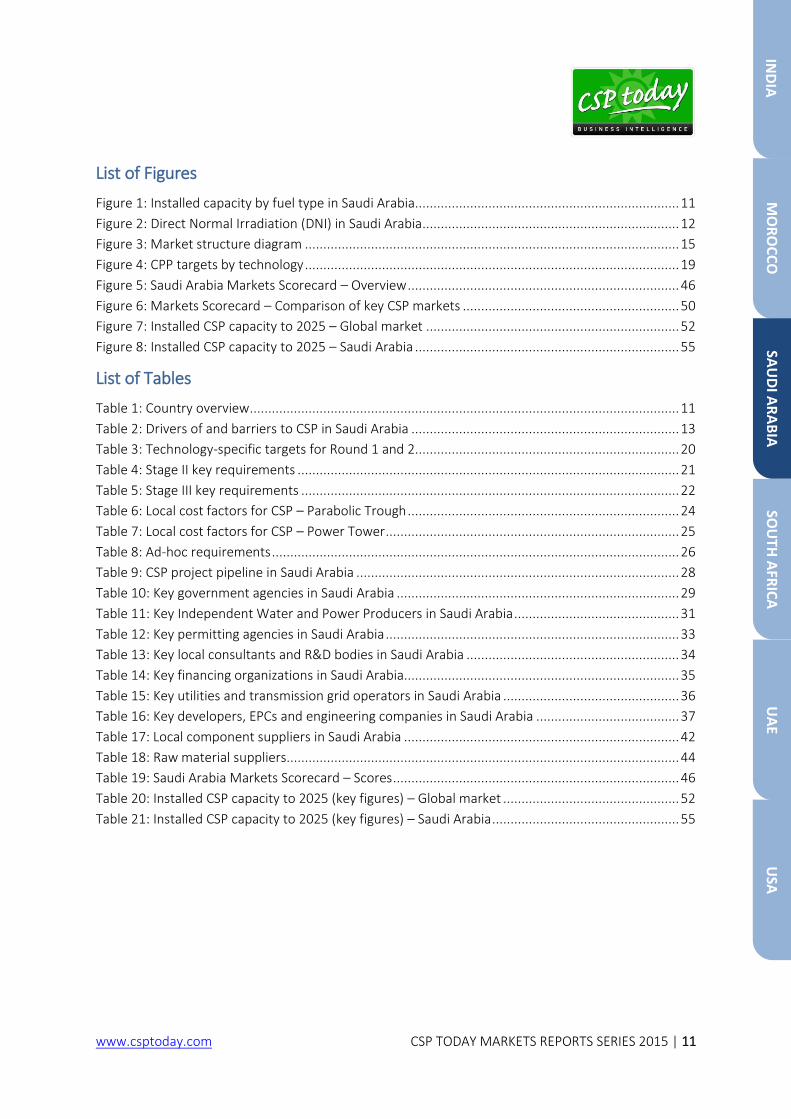
List of Figures
Figure 1: Breakdown of installed capacity by fuel type ......................................................................... 11
Figure 2: Direct Normal Irradiation (DNI) in India .................................................................................. 12
Figure 3: Market structure diagram ...................................................................................................... 16
Figure 4: Power Sales Agreement contract structure in India ............................................................... 21
Figure 5: JNNSM Phase I CSP tariff trends ............................................................................................. 22
Figure 6: Breakdown of CSP capacity by status (MW) ........................................................................... 29
Figure 7: Breakdown of CSP capacity by technology (MW) ................................................................... 30
Figure 8: Breakdown of capacity by status and technology (MW) ........................................................ 30
Figure 9: India Markets Scorecard – Overview ...................................................................................... 51
Figure 10: Markets Scorecard – Comparison of key CSP markets ......................................................... 55
Figure 11: Installed CSP capacity to 2025 – Global market ................................................................... 57
Figure 12: Installed CSP capacity to 2025 – India .................................................................................. 60
List of Tables
Table 1: Country overview ..................................................................................................................... 11
Table 2: Drivers of and barriers to CSP in India ..................................................................................... 13
Table 3: Anticipated India power supply position for the year 2014-15................................................ 17
Table 4: Solar power capacity requirement by 2022 ............................................................................. 19
Table 5: Projects under Phase I of the JNNSM ...................................................................................... 23
Table 6: RPO targets in Gujarat ............................................................................................................. 25
Table 7: Minimum yearly capacity targets in Karnataka ........................................................................ 26
Table 8: Breakdown of capacity by status and technology (MW) ......................................................... 31
Table 9: Key government agencies in India ........................................................................................... 31
Table 10: Key Independent Water and Power Producers and utilities in India ..................................... 33
Table 11: Key permitting agencies and feasibility study providers in India ........................................... 34
Table 12: Key local consultants and R&D bodies in India ...................................................................... 36
Table 13: Key financing organizations in India ....................................................................................... 38
Table 14: Developers and EPCs in India ................................................................................................. 42
Table 15: Key local component suppliers in India ................................................................................. 44
Table 16: Key local raw material suppliers in India ................................................................................ 48
Table 17: India Markets Scorecard – Scores .......................................................................................... 51
Table 18: Installed CSP capacity to 2025 (key figures) – Global market ................................................ 57
Table 19: Installed CSP capacity to 2025 (key figures) – India ............................................................... 60
IND
IA
MO
RO
CC
O
SAU
DI A
RA
BIA
SO
UTH
AFR
ICA
U
AE
USA
www.csptoday.com CSP TODAY MARKETS REPORTS SERIES 2015 | 8
Table of contents – Morocco Contents
List of Figures .......................................................................................................................................... 8
List of Tables ............................................................................................................................................ 8
Executive summary ................................................................................................................................. 9
1. Country overview .......................................................................................................................... 11
2. Electricity market .......................................................................................................................... 14
2.1. Electricity demand ................................................................................................................. 14
2.2. Key players in the Moroccan electricity market .................................................................... 14
3. CSP market in Morocco ................................................................................................................. 17
3.1. CSP regulatory framework ..................................................................................................... 17
3.1.1. Moroccan Solar Plan ...................................................................................................... 18
3.1.1.1. The Ouarzazate Solar Complex (Noor I-IV) ............................................................ 21
3.1.2. Local content requirements .......................................................................................... 23
3.2. CSP project pipeline............................................................................................................... 23
3.3. Local CSP ecosystem ............................................................................................................. 25
3.3.1. Key government agencies ............................................................................................. 25
3.3.2. Utilities and Independent Power Producers .................................................................. 26
3.3.3. Permitting agencies and feasibility study providers ...................................................... 28
3.3.4. Local consultants and R&D bodies ................................................................................ 29
3.3.5. Financing organizations ................................................................................................. 31
3.3.6. Developers and EPC firms.............................................................................................. 36
3.3.7. Local component supply ................................................................................................ 39
3.3.8. Raw materials availability .............................................................................................. 40
4. CSP Today Markets Scorecard and Forecast 2015......................................................................... 42
4.1. CSP Today Markets Scorecard 2015 ...................................................................................... 42
4.1.1. Introduction to the Scorecard ....................................................................................... 42
4.1.2. The potential for CSP in Morocco .................................................................................. 43
4.1.3. Morocco compared to other key CSP markets .............................................................. 47
4.2. CSP Today Markets Forecast 2015 ........................................................................................ 48
4.2.1. Introduction to the Markets Forecast ........................................................................... 48
4.2.2. Global market forecast .................................................................................................. 49
4.2.3. Forecast CSP installed capacity in Morocco .................................................................. 52
APPENDIX A: List of CSP plants in Morocco ........................................................................................... 55
APPENDIX B: Status definitions.............................................................................................................. 56
APPENDIX C: CSP Today Markets Scorecard 2015 methodology ........................................................... 57
APPENDIX D: CSP Today Markets Forecast 2015 methodology............................................................. 69
Acronyms............................................................................................................................................... 78
References ............................................................................................................................................. 80
IND
IA
MO
RO
CC
O
SAU
DI A
RA
BIA
SO
UTH
AFR
ICA
U
AE
USA
www.csptoday.com CSP TODAY MARKETS REPORTS SERIES 2015 | 9
List of Figures
Figure 1: Breakdown of installed capacity by fuel type ......................................................................... 11
Figure 2: Direct Normal Irradiation (DNI) in Morocco ........................................................................... 12
Figure 3: Market structure diagram ...................................................................................................... 16
Figure 4: Double PPA structure under the MSP .................................................................................... 20
Figure 5: Breakdown of CSP capacity by status (MW) ........................................................................... 23
Figure 6: Breakdown of CSP capacity by technology (MW) ................................................................... 24
Figure 7: Breakdown of capacity by status and technology (MW) ........................................................ 24
Figure 8: Morocco Markets Scorecard – Overview ............................................................................... 43
Figure 9: Markets Scorecard – Comparison of key CSP markets ........................................................... 47
Figure 10: Installed CSP capacity to 2025 – Global market ................................................................... 49
Figure 11: Installed CSP capacity to 2025 – Morocco ............................................................................ 52
List of Tables
Table 1: Country overview ..................................................................................................................... 11
Table 2: Drivers of and barriers to CSP in Morocco ............................................................................... 13
Table 3: Technical specifications for Noor II and Noor III ...................................................................... 21
Table 4: Prequalified bidders for Noor II and III ..................................................................................... 22
Table 5: Breakdown of capacity by status and technology (MW) ......................................................... 25
Table 6: Key government agencies in Morocco ..................................................................................... 25
Table 7: Key utilities and IPPs in Morocco ............................................................................................. 26
Table 8: Key permitting agencies and feasibility study providers in Morocco ....................................... 28
Table 9: Key local consultants and R&D bodies in Morocco .................................................................. 29
Table 10: Key financing organizations in Morocco ................................................................................ 32
Table 11: Key developers and EPCs in Morocco .................................................................................... 36
Table 12: Key Local component suppliers in Morocco .......................................................................... 39
Table 13: Key raw materials suppliers in Morocco ................................................................................ 40
Table 14: Morocco Markets Scorecard – Scores ................................................................................... 43
Table 15: Installed CSP capacity to 2025 (key figures) – Global market ................................................ 49
Table 16: Installed CSP capacity to 2025 (key figures) – Morocco ........................................................ 52
IND
IA
MO
RO
CC
O
SAU
DI A
RA
BIA
SO
UTH
AFR
ICA
U
AE
USA
www.csptoday.com CSP TODAY MARKETS REPORTS SERIES 2015 | 10
Table of contents – Saudi Arabia Contents
List of Figures .......................................................................................................................................... 8
List of Tables ............................................................................................................................................ 8
Executive summary ................................................................................................................................. 9
1. Country overview .......................................................................................................................... 11
2. Electricity market .......................................................................................................................... 14
2.1. Grid transmission .................................................................................................................. 15
2.2. Electricity demand ................................................................................................................. 16
3. CSP market in Saudi Arabia ........................................................................................................... 18
3.1. CSP regulatory framework: the Competitive Procurement Process ...................................... 18
3.1.1. Procurement rounds ..................................................................................................... 19
3.1.2. Requirements ................................................................................................................ 20
3.1.3. Delays to the CPP .......................................................................................................... 27
3.2. CSP project pipeline............................................................................................................... 28
3.3. Local CSP ecosystem ............................................................................................................. 29
3.3.1. Key government agencies ............................................................................................. 29
3.3.2. Independent Water and Power Producers .................................................................... 31
3.3.3. Permitting agencies ....................................................................................................... 33
3.3.4. Local consultants and R&D bodies ................................................................................ 34
3.3.5. Financing organizations ................................................................................................. 35
3.3.6. Utilities and transmission grid operators....................................................................... 36
3.3.7. Developers, EPCs and engineering companies .............................................................. 37
3.3.8. Local component supply ................................................................................................ 42
3.3.9. Raw material availability ................................................................................................ 44
4. CSP Today Market Scorecard and Forecast 2015 .......................................................................... 45
4.1. CSP Today Markets Scorecard 2015 ...................................................................................... 45
4.1.1. Introduction to the Scorecard ....................................................................................... 45
4.1.2. The potential for CSP in Saudi Arabia ............................................................................ 46
4.1.3. Saudi Arabia compared to other key CSP markets ........................................................ 50
4.2. CSP Today Markets Forecast 2015 ........................................................................................ 51
4.2.1. Introduction to the Markets Forecast ........................................................................... 51
4.2.2. Global market forecast .................................................................................................. 52
4.2.3. Forecast CSP installed capacity in Saudi Arabia ............................................................. 55
APPENDIX A: Status definitions ............................................................................................................. 58
APPENDIX B: CSP Today Markets Scorecard 2015 methodology ........................................................... 59
APPENDIX C: CSP Today Markets Forecast 2015 methodology ............................................................. 71
Acronyms............................................................................................................................................... 80
References ............................................................................................................................................. 82
IND
IA
MO
RO
CC
O
SAU
DI A
RA
BIA
SO
UTH
AFR
ICA
U
AE
USA
www.csptoday.com CSP TODAY MARKETS REPORTS SERIES 2015 | 11
List of Figures
Figure 1: Installed capacity by fuel type in Saudi Arabia........................................................................ 11
Figure 2: Direct Normal Irradiation (DNI) in Saudi Arabia ...................................................................... 12
Figure 3: Market structure diagram ...................................................................................................... 15
Figure 4: CPP targets by technology ...................................................................................................... 19
Figure 5: Saudi Arabia Markets Scorecard – Overview .......................................................................... 46
Figure 6: Markets Scorecard – Comparison of key CSP markets ........................................................... 50
Figure 7: Installed CSP capacity to 2025 – Global market ..................................................................... 52
Figure 8: Installed CSP capacity to 2025 – Saudi Arabia ........................................................................ 55
List of Tables
Table 1: Country overview ..................................................................................................................... 11
Table 2: Drivers of and barriers to CSP in Saudi Arabia ......................................................................... 13
Table 3: Technology-specific targets for Round 1 and 2........................................................................ 20
Table 4: Stage II key requirements ........................................................................................................ 21
Table 5: Stage III key requirements ....................................................................................................... 22
Table 6: Local cost factors for CSP – Parabolic Trough .......................................................................... 24
Table 7: Local cost factors for CSP – Power Tower ................................................................................ 25
Table 8: Ad-hoc requirements ............................................................................................................... 26
Table 9: CSP project pipeline in Saudi Arabia ........................................................................................ 28
Table 10: Key government agencies in Saudi Arabia ............................................................................. 29
Table 11: Key Independent Water and Power Producers in Saudi Arabia ............................................. 31
Table 12: Key permitting agencies in Saudi Arabia ................................................................................ 33
Table 13: Key local consultants and R&D bodies in Saudi Arabia .......................................................... 34
Table 14: Key financing organizations in Saudi Arabia........................................................................... 35
Table 15: Key utilities and transmission grid operators in Saudi Arabia ................................................ 36
Table 16: Key developers, EPCs and engineering companies in Saudi Arabia ....................................... 37
Table 17: Local component suppliers in Saudi Arabia ........................................................................... 42
Table 18: Raw material suppliers........................................................................................................... 44
Table 19: Saudi Arabia Markets Scorecard – Scores .............................................................................. 46
Table 20: Installed CSP capacity to 2025 (key figures) – Global market ................................................ 52
Table 21: Installed CSP capacity to 2025 (key figures) – Saudi Arabia ................................................... 55
IND
IA
MO
RO
CC
O
SAU
DI A
RA
BIA
SO
UTH
AFR
ICA
U
AE
USA
www.csptoday.com CSP TODAY MARKETS REPORTS SERIES 2015 | 12
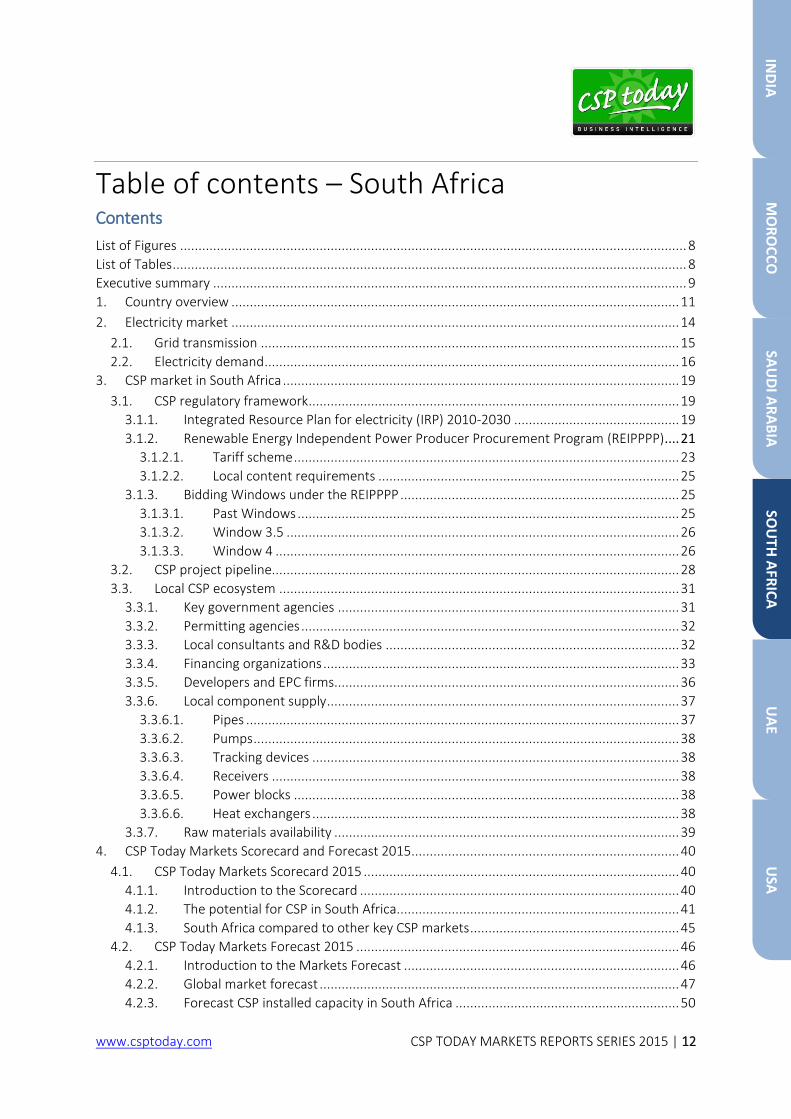
Table of contents – South Africa Contents
List of Figures .......................................................................................................................................... 8
List of Tables ............................................................................................................................................ 8
Executive summary ................................................................................................................................. 9
1. Country overview .......................................................................................................................... 11
2. Electricity market .......................................................................................................................... 14
2.1. Grid transmission .................................................................................................................. 15
2.2. Electricity demand ................................................................................................................. 16
3. CSP market in South Africa ............................................................................................................ 19
3.1. CSP regulatory framework ..................................................................................................... 19
3.1.1. Integrated Resource Plan for electricity (IRP) 2010-2030 ............................................. 19
3.1.2. Renewable Energy Independent Power Producer Procurement Program (REIPPPP) .... 21
3.1.2.1. Tariff scheme ......................................................................................................... 23
3.1.2.2. Local content requirements .................................................................................. 25
3.1.3. Bidding Windows under the REIPPPP ............................................................................ 25
3.1.3.1. Past Windows ........................................................................................................ 25
3.1.3.2. Window 3.5 ........................................................................................................... 26
3.1.3.3. Window 4 .............................................................................................................. 26
3.2. CSP project pipeline............................................................................................................... 28
3.3. Local CSP ecosystem ............................................................................................................. 31
3.3.1. Key government agencies ............................................................................................. 31
3.3.2. Permitting agencies ....................................................................................................... 32
3.3.3. Local consultants and R&D bodies ................................................................................ 32
3.3.4. Financing organizations ................................................................................................. 33
3.3.5. Developers and EPC firms.............................................................................................. 36
3.3.6. Local component supply ................................................................................................ 37
3.3.6.1. Pipes ...................................................................................................................... 37
3.3.6.2. Pumps .................................................................................................................... 38
3.3.6.3. Tracking devices .................................................................................................... 38
3.3.6.4. Receivers ............................................................................................................... 38
3.3.6.5. Power blocks ......................................................................................................... 38
3.3.6.6. Heat exchangers .................................................................................................... 38
3.3.7. Raw materials availability .............................................................................................. 39
4. CSP Today Markets Scorecard and Forecast 2015......................................................................... 40
4.1. CSP Today Markets Scorecard 2015 ...................................................................................... 40
4.1.1. Introduction to the Scorecard ....................................................................................... 40
4.1.2. The potential for CSP in South Africa............................................................................. 41
4.1.3. South Africa compared to other key CSP markets ......................................................... 45
4.2. CSP Today Markets Forecast 2015 ........................................................................................ 46
4.2.1. Introduction to the Markets Forecast ........................................................................... 46
4.2.2. Global market forecast .................................................................................................. 47
4.2.3. Forecast CSP installed capacity in South Africa ............................................................. 50
IND
IA
MO
RO
CC
O
SAU
DI A
RA
BIA
SO
UTH
AFR
ICA
U
AE
USA
www.csptoday.com CSP TODAY MARKETS REPORTS SERIES 2015 | 13
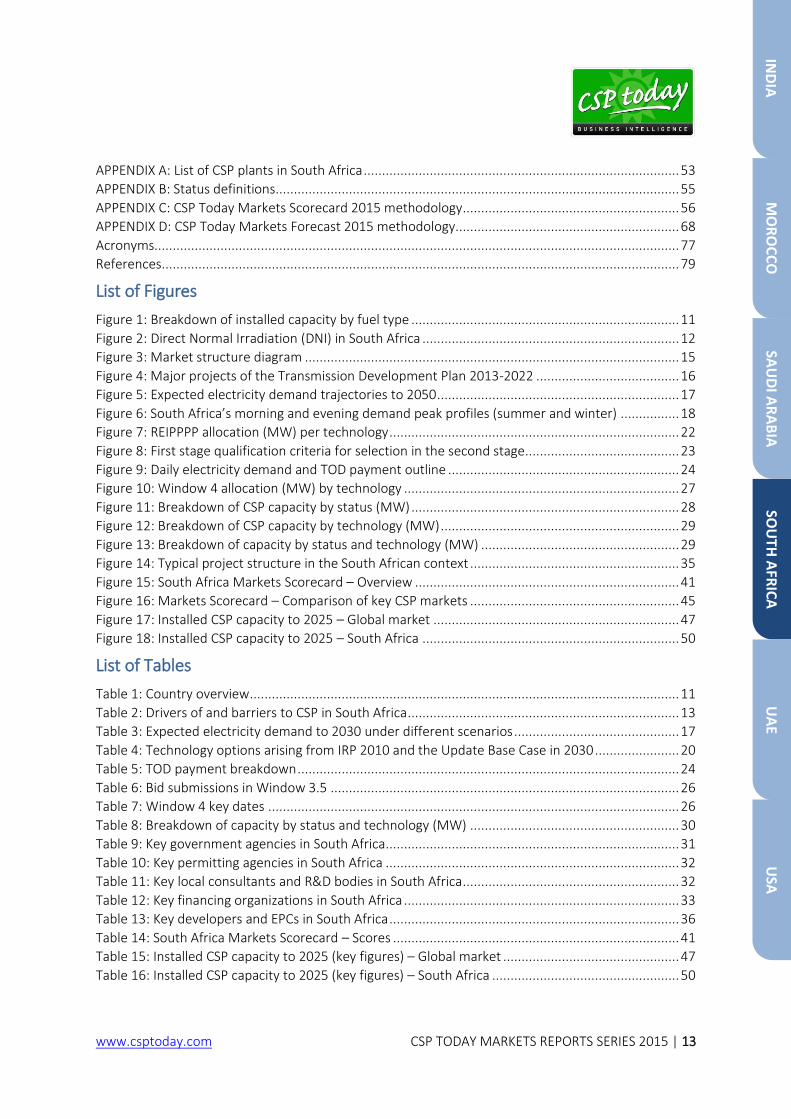
APPENDIX A: List of CSP plants in South Africa ...................................................................................... 53
APPENDIX B: Status definitions.............................................................................................................. 55
APPENDIX C: CSP Today Markets Scorecard 2015 methodology ........................................................... 56
APPENDIX D: CSP Today Markets Forecast 2015 methodology............................................................. 68
Acronyms............................................................................................................................................... 77
References ............................................................................................................................................. 79
List of Figures
Figure 1: Breakdown of installed capacity by fuel type ......................................................................... 11
Figure 2: Direct Normal Irradiation (DNI) in South Africa ...................................................................... 12
Figure 3: Market structure diagram ...................................................................................................... 15
Figure 4: Major projects of the Transmission Development Plan 2013-2022 ....................................... 16
Figure 5: Expected electricity demand trajectories to 2050 .................................................................. 17
Figure 6: South Africa’s morning and evening demand peak profiles (summer and winter) ................ 18
Figure 7: REIPPPP allocation (MW) per technology ............................................................................... 22
Figure 8: First stage qualification criteria for selection in the second stage.......................................... 23
Figure 9: Daily electricity demand and TOD payment outline ............................................................... 24
Figure 10: Window 4 allocation (MW) by technology ........................................................................... 27
Figure 11: Breakdown of CSP capacity by status (MW) ......................................................................... 28
Figure 12: Breakdown of CSP capacity by technology (MW) ................................................................. 29
Figure 13: Breakdown of capacity by status and technology (MW) ...................................................... 29
Figure 14: Typical project structure in the South African context ......................................................... 35
Figure 15: South Africa Markets Scorecard – Overview ........................................................................ 41
Figure 16: Markets Scorecard – Comparison of key CSP markets ......................................................... 45
Figure 17: Installed CSP capacity to 2025 – Global market ................................................................... 47
Figure 18: Installed CSP capacity to 2025 – South Africa ...................................................................... 50
List of Tables
Table 1: Country overview ..................................................................................................................... 11
Table 2: Drivers of and barriers to CSP in South Africa .......................................................................... 13
Table 3: Expected electricity demand to 2030 under different scenarios ............................................. 17
Table 4: Technology options arising from IRP 2010 and the Update Base Case in 2030 ....................... 20
Table 5: TOD payment breakdown ........................................................................................................ 24
Table 6: Bid submissions in Window 3.5 ............................................................................................... 26
Table 7: Window 4 key dates ................................................................................................................ 26
Table 8: Breakdown of capacity by status and technology (MW) ......................................................... 30
Table 9: Key government agencies in South Africa ................................................................................ 31
Table 10: Key permitting agencies in South Africa ................................................................................ 32
Table 11: Key local consultants and R&D bodies in South Africa ........................................................... 32
Table 12: Key financing organizations in South Africa ........................................................................... 33
Table 13: Key developers and EPCs in South Africa ............................................................................... 36
Table 14: South Africa Markets Scorecard – Scores .............................................................................. 41
Table 15: Installed CSP capacity to 2025 (key figures) – Global market ................................................ 47
Table 16: Installed CSP capacity to 2025 (key figures) – South Africa ................................................... 50
IND
IA
MO
RO
CC
O
SAU
DI A
RA
BIA
SO
UTH
AFR
ICA
U
AE
USA
www.csptoday.com CSP TODAY MARKETS REPORTS SERIES 2015 | 14
Table of contents – the UAE Contents
List of Figures .......................................................................................................................................... 8
List of Tables ............................................................................................................................................ 8
Executive summary ................................................................................................................................. 9
1. Country overview .......................................................................................................................... 11
2. Electricity market .......................................................................................................................... 14
2.1. Grid transmission .................................................................................................................. 16
2.2. Electricity demand ................................................................................................................. 16
3. CSP market in the UAE .................................................................................................................. 17
3.1. CSP regulatory framework ..................................................................................................... 17
3.1.1. The Emirate of Dubai ..................................................................................................... 18
3.1.2. The Emirate of Abu Dhabi ............................................................................................. 18
3.2. Local content requirements .................................................................................................. 19
3.3. CSP project pipeline............................................................................................................... 20
3.4. Local CSP ecosystem ............................................................................................................. 21
3.4.1. Key government agencies ............................................................................................. 21
3.4.2. Independent Water and Power Producers .................................................................... 23
3.4.3. Local utilities and transmission grid operators .............................................................. 24
3.4.4. Permitting agencies ....................................................................................................... 26
3.4.5. Local consultants and R&D bodies ................................................................................ 29
3.4.6. Financial organizations .................................................................................................. 30
3.4.7. Developers, EPCs and engineering companies .............................................................. 32
3.4.8. Local component supply ................................................................................................ 35
3.4.9. Raw materials availability .............................................................................................. 37
4. CSP Today Markets Scorecard and Forecast 2015......................................................................... 38
4.1. CSP Today Markets Scorecard 2015 ...................................................................................... 38
4.1.1. Introduction to the Scorecard ....................................................................................... 38
4.1.2. The potential for CSP in the UAE ................................................................................... 39
4.1.3. The UAE compared to other key CSP markets ............................................................... 43
4.2. CSP Today Markets Forecast 2015 ........................................................................................ 44
4.2.1. Introduction to the Markets Forecast ........................................................................... 44
4.2.2. Global market forecast .................................................................................................. 45
4.2.3. Forecast CSP installed capacity in the UAE .................................................................... 48
APPENDIX A: Status definitions ............................................................................................................. 51
APPENDIX B: CSP Today Markets Scorecard 2015 methodology ........................................................... 52
APPENDIX C: CSP Today Markets Forecast 2015 methodology ............................................................. 64
Acronyms............................................................................................................................................... 73
References ............................................................................................................................................. 75
IND
IA
MO
RO
CC
O
SAU
DI A
RA
BIA
SO
UTH
AFR
ICA
U
AE
USA
www.csptoday.com CSP TODAY MARKETS REPORTS SERIES 2015 | 15
List of Figures
Figure 1: Breakdown of installed capacity by fuel type ......................................................................... 11
Figure 2: Direct Normal Irradiation (DNI) in the UAE ............................................................................ 12
Figure 3: Market structure diagram ...................................................................................................... 15
Figure 4: UAE Markets Scorecard – Overview ....................................................................................... 39
Figure 5: Markets Scorecard – Comparison of key CSP markets ........................................................... 43
Figure 6: Installed CSP capacity to 2025 – Global market ..................................................................... 45
Figure 7: Installed CSP capacity to 2025 – UAE ..................................................................................... 48
List of Tables
Table 1: Country overview ..................................................................................................................... 11
Table 2: Drivers of and barriers to CSP in the UAE ................................................................................ 13
Table 3: CSP project pipeline in the UAE ............................................................................................... 20
Table 4: Key government agencies in the UAE ...................................................................................... 21
Table 5: Independent Water and Power Producers in the UAE ............................................................ 23
Table 6: Local utilities and transmission grid operators in the UAE....................................................... 24
Table 7: Key permitting agencies in the UAE ......................................................................................... 26
Table 8: Local consultants and R&D bodies in the UAE ......................................................................... 29
Table 9: Key financing institutions and banks in the UAE ...................................................................... 31
Table 10: Key developers and EPCs in the UAE ..................................................................................... 32
Table 11: Key local component suppliers .............................................................................................. 35
Table 12: Raw materials suppliers in the UAE ....................................................................................... 37
Table 13: UAE Markets Scorecard – Scores ........................................................................................... 39
Table 14: Installed CSP capacity to 2025 (key figures) – Global market ................................................ 45
Table 15: Installed CSP capacity to 2025 (key figures) – UAE ................................................................ 48
IND
IA
MO
RO
CC
O
SAU
DI A
RA
BIA
SO
UTH
AFR
ICA
U
AE
USA
www.csptoday.com CSP TODAY MARKETS REPORTS SERIES 2015 | 16
Table of contents – the USA Contents
List of Figures .......................................................................................................................................... 8
List of Tables ............................................................................................................................................ 8
Executive summary ................................................................................................................................. 9
1. Country overview .......................................................................................................................... 11
2. Electricity market .......................................................................................................................... 14
2.1. Structure of the electricity market ........................................................................................ 14
2.1.1. Regulation ..................................................................................................................... 14
2.1.2. Generation .................................................................................................................... 15
2.1.3. Grid transmission .......................................................................................................... 15
2.1.4. Distribution .................................................................................................................... 17
2.2. Electricity demand ................................................................................................................. 19
3. CSP market in the USA ................................................................................................................... 20
3.1. Renewable energy ................................................................................................................. 20
3.2. Current status of the CSP industry ........................................................................................ 21
3.3. CSP regulatory framework ..................................................................................................... 24
3.3.1. Renewable energy initiatives ......................................................................................... 24
3.3.2. Financial incentives ....................................................................................................... 25
3.3.2.1. Loan Guarantees ................................................................................................... 25
3.3.2.2. SunShot initiative ................................................................................................... 26
3.3.2.3. FOCUS program ..................................................................................................... 28
3.3.2.4. Other federal-level initiatives ................................................................................ 28
3.3.2.5. State-level incentives ............................................................................................. 29
3.3.3. Local content requirements .......................................................................................... 30
3.4. CSP project pipeline............................................................................................................... 31
3.5. Local CSP ecosystem ............................................................................................................. 33
3.5.1. Key government agencies ............................................................................................. 33
3.5.2. Utilities .......................................................................................................................... 34
3.5.3. Permitting agencies ....................................................................................................... 35
3.5.4. Local consultants and R&D bodies ................................................................................ 38
3.5.5. Financing organizations ................................................................................................. 39
3.5.6. Developers and EPC firms.............................................................................................. 41
3.5.7. Local component supply ................................................................................................ 43
4. CSP Today Markets Scorecard and Forecast 2015......................................................................... 45
4.1. CSP Today Markets Scorecard 2015 ...................................................................................... 45
4.1.1. Introduction to the Scorecard ....................................................................................... 45
4.1.2. The potential for CSP in the USA ................................................................................... 46
4.1.3. The USA compared to other key CSP markets ............................................................... 50
4.2. CSP Today Markets Forecast 2015 ........................................................................................ 51
IND
IA
MO
RO
CC
O
SAU
DI A
RA
BIA
SO
UTH
AFR
ICA
U
AE
USA
www.csptoday.com CSP TODAY MARKETS REPORTS SERIES 2015 | 17
4.2.1. Introduction to the Markets Forecast ........................................................................... 51
4.2.2. Global market forecast .................................................................................................. 52
4.2.3. Forecast CSP installed capacity in the USA .................................................................... 55
APPENDIX A: List of CSP plants in the USA ............................................................................................ 58
APPENDIX B: Status definitions.............................................................................................................. 61
APPENDIX C: CSP Today Markets Scorecard 2015 methodology ........................................................... 62
APPENDIX D: CSP Today Markets Forecast 2015 methodology............................................................. 74
Acronyms............................................................................................................................................... 83
References ............................................................................................................................................. 86
List of Figures
Figure 1: Breakdown of electricity net generation by energy source .................................................... 11
Figure 2: Direct Normal Irradiation (DNI) in the United States .............................................................. 12
Figure 3: US national power grid ........................................................................................................... 16
Figure 4: NERC regional entities ............................................................................................................ 17
Figure 5: Market structure diagram ...................................................................................................... 18
Figure 6: California’s summer daily electricity demand curve ............................................................... 19
Figure 7: US States with RPS or RPGs .................................................................................................... 25
Figure 8: Breakdown of CSP capacity by status (MW) ........................................................................... 31
Figure 9: Breakdown of CSP capacity by technology (MW) ................................................................... 32
Figure 10: Breakdown of capacity by status and technology (MW) ...................................................... 32
Figure 11: USA Markets Scorecard – Overview ..................................................................................... 46
Figure 12: Markets Scorecard – Comparison of key CSP markets ......................................................... 50
Figure 13: Installed CSP capacity to 2025 – Global market ................................................................... 52
Figure 14: Installed CSP capacity to 2025 – USA ................................................................................... 55
List of Tables
Table 1: Country overview ..................................................................................................................... 11
Table 2: Drivers of and barriers to CSP in the USA ................................................................................ 13
Table 3: New capacity installed in the USA in 2013 by fuel type ........................................................... 20
Table 4: Overview of other main federal policy initiatives in the USA ................................................... 28
Table 5: Breakdown of capacity by status and technology (MW) ......................................................... 33
Table 6: Key government agencies in the USA ...................................................................................... 33
Table 7: Utilities and Independent Power Producers in the USA .......................................................... 34
Table 8: Key permitting agencies in the USA ......................................................................................... 35
Table 9: Key local consultants and R&D bodies in the USA ................................................................... 38
Table 10: Key financial organizations in the USA ................................................................................... 39
Table 11: Key developers and EPC firms in the USA .............................................................................. 41
Table 12: Key local suppliers in the USA ................................................................................................ 43
Table 13: USA Markets Scorecard – Scores ........................................................................................... 46
Table 14: Installed CSP capacity to 2025 (key figures) – Global market ................................................ 52
Table 15: Installed CSP capacity to 2025 (key figures) – USA ................................................................ 55
IND
IA
MO
RO
CC
O
SAU
DI A
RA
BIA
SO
UTH
AFR
ICA
U
AE
USA
www.csptoday.com CSP TODAY MARKETS REPORTS SERIES 2015 | 18
Methodology
CSP Today’s Markets Reports Series 2015 responds to the most critical needs of the CSP
industry, representing six months of research (primary and secondary) and culminating in a
series of six reports containing high-quality data and analysis.
Barriers and drivers: In-depth interviews with 25+ key industry experts and developers active
in the market analyzed.
Project pipelines: Making use of the CSP Today Global Tracker, all project data is industry
validated and accurate as of August 2014, providing detailed information of projects
announced, planned, in development, construction and operation.
Local CSP ecosystem: Building upon CSP Today’s proprietary data and the knowledge of local
authors and peer reviewers, the stakeholder map in each market has been outlined and
reviewed by on-the-ground players active in the local CSP market.
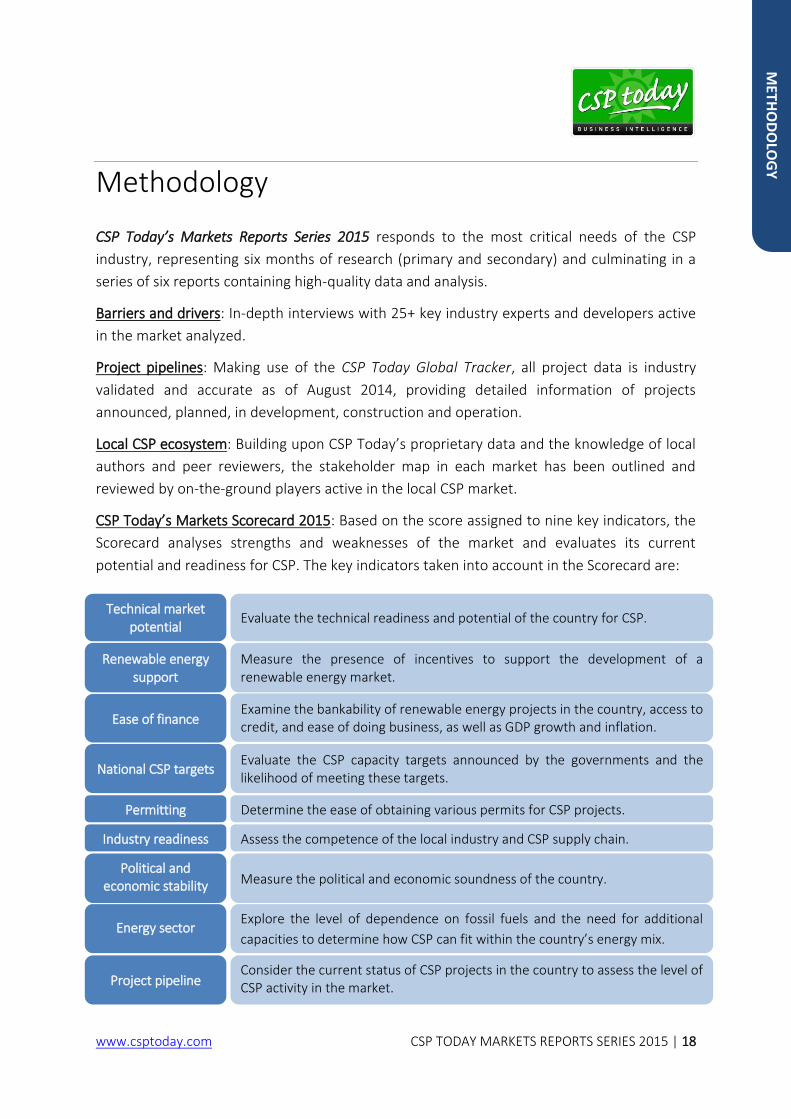
CSP Today’s Markets Scorecard 2015: Based on the score assigned to nine key indicators, the
Scorecard analyses strengths and weaknesses of the market and evaluates its current
potential and readiness for CSP. The key indicators taken into account in the Scorecard are:
MET
HO
DO
LOG
Y
Technical market potential
Evaluate the technical readiness and potential of the country for CSP.
Renewable energy support
Measure the presence of incentives to support the development of a renewable energy market.
Ease of finance Examine the bankability of renewable energy projects in the country, access to credit, and ease of doing business, as well as GDP growth and inflation.
National CSP targets Evaluate the CSP capacity targets announced by the governments and the likelihood of meeting these targets.
Permitting Determine the ease of obtaining various permits for CSP projects.
Industry readiness Assess the competence of the local industry and CSP supply chain.
Political and
economic stability
Measure the political and economic soundness of the country.
Energy sector Explore the level of dependence on fossil fuels and the need for additional
capacities to determine how CSP can fit within the country’s energy mix.
Project pipeline Consider the current status of CSP projects in the country to assess the level of CSP activity in the market.
www.csptoday.com CSP TODAY MARKETS REPORTS SERIES 2015 | 19
CSP Today’s Forecast 2015: The Forecast presents an overview of the future deployment of
CSP in the global market as well as in the specific market analyzed leading up to 2025. Each
market forecast includes three different scenarios: optimistic, conservative and pessimistic.
Using up-to-date data from the CSP Today Global Tracker and insights from stakeholders on
the expected installed CSP capacities, the forecast aims to enable an assessment of the
longevity of the markets and the associated potential return on investments.
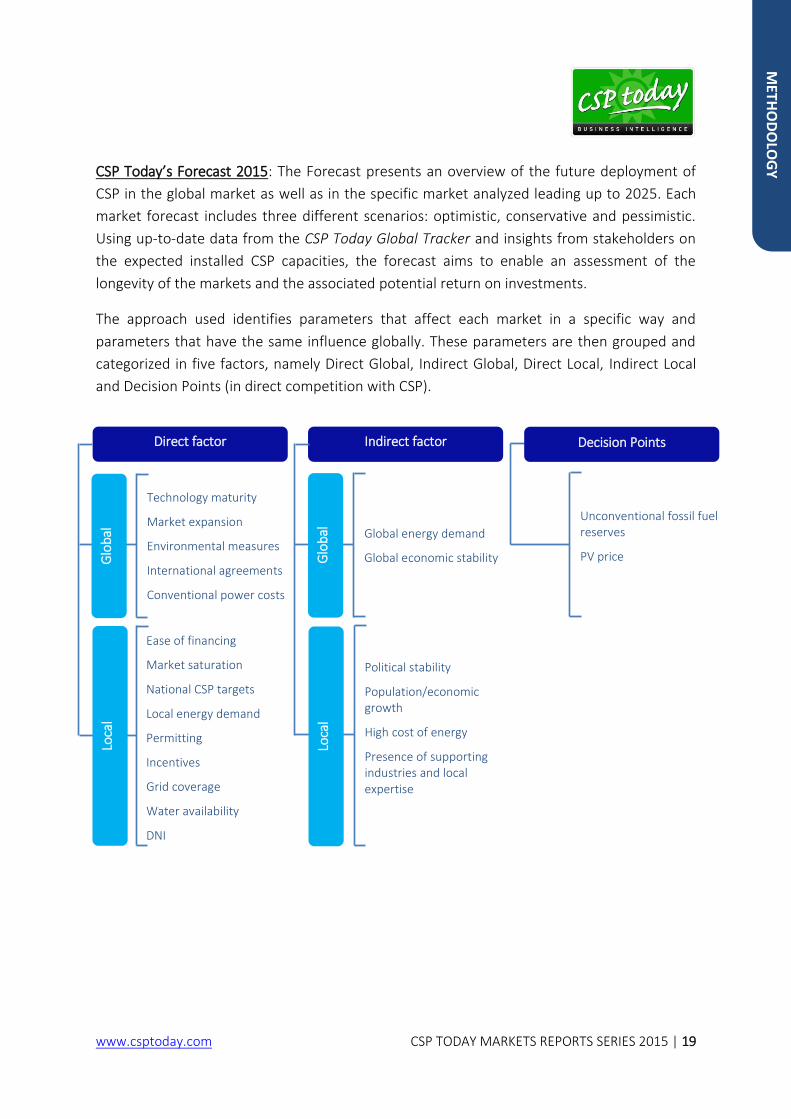
The approach used identifies parameters that affect each market in a specific way and
parameters that have the same influence globally. These parameters are then grouped and
categorized in five factors, namely Direct Global, Indirect Global, Direct Local, Indirect Local
and Decision Points (in direct competition with CSP).
Direct factor Indirect factor Decision Points
Glo
bal
Technology maturity
Market expansion
Environmental measures
International agreements
Conventional power costs
Loca
l
Ease of financing
Market saturation
National CSP targets
Local energy demand
Permitting
Incentives
Grid coverage
Water availability
DNI
Glo
bal
Global energy demand
Global economic stability
Loca
l
Political stability
Population/economic growth
High cost of energy
Presence of supporting industries and local expertise
Unconventional fossil fuel reserves
PV price
MET
HO
DO
LOG
Y
www.csptoday.com CSP TODAY MARKETS REPORTS SERIES 2015 | 20
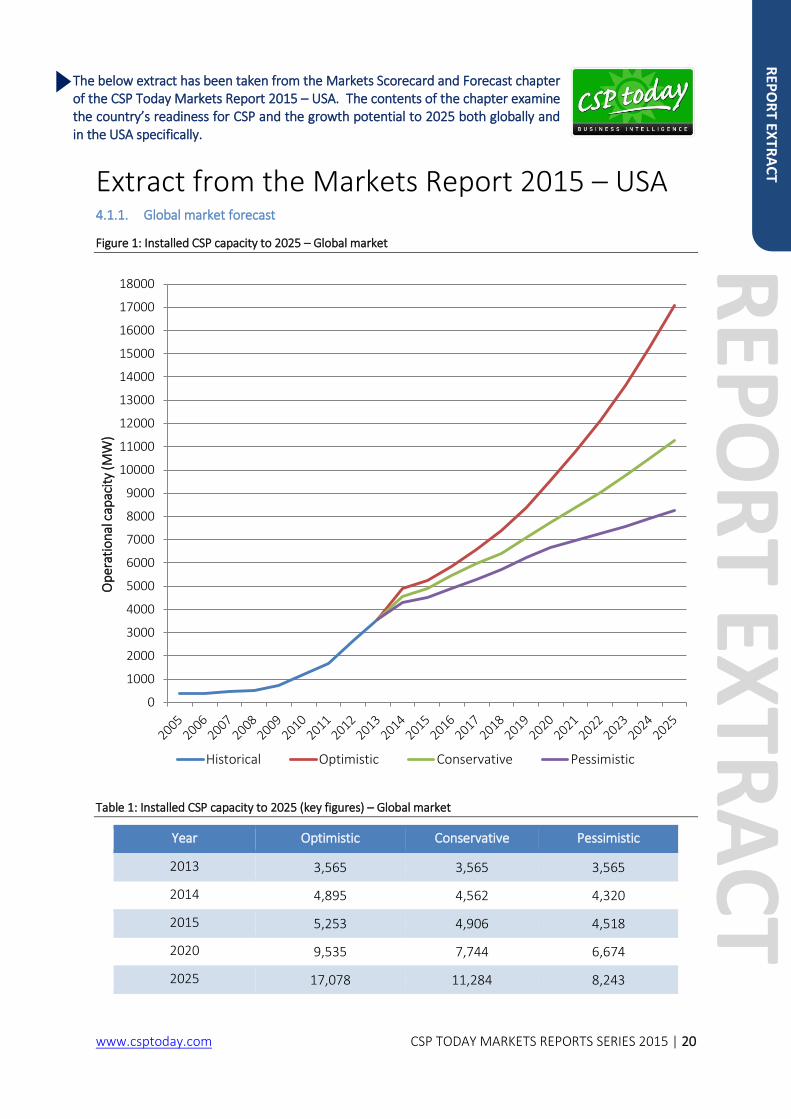
Extract from the Markets Report 2015 – USA 4.1.1. Global market forecast
Figure 1: Installed CSP capacity to 2025 – Global market
Table 1: Installed CSP capacity to 2025 (key figures) – Global market
Year Optimistic Conservative Pessimistic
2013 3,565 3,565 3,565
2014 4,895 4,562 4,320
2015 5,253 4,906 4,518
2020 9,535 7,744 6,674
2025 17,078 11,284 8,243
0
1000
2000
3000
4000
5000
6000
7000
8000
9000
10000
11000
12000
13000
14000
15000
16000
17000
18000
Op
erat
ion
al c
apac
ity
(MW
)
Historical Optimistic Conservative Pessimistic
REP
OR
T EXTR
AC
T
REP
OR
T EXTR
AC
T The below extract has been taken from the Markets Scorecard and Forecast chapter of the CSP Today Markets Report 2015 – USA. The contents of the chapter examine the country’s readiness for CSP and the growth potential to 2025 both globally and in the USA specifically.
www.csptoday.com CSP TODAY MARKETS REPORTS SERIES 2015 | 21
Optimistic scenario
The optimistic scenario for the global forecast
is largely influenced by the availability of
incentives in key CSP markets, a parameter
that is assigned the highest value (9). Such
incentives include feed-in-tariffs (which helped
drive CSP growth in Spain and more recently in
South Africa), as well as capital subsidies,
investment tax credits, and public competitive
bidding.
Local energy demand, which scored 3.5, is also
considered to be a direct contributor to CSP
deployment decisions. Countries such as
Morocco, India and South Africa are spending
billions of dollars on fuel imports every year in
order to meet burgeoning demand. It is no
coincidence that all three countries have set
ambitious solar energy targets and are
constructing their first CSP plants.
While an increasing demand for energy can
galvanize government interest in CSP, national
CSP targets motivate the global industry as
they prove political commitment to CSP. The
positive impact of such targets has led to
assigning this parameter a value of 4.
Overall, the optimistic scenario forecasts that
global CSP capacity will increase from 3,565
MW in 2013 to 5,253 MW by 2015. In the
longer term, this capacity is projected to rise
to 9,535 MW by 2020, and 17,078 MW by
2025.
Conservative scenario
The conservative scenario acknowledges the
fact that CSP technologies are progressing fast,
and the encouraging DNI available in many CSP
markets. Indeed, these parameters
(technology maturity and DNI) score 3 and 5
respectively.
Nevertheless, the scenario is negatively
influenced by the fact that water scarcity is a
common issue in high-DNI locations.
Consequently, the use of dry cooling systems
is required, which in turn leads to efficiency
losses. Therefore, water availability
contributes with a value of 0. Conventional
power cost is also regarded as a challenging
aspect to the global deployment of CSP, given
that fossil fuel prices are still cheaper than
those of CSP, and subsidized by the
government in some countries. This explains
the negative value of -2.5 assigned to this
parameter.
Weighing in the above parameters, the
conservative scenario forecasts that global
installed CSP capacity will increase from 3,565
MW in 2013 to 4,906 by 2015. In the longer
term, this capacity is projected to rise to 7,744
MW by 2020, and 11,284 MW by 2025.
Pessimistic scenario
In addition to water availability and
conventional power cost, the pessimistic
scenario considers grid coverage issues in CSP
markets. Indeed, CSP plants can take years to
connect to the grid as they are usually far from
load centers, and therefore need larger
evacuation capacities and extended
transmission lines. South Africa’s Transmission
Development Plan, for example, foresees the
installation of an additional 12,733 km of lines
by 2022 (Eskom, 2013d). The cost implications
of these required expansions can also be
extremely high. For instance, the high-voltage
connection for the Shams 1 CSP plant in the
UAE cost more than US$ 25.5 million (Al-Ali,
REP
OR
T EXTR
AC
T
REP
OR
T EXTR
AC
T
www.csptoday.com CSP TODAY MARKETS REPORTS SERIES 2015 | 22
2012). These challenges in grid coverage are
reflected in its corresponding value of -1.
Finally, in light of the increasing production of
unconventional fossil fuels in the global
market, and the decreasing price of PV, CSP
will need to achieve substantial cost
reductions in order to become as competitive.
In fact, unconventional fossil fuel reserves and
PV price are considered as decision points in
global CSP growth, scoring negative values of
-1 and -3.5 respectively.
As a result, the pessimistic scenario forecasts
that global installed CSP capacity will increase
from 3,565 MW in 2013 to 4,518 MW by 2015.
In the longer term, this capacity is projected to
rise to 6,674 MW by 2020 and 8,243 MW by
2025.
REP
OR
T EXTR
AC
T
REP
OR
T EXTR
AC
T
www.csptoday.com CSP TODAY MARKETS REPORTS SERIES 2015 | 23
About CSP Today
CSP Today is the reference point for Concentrated Solar Power (CSP) professionals and a cornerstone for communications within the industry. We have been the leading provider in this global market for the past eight years. We provide industry-focused news, events and online up-to-the minute data, analyses, reports, updates and information for the CSP industry. CSP Today's objective is to be the hub of the community, enabling dialogue throughout the industry. We aim to drive CSP forwards and provide clients with the most accurate and timely project and plant intelligence, based on research of the highest quality. Everyday CSP Today experts are on the phone with EPCs, developers, suppliers, as well as financiers, utilities and government bodies in order to provide you with the latest, verified global industry data and information.
CHOOSE YOUR REPORT
India
Pages: 92
Price: € 775
Morocco
Pages: 83
Price: € 775
Saudi Arabia
Pages: 86
Price: € 775
South Africa
Pages: 82
Price: € 775
UAE
Pages: 77
Price: € 775
USA
Pages: 90
Price: € 775
FIND OUT MORE ABOUT THE REPORTS AND OUR SUBSCRIPTION SERVICES
Aleksandra Sledzinska Sales Executive Phone: +44 (0) 207 375 4332 US toll free: 1800 814 3459 ex: 4332 Email: [email protected]
THREE WAYS TO ORDER YOUR REPORT NOW
https://secure.csptoday.com/research/CSP-markets-series-purchase.php
+44 (0) 207 375 4332
AB
OU
T CSP
TOD
AY
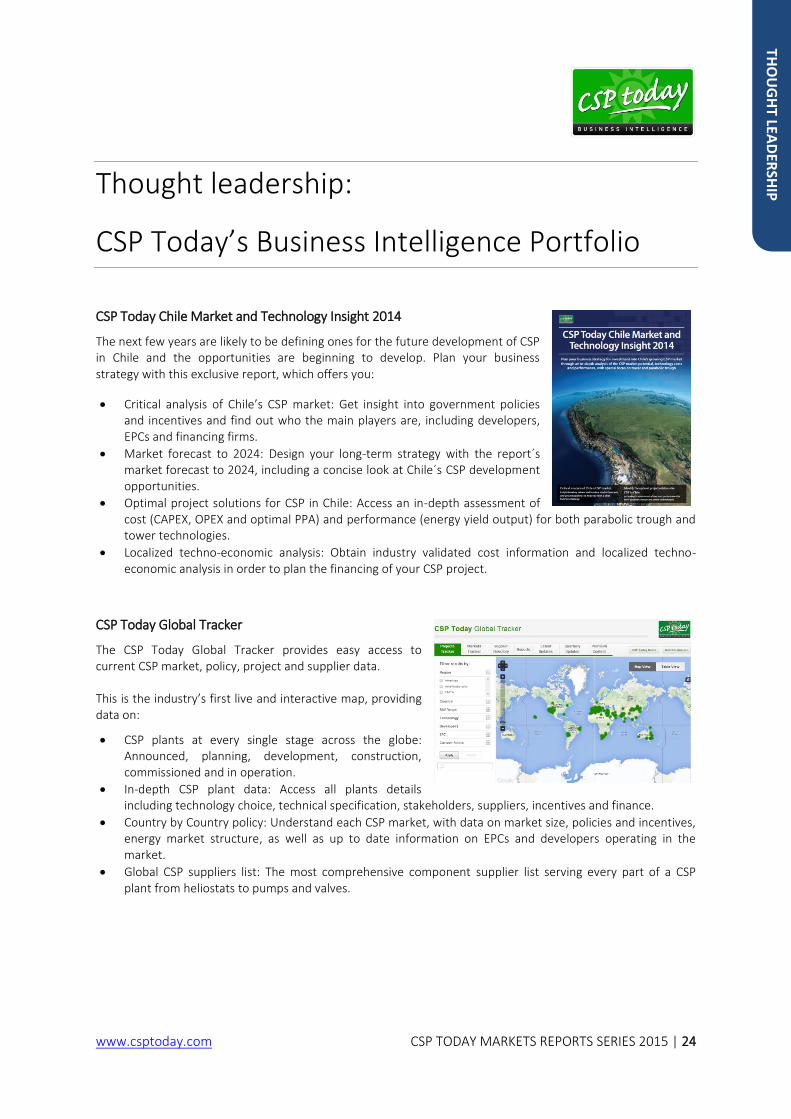
www.csptoday.com CSP TODAY MARKETS REPORTS SERIES 2015 | 24
Thought leadership:
CSP Today’s Business Intelligence Portfolio
CSP Today Chile Market and Technology Insight 2014
The next few years are likely to be defining ones for the future development of CSP in Chile and the opportunities are beginning to develop. Plan your business strategy with this exclusive report, which offers you:
Critical analysis of Chile’s CSP market: Get insight into government policies and incentives and find out who the main players are, including developers, EPCs and financing firms.
Market forecast to 2024: Design your long-term strategy with the report´s market forecast to 2024, including a concise look at Chile´s CSP development opportunities.
Optimal project solutions for CSP in Chile: Access an in-depth assessment of cost (CAPEX, OPEX and optimal PPA) and performance (energy yield output) for both parabolic trough and tower technologies.
Localized techno-economic analysis: Obtain industry validated cost information and localized techno-economic analysis in order to plan the financing of your CSP project.
CSP Today Global Tracker
The CSP Today Global Tracker provides easy access to current CSP market, policy, project and supplier data. This is the industry’s first live and interactive map, providing data on:
CSP plants at every single stage across the globe: Announced, planning, development, construction, commissioned and in operation.
In-depth CSP plant data: Access all plants details including technology choice, technical specification, stakeholders, suppliers, incentives and finance.
Country by Country policy: Understand each CSP market, with data on market size, policies and incentives, energy market structure, as well as up to date information on EPCs and developers operating in the market.
Global CSP suppliers list: The most comprehensive component supplier list serving every part of a CSP plant from heliostats to pumps and valves.
THO
UG
HT LEA
DER
SHIP
www.csptoday.com CSP TODAY MARKETS REPORTS SERIES 2015 | 25
CSP Today Quarterly Update
CSP Today’s Quarterly Update provides a comprehensive analysis of the industry utilizing data from the CSP Today Global Tracker. It acts as an easily digestible guide to recent industry developments in order to enhance your understanding of the global CSP picture.
With a new issue every quarter, this tool gives you:
Insight into the latest announcements, project updates and investments, with CSP Today analysis into their importance and impact on the industry.
Comparisons across 30 CSP markets, which allow you to see project pipelines, technology selections, companies involved and megawatt capacities.
A breakdown of key opportunities in each of the major markets, detailing how the latest developments may affect your business strategy.
Updated predictions on the hottest markets and what your business can expect in the following quarters.
CSP Today Technology Reports 2014
Parabolic Trough Report 2014: Cost, Performance and Thermal Storage and Tower Report 2014: Cost, Performance and Thermal Storage.
Strategically plan your commercial trajectory and optimize profitability in the increasingly internationalized solar tower market.
Through industry-validated cost information, localized techno-economic analysis and inter-market benchmarking, these reports bring unprecedented clarity on Parabolic Trough and Solar Tower technology across eight global markets, enabling you to separate the fact from the hype.
Critical market specific cost data: Receive the most up-to-date, industry validated cost data breakdowns from CAPEX to OPEX in defined optimal Parabolic Trough and Solar Tower plants across eight markets (Chile, India, Morocco, Spain, Saudi Arabia, South Africa, UAE and USA).
Realistic LCOE models: Determine the LCOE of Parabolic Trough and Solar Tower technology by market, benchmark emerging CSP markets against the traditional key markets and identify the longitudinal trend with market specific LCOE forecasts.
Energy yield and performance output data and analysis: Identify and benchmark the market specific energy yield and performance characteristics, including solar field thermal output, online parasitics, net energy, total operating hours, solar-to-electricity efficiency and water consumption.
The evolution of Thermal Storage (TES): Use the global project pipelines to understand how and to what extent TES is being increasingly incorporated into Parabolic Trough and Solar Tower plants, and gain insight into the latest R&D initiatives in TES tipped to reduce cost and optimize performance.
Market share of Parabolic Trough and Solar Tower technology: Strategize your investment and gauge your profit by understanding the long-term market share, growth and viability of these technologies, including market-by-market pipelines and key comparisons with other CSP technologies.
THO
UG
HT LEA
DER
SHIP