Embed Size (px)
Citation preview

The Republic of the Philippines
DEPARTMENT OF PUBLIC WORKS AND HIGHWAYS
PLANNING AND DESIGNING FOR CLIMATE ADAPTIVE AND RESILIENT TRANSPORT:
EXPERIENCE FROM PHILIPPINES
1
Engineer ERNESTO V. ALDAY, JRProject Preparation Division, Planning Service
Regional Seminar on Safe, Climate Adaptive and Disaster Resilient Transport for Sustainable Development
Kathmandu, Nepal17 November 2015

10 Year Disaster Data:
1
6,966,136(1,232)
1,019,646(54)
11,253,211(1,165)
2,998,885(124)
7,009,725(673)
12,250,050(1,140)
2,596,587(136)
9,884,577(1,557)
8,006,126(1,386)
21,381,374(6,389)
13,106,133(294)
Affected Persons(Casualties)
Tota
l Cos
t of D
amag
es
US $ 1 - P 44
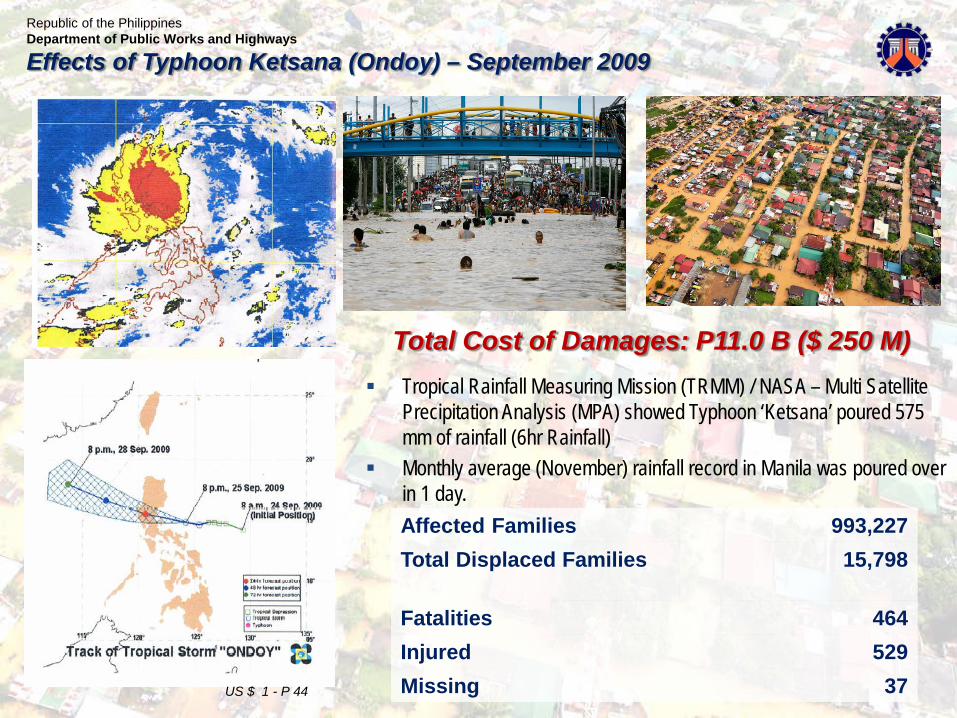
Tropical Rainfall Measuring Mission (TRMM) / NASA – Multi Satellite Precipitation Analysis (MPA) showed Typhoon ‘Ketsana’ poured 575 mm of rainfall (6hr Rainfall)
Monthly average (November) rainfall record in Manila was poured over in 1 day.
Republic of the PhilippinesDepartment of Public Works and Highways
Effects of Typhoon Ketsana (Ondoy) – September 2009
Affected Families 993,227Total Displaced Families 15,798
Fatalities 464Injured 529Missing 37
Total Cost of Damages: P11.0 B ($ 250 M)
US $ 1 - P 44

Republic of the PhilippinesDepartment of Public Works and Highways
Effects of Typhoon Washi (Sendong) – December 2011
Affected Families 131,618
Fatalities 1,268
Injured 6,071
Missing 181
Total Cost of Damages: P2.07 B ($ 47 M)
US $ 1 - P 44

Republic of the PhilippinesDepartment of Public Works and Highways
Effects of Magnitude 7.2 Sagbayan, Bohol Earthquake – October 2013
Affected Families 671,103
Total Displaced Families
72,521
Fatalities 223Missing 8Injured 976
Source: NDRRMC Site Report No. 26, Nov. 6, 2013
Total Cost of Damages: P2.26 B* ($ 51 M)
*Cost of damaged roads, bridges, flood control, school buildings, hospitals, and other public buildings. 5US $ 1 - P 44

Affected Families 1,472,251
Displaced Families 918,261
Damaged Houses 1,171,469
Fatalities 6,300Missing 1,601Injured 28,689
Republic of the PhilippinesDepartment of Public Works and Highways
Effects of Super Typhoon Haiyan (Yolanda) – November 2013
Total Cost of Damages & Losses: P571.11 Billion ($ 12.98 B)*Estimated Recovery and Reconstruction Needs: P360.89 Billion ($ 8.20 B)*
2US $ 1 - P 44* Based on Reconstruction Assistance on Yolanda (RAY), Report as of December 16, 2013
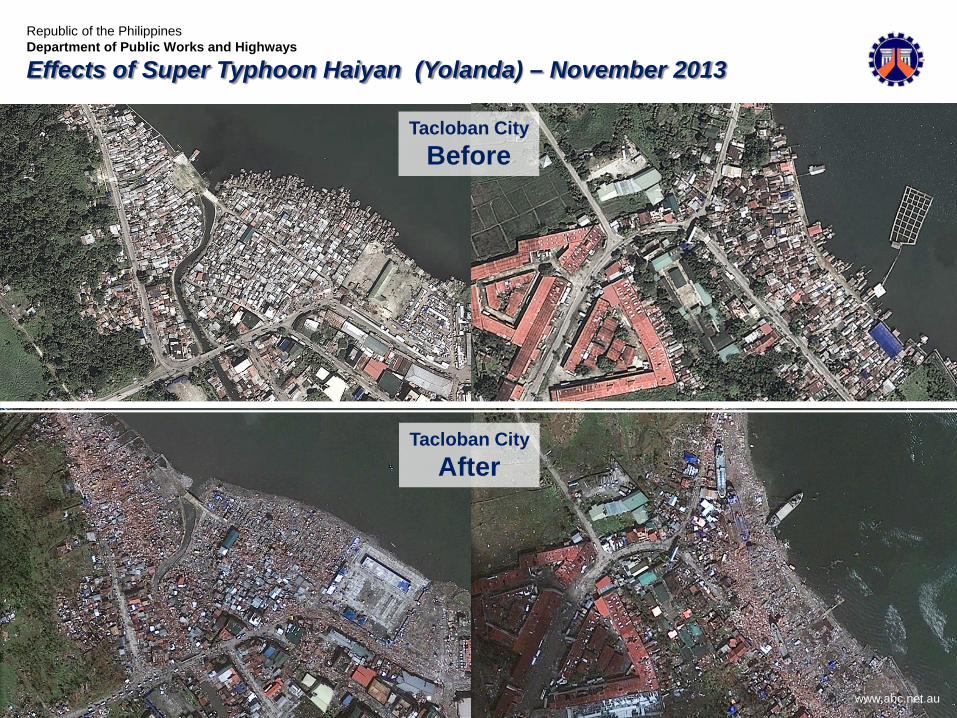
Republic of the PhilippinesDepartment of Public Works and Highways
Effects of Super Typhoon Haiyan (Yolanda) – November 2013
7www.abc.net.au
Tacloban CityBefore
Tacloban CityAfter

Republic of the PhilippinesDepartment of Public Works and Highways
Effects of Super Typhoon Haiyan (Yolanda) – November 2013
8www.abc.net.au
Tacloban CityBefore
Tacloban CityAfter

15 October 2014Malacaňang Palace
3
Pre-Disaster Demographics of the Six (6) Affected Regions (Haiyan)
The affected regions account for26.8% of the total agricultural output, 16.7% of industry, and15.8% of services in 2012
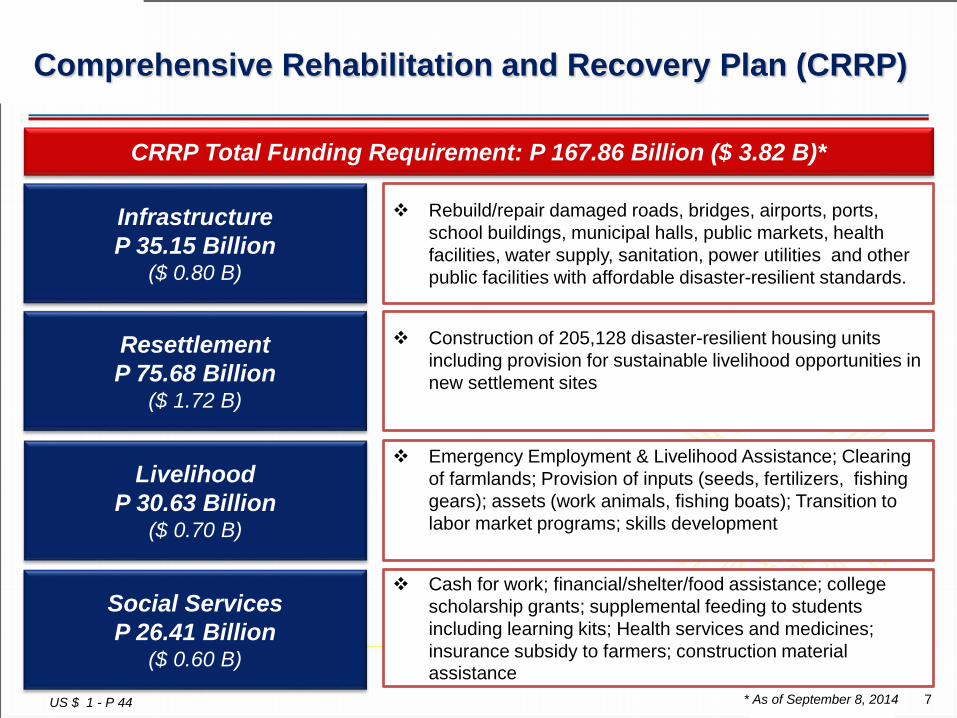
Comprehensive Rehabilitation and Recovery Plan (CRRP)
Infrastructure P 35.15 Billion
($ 0.80 B)
Rebuild/repair damaged roads, bridges, airports, ports, school buildings, municipal halls, public markets, health facilities, water supply, sanitation, power utilities and other public facilities with affordable disaster-resilient standards.
Social Services P 26.41 Billion
($ 0.60 B)
Cash for work; financial/shelter/food assistance; college scholarship grants; supplemental feeding to students including learning kits; Health services and medicines; insurance subsidy to farmers; construction material assistance
ResettlementP 75.68 Billion
($ 1.72 B)
Construction of 205,128 disaster-resilient housing units including provision for sustainable livelihood opportunities in new settlement sites
LivelihoodP 30.63 Billion
($ 0.70 B)
Emergency Employment & Livelihood Assistance; Clearing of farmlands; Provision of inputs (seeds, fertilizers, fishing gears); assets (work animals, fishing boats); Transition to labor market programs; skills development
CRRP Total Funding Requirement: P 167.86 Billion ($ 3.82 B)*
US $ 1 - P 44 7* As of September 8, 2014

6
I. Build Back Better Policy• Need for Structural Measures (More Resilient & Better Designed
Structures)• Lack of Non-Structural Measures (Early Warning, Policy Changes,
Community Awareness)• Need for capacity building of NGAs & LGUs• Inadequate resilient public infrastructure facilities for emergency
situations and disaster mitigation
II. Strategic Policies• Creation of Office of the Presidential Assistant for Rehabilitation and
Recovery• Created cabinet level Climate Change Commission• Adoption of Integrated Water Resource Management (IWRM) principles• Implement River Basin Approach to Flood Management and Water
Optimization
Lessons Learned:
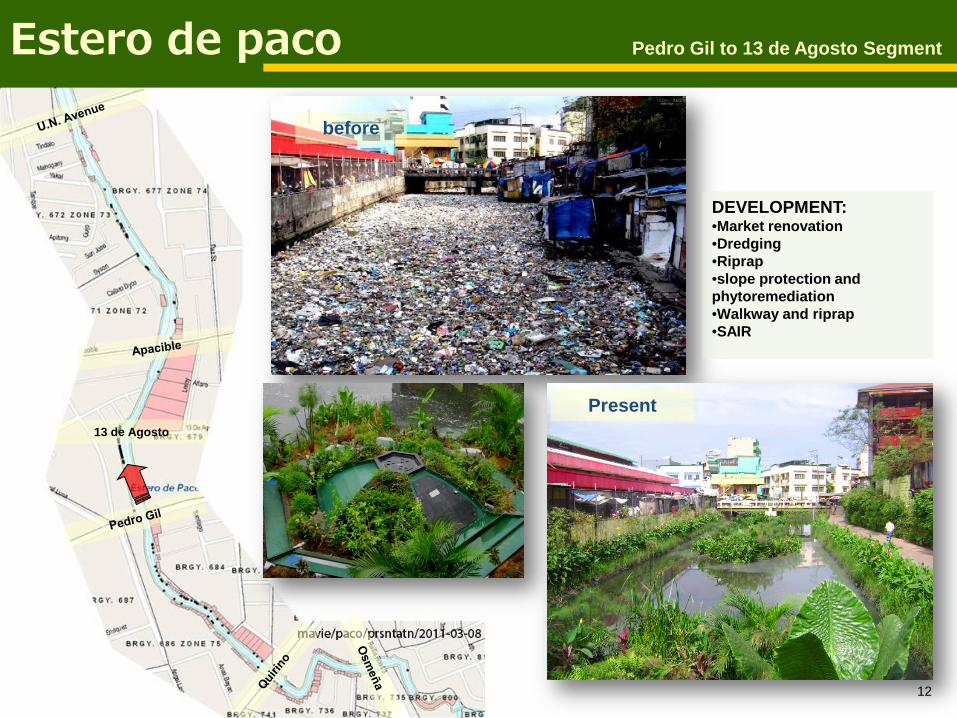
13 de Agosto
Estero de paco Pedro Gil to 13 de Agosto Segment
before
DEVELOPMENT:•Market renovation•Dredging•Riprap•slope protection and phytoremediation•Walkway and riprap•SAIR
Present
12
13 de Agosto
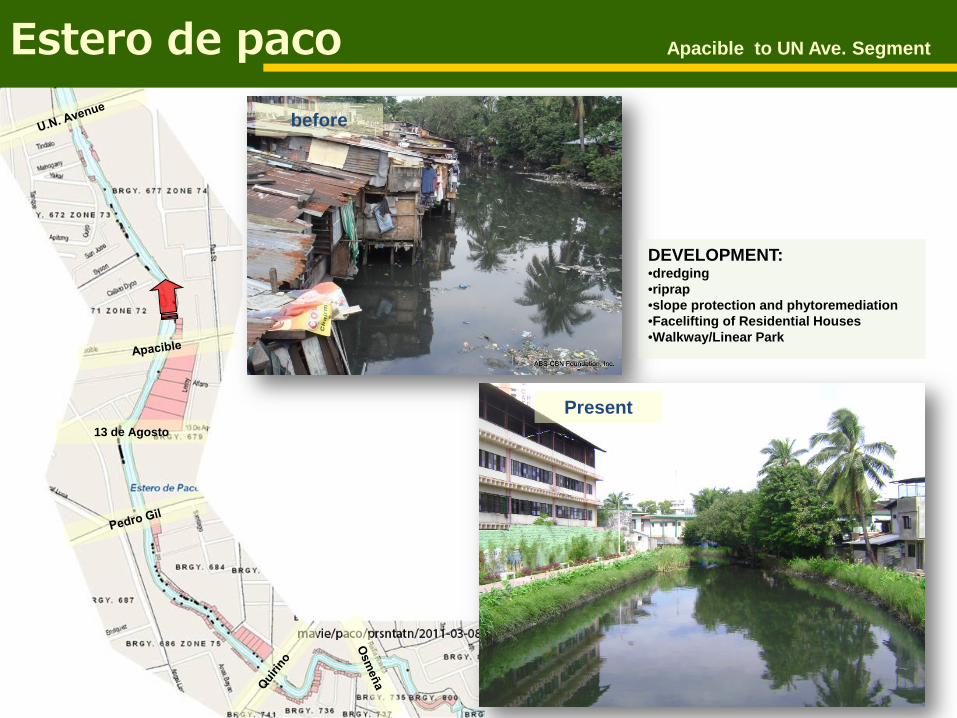
Estero de paco Apacible to UN Ave. Segment
before
Present
DEVELOPMENT:•dredging •riprap•slope protection and phytoremediation•Facelifting of Residential Houses•Walkway/Linear Park

The Detention Tank • is meant to temporarily
detain storm water from direct discharge to waterways.
USE OF RETARDING BASIN IN URBAN CENTERSBURGOS CIRCLE, FORT BONIFACIO GLOBAL CITY
14

15
Spending within Means
Enough Resources to contribute to growth
Efficiently collecting more revenues and carefully managing the country’s debt
Implementing the Two-Tier Budgeting Approach, which sets a sufficient budget for on-going programs and focuses the remaining funds only on priority programs
Spending on the Right Priorities
Focusing on the 5 priority programs (Pursuing Good Governance; Making Growth Inclusive; Sustaining the Growth Momentum; Climate Change Adaptation and Disaster Risk Reduction and Management and Just and Lasting Peace)
Addressing the needs of the 44 poorest and most vulnerable provinces
Spending with Measurable Results
Cutting the number of steps required to release funds, procuring important projects in advance, and paying contractors via bank to bank transactions
Improving the capacity of agencies to procure, spend their budgets on time and monitor their progress
Establishing collaborations with capable local government units and the private sector to implements projects
Linking budget allocations to performance targets through Performance-Informed Budgeting
Citizen Empowerment
Providing a wider space for citizens to shape government priorities through Bottom-Up Budgeting, Budget Partnership Agreements and direct release of funds to local governments
Requiring agencies to provide more information on their websites
Source: Department of Budget and Management
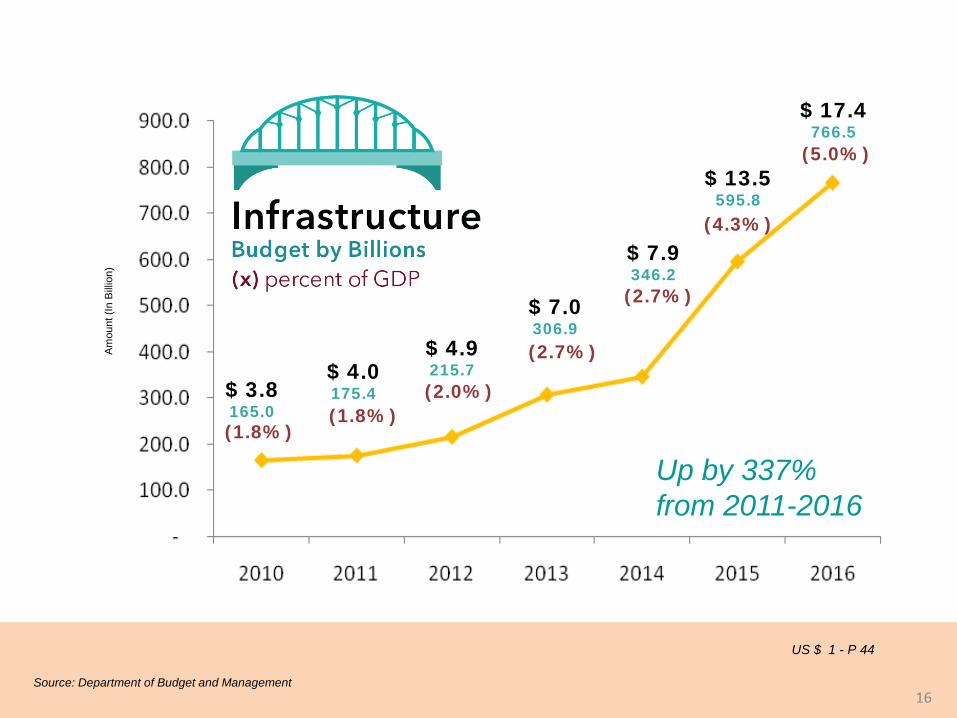
Up by 337% from 2011-2016
16
$ 3.8165.0
$ 4.0175.4
$ 4.9215.7
$ 7.0306.9
$ 7.9346.2
(2.7%)
(2.7%)
(2.0%)(1.8%)
(1.8%)
Am
ount
(In
Bill
ion)
US $ 1 - P 44
(5.0%)
$ 17.4766.5
(4.3%)
$ 13.5595.8
Source: Department of Budget and Management
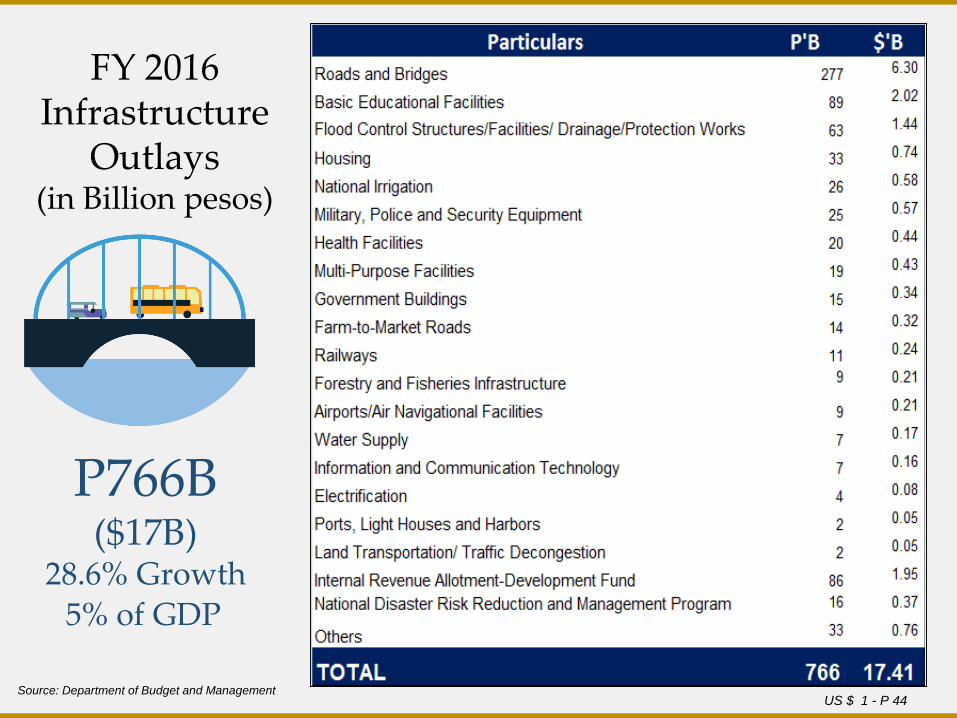
FY 2016 Infrastructure
Outlays(in Billion pesos)
P766B($17B)
28.6% Growth5% of GDP
Source: Department of Budget and ManagementUS $ 1 - P 44

Name of Project Km P’B $’M Start Completion NAIA Expressway 7.15 15.86 360.5 2014 2016Tarlac-Pangasinan-La Union Exp. 88.85 21.38 485.9 2010 2016NLEX Harbor Link, Segment 10* 5.65 9.00 204.5 2014 2017Metro Manila Skyway Stage 3* 14.80 37.43 850.7 2015 2018Plaridel By-Pass Road, Phase II 9.96 3.34 75.9 2014 2018CLLEx – P I (Tarlac-Cabanatuan) 30.00 14.94 339.5 2015 2019CALA Expressway 44.63 35.43 805.2 2016 2020
ON-GOING : 201.04 km, P137.38B (US $ 3,122.27 M)
Name of Project Km P’B $’M Start Completion NLEX-SLEX Connector Road 8.00 23.20 527.3 2016 2020SLEX TR4, Sto. Tomas-Lucena* 58.00 13.1 297.7 2016 2020Laguna Lakeshore ExpresswayDike
47.00 122.81 2,791.1 2016 2023
APPROVED FOR IMPLEMENTATION: 113.00 km, P159.1B (US $ 3,616.1 M)
ADDITIONAL PROPOSED: 77.20 km, P52.02B (US $1,182.3 M)
* TRB Implemented Projects
Name of Project Km P’B $’M
Manila Bay Integrated Flood Control, CoastalDefense and Expressway Project
50.00 338.8 7,700.0
R7 Expressway 16.10 7.77 176.6
North Luzon Expressway East (NLEE) Phase I and II 92.10 15.77 358.4
Pasig Marikina Expressway 15.70 34.65 787.5
East-West Connection Expressway 26.60 7.93 180.2
High Standard Highway (HSH) Network in Metro Manila and its 200km Sphere:
Name of Project Km P’B $’M Start CompletionMuntinlupa-Cavite Expressway(Daang Hari-SLEx Link)
4.00 2.01 45.7 2012 2015
STAR, Lipa – Batangas , Phase II 19.74 2.32 52.7 2013 2015NLEX Harbor Link, Segment 9* 2.42 1.15 26.1 2013 2015Plaridel By-Pass Road, Phase I 17.05 3.72 84.5 2009 2012
COMPLETED : 43.21 km, P9.20B (US $ 209.09 M)
US $ 1 - P 44
Name of Project Km P’B $’M
NLEX Harbor Link, Segment 8.2* 7.50 6.50 147.7C6-P I, Southeast Metro Manila Exp.* 34.00 31.32 711.8CLLEx - P II (Cabanatuan-San Jose) 35.70 14.20 322.7
PIPELINE: 200.5 km, P404.92B (US $9,202.7 M)

19
Name of Project Est. Cost
Pasig-Marikina River Improvement and Dam Construction
198.435 B
Meycauayan River Improvement 14.040 B
Malabon-Tullahan River Improvement 21.635 B
South Parañaque-Las Piñas River Improvement 17.335 B
East Mangahan Floodway (Cainta & Taytay River Improvement)
25.901 B
West Laguna Lakeshore Land Raising 25.185 B
Land Raising for Small Cities around Laguna Lakeshore
7.158 B
Improvement of the Inflow Rivers to Laguna Lake
0.637 B
Manila Core Area Drainage Improvement 27.257 B
West Mangahan Area Drainage Improvement 5.522 B
Valenzuela-Obando-Meycauayan (VOM) Improvement
8.613 B
Total: P 351.718 B($ 7.994 B)
Based on river basins:Pasig-Marikina River Basin and Laguna Lake Basin.
Total area: 4,354 km2
Total Population: 17.1 M
Boundary of Study Area and the River Basins
Master Plan for Flood Management in Metro Manila and Surrounding Areas:
TAGUIG
BICUTAN
SUCAT
MUNTINLUPA
SAN PEDRO
BINAN-STA. ROSA
CABUYAO I
CABUYAO II
CALAMBA
LOS BANOS
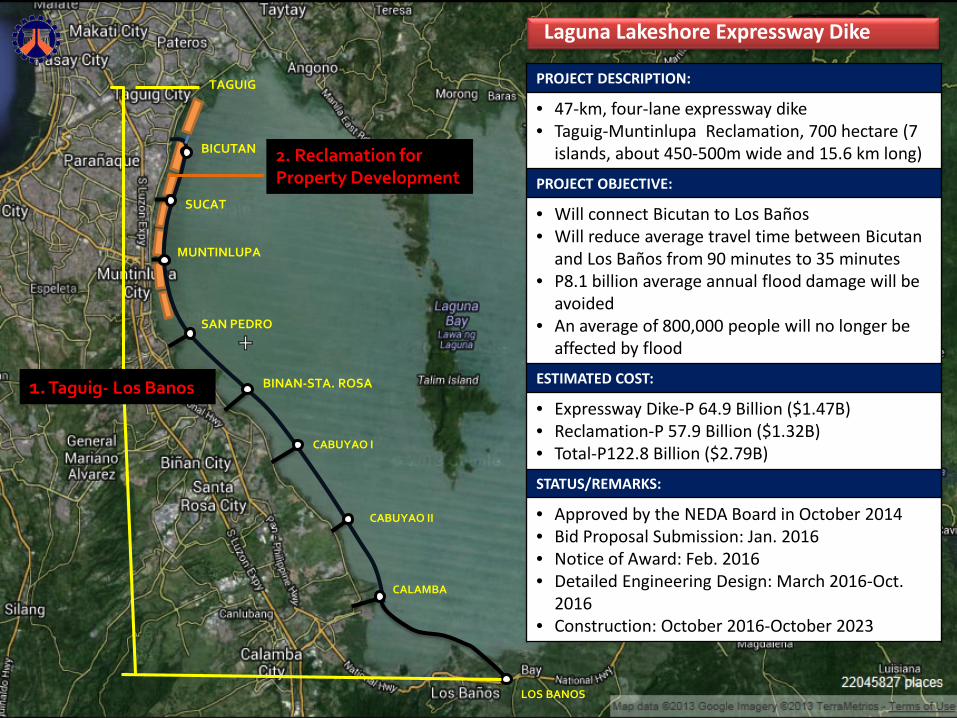
1. Taguig- Los Banos
2. Reclamation for Property Development
Laguna Lakeshore Expressway Dike
PROJECT DESCRIPTION:
• 47-km, four-lane expressway dike• Taguig-Muntinlupa Reclamation, 700 hectare (7
islands, about 450-500m wide and 15.6 km long)
PROJECT OBJECTIVE:
• Will connect Bicutan to Los Baños• Will reduce average travel time between Bicutan
and Los Baños from 90 minutes to 35 minutes• P8.1 billion average annual flood damage will be
avoided• An average of 800,000 people will no longer be
affected by floodESTIMATED COST:
• Expressway Dike-P 64.9 Billion ($1.47B) • Reclamation-P 57.9 Billion ($1.32B)• Total-P122.8 Billion ($2.79B)
STATUS/REMARKS:
• Approved by the NEDA Board in October 2014• Bid Proposal Submission: Jan. 2016• Notice of Award: Feb. 2016• Detailed Engineering Design: March 2016-Oct.
2016• Construction: October 2016-October 2023

TAGUIG
BICUTAN
SUCAT
MUNTINLUPA
SAN PEDRO
BINAN-STA. ROSA
CABUYAO I
CABUYAO II
CALAMBA
LOS BANOS
1. Taguig- Los Banos
2. Reclamation for Property Development
2. Reclamation: 700 hectares
1. Expressway-Dike: 47 kms
Laguna Lakeshore Expressway Dike
22
Institutionalize Good Governance and Anti-Corruption Reforms• Right project , right cost , right quality, right on time and right people
Infrastructure Investment for GOP to grow from 1.8% of GDP in 2011 to 5.0% of GDP in 2016.
DPWH will continue investments in:
1. Upgrading Quality and Safety of Roads and Bridges with stronger private sector participation
• Long Term Road Maintenance Contracts• Design and Build Bridge Program
2. Better access to Tourism Destinations, Airports, Seaports, RORO Ports and Food Production Areas
3. Flood Risk Reduction Program• Flood management convergence program with other stakeholders
4. Mindanao Logistics Network Program
5. Disaster Risk Reduction and Resiliency Program
Moving Forward:Continuing investments in infrastructure for more jobs and sustained growth.

The Republic of the PhilippinesDEPARTMENT OF PUBLIC WORKS AND HIGHWAYS
THANK YOU !!!
5