Embed Size (px)
Citation preview

THE WORLD BANK
Discussion Paper
EDUCATION AND TRAINING SERIES
Report No. EDT92
Planning and Mobilization ofFinancial Resources for
Education in theMiddle East
Wadi D. HaddadTerri Demsky
June 1987
Education and Training Department Operations Policy Staff
V.
The views presented here are those of the author(s), and they should riot be interpreted as reflecting those of the World Bank.
Pub
lic D
iscl
osur
e A
utho
rized
Pub
lic D
iscl
osur
e A
utho
rized
Pub
lic D
iscl
osur
e A
utho
rized
Pub
lic D
iscl
osur
e A
utho
rized
Pub
lic D
iscl
osur
e A
utho
rized
Pub
lic D
iscl
osur
e A
utho
rized
Pub
lic D
iscl
osur
e A
utho
rized
Pub
lic D
iscl
osur
e A
utho
rized


Discussion Paper
Education and Training Series
Report No. EDT92
PLANNING AND MOBILIZATION OF FINANCIALRESOURCES FOR EDUCATION IN THE MIDDLE EAST
Wadi D. Haddadand
Terri Demsky
Education Policy DivisionEducation and Training Department
June 1987
The World Bank does not accept responsibility for the views expressed herein,which are those of the author(s) and should not be attributed to the World Bankor its affiliated organizations. The findings, interpretations, and conclusionsare the results of research or analysis supported by the Bank; they do notnecessarily represent official policy of the Bank.
Copyright4D 1987 The International Bank for Reconstruction and Development/The World Bank

I

ABSTRACT
A prominent concern of most governments today is how to provide qualityeducation to increasing numbers of people, when financial resources areshrinking. In the Middle East, present educational needs have not beensatisfied, and these needs will increase as the population grows at threepercent per annum. Present levels of spending on education are alreadystraining government budgets, and government revenues in these countries havereached a plateau due to the drop in the price of oil. Given that prospectsfor additional budgetary resources for education are dim, governments in theregion have been exploring alternative means of meeting their educationalobjectives. This paper examines three possible courses of action:
(a) improving the means of allocation, control and monitoring of financialresources for all education, thereby making it more efficient;
(b) reducing unit costs by improving the efficiency of the education system;and
(c) finding extra-budgetary resources, knoln as resource mobilization.

I

FOREWORD-
In November 1986, high--level officials from the ministries of planning,education and finance in eight Arab countries met in Amman, Jordan toparticipate in a joint World Bank/United Nations Development Programme,seminar on the planning and mobilization oE financial resources for education.Four discussion papers were prepared for the seminar which focused on: (i)macroeconomic trends in the Arab world; (iL) allocation, control andmonitoring of financial resources for education; (iii) cost control andefficiency measures in the education secto:;; and (iv) resource mobilizationfor education. The present paper summarizes the main issues raised in thediscussion papers and draws out the most pertinent issues relating toeducation finance in the Middle East.
Middle Eastern countries have not been able in recent years to continueto increase budgetary allocations to cope with the growing demand foreducation. While the annual growth in school age population has increasedslightly over the past ten years (from 2.9 percent in 1970-1975 to threepercent in 1975-1980), the growth in education expenditure has decreased from11.5 percent to 9.4 percent per annum, respectively. This declinecorresponded to a similar decrease in the growth of national income (from 7.1percent to 6.7 percent over the same periods). Constraints which have led tostagnation in public spending on education are not expected to diminish in theforeseeable future. In fact, the growth in the level of resources flowing toeducation is expected to decline due to tight budgetary conditions and tocompetition with other sociall sectors that are gaining prominence such ashealth and nutrition.
In this paper, two possible courses oif action to resolve the abovedilemma are examined. The first calls for mobilizing additional resources foreducation through cost-recovery mechanisms,, and by tapping non-public sourcesof finance. The second involves improving the use of existing resources,optimizing the allocation of funds within the sector, and reducing unit costswherever feasible. To improve efficiency requires, first, an improvement inthe strategic planning, budgeting and monitoring of funds in the ministries offinance, planning and education; and second, a reexamination of thedistribution of funds within the education budget. The reallocation questionis particularly relevant as higher levels of education are often favored inthe allocation of public resources, and because most of the budget goes toteachers' salaries.
The seminar in Jordan provided partic:pants with the opportunity toexchange views and experiences regarding the scope of education financeissues, and to develop strategies to cope with increasing budgetaryconstraints. This paper, encapsulating the main ideas raised during theseminar, attempts to disseminate these ideas to a wider audience in thedeveloping world.
William D. CooperChief
Education and Manpower Development DivisionEurope, Middle East and North Africa Region


TABLE OF CONTENTS
Paste
I. INTRODUCTION 1-2
A. Nature of the Problem 1-2B. Strategies and Options 2
II. ALLOCATION, CONTROL AND MONITORING OF 3-14FINANCIAL RESOURCES FOR EDUCATION
A. Background 3-4B. Allocation of Resources at the Macro-Level 4-7
(1) The Budgeting Process 4-5(2) Allocation to Education 6-7
C. Allocation of Resources Within the Education Sector 7-11(1) Major Issues 7-9(2) Allocations Within Education 9-11
D. Can Budget Development be Improved? 11-13E. Management of Resources 13F. Monitoring and Evaluation 13-14
III. COST CONTROL AND EFFICIENCY MEASURES IN THE 15-24EDUCATION SECTOR
A. Nature and Scope of the Issues 15-19B. Strategies to Improve Efficiency 19-24
(1) Flow of Students 19-20(2) Utilization of Human Resources 20-22(3) Utilization of Physical Facilities 22-23(4) Combining Efficiency Measures and 23-24
Learning Quality
IV. RESOURCE MOBILIZATION FOR EDUCATION 25-33
A. Payroll Taxes 25B. Ear-Marked Taxes 25-26C. User Fees and Student Loans 26-28D. Income-Generating Schemes 28-29E. Community-Financing Schemes 29-30F. Participation of Industry 31-32G. Private Education 32-33
V. SELECTED REFERENCES 34

II
I
I. INTRODUCTION
A. NATURE OF THE PROBLEM
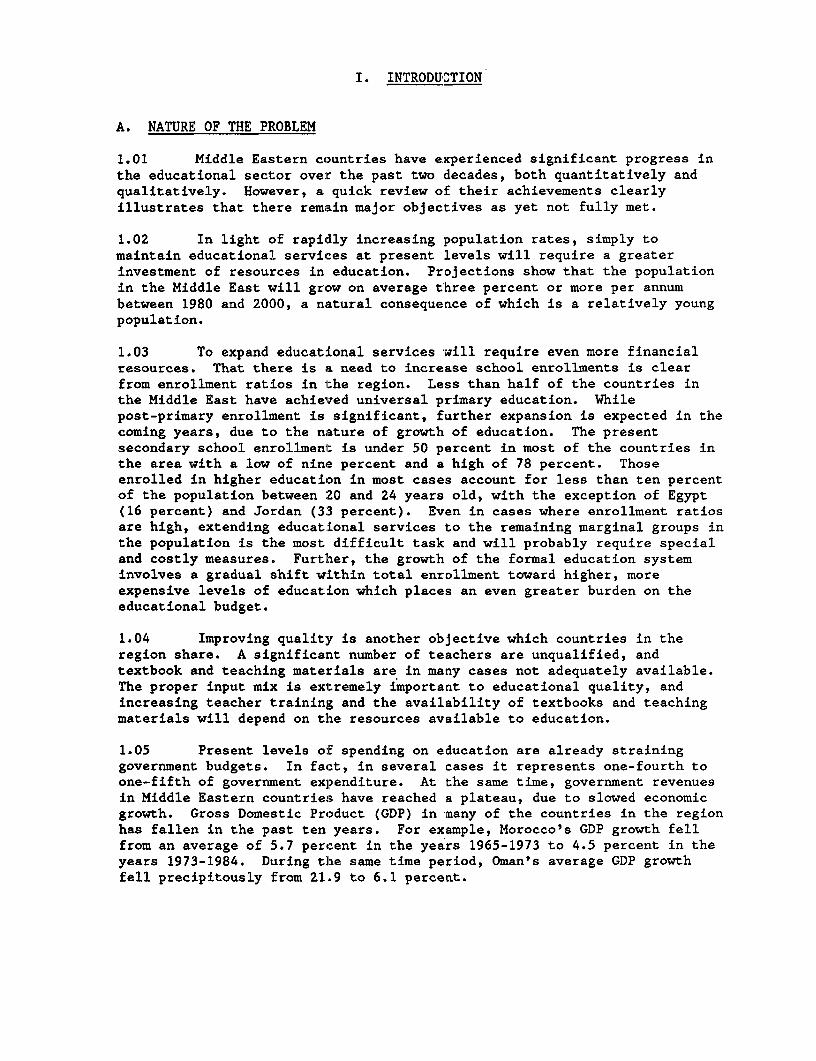
1.01 Middle Eastern countries have experienced significant progress inthe educational sector over the past two decades, both quantitatively andqualitatively. However, a quick review of their achievements clearlyillustrates that there remain major objectives as yet not fully met.
1.02 In light of rapidly increasing population rates, simply tomaintain educational services at present levels will require a greaterinvestment of resources in education. Projections show that the populationin the Middle East will grow on average three percent or more per annumbetween 1980 and 2000, a natural consequence of which is a relatively youngpopulation.
1.03 To expand educational services will require even more financialresources. That there is a need to increase school enrollments is clearfrom enrollment ratios in the region. Less than half of the countries inthe Middle East have achieved universal primary education. Whilepost-primary enrollment is significant, further expansion is expected in thecoming years, due to the nature of growth of education. The presentsecondary school enrollment is under 50 percent in most of the countries inthe area with a low of nine percent and a high of 78 percent. Thoseenrolled in higher education in most cases account for less than ten percentof the population between 20 and 24 years old, with the exception of Egypt(16 percent) and Jordan (33 percent). Even in cases where enrollment ratiosare high, extending educational services to the remaining marginal groups inthe population is the most difficult task and will probably require specialand costly measures. Further, the growth of the formal education systeminvolves a gradual shift within total enrollment toward higher, moreexpensive levels of education which places an even greater burden on theeducational budget.
1.04 Improving quality is another objective which countries in theregion share. A significant number of teachers are unqualified, andtextbook and teaching materials are in many cases not adequately available.The proper input mix is extremely important to educational quality, andincreasing teacher training and the availability of textbooks and teachingmaterials will depend on the resources available to education.
1.05 Present levels of spending on education are already straininggovernment budgets. In fact, in several cases it represents one-fourth toone-fifth of government expenditure. At the same time, government revenuesin Middle Eastern countries have reached a plateau, due to slowed economicgrowth. Gross Domestic Product (GDP) in nany of the countries in the regionhas fallen in the past ten years. For example, Morocco's GDP growth fellfrom an average of 5.7 percent in the years 1965-1973 to 4.5 percent in theyears 1973-1984. During the same time period, Oman's average GDP growthfell precipitously from 21.9 to 6.1 percent.
- 2 -
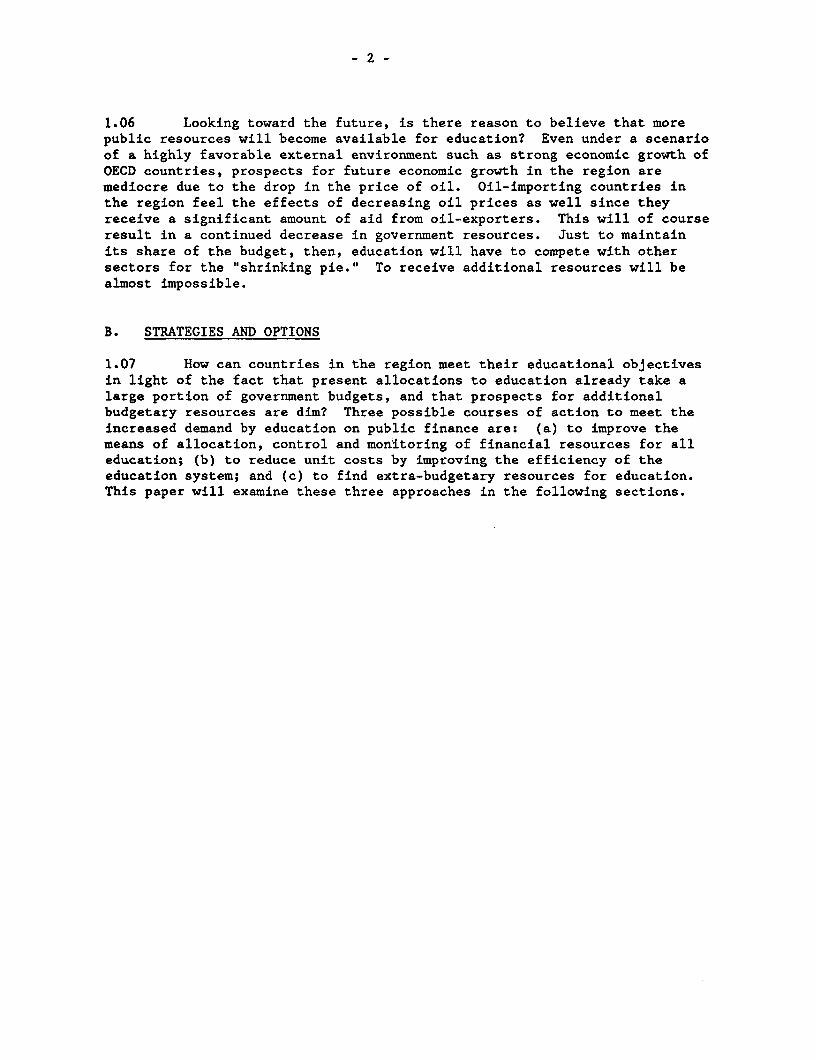
1.06 Looking toward the future, is there reason to believe that morepublic resources will become available for education? Even under a scenarioof a highly favorable external environment such as strong economic growth ofOECD countries, prospects for future economic growth in the region aremediocre due to the drop in the price of oil. Oil-importing countries inthe region feel the effects of decreasing oil prices as well since theyreceive a significant amount of aid from oil-exporters. This will of courseresult in a continued decrease in government resources. Just to maintainits share of the budget, then, education will have to compete with othersectors for the "shrinking pie." To receive additional resources will bealmost impossible.
B. STRATEGIES AND OPTIONS
1.07 How can countries in the region meet their educational objectivesin light of the fact that present allocations to education already take alarge portion of government budgets, and that prospects for additionalbudgetary resources are dim? Three possible courses of action to meet theincreased demand by education on public finance are: (a) to improve themeans of allocation, control and monitoring of financial resources for alleducation; (b) to reduce unit costs by improving the efficiency of theeducation system; and (c) to find extra-budgetary resources for education.This paper will examine these three approaches in the following sections.
-3-
II. ALLOCATION, CONTROL AND MONITORING OF FINANCIALRESOURCES FOR EDUCATION
A. BACKGROUND
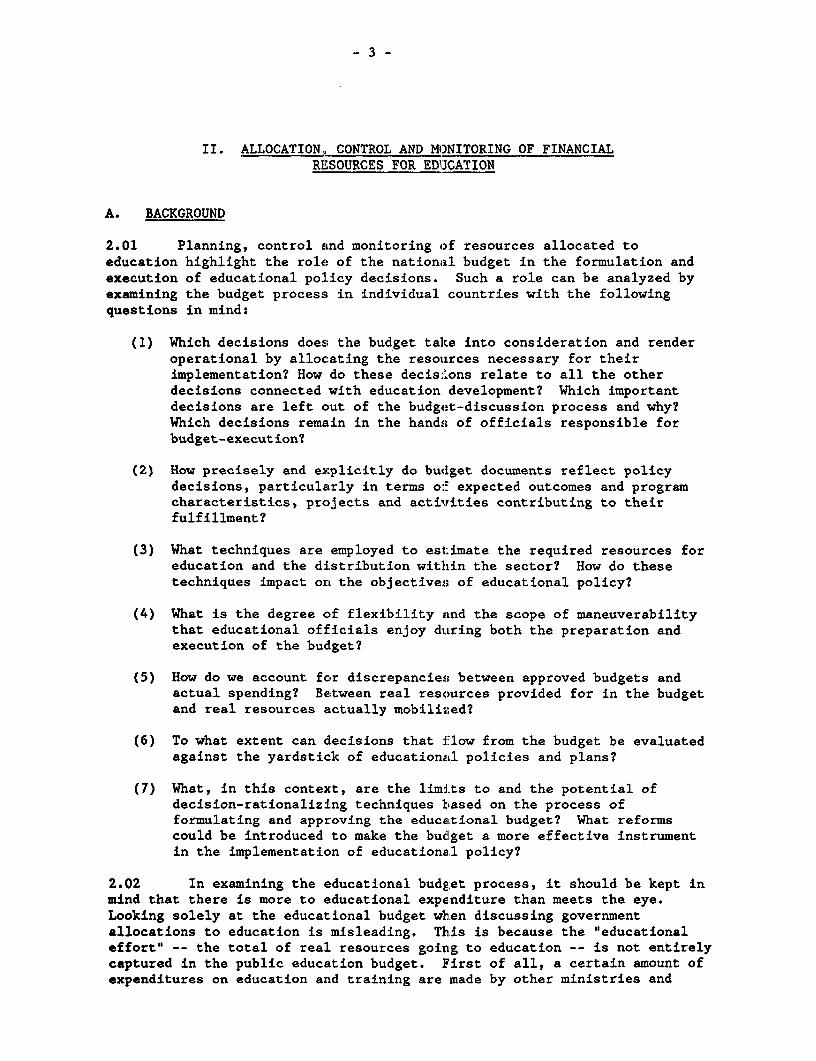
2.01 Planning, control and monitoring of resources allocated toeducation highlight the role of the national budget in the formulation andexecution of educational policy decisions. Such a role can be analyzed byexamining the budget process; in individual countries with the followingquestions in mind:
(1) Which decisions does the budget talce into consideration and renderoperational by allocating the resources necessary for theirimplementation? How do these decis:Lons relate to all the otherdecisions connected with education development? Which importantdecisions are left out of the budget-discussion process and why?Which decisions remain in the hands of officials responsible forbudget-execution?
(2) How precisely and explicitly do bu<lget documents reflect policydecisions, particularly in terms oi- expected outcomes and programcharacteristics, projects and activrities contributing to theirfulfillment?
(3) What techniques are employed to estimate the required resources foreducation and the distribution within the sector? How do thesetechniques impact on the objectives of educational policy?
(4) What is the degree of flexibility and the scope of maneuverabilitythat educational officials enjoy during both the preparation andexecution of the budget?
(5) How do we account for discrepancies between approved budgets andactual spending? Between real resources provided for in the budgetand real resources actually mobilized?
(6) To what extent can decisions that flow from the budget be evaluatedagainst the yardstick of educational policies and plans?
(7) What, in this context, are the limits to and the potential ofdecision-rationalizing techniques based on the process offormulating and approving the educational budget? What reformscould be introduced to make the bu.get a more effective instrumentin the implementation of educational policy?
2.02 In examining the educational budget process, it should be kept inmind that there is more to educational expenditure than meets the eye.Looking solely at the educational budget when discussing governmentallocations to education is misleading. This is because the "educationaleffort" -- the total of real resources going to education -- is not entirelycaptured in the public education budget. First of all, a certain amount ofexpenditures on education and training are made by other ministries and
-4-
included in their budgets, not in the education budget. Second,non-budgetary resources such as community-financing of education or theincome generated from vocational schools which produce saleable items, andeven private education are not taken into account in the budget process.These non-budgetary resources add to the amount of resources utilized foreducation, yet since they are not included in the budget process, it isdifficult to ensure their efficient allocation and usage.
2.03 The area of resource allocation and monitoring is very broad anddiverse. This paper will only attempt to provide an overview and raise somebasic issues as a framework for discussion and examination of countryexperiences in budgeting, control and monitoring educational expenditures.
B. ALLOCATION OF RESOURCES AT THE MACRO-LEVEL
(1) The Budgeting Process
2.04 Allocation of resources to education within the national budget isinfluenced by three major issues. (A) The first issue is the place thateducation has among the country's national priorities. Certainly Arabcountries continue to place a high value on education, but not as much asthey did in the 1970s. Therefore, the education sector is forced to competemore aggressively with other sectors for increasingly limited resources.(B) The second issue has to do with the relative strength of the Ministry ofEducation vis-a-vis other ministries. Nominally the various governmentministries have equal status but in practice this is not the case. To quoteJ.R. Hough, these "expenditure departments (ministries) will be unequal intheir relative bargaining positions vis-a-vis the MOF... in sociologicalterms, the formal will be overridden by the informal: Individual ministerswill have relative strengths and seniorities within the government, relativepositions of closeness to the prime minister or President or Head of Stateand will have widely differing personalities and bargaining powers, all ofwhich will have non-negligible effects on the outcomes." (C) The thirdissue involves the relationship between central and local authorities whichis significant in a number of countries. The issue here is whetherallocations for education are made nationally or by region or province.Clearly, national funding gives the central government a significant degreeof power not only over the formulation but also over the execution ofeducational policies. Decentralized allocations, on the other hand, aremeant to retain some freedom of decisionmaking and scope for initiative atthe local level, sufficiently close to the people that they can reasonablyidentify with.
2.05 These issues interact during the three stages of the budgetingprocess, namely, preparation, review and approval. For the preparation ofthe education budget, in most cases the Ministry of Planning (MOP) providessome basic guidelines to the planning department of the Ministry ofEducation (MOE). These basic guidelines may include the implications of thenational plan for development and also formulas for expenditure. Through aniterative process, the MOE develops a budget which it then presents forreview by the Ministry of Finance (MOF) and the MOP. It is here where thehard bargaining begins. Obviously, the MOF is primarily interested in thebottom line -- what the total expenditure will be. Therefore, the variousgovernment ministries, including education, must lobby the MOF for resourcesand in turn, the MOF attempts to extract budget cuts from the ministries.
These negotiations take place both at the staff level and at the ministeriallevel. It is most important to note that in general, there is no officialprocedure for preparing and reviewing a bucdget, but rather it is apolitical/bureaucratic process. The final approval of the budget is giveneither by the cabinet or the parliament depending on the political structureof the country. This budgetary process applies more to the development ofthe recurrent budget than to the capital budget. The latter is more projectoriented and not as sensitive to the iterative process of negotiations asthe recurrent budget.
2.06 The preceding consultative process, whether formal or informal,usually deals with three types of decisions: extra-budgetary, budgetary andinfra-budgetary. Extra-budgetary decisions are generally excluded from thenormal negotiating process. On the expenditure side of the budget, anexample of an extra-budgetary decision would be the money ear-marked for therepayment of loans received from multilateral or bilateral agencies foreducational purposes. On the revenue side, the raising of special taxes orduties whose revenues are ear-marked for eclucation (for example, payrolltaxes to finance vocational and technical training) are outside of thenormal budget process. The way such resources are used may be subject tobudgetary discussion, but not the amounts themselves, since they would bedifficult to estimate. In the same way, students who are required tocontribute their time as teachers at the end of their studies entail theallocation of real resources to education by a mechanism outside thetraditional budgetary negotiating process.
2.07 Budgetary decisions include all t:hose decisions regarding how muchto allocate to each item in the budget and so are very much part of thenegotiating process. These items are easily identifiable and theallocations to each are clearly stated.
2.08 On the other hand, infra-budgetary decisions concern the latitudegiven to officials in how the money is spent for each budget item. Forexample, in some cases this latitude may concern the nature of theactivities performed, their timetable, their geographical location (as whenan amount ear-marked for building schools carries with it no stipulation asto allocation by region or province), the quantity and description of realresources to be mobilized (numbers and qua:Lifications of new teachers to berecruited), etc. So officials in charge of budgetary execution may enjoysome freedom of reallocatiorL according to the level and nature ofexpenditure. For instance, the budget in Lebanon is detailed by line andparagraph. Any redistribution between paragraphs within a line item may bedecided by the minister, while a reallocat:Lon from one line item to anotherrequires a cabinet decision.
2.09 In the end, a budget is worked otlt which spells out allocationsfor education. The budget does not always reflect the desires of theMinistry of Education or the Ministry of PLanning, particularly if the MOEor MOP has been slow in getting their proposed budget to the MOF. It isusually a compromise between educational requests and national financialconstraints.
-6-
(2) Allocation to Education
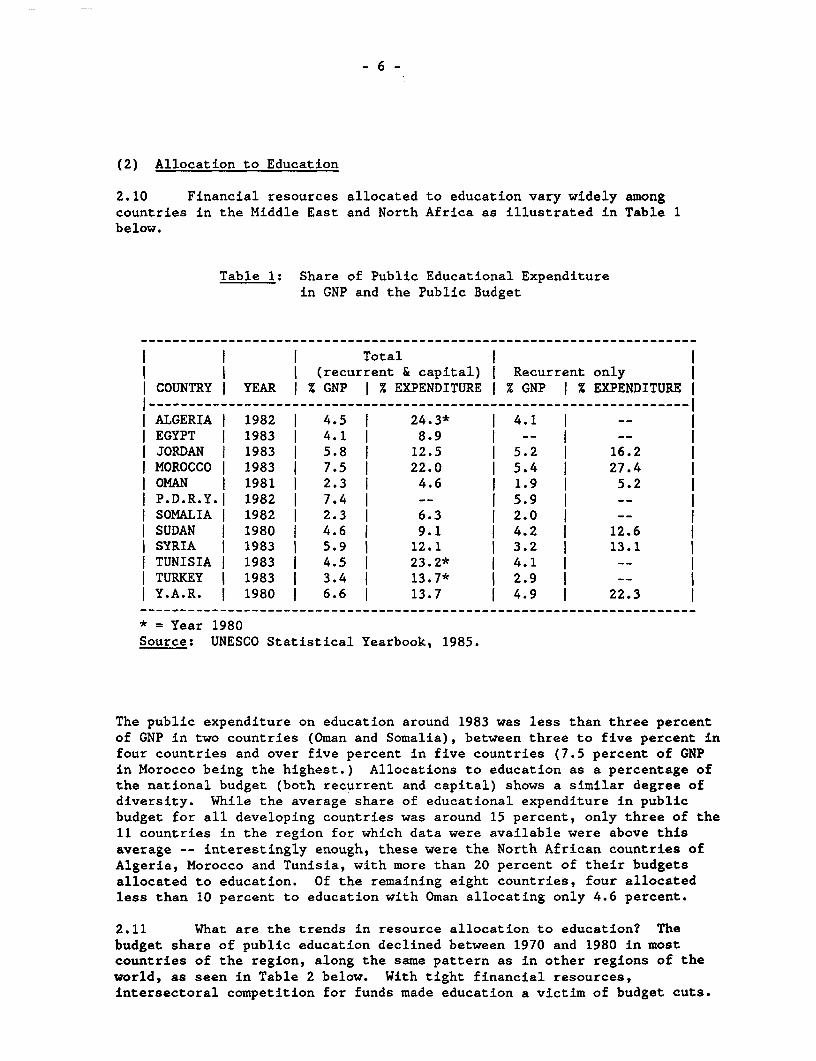
2.10 Financial resources allocated to education vary widely amongcountries in the Middle East and North Africa as illustrated in Table 1below.
Table 1: Share of Public Educational Expenditurein GNP and the Public Budget
l l I Total I Il l I (recurrent & capital) I Recurrent only| COUNTRY | YEAR % GNP I % EXPENDITURE | % GNP I % EXPENDITURE |
- - - - - - -- - --- - - -- - - - --- -- -- -- - --- - -- - --- - -- - - - - - -- -- - - -- - - - -- - - -- -- --IALGERIA | 1982 i 4.5 I 24.3* | 4.1 I __ l
IEGYPT I 1983 I 4.1 I 8.9 I __ I __ l| JORDAN | 1983 | 5.8 | 12.5 | 5.2 I 16.2 iI MOROCCO I 1983 I 7.5 j 22.0 | 5.4 I 27.4|OMAN | 1981 | 2.3 | 4.6 | 1.9 | 5.2 l
I P.D.R.Y.1 1982 1 7.4 1 -- | 5.9 1 -- lI SOMALIA | 1982 I 2.3 I 6.3 | 2.0 I __ l| SUDAN | 1980 4.6 | 9.1 | 4.2 | 12.6 l| SYRIA | 1983 | 5.9 I 12.1 | 3.2 | 13.1 lTUNISIA I 1983 I 4.5 | 23.2* I 4.1 I __ lTURKEY 119831 3.41 13.7* 12.9 I __ l
| Y.A.R. i 1980 I 6.6 | 13.7 | 49 I 22.3 l----------------------------------------------------------------------
* = Year 1980Source: UNESCO Statistical Yearbook, 1985.
The public expenditure on education around 1983 was less than three percentof GNP in two countries (Oman and Somalia), between three to five percent infour countries and over five percent in five countries (7.5 percent of GNPin Morocco being the highest.) Allocations to education as a percentage ofthe national budget (both recurrent and capital) shows a similar degree ofdiversity. While the average share of educational expenditure in publicbudget for all developing countries was around 15 percent, only three of the11 countries in the region for which data were available were above thisaverage -- interestingly enough, these were the North African countries ofAlgeria, Morocco and Tunisia, with more than 20 percent of their budgetsallocated to education. Of the remaining eight countries, four allocatedless than 10 percent to education with Oman allocating only 4.6 percent.
2.11 What are the trends in resource allocation to education? Thebudget share of public education declined between 1970 and 1980 in mostcountries of the region, along the same pattern as in other regions of theworld, as seen in Table 2 below. With tight financial resources,intersectoral competition for funds made education a victim of budget cuts.

- 7 -
Table 2: Share of Public Education Expenditurein the Public Budget, 1965-1980
COUNTRY 1 1965 1 1970 1 1975 1 1980 l
ALGERIA I 14.8 I 31.6 I __ I 24.3EGYPT I __ I 15.8 I __ | 9.4 IJORDAN 9.2 I 9.3 I 7.7 I 12.1 lLEBANON j 14.6 I 15.5 I 21.6 I __ lMOROCCO j __ j 16.8 I 14.3 I 18.5 lP.D.R.Y. | 14.1 | -- I __ l __ lSOMALIA I __ | 7.6 1 12.5 1 8.7 lSUDAN I 15.8 I 12.6 I 14.8 | 9.1 lSYRIA I 12.4 | 9.4 | 7.8 | 8.1 lTUNISIA I 13.3 I 23.2 I 16.4 I 16.4 lTURKEY I 19.0 1 13.7 - 10.5 lY.A.R. | 5.1 I __ I 10.0 I 15.1 l
I AFRICA (excluding | 16.0 I 16.4 I 15.7 I 16.4 l| N. Africa) l l l l lASIA (excluding I 14.2 j 13.1 I 12.2 j 12.7 l
I Arab states) l l l l lI Developing countries j 16.1 I 15.8 I 14.5 I 14.7 lI Developed countries | 16.0 | 15.5 14.1 | 13.7 l
Source: UNESCO Statistical Yearbooks 1974 and 1984.
C. ALLOCATION OF RESOURCES WITHIN THE EDUCATION SECTOR
(1) Major Issues
2.12 Allocating resources among subsectors within education is acomplex process that involves four major issues: narrow margin of growth,difficulties of prioritization, uncertainty of budgetary projections andlevel of allocation. Regarding the first issue, new budgetary decisionsopen to the ministry of education are wholly restricted to the real growthmargin. This is exceedingly narrow in almnost every country, which leaveslittle maneuverability in allocating resoarces to the various subsectors.The present budget is often based on the previous year's budget.Preparation of the budget always starts with an estimate of items that theministry will have to pay fEor (fixed expenditures). This takes into accountthe expenditures required to maintain the ministry's current activitiesunchanged: maintenance of school enrollmtents at their existing level,priority programs and projects, etc. Personnel costs account for most ofthe fixed expenditures. Fixed routine spending, however, is almost alwaysgreater than that budgeted for fixed expenditures. Reasons for this includethe need to pay personnel recruited during the current year throughout thewhole of the following year; internal promotion of personnel; possibleimprovements in pay scales, etc. Therefore, in budget negotiations, the
Minister of Education must take account of these possible developments whenrequesting resources. Otherwise, these additional fixed costs will cut intohis ability to make new allocations. Even so, in most developing countries,fixed costs are so great (between 70 to 90 percent) that little maneuver-ability is possible in any event.
2.13 Second, setting priorities within the sector can be next toimpossible when using the traditional approach to budgeting. Ideally, allworthwhile educational programs would be funded. However, educationalpolicy is necessarily subservient to economic policy and it is not possibleto allocate resources to all programs and activities. Therefore, it isuseful to be able to compare costs of proposed programs and activities aswell as the benefits of each. Priorities can then be set accordingly.Unfortunately, traditional methods do not permit the costing of alternativeeducational programs so that comparisons can be made. Rather, traditionalbudgets are formulated based on the previous year's budget, which allows forincremental increases in each line item. The traditional approach makes itdifficult to see whether any particular educational program is important orefficient; the only information that may be gleaned is whether or notsalaries are too high, etc.
2.14 Even if cost-benefit analysis can be carried out, there willcontinue to be problems of inertia of spending, interest groups who havevested interest in the prevailing patterns of spending, and acquired rightsof teachers, students on scholarship, etc., that are not easily given up.Consequently, allocation of resources on the basis of an a priori set ofpriorities does not provide a workable formula.
2.15 Third, budgetary projections have a significant margin ofuncertainty. This margin flows from the accumulated consequences ofreliance on inadequate information and over-simplified assumptions. Forinstance, budget estimates may refer to the following variables:
-- enrollment of pupils at all levels of the system;-- application of specific programs or projects;-- routine administration at central, regional and local echelons;-- welfare (grants, boarding accommodation, school meals);-- subsidies (if any) to decentralized public sector institutions
and/or private educational establishments.
The enrollment variable involves fixing enrollment targets, estimating thereal resources needed (teachers, textbooks, classrooms, etc.) and pricingthem. These tasks require information at all levels -- which are ofteninsufficient, unreliable and outdated. They are also based on assumptionswhich may be too simplistic, such as the use of student/teacher ratios as ameans of projecting the number of teachers and their distribution.
2.16 Finally, educational administrators at the local level have verylittle role in determining how school resources are to be allocated. Thisis because most public school systems collect and distribute revenue foreducation in a highly centralized fashion. In general tax revenues arebudgeted to the central ministry of education and these funds are thenallocated to schools and universities. In order to standardize quality, andsince the costs of monitoring, inspecting, and enforcing detailed guidelinesfor individual schools are likely to be high, the ministry of education sets

- 9 -
norms, such as for the distribution of budgetary allocations betweenteachers' salaries and other inputs. Often these norms do not match theschool's needs or the community's preferences and inefficiencies result.For example, the mix of inputs such as teachers' services and pedagogicalmaterials might be inefficient, but unalterable due to the norms set by theministry of education. Even in cases of decentralization, a distinctionneeds to be made between decentralization of budgetary decisions wherebylocal authorities can make choices, and decentralization of implementationwhereby all decisions regarding budget preparation and allocation are madeat the central level, but allocations are made by region or institution.Clearly decentralized processing not only gives a better picture of the needfor resources, but also allows for the mobilization of local resources foreducation.
(2) Allocations Within Education
2.17 Allocation of resources across levels of schooling variesconsiderably among countries of the region, as shown below.
Table 3: Public Current Expenditure on Education:Distribution by Level of Education
l I I 1ST 2ND I 3RD IOTHER NOT| COUNTRY I YEAR I LEVEL | LEVEL | LEVEL | TYPES | DISTRIBUTED
ALGERIA I 1980 I 28.5 I 25.2 I 17.3 I 19.8 j 9.3 lEGYPT | 1981 | 68.0 I --- >,I 32.0 | --- | --- l
I JORDAN I 1983 < <--- I 66.4 1 32.9 0.7 1 --- lI MOROCCO I 1983 | 36.5 I 44.7 I 18.9 I - -| SOMALIA | 1978 | 62.4 | 25.8 | --- | 2.4 | 8.9 l
I SUDAN I 1980 I 48.0 I 31.0 j 20.7 I 0.3 I --- lSYRIA 1983 40.5 22.7 | 33.3 | 0.2 3.3 l
I TUNISIA I 1982 41.2 I 38.1 I 19.2 1.5 lTURKEY I 1983 I 41.5 j 28.0 I 22.6 I 4.6 3.1 l
I L. America I 1980 I 50.9 I 25.6 I 23.5 lIDeveloped I l I I iI Countries I 1980 I 36.6 I 44.3 I 19.1 | l
Source: UNESCO Statistical Yearbook, 1985.
Most countries allocate the highest proportion of their educationresources to primary education. Expendituire on higher education is about20 percent of the education budget in mosl: countries. Only in threecountries, Egypt, Jordan, and Syria, does spending on tertiary educationapproach one-third of educational expenditure. While this distributionseems reasonable and not very different from the profile of other regions(e.g. Latin America and developed countries), the picture changes when wenote that the distribution of the budget aLcross levels is in no wayproportionate to the student population at: those levels. Public expenditureper student as percentage of GNP per capita across levels of educationclearly favors higher education, as Table 4 illustrates.

- 10 -
Table 4: Public Expenditure per Student as Percentageof GNP Per Capita Major World RegionsAround 1980
I I I I Number of II REGION |Primary ISecondary IHigher I countries I
…-- - - - - - - - - - - - - - - - - - - - - - - - - - - - - - - - - - - - - - - - - - - - - - - - - - - - - - - - - - - - - - - - I| Anglophone Africa I 18 | 50 I 920 | 16
Francophone Africa I 29 I 143 | 804 | 18 lSouth Asia I 8 I 18 I 119 I 4 l
I East Asia and Pacific I 11 I 20 I 118 I 6 l
i Latin America | 9 | 26 88 I 19 l| Middle East and l l l l
North Africa | 2 i 28 I 150 | 11 lDeveloping countries I 14 | 41 | 370 | 74 l
I Developed countries j 22 I 24 I 49 I 20 l
Source: Mingat and Tan.
Expenditure per primary student is exceptionally little and substantiallybelow the averages of any other region. Per student expenditure in highereducation is almost 14 times that at the secondary level and 75 times thatat the primary level.
2.18 Allocations to higher education cover both the direct costs (suchas teachers' salaries and equipment), and living allowances for students.In some countries, such as Algeria and Morocco, student living allowancesalone make up almost 50 percent of the entire higher education budget(Table 5 below).
Table 5: Share of Direct Payments to Studentsin the Education Budget by LevelAround 1980
COUNTRY I PRIMARY I SECONDARY I HIGHER l
ALGERIA | 0.3 | 9.4 I 46.3 l
JORDAN I ___ I ___ | 32.4 l
MOROCCO 0.7 | 3.8 51.5 l
SYRIA I ___ I 0.3 I __-TUNISIA I 1.1 I 2.6 I ___ l
| TURKEY 2.4 | 3.7 I 6.5 l
|OECD lI Countriesl 5.2 | 5.6 I 13.7 lSource:------UNESCO-----Statistical-------Yearbook,-------1984.--
Source: UNESCO Statistical Yearbook, 1984.

- 11 -
This compares to OECD countries which only allocate 13.7 percent of highereducation budgets to student subsidies. Governments have discovered that itis most difficult to alter this established pattern of allocations acrosslevels, since university students form a powerful and vociferous forceagainst any such changes.
2.19 The present financing arrangements, therefore, contribute to anallocation of resources in favor of higher education -- the high degree ofsubsidization boosts the demand for tertiary education. Meanwhile, thefinancing system is almost unable to adapt to the scarcities of publicresources for education. In most cases, routine spending (such as teachers'salaries) is inflexible. Thus, most of the reduction in funds for educationreduces expenditure on other categories of school inputs. In fact in mostcountries of the region, allocations to instructional materials isinsignificant, as detailed in Table 6 below.
Table 6: Public Current Expenditure on Education:Distribution According to Purpose
l I I I I Teacaing I Scholar-lWelfare I Not ICOUNTRY I YEAR I Admin.lTeachersl Materialsl ships IServicesl Distrib.1
ALGERIA 1 1982 14.1 69.1 | 0.7 4.2 | 10.2 1.7 |I EGYPT | 1981 < K--- I 81.0 0.6 j _ I _ 18.4 |I JORDAN 1983 10.0 63.3 I 6.3 I 6.3 | 5.4 | 8.7 |MOROCCO | 1982 <--- | 85.8 i 0.3 I 11.6 | 0.0 2.3 |
I OMAN 1980 I 16.1 60.3 I 6.4 f 8.6 I 4.4 4.2 ISOMALIA | 1983 < <--- | 82.2 15,1 ... ... | 2.8 |
l SYRIA I 1983 | ./. j 85.1 j 2,1 | 0.4 <--- < 12.4TUNISIA I 1983 < <--- I 84.9 I 4.8 I 1.2 | 0.6 I 8.4TURKEY f 1983 < (--- I 88.6 | 09 | 0.4 | 4.0 | 8.1
Source: UNESCO Statistical Yearbook, 1985.
Five countries allocate less than one percent of the education budget tothis purpose while the average allocation for developing countries is3.4 percent. These spending priorities correspond to an inefficient mix ofschool inputs, since increasing the supp.y of textbooks appears to becost-effective in raising student achievement.
D. CAN BUDGET DEVELOPMENT BE IMPROVED?
2.20 Traditionally, most countries have used a combination ofincremental budgeting and formula budgeting in drafting yearly budgets.Under this, incremental increases are permitted in each line item of theeducation budget, which is based on such basic formula as student/teacherratios, etc. The main assumption here is that the existing basis forallocating resources is appropriate and that present programs are to becontinued in their current form. The strength of this approach is itsstability and predictability; its weakness is the limited extent to whichthe Ministry of Education is encouraged to justify existing allocations orto eliminate programs that may not be prcductive. Basically, theincremental approach is output-oriented, focuses more on the past than onthe future, tends to be expansive, and ignores educational objectives.

- 12 -
2.21 The traditional approach to budgeting outlined above seemed towork as long as the country's GNP continued to increase. Yet as nationaleconomies have begun to contract less resources are available to allsectors, including education, while the school-age population has continuedto grow. This has led to the pressure to come up with a more rationalbudgeting approach which would allow one to determine the efficiencies andinefficiencies of each subsector of education, as well as to reallocateamong sectors. Two alternatives which have been proposed are programbudgeting and zero-based budgeting.
2.22 In program budgeting, the objectives of educational policy are thedriving force behind the allocation of resources to education. Programbudgeting analyzes alternative means of accomplishing those objectives, andevaluates the benefits or effectiveness of the budget choice. This approachis more macroeconomic in nature, concerned with broad policy decisions andcentralized, top-down decisionmaking.
2.23 There is an element of program budgeting in the formulation of thecapital budget. It is normally derived from programs and projects that areanalyzed, valued and priced in the national development plans. Investmentprograms derived from such plans become the basis for the capital budget.In certain countries, like Turkey, the development program is translatedinto a sliding two-year budgetary cycle: one year an actual budget and thesecond year a projected budget, which becomes an actual budget in the nextcycle and a new year is brought in with a projected budget, and so on.
2.24 On the other hand, zero-base budgeting is a microeconomic approachto budgeting which attempts to transform educational objectives into anefficient operating plan. Zero-base budgeting gives a formalized procedurefor establishing the benefits and costs of proposals and for evaluating themagainst each other so that officials can better set priorities and makechoices. Zero-base refers to the fact that yearly budget formulation beginsat base zero dollars and requires a total rejustification of every activityfrom the ground up, the implication being that programs carried out foryears will not necessarily be continued.
2.25 There are several problems associated with these rationalapproaches to budgeting. First there is a multiplicity of conflictinggoals. Second, since the relationship between budgetary inputs (and othervariables) and educational outcomes is unclear, it is difficult to know howmuch to allocate within the sector to achieve educational objectives.Third, in order to make cost comparisons of alternative programs to meet theoverall educational objectives, consistency in costing is required acrossprograms and activities and between the budget and the accounting systemswithin the sector. Rational budgeting is only as good as the data it uses.In the end, rational approaches are probably most appropriate for budgetcutting -- they produce more awareness of costs, especially long-term costs.In addition, they are abie to focus attention on total implications ofallocative decisions and provide for wider participation in the budgetdevelopment process in the case of zero-based budgeting. In fact, theseapproaches may be best used as part of a multi-year planning process ratherthan being applied annually.

- 13 -
2.26 The limitations of rational budgeting approaches have led to twocontemporary alternatives: program evaluation review and incentivebudgeting. P-?gram evaluation review calls for periodic intensive reviewsin order to provide direction for long-term resource allocation planning.Incentive budgeting is basically a decentralized budgeting system in whichsocio-psychologial incentives are made explicit and are designed to elicitcertain desired behavior, that may be rewarded from a centralized source offunds.
E. MANAGEMENT OF RESOURCES
2.27 The implementation of the budget brings up many issues, includingthose of control, flexibility and accountability. It is clear that theMinistry of Finance wields strong control over the allocation of funds.Disbursement procedures are notoriously cumbersome, time-consuming andextremely regulated. This heavy regulation of financial allocation createsa great deal of problems at the local level because it does not permitmanagers the flexibility needed during implementation, unless they haveaccess to extra-budgetary resources. No matter how much thinking andplanning go into formulating the budget, there are many surprises on thefirst day of school. For example, a school may have less students thananticipated and therefore would prefer to give up one teacher in order tohave more teaching materials. This lack of local control regardingeducational inputs can have deleterious effects on efficiency, as discussedabove.
2.28 In addition, present systems do not provide for accountability,which also creates inefficiencies. How money is allocated to schoolsdepends on certain formulas which are often exaggerated, since schools wouldrather have more money than less. This happens because there are noincentives for anyone to spend below the budget.
2.29 So, while the disbursement of funds is under strict control, it iseasy to determine whether funds have been spent according to the budget, butnot whether these funds were efficiently or effectively spent. Thisrequires monitoring of the budget, not only in terms of spending but also interms of efficiency and quality indicators.F MnTTnDTW7rt AMA V17ATTIATTnXT
2.30 The present budgeting system allows for some monitoring, but notenough to influence future budgeting. For example, it compares such itemsas planned expenditure versus actual expenditure, planned growth rate versusactual growth rate, etc., but these do not capture the quality ofimplementation. It is equally if not more important to examine how welleducational objectives were achieved. Perhaps more funds were spent on aparticular program than was budgeted for, but this greatly improved thequality of that program, or alternatively, perhaps all that was budgeted wasspent, but inefficiently so.
2.31 Monitoring of educational expenditures is important for tworeasons. First, it is essential to know which factors affect educationalspending and to what extent, in order for policymakers to manipulate thefactors under their control to change patterns of spending. Second, any
14
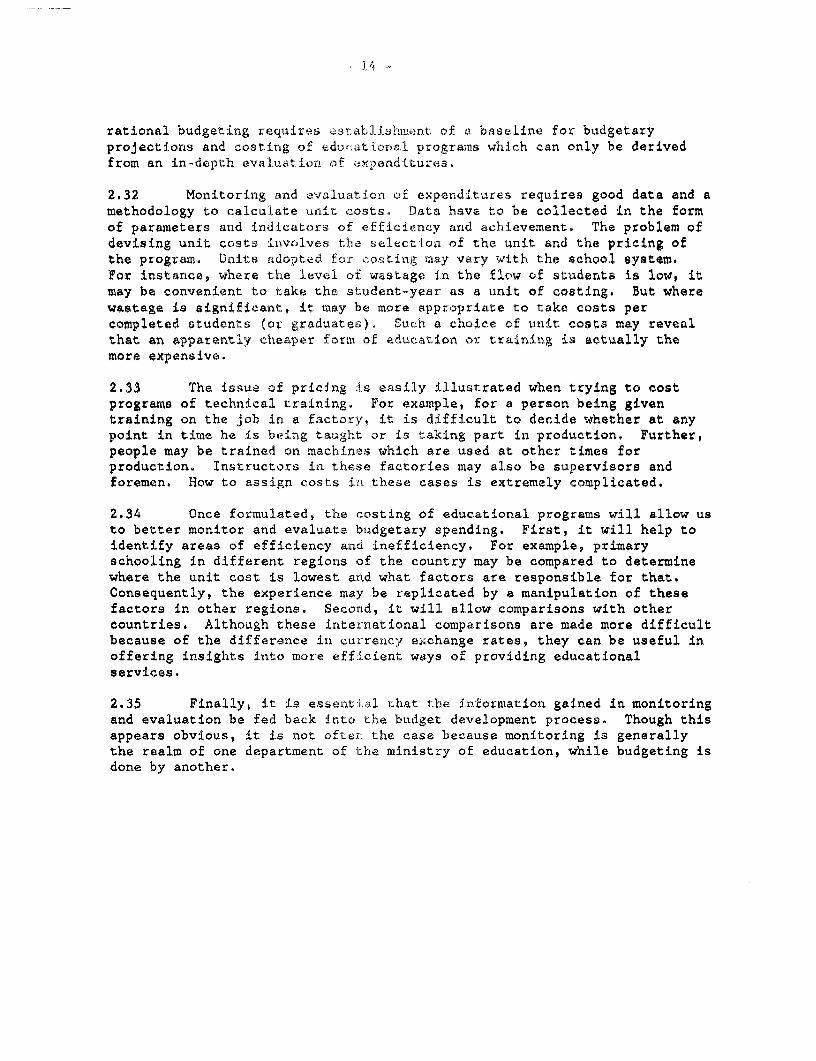
rational budgeting requires establlshment of a baseline for budgetaryprojections and costing of edu e2ationnl programns which can only be derivedfrom an in-depth evaluation of eyenditures.
2.32 Monitoring and evaluation of expenditures requires good data and amethodology to calculate unit costs. Data have to be collected in the formof parameters and indicators of efficiency and achlievement. The problem ofdevising unit costs involves the selection of the unit and the pricing ofthe program. Units adopted for costing mnay vary with the school system.For instance, where the level of wastage in the flow of students is low, itmay be convenient to take the student-year as a unit of costing. But wherewastage is significant, it may be more appropriate to take costs percompleted students (or graduates). Such a choice of unit costs may revealthat an apparently cheaper form of education or training is actually themore expensive.
2.33 The issue of pricing is easily Illustrated when trying to costprograms of technical training. For example, for a person being giventraining on the job in a factory, it is difficult to decide whether at anypoint in time he is being taught Or is taking part in production. Further,people may be trained on machines which are used at other times forproduction. Instructors in these factories may also be supervisors andforemen. How to assign costs in these cases is extremely complicated.
2.34 Once formulated, the costing of educational programs will allow usto better monitor and evaluate budgetary spending. First, it will help toidentify areas of efficiency and inefficiency. For example, primaryschooling in different regions of the country may be compared to determinewhere the unit cost is lowest and what factors are responsible for that.Consequently, the experience may be replicated by a manipulation of thesefactors in other regions. Second, it will allow comparisons with othercountries. Although these international comparisons are made more difficultbecause of the difference in currency exchange rates, they can be useful inoffering insights into more efficient ways of providing educationalservices.
2.35 Finally, it is essentlal that the information gained in monitoringand evaluation be fed back into the budget development process. Though thisappears obvious, it is not often the case because monitoring is generallythe realm of one department of the ministry of education, while budgeting isdone by another.

15
III. COST" CONTROL AND E:FICIENCY MEASURESIN THE EDUCATION SECTOR
A. NATURE AND SCOPE OF THE ISSUES
3.01 The need to reduce unit costs by improving the efficiency of theeducation system is obvious in light of t>xe fact that if education systemsare to grow at the present rate and under the same structural and managerialconditions, they will require funds that will be beyond the financialcapabilities of most countries in the regLon. Internal efficiency isconcerned with the extent to which particular educational goals are achievedwith a given input of resources; the goal is for students to flow throughthe system and graduate with a min±mum of waste. Wastage in the flow ofstudents is manifested quantitatively in -he form of repetition and dropout.
3.02 With regard to repetition, Table 7 indicates some improvementbetween 1970 and 1980. In only one rountry (Egypt) did the percentage ofrepeaters increase between 1970 and 1980. However, some countries continueto experience exceptionally high repetition rates at the primary level(e.g. Morocco and Tunisia). This is partly due to the promotion policiesfrom one grade to another but mainly to t'ne bottlenecks between the firstand second cycle. For instance, in Morocco, 50 percent of the students inthe last grade of primary education are repeaters. Such figures indicatethat the number of children admitted to primary school in Middle Easterncountries could have been :Lncreased about 10 to 15 percent with no increasein cost had repetition remained minimal.
Table 7: Percentage of Repeaters in Primary EducationAround 1970 and 1980
I COUNTRY | 1970 | 1980 | DIFFERENCE I
| ALGERIA I 12.5 I 11.7 I -0.8
I EGYPT 1 4.5 1 7.9 I +3.4 l
I JORDAN 1 6.3 1 3.2 1 -3.1 l
I MOROCCO 1 29.8 | 29.4 1 -0.4 l
I SYRIA 1 10.9 1 8.1 | -2.8 l
I TUNISIA | 29e2 | 20.6 1 -8.6 l
Source: UNESCO.

- 16 -
3.03 Waste is also the result of dropping out from school. Table 8indicates wide variation in the proportion of a cohort enrolled in firstgrade reaching Grade 4, the point at which permanent literacy na-& have beenachieved, and Grade 6 -- the completion of the primary cycle. While therewas general improvement in the survival rates, certain countries (Egypt andSudan) experienced a decline. Around 1980, except for Jordan, between15 and 40 percent of the cohorts did not reach Grade 6.
Table 8: Survival Rates in Primary Education for the CohortsBeginning Their Studies Around 1970/1971 and 1980
Percentage of the cohort reaching grade: l
…-- - - - - - - - - - - - - - - - - - - - - - - - - - - - - - - - - - - - - - - - - - - - - -COUNTRY GRADE 4 1 GRADE 6
I 1970 1 1980 I 1970 1 1980 l-----------------------------------------------------------------
I ALGERIA 1 92 1 92 i 67 | 77 l-----------------------------------------------------------------
I EGYPT | 88 1 73 1 78 1 64 l-----------------------------------------------------------------
I JORDAN 1 85 1 100 1 71 1 97 l
I MOROCCO 1 75 1 84 1 67* 1 80* l-----------------------------------------------------------------
I OMAN | 75 1 82 1 55 1 60 l
I SUDAN X 92 1 78 1 75 1 69 l-----------------------------------------------------------------
I SYRIA I 94 | 93 | 83 | 87 l-----------------------------------------------------------------
I TUNISIA I 77 1 91 1 56 | 78 l-----------------------------------------------------------------
* = Grade 5 (end of primary cycle).Source: UNESCO.
3.04 In the above sections we examined repetition and dropoutseparately. Needless to say, they are interrelated. Countries thatrestrict repetition force dropping out. Moreover, the issue of bottlenecksin the progression from one cycle to another leads to both repetition anddropout. It is clear from Table 9 that the progression rates from theprimary to the secondary level is below 50 percent in half of the Arabcountries reported. In most cases pass rates are low which leaves failureswith one of two options: repeat or drop out. Even of those who pass thereis not always space for them to go into the next cycle, so they too dropout.

- 17 -
Table 9: Progression Rates From Primary to Secondary Levels
I COUNTRY I PERCENTAGE I
I ALGERIA I 55EGYPT I 83 lOMAN I 86
I P.D.R.Y. I 46 lSOMALIA I 80
I SUDAN I 44 lI SYRIA I 68 lI TUNISIA I 30
TURKEY I 55 lY.A.R. I 85
Source: World Bank ComparativeEducation Indicators.
3.05 To assess the combined effect cf both repetition and dropout,educational wastage is indicated by input/output ratio, expressed as therelationship between the number of pupil/years invested in a completer andthe normal or prescribed duration of the cycle. Table 10 shows results ofcalculations for the two cohorts entering primary school in 1970 and 1980.Clearly there is a general fall or a leveling in the value of this indicatorover time. However, the wastage in pupil-years continues to range between19 percent for Jordan and 60 percent for Morocco and Oman.
Table 10: Input/Output Ratio in Primary EducationAround 1970 and 1980
I COUNTRY 1 1970 1 1980 j DIFFERENCE I
I ALGERIA 1 1.5 i 1.3 1 -0.2 l
I EGYPT 1 1.2 1 1.4 1 0.2 l
I JORDAN | 1.3 | 1.1 | -0.2 |
I MOROCCO I 1.8 i 1.6 i -0.2 I
I OMAN I 1.6 1 1.6 1 0.0 I
I SUDAN i 1.3 1 1.2 1 -0.1 I
I SYRIA I 1.2 1 1.2 1 0,0 I
I TUNISIA 1 2.0 1 1.5 1 -0.5 l
Source: UNESCO.

- 18 -
3.06 Inefficiencies in student flow are also accompanied by inefficientuse of teachers and student space. Student/teacher ratios (Table 11) at theprimary level range between 25 and 39 (except for Lebanon which has a lowcoverage of 19 students per teacher) which are clustered around the medianfor developing countries. At the secondary levels the student/teacherratios are lower due to the deployment patterns of teachers and their lowerworkload. The ratios vary widely between 11 in Turkey and 38 in Morocco,and fall in the middle range for developing countries. At both levels thereis room for improvement particularly in the cases of countries where thestudent/teacher ratios are comparatively low.
Table 11: Number of Students per Teacher (Student/Teacher Ratio)Around 1980-1983
| COUNTRY I PRIMARY I SECONDARY l-----------------------------------------------------------------
I ALGERIA 1 37 1 26 l
I EGYPT 1 34 1 19 l…____________---_ ------------------------------ …----------------
I JORDAN 1 32 1 21 l
I LEBANON l 19 | -- I
I MOROCCO 1 31 1 38 l-----------------------------------------------------------------
I OMAN j 25 1 15 l
I P.D.Y.R. 1 25 1 20 l-----------------------------------------------------------------
SOMALIA i 29 1 22 l-----------------------------------------------------------------
I SUDAN 1 34 1 16 l-----------------------------------------------------------------
I SYRIA | 35 1 21 l-----------------------------------------------------------------
I TUNISIA I 39 1 30 l-----------------------------------------------------------------
I TURKEY 1 31 1 11 I-----------------------------------------------------------------
I Y.A.R. | 38 1 20 l-----------------------------------------------------------------
| DEVELOPING COUNTRIES I I IRANGE I 17-77 8-48 l
| MEDIAN | 35 I 22i QUARTILE DEVIATION | 7.0 | 3.5 lSource:---World---Bank--Comparative----Education----I-dicator---.
Source: World Bank Comparative Education Indicators.

- 19 -
3.07 Likewise, there is wastage in the utilization of space whenphysical facilities are assigned to classes that are smaller than theplanned norms, or when facilities are used only part of the time duringwhich a school can be opened. Such inefficiencies are prevalent in rentedfacilities or in schools built by villagers which are not efficientlydesigned. Small classrooms cannot accommodate large classes andconsequently student/teacher ratios are small. For instance, in Jordan theaverage rented space is 15 lpercent less than the corresponding space builtby the Ministry of Education, and in Lebanon rented classrooms in the ruralareas are sometimes less than 50 percent of the norm for government schools.
B. STRATEGIES TO IMPROVE EFFICIENCY
3.08 Internal efficiency can be improved in a number of ways. Some ofthese measures do not require significant investments of capital but areachievable through administrative action. This paper considers three areasof efficiency improvement:
-- flow of students
-- utilization of human resources
-- utilization of physical facilities
(1) Flow of Stud~nts
3.09 Efficiency in the flow of students -- the input/output ratio --can be improved by reducing rates of repetition and dropout. First,promotion policies must be carefully examined so that when rates ofrepetition are unreasonably high, they,can be reduced, particularly in theearly grades, either by controlling the entry at each level, or by modifyingthe standards for promotion to reflect the abilities of the pupils. Areview of research on various promotion practices provides no evidence thatrepetition is more effective than promotion, or that repetition practicesimprove either academic standards or homogeneity of classes. Rather,repetition has a negative effect on a pupil's attitudes and his view ofhimself. Second, repeaters may be grouped in special programs withappropriate curricula, instructional materials, and methods. Third, becausethe real issue is not promotion but prevention of failure, the ultimatesolution lies in improving the school environment to reduce both repetitionand dropout. Fourth, the causes of dropout must be identified and steps forimproving the demand for education and for strengthening the holding powerof the school need to be implemented.
3.10 There are policy attempts in the region to improve student flow.For instance, Jordan, Morocco and Egypt have taken measures to restrictrepetition. In Jordan repetition is allowed no more than twice in the firstnine years of schooling and only once in secondary school, and promotion isautomatic in the first three grades unless attendance is unsatisfactory.Likewise, Morocco introduced a reform whereby class repetition is limited toa total of two repeated years during the 5-year primary cycle and tworepeated years during the 7--year secondary cycle (later modified to one yearin the upper secondary cycle.) At the tertiary level, repetition is allowedonce during the first two years and once dlring the latter two years;repetition will be further reduced through introducing the credit-hour

- 20 -
system. During a second phase Morocco will be instituting mandatory ratesof promotion, coupled with a program of remedial instruction for studentswith learning problems. Both Jordan and Morocco are developing a signifi-cant program of testing for both diagnostic and evaluation purposes to curbunnecessary repetition. In Egypt repetition is permitted in Grades 2, 4 and6. After one repetition in Grades 2 and 4 promotion is automatic. At the6th grade level, however, students who fail the Primary CertificateExamination are not permitted to repeat; they have to enroll in a privateschool for another chance.
3.11 Measures to curb dropout,have ranged between enforcing compulsoryeducation and general improvement of the quality of teaching and guidance.Jordan, for example, has taken steps requiring compulsory school attendanceup to age 16 and adherence to legal age for marriage and employment. Egypton the other hand, has introduced an experimental program to preventstudents from dropping out. The program has two facets: (a) providingspecialized training classes -- prevocational -- for students who mightotherwise drop out, and (b) contacting families of dropouts to collaboratewith them on bringing these students back into the schools.
(2) Utilization of Human Resources
3.12 Because teachers' salaries constitute 80 to 90 percent (sometimeseven higher) of recurrent educational expenditure, student/teacher ratios(SIT ratios) must be maintained as near the acceptable norms as possible.Student/teacher ratio depends on the following variables:
S/T ratio = average class size x weekly teaching loadweekly class periods
3.13 Clearly the average number of students per teacher equals theaverage class size only if the weekly class periods are equal to theteacher's weekly workload. This is often the case at the primary schoollevel. However, at the secondary and university levels weekly class periodsare more than (sometimes double) the teacher's weekly teaching load. Inthis latter case, the S/T ratio is much less than the average class size.
3.14 It can be easily seen from the above formula that in order toincrease S/T ratio three measures may be taken. First, where the averageload of a teacher is light, it can be increased without adverselyinfluencing his effectiveness. Consideration, however, should be given toconditions of employment and salary structure. Second, the weekly classperiods may be decreased as some countries have done under the double shiftsystem. Here again, consideration must be given to threshold instructionaltime, and quality of teaching. The third measure, increasing class size,remains the most important variable. For instance, a Chilean study based onactual budget data shows that an increase of 15 percent in average size ofthe class would produce a reduction of 5 percent in the annual educationbudget, contributing significantly to the cost of a major educationalreform. Within certain limits, an increase in the size of the class does notimply a deterioration in the quality of education.

- 21 -
3.15 A review by World Bank staff of pertinent literature and researchfindings challenged the notion that a decrease in class size impliesimprovement in educational quality. In fact, some studies have associatedlarger class with better performance by students. Similarly, a decrease inthe size of the class does not guarantee an improvement in the socialenvironment of learning. Despite evidence to suggest that very smallclasses (15 students or fewer) can have an important positive affect onstudent achievement, variation in the size of the class within a range of20 to 40 makes little or no difference in average achievement.
3.16 As mentioned earlier, student/teacher ratios can be improved inmost Arab countries by simply increasing class size. It should be noted,however, that in some countries class sizeh is already large, as in the caseof Egypt where the average class size at the primary level is about 60 andthe problem is that of overcrowding. Similarly in Yemen AR the class sizeat the primary level is about 50 and the government does not think thatthere is much room for further saving in that area. What is striking,though, is that in some other countries the student/teacher ratios havedropped dramatically. For instance, in the case of Jordan small schoolsbuilt in rural areas and unsatisfactory re,nted schools in the urban areashave contributed to a lowering of student/teacher ratios (Table 12).
Table 12: Student/Teacher Ratios and Average Class Size in Jordan
Students Per Teacher j Students Per Class Uniti
I I_________ ---- - --- - --i - --- -------------- I| Level I 1974/75 1983/84 I 1979/80 1983/84 |-----------------------------------------------------------------
I Primary 1 34.4 31.6 1 36.2 31.4 1-----------------------------------------------------------------
I Intermediate 1 19.9 21.2 1 30.4 29.8 1-----------------------------------------------------------------
General I ISecondary 1 22.7 20.7 I 37.8 33.0 1
Vocational I ISecondary 1 17.9 19.0 31.3 27.6 1
Source: World Bank Documents.
3.17 Similarly, student/teacher ratios in Turkey have been decliningand are below the MOE's own norms and standards. In 1984/85 student/teacherratios were 31:1, 23:1 and 12:1 at the primary, middle and secondary levelsrespectively, while the norma for both primary and middle schools was 40:1.A gradual improvement to reach the norm by the year 2000 would producesavings equivalent to nine percent of projected recurrent expenditurebetween 1987 and 2000.

- 22 -
3.18 Raising the teaching load is a highly sensitive issue and isalways resisted by teachers. Consequently, no reported attempts have beenmade to improve the student/teacher ratio by increasing the teaching loadexcept in the case of Morocco where a decision has been made to increase theminimum teaching hours of university faculty by an average of 20 percent.Likewise, no attempts have been made to decrease the weekly class hours tosave on teachers.
(3) Utilization of Physical Facilities
3.19 The creation of student space for expansion of education involveshigh capital costs. It is, therefore, important to maximize the use ofavailable facilities before adding new places to serve the same area.Physical facilities are well utilized if first, they are used most of theday, and second, they are used to the capacity they were built for.
3.20 In order to improve the efficiency of utilization of facilitiestwo measures may be taken:
- good architectural planning based on student numbers, curriculaand methods of teaching, to determine the need for differenttypes of facilities; and
-- good scheduling of classes and subjects (e.g. intensiverotation, staggered scheduling) to optimize the use ofclassrooms and facilities, such as laboratories and workshops.
3.21 Improvements in the occupancy rates of physical facilities requireschool location planning that takes into consideration population densityand desired participation rates to determine the planned school size.School location planning is widely used now in the region. In Lebanon, forinstance, the government in the early 1970s conducted a national program ofschool planning, the result of which was a map of highly efficient andconsolidated schools to be built over the next decade. Similarly, in Egypt,the United States Agency for International Development is supporting a largeconstruction project (about 400 schools) based on school location planning.In Yemen A.R. the Educational Research and Development Center will conduct alarge school mapping exercise in 1987.
3.22 In areas of high population density, double shifts can increasethe use of facilities and, possibly, improve the effective student/teacherratio without a commensurate increase in costs. The application of doubleshifts takes various forms: two sessions a day, attendance on alternatedays, and staggered and overlapping school terms to enable three groups touse facilities designed to accommodate two groups. Double shifts,generally, result in fewer hours of class time or an extension of the timespent in a particular grade. This technique can be carried to extremes, asin those countries in which the use of three shifts is widespread. It mustbe admitted that there may be a loss of efficiency in learning, althoughrecent findings in El Salvador indicate that the performance of students inrural schools with a double session was superior to that in schools with asingle session. Double shifts may also affect the child's life inside andoutside the school. Second and third shifts, moreover, tend to be viewed asinferior and less formal than the "regular" morning shifts. These and other
- 23 -
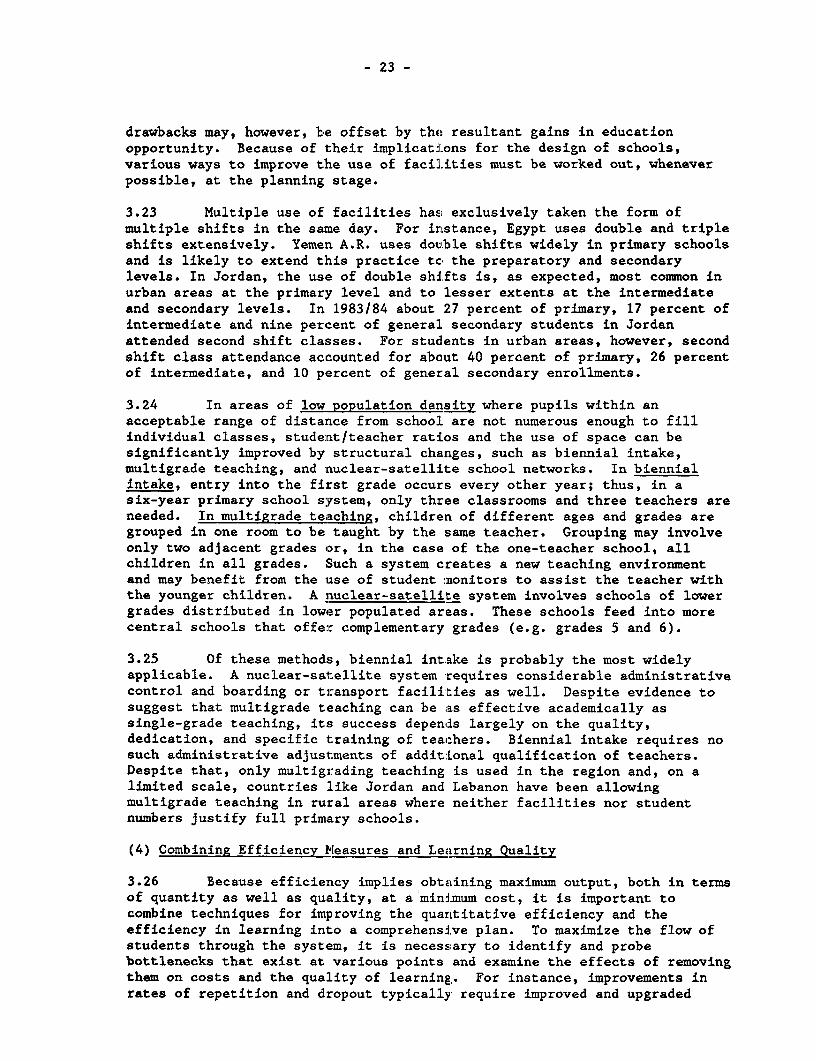
drawbacks may, however, be offset by the resultant gains in educationopportunity. Because of their implications for the design of schools,various ways to improve the use of facilities must be worked out, wheneverpossible, at the planning stage.
3.23 Multiple use of facilities has exclusively taken the form ofmultiple shifts in the same day. For irLstance, Egypt uses double and tripleshifts extensively. Yemen A.R. uses double shifts widely in primary schoolsand is likely to extend this practice tc, the preparatory and secondarylevels. In Jordan, the use of double shifts is, as expected, most common inurban areas at the primary level and to lesser extents at the intermediateand secondary levels. In 1983/84 about 27 percent of primary, 17 percent ofintermediate and nine percent of general secondary students in Jordanattended second shift classes. For students in urban areas, however, secondshift class attendance accounted for about 40 percent of primary, 26 percentof intermediate, and 10 percent of general secondary enrollments.
3.24 In areas of low population density where pupils within anacceptable range of distance from school are not numerous enough to fillindividual classes, student/teacher ratios and the use of space can besignificantly improved by structural changes, such as biennial intake,multigrade teaching, and nuclear-satellite school networks. In biennialintake, entry into the first grade occurs every other year; thus, in asix-year primary school system, only three classrooms and three teachers areneeded. In multigrade teaching, children of different ages and grades aregrouped in one room to be taught by the same teacher. Grouping may involveonly two adjacent grades or, in the case of the one-teacher school, allchildren in all grades. Such a system creates a new teaching environmentand may benefit from the use of student inonitors to assist the teacher withthe younger children. A nuclear-satellite system involves schools of lowergrades distributed in lower populated areas. These schools feed into morecentral schools that offer complementary grades (e.g. grades 5 and 6).
3.25 Of these methods, biennial intake is probably the most widelyapplicable. A nuclear-satellite system requires considerable administrativecontrol and boarding or transport facilities as well. Despite evidence tosuggest that multigrade teaching can be as effective academically assingle-grade teaching, its success depends largely on the quality,dedication, and specific training of teachers. Biennial intake requires nosuch administrative adjustments of additional qualification of teachers.Despite that, only multigrading teaching is used in the region and, on alimited scale, countries like Jordan and Lebanon have been allowingmultigrade teaching in rural areas where neither facilities nor studentnumbers justify full primary schools.
(4) Combining Efficiency Measures and Learning Quality
3.26 Because efficiency implies obtaining maximum output, both in termsof quantity as well as quality, at a minimum cost, it is important tocombine techniques for improving the quantitative efficiency and theefficiency in learning into a comprehensive plan. To maximize the flow ofstudents through the system, it is necessary to identify and probebottlenecks that exist at various points and examine the effects of removingthem on costs and the quality of learning. For instance, improvements inrates of repetition and dropout typically' require improved and upgraded

- 24 -
performance by teachers, better instructional materials, and increased andimproved physical plant and equipment. These measures, by themselves, mayincrease the unit cost per student. But the gain from a reduction in wasteshould compensate for the increase in unit cost. Techniques for improvingquantitative efficiency, therefore, will normally release enough resourcesto finance improvements in the efficiency in learning. This, in turn, maycontribute further to quantitative efficiency. Increasing resources willnot, however, automatically improve the quality of learning. The allocationof the same quantity of resources to one type or configuration of educationinputs -- curricula, teaching styles, teachers, instructional materials,mass media, preschool factors, and so on -- will not produce the same resultas allocation to another type or configuration. The search must beconducted in each particular situation for a cost-effective combination ofinputs to produce an expected educational attainment at an incremental costthat is comparable to gains from improved efficiency.
- 25 -
IV. RESOURCE MOBILIZATION FOR EDUCATION
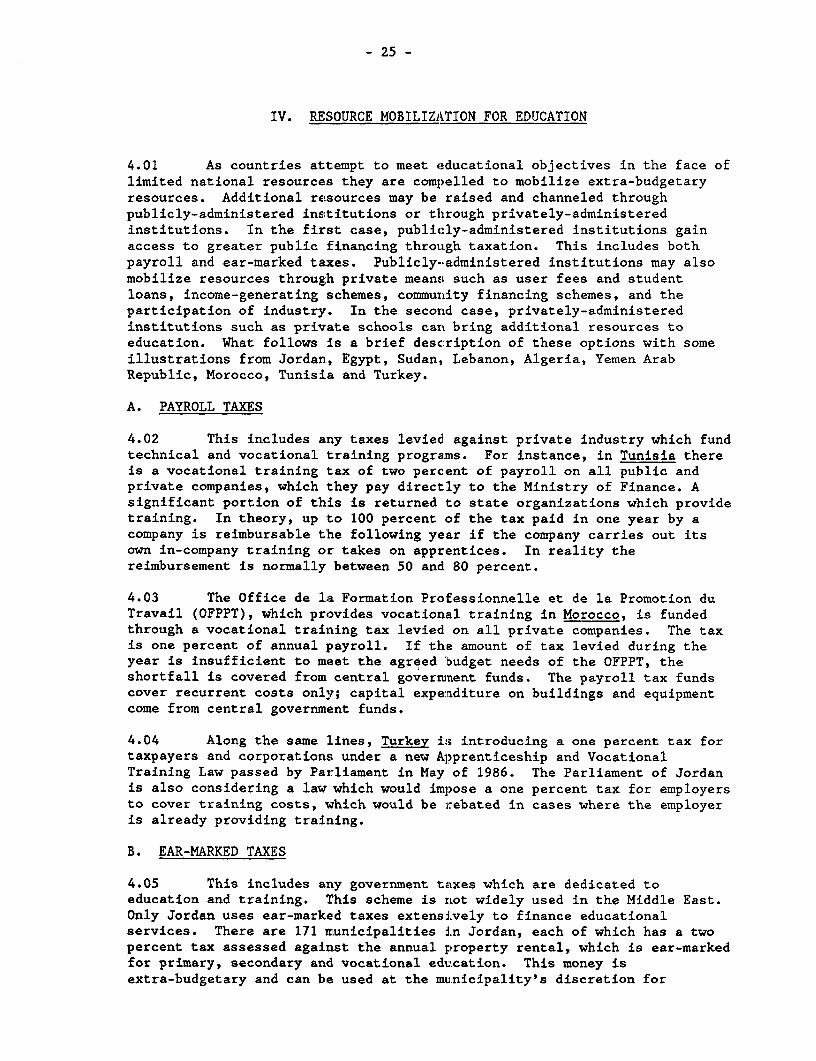
4.01 As countries attempt to meet educational objectives in the face oflimited national resources they are compelled to mobilize extra-budgetaryresources. Additional resources may be raised and channeled throughpublicly-administered institutions or through privately-administeredinstitutions. In the first case, publicly-administered institutions gainaccess to greater public financing through taxation. This includes bothpayroll and ear-marked taxes. Publicly--administered institutions may alsomobilize resources through private means such as user fees and studentloans, income-generating schemes, community financing schemes, and theparticipation of industry. In the second case, privately-administeredinstitutions such as private schools can bring additional resources toeducation. What follows is a brief description of these options with someillustrations from Jordan, Egypt, Sudan, Lebanon, Algeria, Yemen ArabRepublic, Morocco, Tunisia and Turkey.
A. PAYROLL TAXES
4.02 This includes any taxes levied against private industry which fundtechnical and vocational training programs. For instance, in Tunisia thereis a vocational training tax of two percent of payroll on all public andprivate companies, which they pay directly to the Ministry of Finance. Asignificant portion of this is returned to state organizations which providetraining. In theory, up to 100 percent of the tax paid in one year by acompany is reimbursable the following year if the company carries out itsown in-company training or takes on apprentices. In reality thereimbursement is normally between 50 and 80 percent.
4.03 The Office de la Formation Professionnelle et de la Promotion duTravail (OFPPT), which provides vocational training in Morocco, is fundedthrough a vocational training tax levied on all private companies. The taxis one percent of annual payroll. If the amount of tax levied during theyear is insufficient to meet the agreed budget needs of the OFPPT, theshortfall is covered from central goverrnment funds. The payroll tax fundscover recurrent costs only; capital expenaditure on buildings and equipmentcome from central government funds.
4.04 Along the same lines, Turkey is introducing a one percent tax fortaxpayers and corporations under a new Apprenticeship and VocationalTraining Law passed by Parliament in May of 1986. The Parliament of Jordanis also considering a law which would impose a one percent tax for employersto cover training costs, which would be rebated in cases where the employeris already providing training.
B. EAR-MARKED TAXES
4.05 This includes any government taxes which are dedicated toeducation and training. This scheme is not widely used in the Middle East.Only Jordan uses ear-marked taxes extensively to finance educationalservices. There are 171 municipalities in Jordan, each of which has a twopercent tax assessed against the annual property rental, which is ear-markedfor primary, secondary and vocational edtcation. This money isextra-budgetary and can be used at the municipality's discretion for

- 26 -
teacher salaries, construction of classrooms, maintenance of schools, etc.In 1985 about 2.9 million dinar was collected, which accounted for aboutthree percent of general education's operating budget. In addition,one-ninth of a nine percent special surcharge of customs charges isdedicated to university education. Further, over the last ten years therehas been a great number of smaller fees for activities such as notarizingdocuments, stamps for legal documents, etc., which have been instituted.A percentage of these fees goes to the universities as well. In all, thesespecial taxes provide about one-half of the operating expenses of theuniversities (capital and recurrent expenditure).
C. USER FEES AND STUDENT LOANS
4.06 User fees entail any fees paid for tuition at the primary,secondary and higher education levels, as well as room and board fees atuniversity. Almost every country in the region has instituted some type ofcost recovery scheme, but in a tentative way. Student loans allowindividuals to borrow against future earnings. This measure is usuallyintroduced to compensate for lowering or eliminating scholarships or forimposing tuition fees. Understandably, some students cannot afforduniversity education without being subsidized in some way, which underlinesthe importance of student loans. Student loans are not widely used exceptin Jordan and Turkey.
4.07 In Algeria, education is basically provided by the government,with only a small symbolic fee for textbooks charged. At the universitylevel, Algeria is rationalizing the awarding of fellowships. Until now,most university students received fellowships, but recently the provisionof fellowships has been more selective and is awarded according to socio-economic status and academic achievement.
4.08 Similarly, education in the Yemen AR is free, guaranteed by theconstitution. Still, the government has begun to call on parents to sharethe cost of specific items of expenditure. At all levels, there areincidental fees for such things as textbooks, examinations, certificates,and registration. These measures should make a small contribution to theeducation budget. For example, at the primary level, fees in 1985/86 wouldrepresent three percent of teachers salaries, with 100 percent compliance.The Government intends to raise these fees progressively to recover morefully the cost of these items, and, eventually, at the post primary level,to recover part of the actual cost of education, since the constitutionalprovision is deemed to apply to primary and preparatory levels only.
4.09 In Tunisia, parents pay for all learning materials, such astextbooks, copy books, pencils, etc. They also pay for transport sincethere is no organized school bus system. The same applies to public schoolstudents in Lebanon. However, about half of the population is alreadypaying the full cost of education in private schools.
4.10 Education in Morocco until now has been free at all levels.However, under a recent sweeping reform aimed at cost reduction, costrecovery and improved efficiency in education, Morocco has decided to imposeregistration fees in all of higher education. In addition, scholarshipallowances for university students both in Morocco and in foreign countrieshave been reduced by 50 percent in some cases. In the future, scholarships

- 27 -
will be made available only to those students who really need them, not toall university students. The reform also requires that higher rates becharged for room and board at university, and that boarding in universityfacilities be reduced.
4.11 In Turkey, tuition fees in universities are being introducedgradually, to help the population become accustomed to paying for universityeducation. Fees were first charged in the academic year 84/85, and weredoubled in academic year 1985186. Currently they cover about six percent ofthe recurrent budget. The limit to fees at university, set by edict, is20 percent of recurrent costs. The current fee structure comprises a scalefrom TL 100,000,000 to TL 40,000, depending upon the particular field ofstudy. At the same time that tuition fees were instituted in Turkey, studentloans were introduced through the Student Loan Organization (SLO). The SLOis a state-owned credit entity, empowered to make loans for a range ofsocially beneficial expenditures, such as student fees. All universitystudents are eligible for such loans. The rate charged to students isnominal, and there is therefore a very considerable subsidy in loans fromthe SLO. In technical training, the Ministry of Industry providesshort-term in-service training for employeaes in both the private and publicsectors through SEGEM (Industrial Training and Development Corporation).Until recently this training has been free, but the Ministry has now beguncharging fees to cover half the expenses of the training.
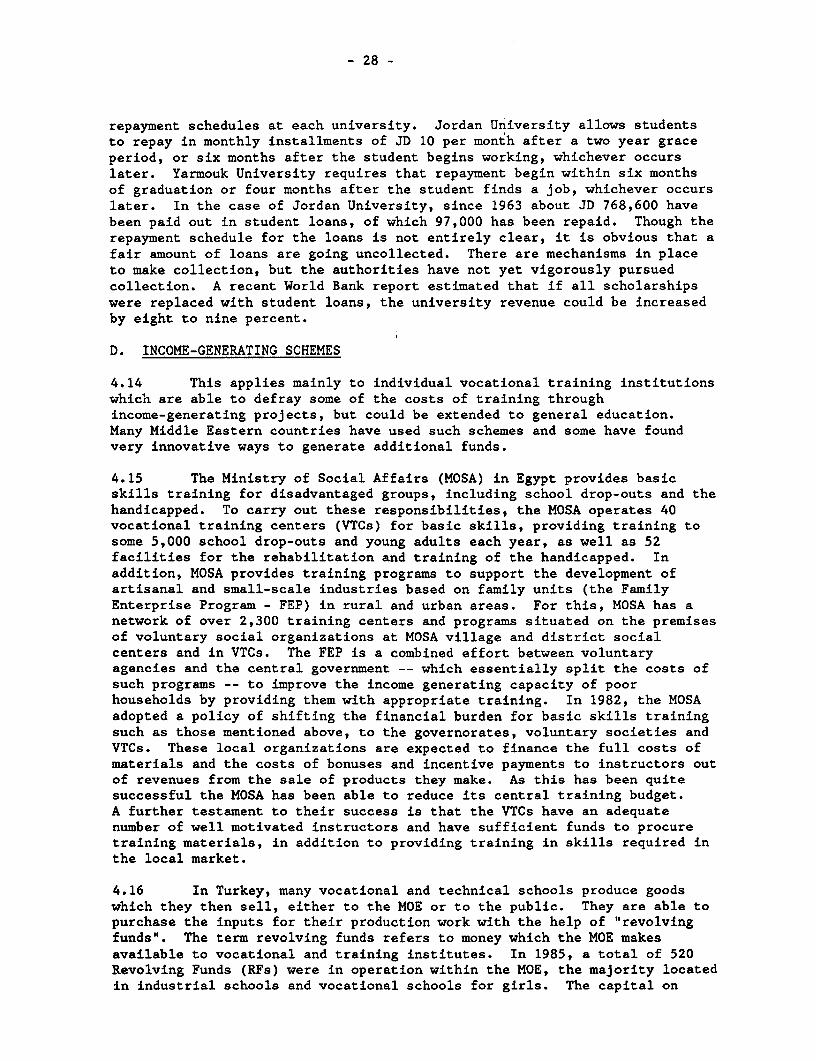
4.12 In Jordan, all levels of public education have voluntary tuitionfees (VTF). This was instituted ten years ago and began with a modest feefor primary education of about half a dinar ($1.50). Presently the ratesare as follows: Primary (grades 1 - 6), JD 3; preparatory (grades 7-9),JD 4; secondary and vocational, JD 6; community colleges, JD 15; andvocational training centers, JD 20. Students judged by the teaching staffincapable of paying are exempted, up to a maximum of 15 percent. Theeffective collection rate of VTFs is between 86 to 88 percent. Of the fundscollected, 35 percent goes to the Ministry of Education (MOE) which uses themoney for land acquisition and the buildirng of schools. The remainder ofthe funds are kept by the school as extra-budgetary resources. This comesout to about 2.6 percent of the general ecucation operating budget. At thehigher education level, both community colleges and universities chargetuition fees (per credit hour). Tuition fees cover about one-third ofcapital and recurrent expenditures of the universities. However, close toone-third of university students are on scholarships funded by variousgovernment agencies, principally the MOE and the Ministry of Defense (MOD).In fact, the MOD along with the police have contracted with Mu'ta Universityto educate candidates for military and police service at the annual rate ofJD 3,000 per student. Mu'ta will soon open its doors to civilians.
4.13 Both Jordan University and Yarmouk University offer zero interestneeds-based student loans. The Student Financial Assistance Officesadminister the loan program as well as offer work-study programs and grantsto those in particular need. Last year the Jordan University StudentFinancial Assistance Office had 90,000 dinars available for loans. At thatUniversity, student loans are limited to 70 percent of tuition fees, sostudents must finance the remaining 30 percent as well as room and boardfees. At Yarmouk University, students may borrow up to double the tuitionfees each academic year. Yarmouk also offers emergency loans which must bepaid back the semester following when the loan was made. There are liberal
- 28 -
repayment schedules at each university. Jordan University allows studentsto repay in monthly installments of JD 10 per month after a two year graceperiod, or six months after the student begins working, whichever occurslater. Yarmouk University requires that repayment begin within six monthsof graduation or four months after the student finds a job, whichever occurslater. In the case of Jordan University, since 1963 about JD 768,600 havebeen paid out in student loans, of which 97,000 has been repaid. Though therepayment schedule for the loans is not entirely clear, it is obvious that afair amount of loans are going uncollected. There are mechanisms in placeto make collection, but the authorities have not yet vigorously pursuedcollection. A recent World Bank report estimated that if all scholarshipswere replaced with student loans, the university revenue could be increasedby eight to nine percent.
D. INCOME-GENERATING SCHEMES
4.14 This applies mainly to individual vocational training institutionswhich are able to defray some of the costs of training throughincome-generating projects, but could be extended to general education.Many Middle Eastern countries have used such schemes and some have foundvery innovative ways to generate additional funds.
4.15 The Ministry of Social Affairs (MOSA) in Egypt provides basicskills training for disadvantaged groups, including school drop-outs and thehandicapped. To carry out these responsibilities, the MOSA operates 40vocational training centers (VTCs) for basic skills, providing training tosome 5,000 school drop-outs and young adults each year, as well as 52facilities for the rehabilitation and training of the handicapped. Inaddition, MOSA provides training programs to support the development ofartisanal and small-scale industries based on family units (the FamilyEnterprise Program - FEP) in rural and urban areas. For this, MOSA has anetwork of over 2,300 training centers and programs situated on the premisesof voluntary social organizations at MOSA village and district socialcenters and in VTCs. The FEP is a combined effort between voluntaryagencies and the central government -- which essentially split the costs ofsuch programs -- to improve the income generating capacity of poorhouseholds by providing them with appropriate training. In 1982, the MOSAadopted a policy of shifting the financial burden for basic skills trainingsuch as those mentioned above, to the governorates, voluntary societies andVTCs. These local organizations are expected to finance the full costs ofmaterials and the costs of bonuses and incentive payments to instructors outof revenues from the sale of products they make. As this has been quitesuccessful the MOSA has been able to reduce its central training budget.A further testament to their success is that the VTCs have an adequatenumber of well motivated instructors and have sufficient funds to procuretraining materials, in addition to providing training in skills required inthe local market.
4.16 In Turkey, many vocational and technical schools produce goodswhich they then sell, either to the MOE or to the public. They are able topurchase the inputs for their production work with the help of "revolvingfunds". The term revolving funds refers to money which the MOE makesavailable to vocational and training institutes. In 1985, a total of 520Revolving Funds (RFs) were in operation within the MOE, the majority locatedin industrial schools and vocational schools for girls. The capital on

- 29 -
these RFs is in general very small, around TL 50,000 or roughly US$100, butsome have a capital as high as TL 25 mill:Lon (roughly US$50,000). Theamount of money revolving can be as high as TL 130 million in some centers.The MOE's Directorate of RFs monitors financial status of all RFs on thebasis of monthly financial statements. Profits represent 15 to 20 percentof the sale value of products manufactured in the centers. Until recentlyprofits were returned to the Ministry of Finance, or could be reinvested inadditional equipment with the authorization of the MOF. However, a new lawappears to provide some flexibility in the way profits are being used tofinance both investment andl recurrent expenditures. This is intended toencourage more income-generating schemes. Universities in Turkey also haveaccess to revolving funds, which they use, for example, in consulting work.In addition, the university hospital, which is run and managed by theuniversity, generates a significant profil: which is reinvested in equipmentand other investments. Clearly, revolvinlg funds can only work well in anentrepreneurial environment and where the funds are handled efficiently bythe institutions.
4.17 In Jordan, the Vocational Training Corporation (VTC), a parastatalorganization, provides vocational and teclnical training. The VTC is ableto generate income by working on civil works projects, such as constructingbuildings or building furniture. The VTC bids along with other privatebusinesses and distributes the work amongst its 15 centers. Similarly,vocational training centers in Morocco undertake contract work in thevicinity of the school. In practice, thi3 has largely entailed themaintenance of municipality buildings.
4.18 In Tunisia, some vocational training centers finance up to fivepercent of recurrent costs through earnings from income-generating schemes,mainly through selling their skills. An interesting initiative wasundertaken by one vocational secondary school which not only producessaleable items but also rents out equipment to local industry.
E. COMMUNITY-FINANCING SCHEMES
4.19 This refers to any contribution made by local groups at theprimary, secondary or university level, which lessens the financial burdenof the government. Community financing may take many forms such as raisingmoney for textbooks, providing housing for teachers, or actuallyparticipating in the construction of classrooms.
4.20 Community financing in Turkey is primarily channeled throughVoluntary Associations (VAs) which exist at all levels of education, but areconcentrated at the primary and secondary level. They are made up ofparents and community members who raise funds for schools in their areas.In nonformal vocational training (NFVT), VAs raise funds which are used tofinance the training institutions. Trainees contribute up to TL 6,000 percourse to these Voluntary Associations. Even if one out of four traineesdoes not contribute, it is estimated that TL 3 billion are generated throughVoluntary Associations, or 20 percent of the MOE recurrent budget devoted tononformal education and training in 1985 (TL 15.2 billion).
- 30 -
4.21 Likewise, voluntary societies in Egypt play an important role inthe promotion of development programs, particularly the development of theFamily Enterprise Program (FEP). These autonomous societies are funded inapproximately equal parts by the Ministry of Social Affairs (MOSA) and bycharitable contributions and donations from members. The societies operateat local, regional and national levels to promote the interests ofparticular groups, such as participants in the FEP, village cooperatives,women's groups, the blind and deaf associations and other handicappedgroups. In cooperation with the relevant MOSA department at national andregional levels, the voluntary societies assist in the development ofappropriate training programs and the marketing of products from vocationaltraining centers and the FEP.
4.22 In YAR, the Local Development Councils (LDCs) -- a collection ofcommunity groups -- contribute to classroom construction. From 1978 to 1980some 2,800 primary school classrooms were built through their predecessors,Local Development Associations (LDAs). More recently, the government hasbegun to contribute some funding to the Local Development'Councils, frommoney which it collects from the Zakat tax. In addition to buildingclassrooms, these community groups help in the transport of furniture andbooks to schools, and sometimes have contributed to the payment of teachers.There is a problem, however, in the lack of cooperation between thecommunity groups and the Ministry of Education (MOE). The MOE has notalways granted teachers and books due to lack of financial resources. Atthe same time, schools built by the development organizations have notalways corresponded to the standards set by the MOE.
4.23 In Jordan, communities which would like to have a school but arenot scheduled to have one provided by the MOE can take the initiative andborrow money to build one. The Cities and Villages Development Bank (CVDB)provides such loans for school construction, as well as for other communityprojects. The community can apply to the CVDB and if it is foundcredit-worthy, the loan will be made upon MOE approval. Upon construction,the MOE will staff the school and will pay half of the interest andprincipal. The municipality or village pays the other half within 10 yearsor 15 years respectively. There were 195 loans in 1985, totalling about2.9 million dinars. In 1986, the MOE share of loan repayments wasJD 568,500, covering 584 loans made from 1972 through 1985. Most of thesecommunity-financed schools are very small, with low student/teacher ratios.However, the advantage of these schools is that they permit many girls whowould be prohibited from attending a distant school to gain an education.
4.24 In Lebanon, community-financing is enforced by the government.In the 1970s, a program of school consolidation at the primary andintermediate levels was instituted, which requires that municipalities andparents provide land before a school can be built. Each municipalityapproaches this requirement in a unique way. Parents may simply contributemoney to buy the land, or someone will donate a significant plot of land,and the parents will contribute to buy up surrounding land.
- 31 -
F. PARTICIPATION OF INDUSTRY
4.25 Industrial participation occurs mainly in vocational and technicaltraining. This category includes any payments made by employers fortraining of their personnel when provided by the state. It also includesprivate sector provision of practical experience for students of publictraining schools, and any supplies, materials, land, furniture, buildings,or expertise that the private sector provides to public institutions fortraining.
4.26 The Vocational Training Center (VTC) in Jordan, a parastatalorganization that provides vocational and technical training, shares thecost of this type of training with employers in three ways:
(1) Apprenticeship program -- The VTC offers three days of theoryper week in training centers, students then spend three daysgaining practical experience in sponsoring companies.
(2) Dedicated training -- Interested employers build centers nextto their firms to train people for their employees only, and theVTC helps to structure the training and provides the instructors.In this way, training can be pravided at no capital cost to thegovernment. There are presently 10 such centers in existence, andmore are in the works.
(3) Training upgrading -- A firm can ask that the VTC provideupgrading training for its employees, either in VTC centers or inthe firm, and the VTC charges them for the service.
4.27 In Egypt, the Productivity and Nocational Training Department(PVTD) provides vocational and industrial training and is administered bythe Ministry of Industry. As part of this, the PVTD has a long-standingpolicy of sharing the costs of training with employers. Employers havecontributed goods in kind, equipment, land, furniture and cash to VTCs. Anattempt by the PVTD to charge an annual fee of LE 100 per trainee in 1985 toemployers participating in the apprenticeship training program has not beensuccessful due to strong resistance from employers. At the secondary schoollevel, in some cases the Ministry of Education shares financing of thethree-year technical program with several private companies as well as somepublic enterprises. The Ministry of Education provides the teachers fortheoretical subjects, while the associate organization supplies the premisesand helps with practical work and equipment.
4.28 In Turkey, due to the constraints placed upon the MOE budget, thegovernment is attempting to galvanize non-governmental funds from theprivate sector for vocatiopal education an,d training. The MOE providesnonformal vocational training (NFVT) to people lacking functional andemployable skills, such as school dropouts, seasonal agricultural workers,and people in the urban informal sector. The NFVT has a well establishednetwork of training workshops in suburbs and villages and provides short andintensive courses at times convenient to the participants. Presently theMOE devotes 4 percent of its budget to financing the NFVT program. As anexample of private sector participation in the NFVT, the ApprenticeshipTraining System (ATS -- which forms part of the NFVT network) receives agreat deal of assistance from the private sector. The apprenticeship system

- 32 -
provides training in 40 trades, and is open to primary school completers whoare at least 12 years old. Apprentices spend one day per week in trainingcenters for theoretical instruction, and the rest of the week on the shopfloor. A majority of the buildings for Apprenticeship Training Centers havebeen provided by industry and the 45 new centers to be opened over the nextfour years will be built by various companies as well. Companies also oftenprovide part-time instructors. Moreover, large private corporations andsome private development finance corporations as well as some publicenterprises have established training organizations due to the need toupgrade the skills of existing employees and to train new employees. Thishas not been totally successful because training here tends to be informaland lacking in many of the elements present in formal training programs. Anew development, however, is the creation of Employers Federations whichprovide training. For example, the 450 member Turkish Metal EmployersFederation has established a TL 150 million training fund and it plans toset up eight regional training centers to meet the skilled manpower needs ofits members in such fields as metal trades, welding, electronics, electricaltrades and draftsmanship.
4.29 Pre-service skill training within the private sector in Morocco isextremely limited and confined largely to commercial specializations.However, there is some private sector involvement in apprenticeshipprograms. Under the Industry Liaison Department of the Office de laFormation Professionnelle et de la Promotion du Travail (OFPPT), anexperimental apprentice training scheme was established in Casablanca. Theapprentices work full-time in a company and attend a training center forhalf a day on a Saturday for theory and workshop practice. The apprenticesare paid a nominal amount which differs from company to company. About 800apprentices have been through the scheme.
4.30 In Sudan, the Wad Medani VTC -- under the Ministry of Labor --
runs special programs for local industry in off-peak times. Fees arecharged for these courses. The income generated is as large as the entirebudget provided by the government.
G. PRIVATE EDUCATION
4.31 This refers to the provision of education at any level by bothprofit-seeking and non-profit organizations. Private education is widelyavailable in the Middle East, but, with the exception of Lebanon, the scopeis very narrow.
4.32 In Yemen AR, a few private schools exist whose clientele has sofar been the elite (about five schools). The Government is trying toencourage the creation of private schools by providing tax incentives andthe Ministry of Education has contributed inputs such as books and teachers.Still, private education is developing slowly in YAR.
4.33 Similarly, private education in Morocco at the present is not welldeveloped, accounting for less than four percent of enrollments in primaryand secondary education. Incentives for private-sector educationinvestments are to be introduced in the form of an education investment codeand improved control and support by the Ministry of Education.
- 33 -
4.34 In Turkey, private education exists mainly at the secondary level,where it accounts for about 4 percent of enrollment. A private universitywill enroll its first students in September, 1987. The University will beself-financing in respect ofE operating costs, with investment costs beingfinanced through a university foundation.
4.35 The few private schools in Tunisia play no significant role ineducation, accounting for less than one percent of primary enrollments andabout 6 percent of secondary enrollments.
4.36 Private education is encouraged in Jordan by tax laws. Profitorganizations offering education are protected by a tax-rate bracket ceiling(35 to 38 percent) and non-profit organizations, such as religious schoolsand charitable institutions, are tax-exempt. The top tax rate otherwisewould be 55 percent. Private education exists at all levels. In GeneralEducation there are 600 private schools, of which 80 are religious andcharitable. These account for about six to seven percent of enrollment atthe primary, secondary and vocational levels. Kindergarten education isalmost entirely provided by the private sector, and has accounted for mostof the growth of private schools recently. Tuition fees run between JD 200and JD 400. Private schools must meet the core course requirements of theMOE. Because the private schools use some teachers who also work for thepublic schools, they do not have to pay fcr extensive teacher training.These schools mainly offer academic tracks, not vocational courses. InHigher Education, private community colleges have proliferated quickly overthe recent past and presently there are 31. Moreover, a private universitywill soon be established. In fact, private community colleges account fortwo-thirds of enrollment at this level. It is clear that such colleges havemoved in to meet the need when public schcools were unable to. Anaccreditation system has not yet been esteblished for private communitycolleges. In addition, provisions are currently being worked out to permita limited number of outstanding community college students to transfer to auniversity, if they desire.
4.37 Lebanon is the only country in the region where private educationis available on a large scale. Here, private education accounts for 50percent of enrollment at the primary level, and about 40 percent ofenrollment at the secondary level. Some private primary schools receivesignificant subsidies from the government. Other types of private schoolsare totally self-financed non-profit (church schools, civic society schools,etc.) and profit-seeking institutions. Due to historical and culturalreasons, the issue there is not "free" education but freedom of educationexercised by the different communities ancl guaranteed by the constitution.

- 34 -
V. SELECTED REFERENCES
Chapter II:"Allocation, Control and Monitoring of Financial Resources For Education":
Goettel, R.J. "Budget Theory in Higher Eduacation," from the InternationalEncyclopedia of Education, edited by Torsten Husen and T. NevillePostlethwaite, pp. 585-588. (Oxford: Pergamon Press, 1985).
Hough, J.R. "Educational Budgets and Their Implications," paper presentedat the IIEP international seminar on Budget, Resource Allocation andEducational Policy in Paris, October 25-29, 1982. Available from UNESCO.
Mingat, Alain, and J.P. Tan. "Subsidization of Higher Education versusExpansion of Primary Enrollments: What Can a Shift of Resources Achieve inSub-Saharan Africa?" International Journal of Educational Development5:259-68, 1985.
Tibi, Claude. "Budget, Resource Allocation and Educational Policy," paperpresented at the IIEP international seminar on Budget, Resource Allocationand Educational Policy in Paris, October 25-29, 1982. Available fromUNESCO.
UNESCO. Statistical Yearbooks, 1974, 1984, 1985. (Paris: UNESCO Office ofStatistics, 1985).
Vaizey, J. and J.D. Chesswas. The Costing of Educational Plans. (Paris:UNESCO International Institute for Educational Planning, 1967).
World Bank. Financing Education in Developing Countries. (Washington:1986).
Chapter III:"Cost Control and Efficiency Measures in the Education Sector":
UNESCO, Evolution of Wastage in Primary Education in the World Between 1970and 1980. (Paris: UNESCO Office of Statistics, 1984.)
World Bank Comparative Education Indicators, February 14, 1986.
Selected World Bank Documents.