Embed Size (px)
Citation preview

Planning Authority
Monthly Statistical
Report
2017

51
5 9
1410
2420
12 1522
12
84
57
41
108
89
104
5 74 2
94
0
20
40
60
80
100
120
2011 2012 2013 2014 2015 2016 2017 2018
Yearly comparison of Planning Applications Received in January 2017
MW CPS DC CERT
2012 2013 2014 2015 2016 2017MW 5 1 5 9 14 10CPS 24 20 12 15 22 12DC 84 57 41 108 89 104CERT 5 7 4 2 9 4TOTAL 118 85 62 134 134 130

Applications from Previous Years
Approval Refusal Approval Refusal Total Decision Released
DC 2 1 136 2 141
CERT 0 0 6 0 6
CPS 1 0 13 1 15
MW 3 0 2 0 5
Total 6 1 157 3 167
Applications Received in 2017
FINAL DECISIONS RELEASED IN JANUARY 2017
2013 2014 2015 2016 2017
MW 8 11 15 23 28
CPS 57 39 27 51 25
DC 156 155 239 224 259
CERT 20 16 7 14 14
Total 241 221 288 312 326
8 1115
2328
5739
2751
25
156 155
239224
259
20 167 14 14
241221
288312
326
0
50
100
150
200
250
300
350
Yearly Comparison of Planning Applications Received from
January to February 2017
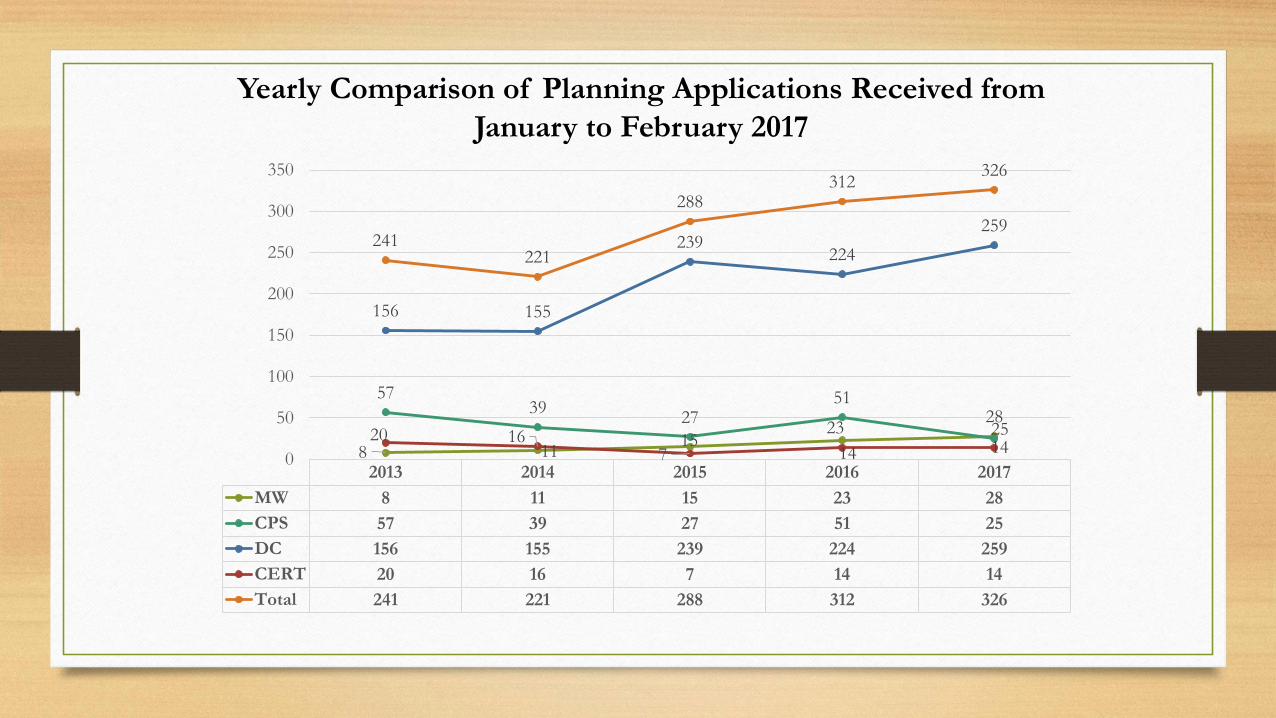
FINAL DECISIONS RELEASED FEBRUARY 2017
Applications Released
in 2017
Applications from Previous
Years
Approved Refused Approved Refused Total
DC 56 4 74 2 136
CERT 5 0 2 0 7
CPS 9 0 6 0 15
MW 12 0 1 0 13
Total 82 4 83 2 171

2013 2014 2015 2016 2017
MW 17 20 24 35 46
CPS 69 69 50 64 61
DC 306 270 442 365 447
CERT 29 29 12 21 25
Total 421 388 528 485 579
17
20 24 35 46
69 69 50 64 61
306270
442
365
447
29 29
12 21 25
421
388
528485
579
0
100
200
300
400
500
600
700
Yearly Comparison of Planning Applications Received from
January to March 2017

Applications Received in
2017
Applications from Previous
Years
Approved Refused Approved Refused Total
DC 87 3 49 1 140
CERT 5 0 0 0 5
CPS 18 1 0 0 19
MW 18 0 1 0 19
Total 128 4 50 1 183
FINAL DECISIONS RELEASED MARCH 2017

2013 2014 2015 2016 2017
MW 24 30 37 55 57
CPS 85 96 70 90 79
DC 469 403 648 515 607
CERT 40 41 21 31 44
TOTAL 618 570 776 691 787
0
100
200
300
400
500
600
700
800
900
Yearly Comparison of Applications Received from January to April 2017

FINAL DECISIONS RELEASED IN APRIL 2017
Applications Received in
2017
Applications from
Previous Years
Approved Refused Approved Refused Total
DC 98 10 26 2 136
CERT 16 0 0 0 16
CPS 20 2 2 0 24
MW 8 1 0 0 9
Total 142 13 28 2 185

2013 2014 2015 2016 2017
MW 30 42 48 70 71
CPS 110 131 93 120 99
DC 603 572 792 681 797
CERT 52 56 25 44 56
TOTAL 795 801 958 915 1023
0
200
400
600
800
1000
1200
Yearly comparison of Applications Received fromJanuary to May 2017

FINAL DECISIONS RELEASED IN MAY 2017
Applications Received in
2017
Applications from Previous
Years
Approved Refused Approved Refused Total
DC 136 7 28 0 171
CERT 12 1 1 0 14
CPS 18 1 1 0 20
MW 12 0 1 0 13
Total 178 9 31 0 218

2013 2014 2015 2016 2017
MW 38 47 56 83 86
CPS 128 149 109 130 136
DC 746 699 934 831 951
CERT 68 66 30 59 70
TOTAL 980 961 1129 1103 1243
0
200
400
600
800
1000
1200
1400
Yearly Comparison of Planning Applications Received fromJanuary to June 2017

Applications Received
in 2017
Applications from Previous
Years
Approved Refused Approved Refused Total
DC 139 9 17 4 169
CERT 11 0 2 0 13
CPS 33 1 3 1 38
MW 13 0 0 0 13
Total 196 10 22 5 233
FINAL DECISIONS RELEASED IN JUNE 2017

Jan Feb Mar Apr May Jun
DC 104 259 447 607 797 951
CERT 4 14 25 44 56 70
CPS 12 25 61 79 99 136
MW 10 28 46 57 71 86
TOTAL 130 326 579 787 1023 1243
0
200
400
600
800
1000
1200
1400
Summary - Number of Applications Received from January to June 2017

Jan Feb Mar Apr May Jun
Approved Applications Received in 2017 6 82 128 142 178 196
Refused Applications Received in 2017 1 4 4 13 9 10
Approved Applications -from previous years 157 83 50 28 31 22
Refused Applications - from previous years 3 2 1 2 0 5
Total 167 171 183 185 218 233
0
50
100
150
200
250
Summary- Planning Applications Released from Jan to June 2017


![˘ ˇˆ˙ - Civil Aviation Authority, Bangladeshcaab.gov.bd/admn/NIS Documentation.pdf · N" ˘ & * ˇ. 7 ; ] ) " , , , 4 l K @6 78 *- ‘v l ˜ ˜ˇ ’-7 ] A1 & ) 5 0+ , T 7 0 ;](https://img.pdfslide.net/doc/110x75/5e76a75c371b4a5d0c08b2d4/-civil-aviation-authority-documentationpdf-n-.jpg)