Embed Size (px)
Citation preview
PLANNING: CATALYST OR
BARRIER TO URBAN ENERGY
EFFICIENCY?
Kayla Friedman AIA AFHEA
Contents
• Urban context: energy use and emissions
• Planning for energy use and emissions
• Research findings
• Conclusions
19 Sep 2014 2ULI Presentation : Kayla Friedman
URBAN CONTEXTEnergy use and emissions
19 Sep 2014 3ULI Presentation : Kayla Friedman
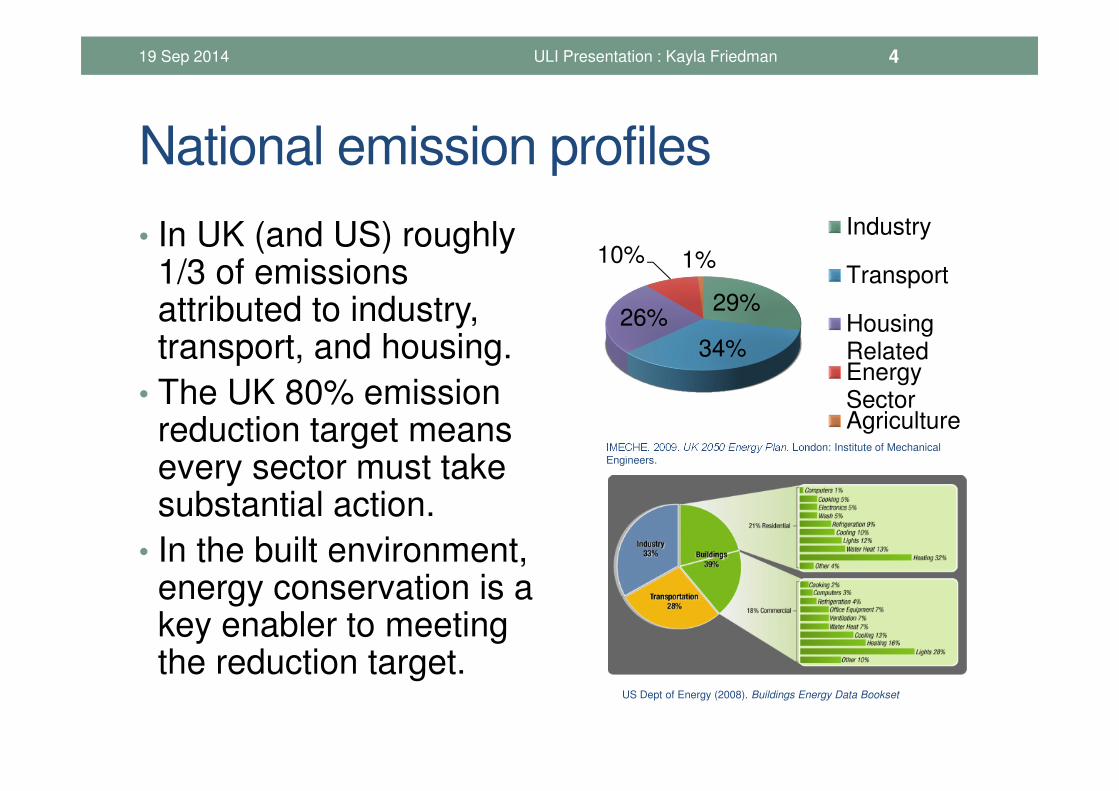
National emission profiles
• In UK (and US) roughly 1/3 of emissions attributed to industry, transport, and housing.
• The UK 80% emission reduction target means every sector must take substantial action.
• In the built environment, energy conservation is a key enabler to meeting the reduction target.
19 Sep 2014 ULI Presentation : Kayla Friedman 4
IMECHE. 2009. UK 2050 Energy Plan. London: Institute of Mechanical Engineers.
29%
34%
26%
10% 1%
Industry
Transport
HousingRelatedEnergySectorAgriculture
US Dept of Energy (2008). Buildings Energy Data Bookset
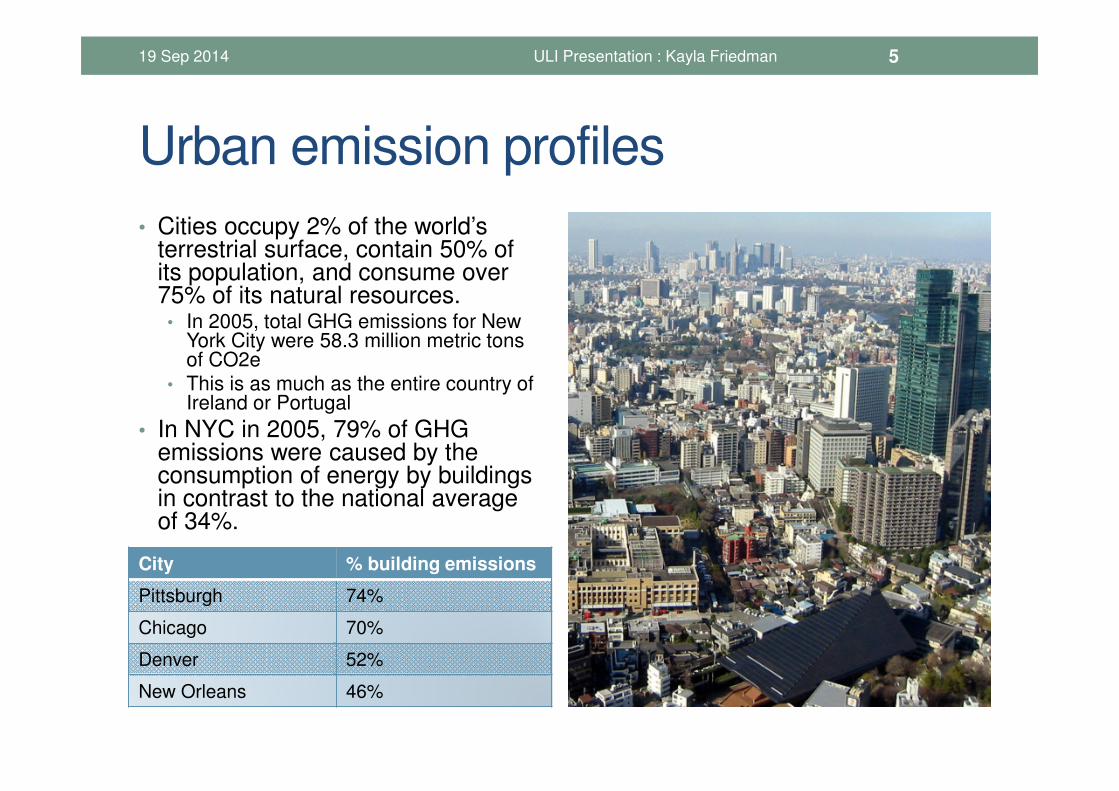
Urban emission profiles
• Cities occupy 2% of the world’s terrestrial surface, contain 50% of its population, and consume over 75% of its natural resources.
• In 2005, total GHG emissions for New York City were 58.3 million metric tons of CO2e
• This is as much as the entire country of Ireland or Portugal
• In NYC in 2005, 79% of GHG emissions were caused by the consumption of energy by buildings in contrast to the national average of 34%.
Asf
19 Sep 2014 ULI Presentation : Kayla Friedman 5
City % building emissions
Pittsburgh 74%
Chicago 70%
Denver 52%
New Orleans 46%
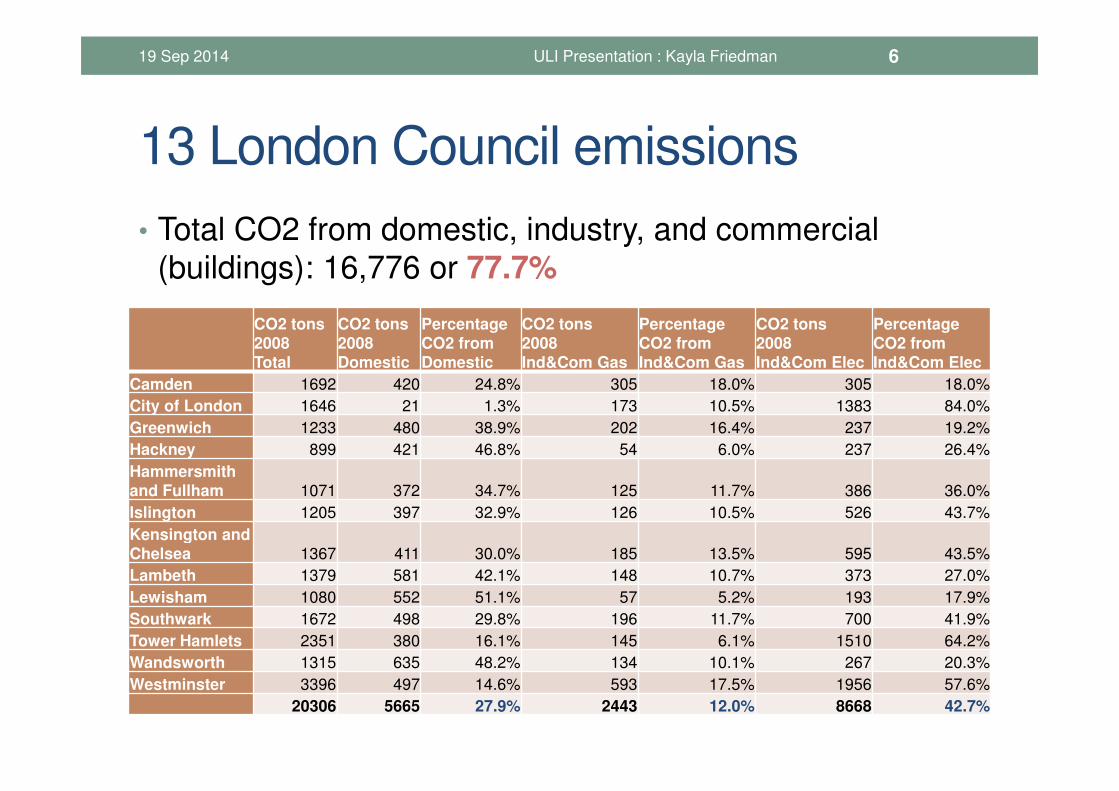
13 London Council emissions
• Total CO2 from domestic, industry, and commercial
(buildings): 16,776 or 77.7%
19 Sep 2014 ULI Presentation : Kayla Friedman 6
CO2 tons 2008Total
CO2 tons 2008Domestic
Percentage CO2 from Domestic
CO2 tons2008Ind&Com Gas
Percentage CO2 from Ind&Com Gas
CO2 tons2008Ind&Com Elec
Percentage CO2 from Ind&Com Elec
Camden 1692 420 24.8% 305 18.0% 305 18.0%
City of London 1646 21 1.3% 173 10.5% 1383 84.0%
Greenwich 1233 480 38.9% 202 16.4% 237 19.2%
Hackney 899 421 46.8% 54 6.0% 237 26.4%
Hammersmith and Fullham 1071 372 34.7% 125 11.7% 386 36.0%
Islington 1205 397 32.9% 126 10.5% 526 43.7%
Kensington and Chelsea 1367 411 30.0% 185 13.5% 595 43.5%
Lambeth 1379 581 42.1% 148 10.7% 373 27.0%
Lewisham 1080 552 51.1% 57 5.2% 193 17.9%
Southwark 1672 498 29.8% 196 11.7% 700 41.9%
Tower Hamlets 2351 380 16.1% 145 6.1% 1510 64.2%
Wandsworth 1315 635 48.2% 134 10.1% 267 20.3%
Westminster 3396 497 14.6% 593 17.5% 1956 57.6%
20306 5665 27.9% 2443 12.0% 8668 42.7%
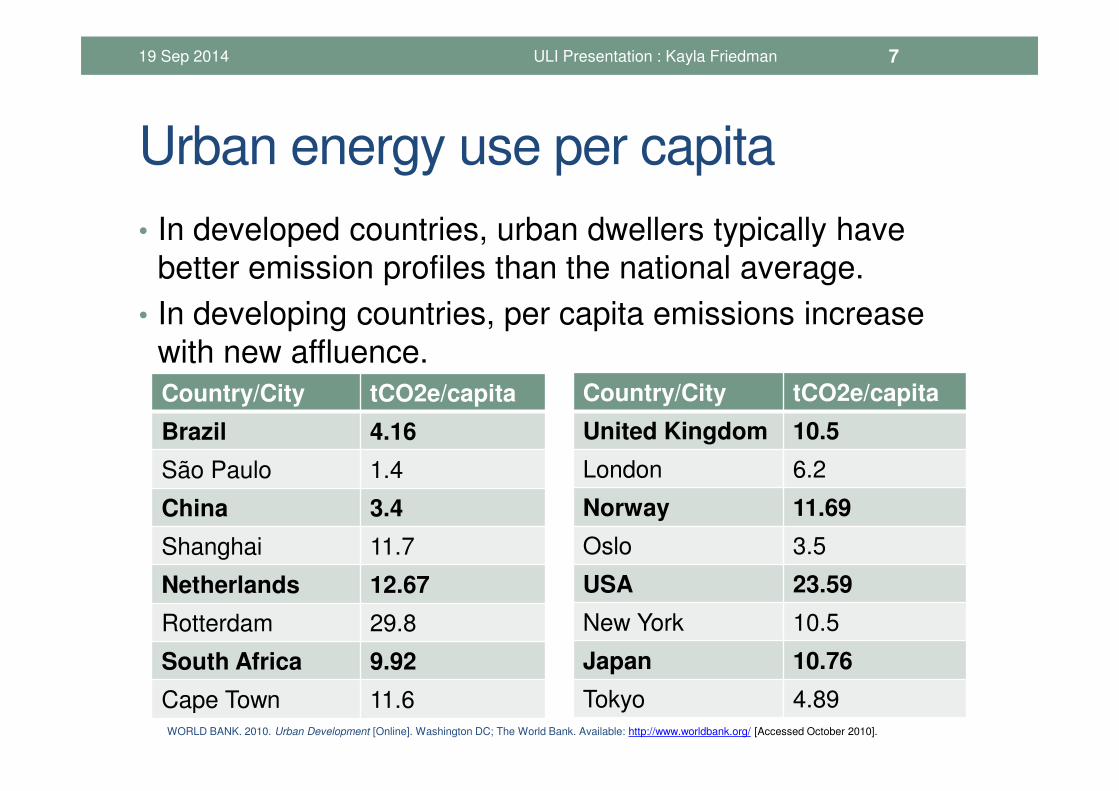
Urban energy use per capita
• In developed countries, urban dwellers typically have
better emission profiles than the national average.
• In developing countries, per capita emissions increase
with new affluence.
19 Sep 2014 ULI Presentation : Kayla Friedman 7
WORLD BANK. 2010. Urban Development [Online]. Washington DC; The World Bank. Available: http://www.worldbank.org/ [Accessed October 2010].
Country/City tCO2e/capita
Brazil 4.16
São Paulo 1.4
China 3.4
Shanghai 11.7
Netherlands 12.67
Rotterdam 29.8
South Africa 9.92
Cape Town 11.6
Country/City tCO2e/capita
United Kingdom 10.5
London 6.2
Norway 11.69
Oslo 3.5
USA 23.59
New York 10.5
Japan 10.76
Tokyo 4.89
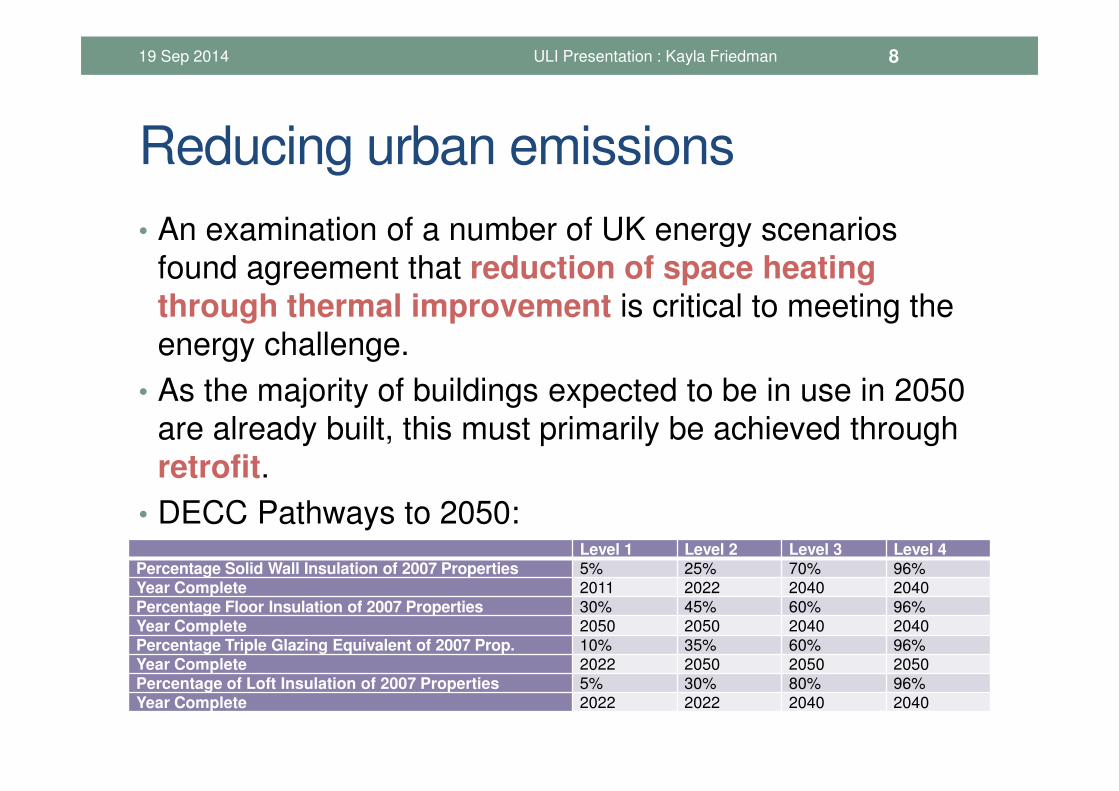
Reducing urban emissions
• An examination of a number of UK energy scenarios
found agreement that reduction of space heating through thermal improvement is critical to meeting the
energy challenge.
• As the majority of buildings expected to be in use in 2050
are already built, this must primarily be achieved through
retrofit.
• DECC Pathways to 2050:
19 Sep 2014 ULI Presentation : Kayla Friedman 8
Level 1 Level 2 Level 3 Level 4Percentage Solid Wall Insulation of 2007 Properties 5% 25% 70% 96%
Year Complete 2011 2022 2040 2040
Percentage Floor Insulation of 2007 Properties 30% 45% 60% 96%
Year Complete 2050 2050 2040 2040
Percentage Triple Glazing Equivalent of 2007 Prop. 10% 35% 60% 96%
Year Complete 2022 2050 2050 2050
Percentage of Loft Insulation of 2007 Properties 5% 30% 80% 96%
Year Complete 2022 2022 2040 2040
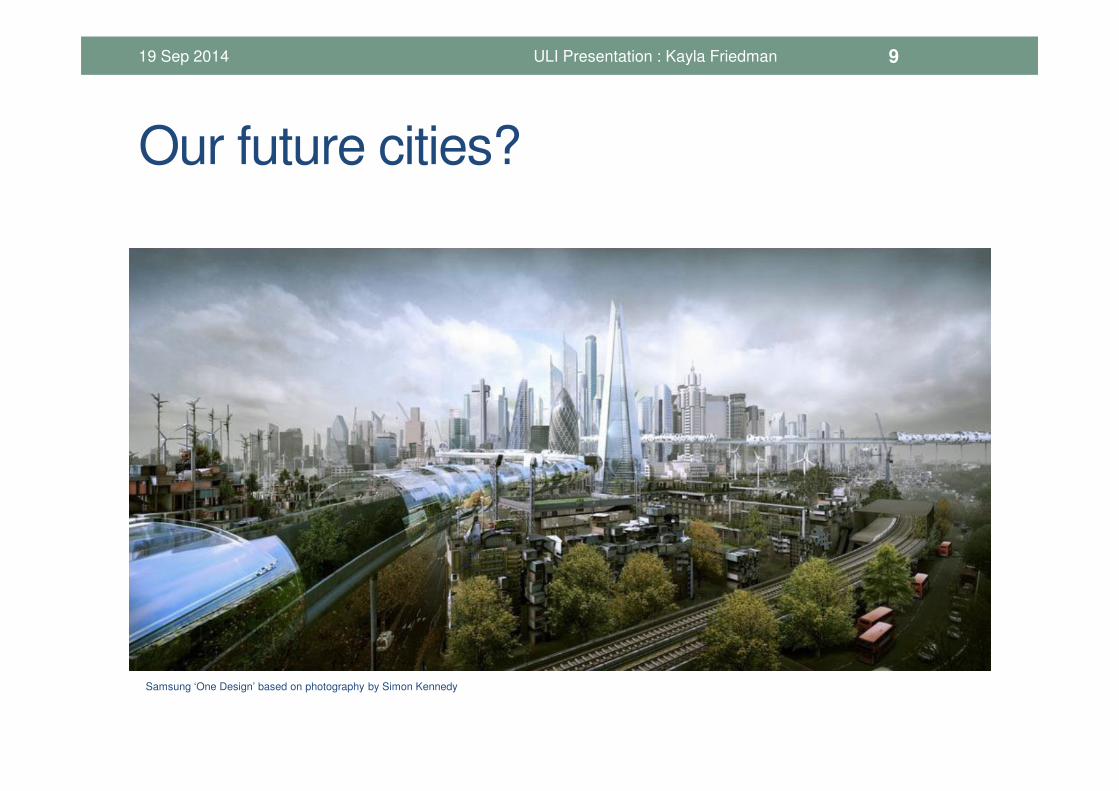
Our future cities?
19 Sep 2014 ULI Presentation : Kayla Friedman 9
Samsung ‘One Design’ based on photography by Simon Kennedy
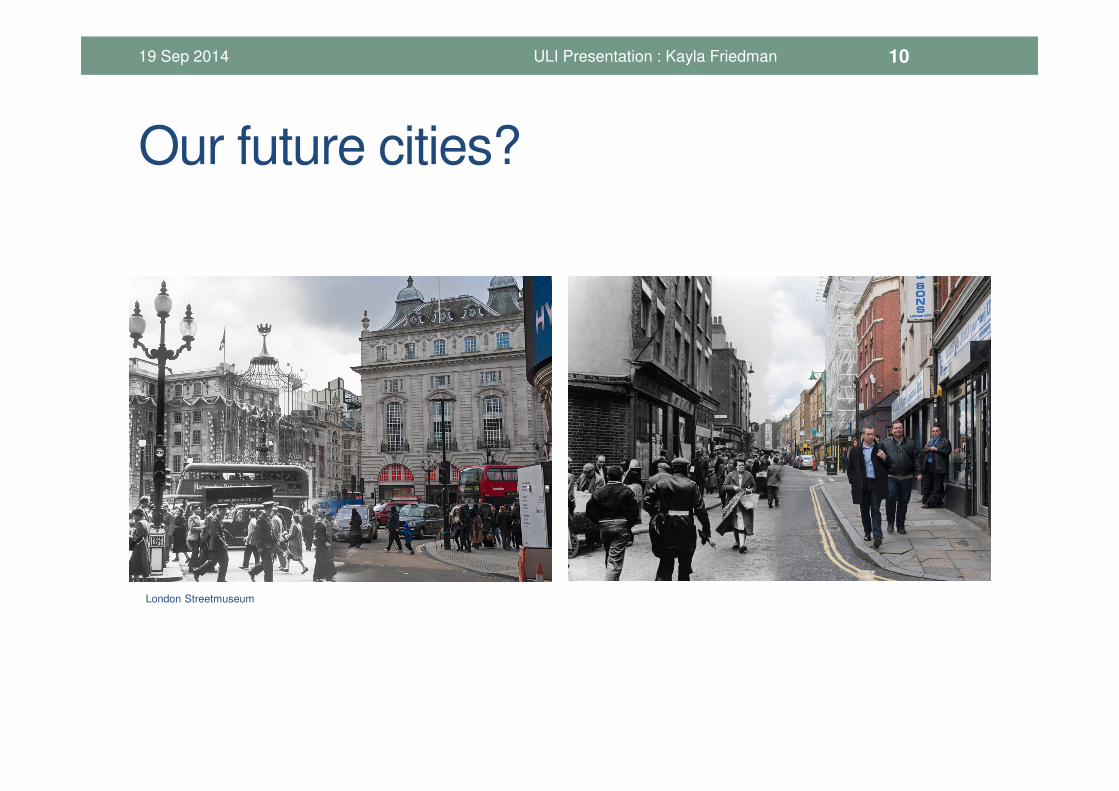
Our future cities?
19 Sep 2014 ULI Presentation : Kayla Friedman 10
London Streetmuseum
PLANNINGGovernance for energy use and emission reduction
19 Sep 2014 11ULI Presentation : Kayla Friedman
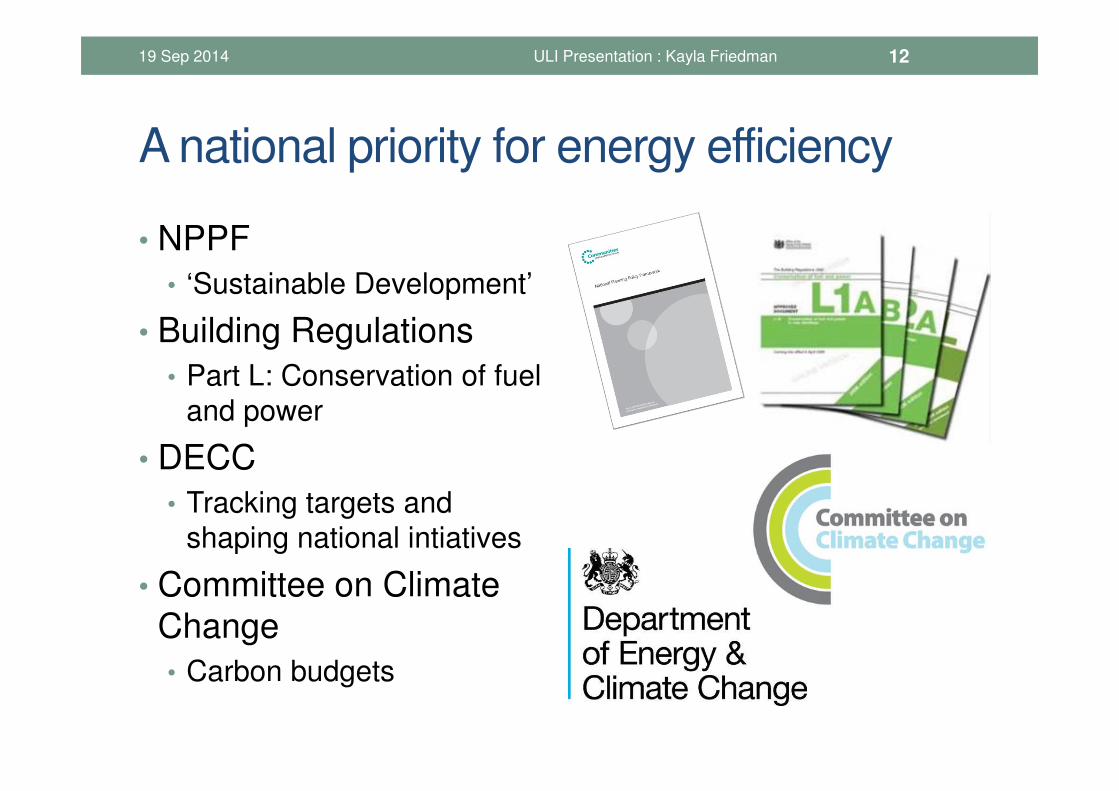
A national priority for energy efficiency
• NPPF
• ‘Sustainable Development’
• Building Regulations
• Part L: Conservation of fuel
and power
• DECC
• Tracking targets and
shaping national intiatives
• Committee on Climate Change
• Carbon budgets
• Asdf
19 Sep 2014 ULI Presentation : Kayla Friedman 12
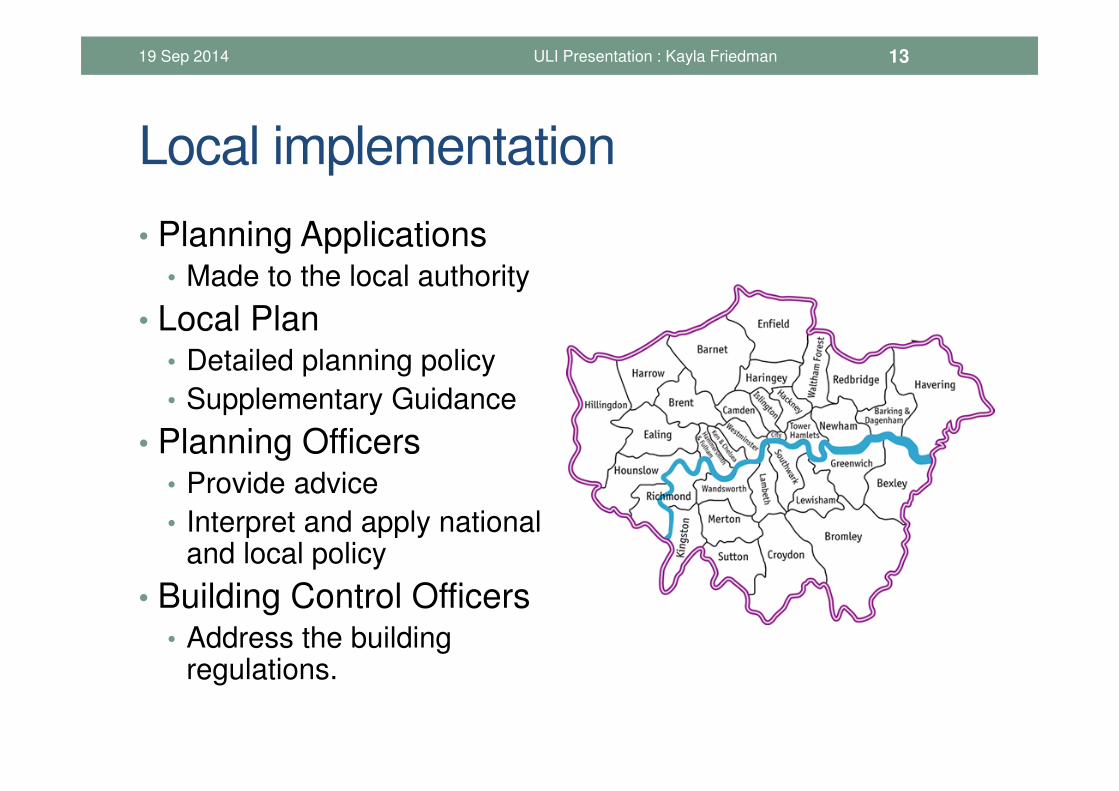
Local implementation
• Planning Applications• Made to the local authority
• Local Plan• Detailed planning policy
• Supplementary Guidance
• Planning Officers• Provide advice
• Interpret and apply national and local policy
• Building Control Officers• Address the building
regulations.
19 Sep 2014 ULI Presentation : Kayla Friedman 13
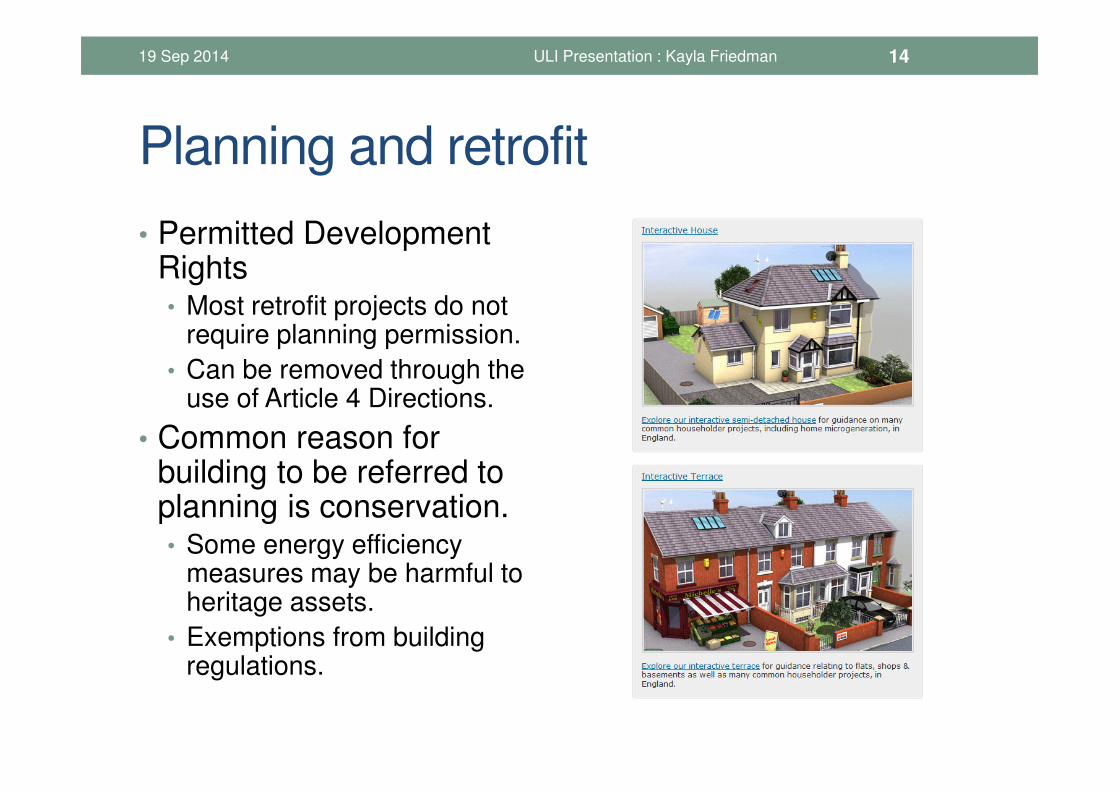
Planning and retrofit
• Permitted Development Rights• Most retrofit projects do not
require planning permission.
• Can be removed through the use of Article 4 Directions.
• Common reason for building to be referred to planning is conservation.• Some energy efficiency
measures may be harmful to heritage assets.
• Exemptions from building regulations.
19 Sep 2014 ULI Presentation : Kayla Friedman 14
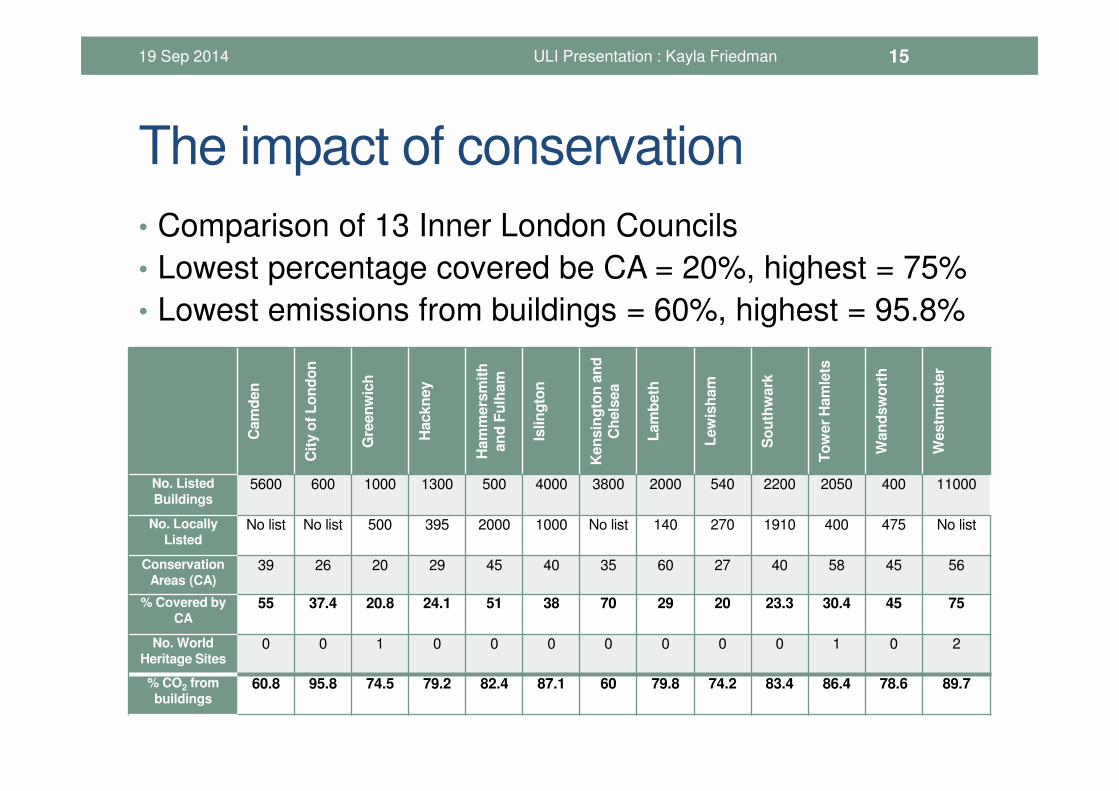
The impact of conservation
• Comparison of 13 Inner London Councils
• Lowest percentage covered be CA = 20%, highest = 75%
• Lowest emissions from buildings = 60%, highest = 95.8%
19 Sep 2014 ULI Presentation : Kayla Friedman 15
Cam
den
Cit
y o
f L
on
do
n
Gre
en
wic
h
Hackn
ey
Ham
mers
mit
h
an
d F
ulh
am
Islin
gto
n
Ken
sin
gto
n a
nd
C
hels
ea
Lam
beth
Lew
ish
am
So
uth
wark
To
wer
Ham
lets
Wan
dsw
ort
h
Westm
inste
r
No. Listed
Buildings5600 600 1000 1300 500 4000 3800 2000 540 2200 2050 400 11000
No. Locally
ListedNo list No list 500 395 2000 1000 No list 140 270 1910 400 475 No list
Conservation
Areas (CA)39 26 20 29 45 40 35 60 27 40 58 45 56
% Covered by
CA55 37.4 20.8 24.1 51 38 70 29 20 23.3 30.4 45 75
No. World
Heritage Sites0 0 1 0 0 0 0 0 0 0 1 0 2
% CO2 from
buildings60.8 95.8 74.5 79.2 82.4 87.1 60 79.8 74.2 83.4 86.4 78.6 89.7
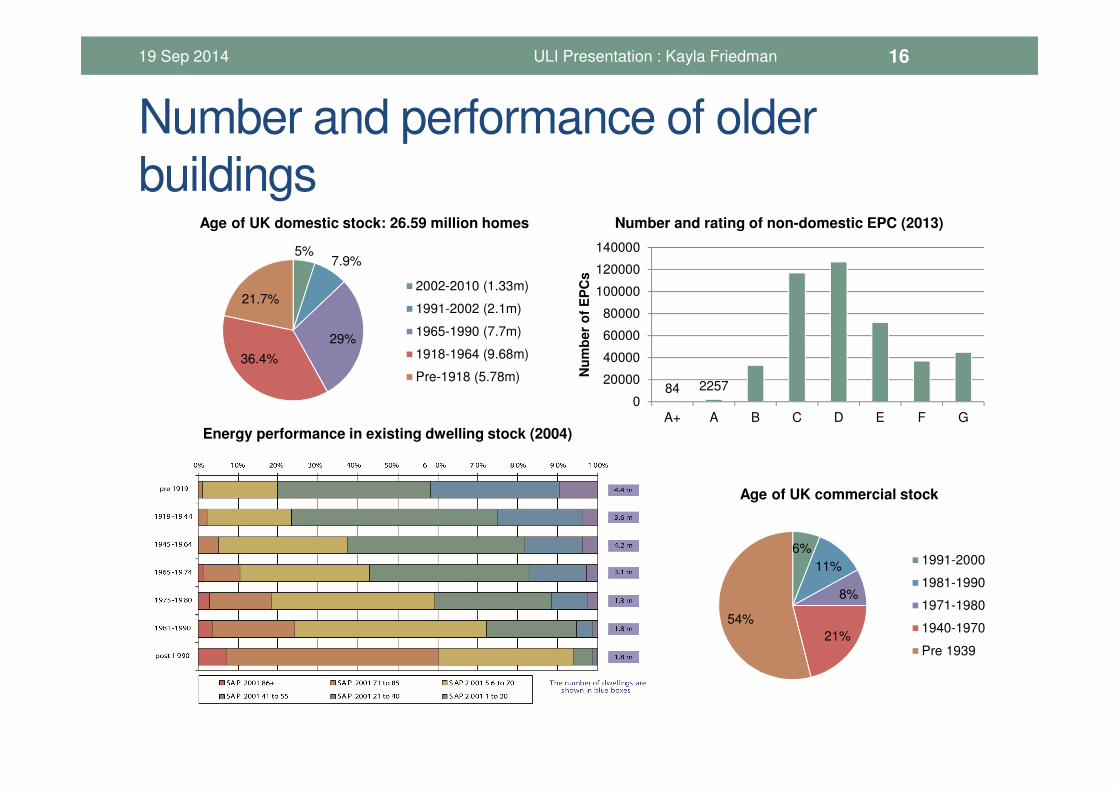
Number and performance of older
buildings
19 Sep 2014 ULI Presentation : Kayla Friedman 16
6%
11%
8%
21%
54%
Age of UK commercial stock
1991-2000
1981-1990
1971-1980
1940-1970
Pre 1939
5%7.9%
29%
36.4%
21.7%
Age of UK domestic stock: 26.59 million homes
2002-2010 (1.33m)
1991-2002 (2.1m)
1965-1990 (7.7m)
1918-1964 (9.68m)
Pre-1918 (5.78m)
Energy performance in existing dwelling stock (2004)
84 22570
20000
40000
60000
80000
100000
120000
140000
A+ A B C D E F G
Nu
mb
er
of
EP
Cs
Number and rating of non-domestic EPC (2013)
RESEARCH FINDINGS
19 Sep 2014 17ULI Presentation : Kayla Friedman
PhD research
19 Sep 2014 ULI Presentation : Kayla Friedman 18
0 2 4 6 8 10 12
Planning and Legislation
Costs
Lack of Awareness
Technical Constraints
Architectural Considerations
Industry Barriers
Consumer Confidence
Landlord/Tenant Issues
Socioeconomic Status
Disruption
Lack of Integration
Over-specification
Seasonal Factors
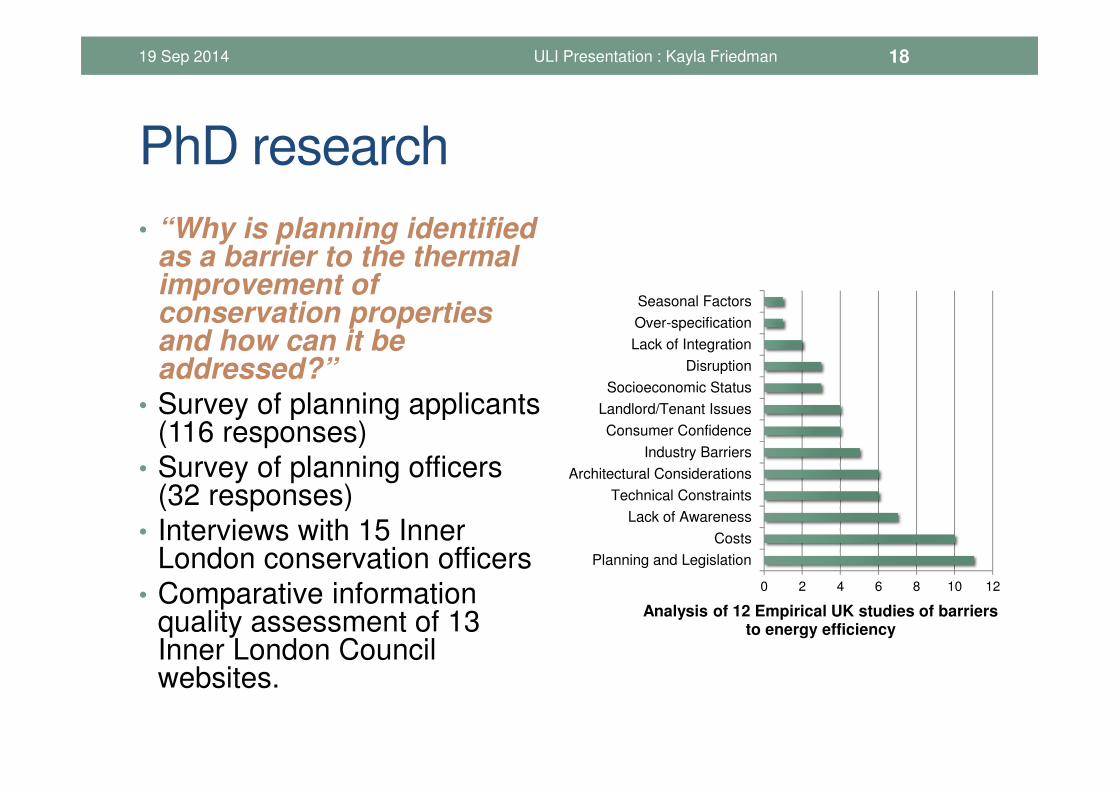
Analysis of 12 Empirical UK studies of barriers to energy efficiency
• “Why is planning identified as a barrier to the thermal improvement of conservation properties and how can it be addressed?”
• Survey of planning applicants (116 responses)
• Survey of planning officers (32 responses)
• Interviews with 15 Inner London conservation officers
• Comparative information quality assessment of 13 Inner London Council websites.
Key findings
• Local Councils are under-resourced.• Budget cuts have resulted in fewer officers.
• Higher workloads and lack of budget means officers are unable to attend training sessions or collaborate with officers from other Councils.
• There is a lack of clear guidance on how to integrate national objectives for energy efficiency and conservation.• National guidance tends to be produced by singular bodies (i.e.
English Heritage).
• Without clear guidance, Councils (and sometimes individual officers) must determine how to do it on their own resulting in ver different outcomes.
• There is a broad diversity of (sometimes conflicting) available guidance.• This may lead to inconsistent advice and information.
19 Sep 2014 ULI Presentation : Kayla Friedman 19
Key findings
• There is significant scope to improve the energy efficiency of retrofit projects.
• Most applicants reported a lack of energy efficiency improvements.
• More research is needed to understand how to motivate applicants.
• Planning is not structured to assess energy efficiency.
• Energy efficiency is viewed as the responsibility of building control.
• When projects are referred to planning, there is no trained advocate
for energy efficiency within planning.
• Reduction of emissions through retrofit is not prioritised or advocated by Councils.
• Most advice provided on energy efficiency is about behaviour change.
• Information provided on energy efficiency is often separate from
planning and also building control.
19 Sep 2014 ULI Presentation : Kayla Friedman 20
CONCLUSIONS
19 Sep 2014 21ULI Presentation : Kayla Friedman
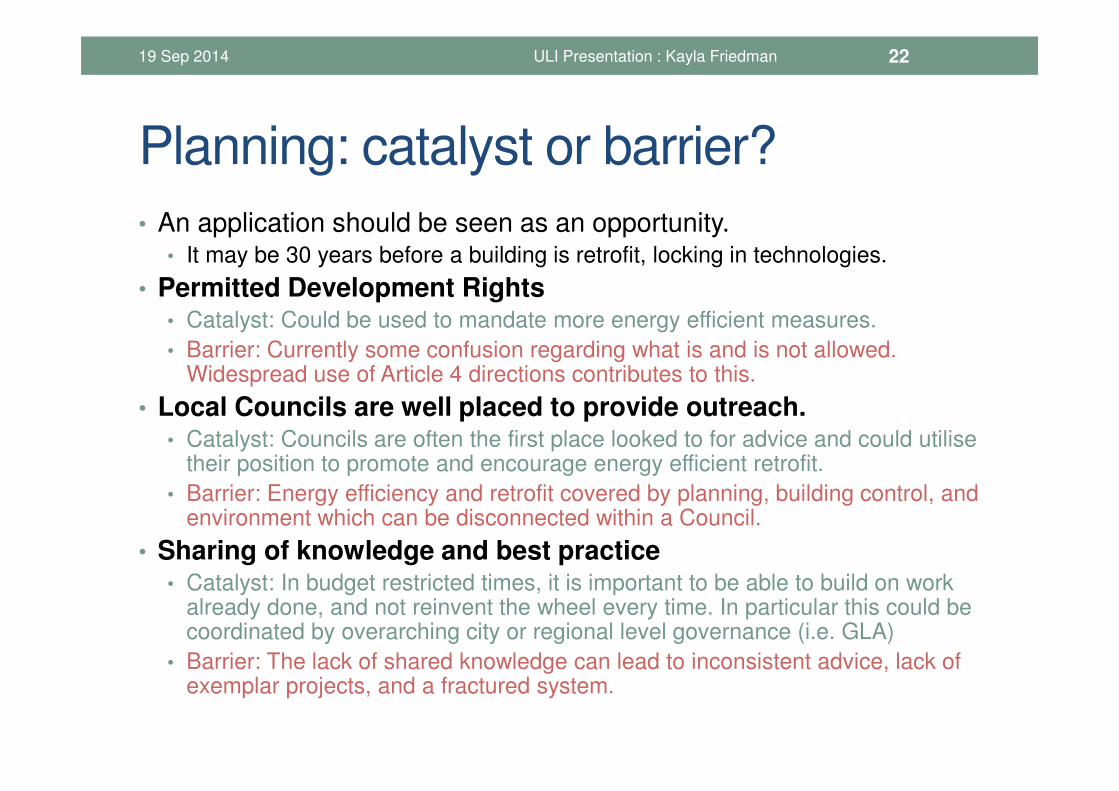
Planning: catalyst or barrier?
• An application should be seen as an opportunity.• It may be 30 years before a building is retrofit, locking in technologies.
• Permitted Development Rights• Catalyst: Could be used to mandate more energy efficient measures.
• Barrier: Currently some confusion regarding what is and is not allowed. Widespread use of Article 4 directions contributes to this.
• Local Councils are well placed to provide outreach.• Catalyst: Councils are often the first place looked to for advice and could utilise
their position to promote and encourage energy efficient retrofit.
• Barrier: Energy efficiency and retrofit covered by planning, building control, and environment which can be disconnected within a Council.
• Sharing of knowledge and best practice• Catalyst: In budget restricted times, it is important to be able to build on work
already done, and not reinvent the wheel every time. In particular this could be coordinated by overarching city or regional level governance (i.e. GLA)
• Barrier: The lack of shared knowledge can lead to inconsistent advice, lack of exemplar projects, and a fractured system.
19 Sep 2014 ULI Presentation : Kayla Friedman 22
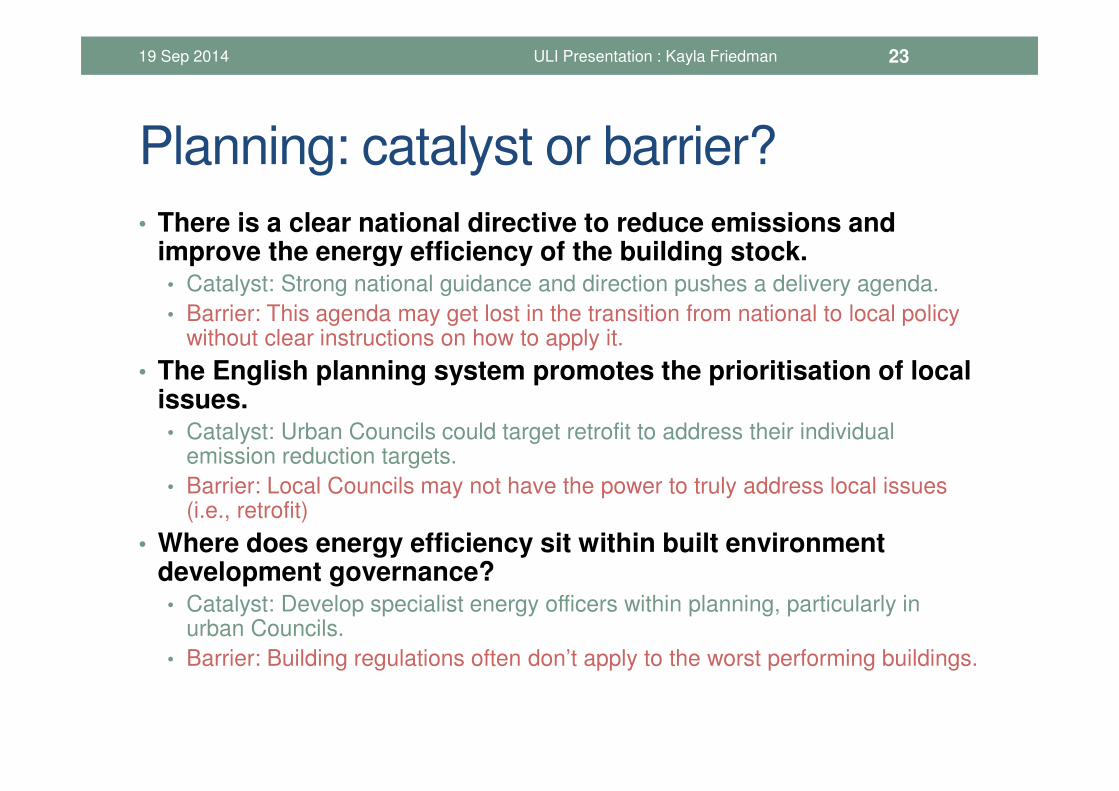
Planning: catalyst or barrier?
• There is a clear national directive to reduce emissions and improve the energy efficiency of the building stock.• Catalyst: Strong national guidance and direction pushes a delivery agenda.
• Barrier: This agenda may get lost in the transition from national to local policy without clear instructions on how to apply it.
• The English planning system promotes the prioritisation of local issues.• Catalyst: Urban Councils could target retrofit to address their individual
emission reduction targets.
• Barrier: Local Councils may not have the power to truly address local issues (i.e., retrofit)
• Where does energy efficiency sit within built environment development governance?• Catalyst: Develop specialist energy officers within planning, particularly in
urban Councils.
• Barrier: Building regulations often don’t apply to the worst performing buildings.
19 Sep 2014 ULI Presentation : Kayla Friedman 23

THANK YOU
19 Sep 2014 ULI Presentation : Kayla Friedman 24