Embed Size (px)
Citation preview

VIRGINIA CENTER FOR TRANSPORTATION INNOVATION AND RESEARCH
530 Edgemont Road, Charlottesville, VA 22903-2454
www. VTRC.net
Planning for Active TrafficManagement in Virginia:International Best Practices andImplementation Strategies
http://www.virginiadot.org/vtrc/main/online_reports/pdf/13-r1.pdf
MICHAEL D. FONTAINE, Ph.D., P.E.
JOHN S. MILLER, Ph.D., P.E.
Senior Research Scientist
Associate Principal Research Scientist
Final Report VCTIR 13-R1

Standard Title Page—Report on State Project Report No.: VCTIR 13-R1
Report Date: October 2012
No. Pages: 108
Type Report: Final
Project No.: 97905
Period Covered: 7/2010–6/2012
Contract No.:
Title: Planning for Active Traffic Management in Virginia: International Best Practices and Implementation Strategies
Key Words: Advanced traffic management systems, active traffic management, sketch planning, highway operations, transportation planning Author(s):
Michael D. Fontaine, Ph.D., P.E., and John S. Miller, Ph.D., P.E. Performing Organization Name and Address: Virginia Center for Transportation Innovation and Research 530 Edgemont Road Charlottesville, VA 22903 Sponsoring Agencies’ Name and Address: Virginia Department of Transportation 1401 E. Broad Street Richmond, VA 23219
Supplementary Notes:
Abstract: Active Traffic Management (ATM) applications, such as variable speed limits, queue warning systems, and dynamic ramp metering, have been shown to offer mobility and safety benefits. Yet because they differ from conventional capacity investments in terms of cost, service life, and operating requirements, how to incorporate them into the planning process is not clear. To facilitate such incorporation, this study developed guidelines for considering ATM deployments. The guidelines consist of four sets. The first set identifies required infrastructure and operational conditions, such as sensor placement and queuing behavior, to apply a particular ATM technique at a given site. The second set presents sketch planning analysis methods to estimate the operational and safety benefits of applying the particular technique at the site; these may be refined with the third set concerning a more detailed (and accurate) simulation analysis. The fourth set concerns continued monitoring of an ATM deployment at a given site. Also provided is a framework for incorporating ATM concepts into the regional planning process. The framework is illustrated with a hypothetical case study of variable speed limits implemented on I-66 in Virginia. Although Virginia metropolitan planning organizations (MPOs) and the Virginia Department of Transportation already consider operational initiatives to some degree within the planning process, a key finding of this study is that there are several ways to strengthen the inclusion of operational initiatives. These include (1) using the guidelines developed in this study; (2) linking ATM initiatives to the MPO’s Congestion Management Process; (3) facilitating the computation of operational-related performance measures such as total vehicle- hours of delay; and (4) emphasizing, when applicable, the safety and environmental aspects of ATM. The rationale for such aspects is not to promote ATM as being more effective than other types of investments but rather to compare ATM objectively with these other types of investments. For example, Appendix A illustrates how to compute a benefit-cost ratio where costs include capital and operations expenditures for the ATM and where benefits include monetized values of vehicle-hours of delay plus crash costs. In this manner, the benefit-cost ratio for an ATM project may be compared to the benefit-cost ratio for other operational or capacity projects.

FINAL REPORT
PLANNING FOR ACTIVE TRAFFIC MANAGEMENT IN VIRGINIA: INTERNATIONAL BEST PRACTICES AND IMPLEMENTATION STRATEGIES
Michael D. Fontaine, Ph.D., P.E. Senior Research Scientist
John S. Miller, Ph.D., P.E.
Associate Principal Research Scientist
Virginia Center for Transportation Innovation and Research (A partnership of the Virginia Department of Transportation
and the University of Virginia since 1948)
Charlottesville, Virginia
October 2012 VCTIR 13-R1

ii
DISCLAIMER
The contents of this report reflect the views of the authors, who are responsible for the facts and the accuracy of the data presented herein. The contents do not necessarily reflect the official views or policies of the Virginia Department of Transportation, the Commonwealth Transportation Board, or the Federal Highway Administration. This report does not constitute a standard, specification, or regulation. Any inclusion of manufacturer names, trade names, or trademarks is for identification purposes only and is not to be considered an endorsement.
Copyright 2012 by the Commonwealth of Virginia. All rights reserved.

iii
ABSTRACT
Active Traffic Management (ATM) applications, such as variable speed limits, queue warning systems, and dynamic ramp metering, have been shown to offer mobility and safety benefits. Yet because they differ from conventional capacity investments in terms of cost, service life, and operating requirements, how to incorporate them into the planning process is not clear. To facilitate such incorporation, this study developed guidelines for considering ATM deployments. The guidelines consist of four sets. The first set identifies required infrastructure and operational conditions, such as sensor placement and queuing behavior, to apply a particular ATM technique at a given site. The second set presents sketch planning analysis methods to estimate the operational and safety benefits of applying the particular technique at the site; these may be refined with the third set concerning a more detailed (and accurate) simulation analysis. The fourth set concerns continued monitoring of an ATM deployment at a given site. Also provided is a framework for incorporating ATM concepts into the regional planning process. The framework is illustrated with a hypothetical case study of variable speed limits implemented on I-66 in Virginia. Although Virginia metropolitan planning organizations (MPOs) and the Virginia Department of Transportation already consider operational initiatives to some degree within the planning process, a key finding of this study is that there are several ways to strengthen the inclusion of operational initiatives. These include (1) using the guidelines developed in this study; (2) linking ATM initiatives to the MPO’s Congestion Management Process; (3) facilitating the computation of operational-related performance measures such as total vehicle- hours of delay; and (4) emphasizing, when applicable, the safety and environmental aspects of ATM. The rationale for such aspects is not to promote ATM as being more effective than other types of investments but rather to compare ATM objectively with these other types of investments. For example, Appendix A illustrates how to compute a benefit-cost ratio where costs include capital and operations expenditures for the ATM and where benefits include monetized values of vehicle-hours of delay plus crash costs. In this manner, the benefit-cost ratio for an ATM project may be compared to the benefit-cost ratio for other operational or capacity projects.

iv

v
TABLE OF CONTENTS
ABSTRACT .................................................................................................................................. iii LIST OF ACRONYMS .............................................................................................................. vii INTRODUCTION..........................................................................................................................1 PURPOSE AND SCOPE ...............................................................................................................2 METHODOLOGY ........................................................................................................................3 Overview .................................................................................................................................3 Task 1: Review Available Information on ATM ...................................................................3 Task 2: Review Best Practices for Including Consideration of Operational Improvements in the Planning Process .....................................................................3
Task 3: Develop Guidelines for Application of ATM Techniques at Specific Sites in Virginia ................................................................................................................. 4 Task 4: Develop a Framework for Further Including ATM in the Planning Process ............5
RESULTS .......................................................................................................................................5 Task 1: Review of Available Information on ATM ...............................................................5 Review of ATM Deployments .........................................................................5 General Guidance for Selecting ATM Techniques ........................................22 Complementary ATM Techniques .................................................................23 Summary of Key Features of ATM Techniques Reviewed ...........................24 Task 2: Best Practices for Considering Operational Improvements in the Planning Process .....................................................................................................................26 Critiques of the Conventional Transportation Planning Process ....................26 Existing Planning Processes that Incorporate Operational Elements .............29 Summary of Best Practices That May Be Adapted to Virginia .....................39 Task 3: Guidelines for Application of ATM Techniques at Specific Sites in Virginia .......42 Step 1: Assessment of Proposed ATM Deployment Site for Required Infrastructure and Operational Conditions for Particular ATM Treatment: Basic Guidelines for Application .....................................43 Step 2: Sketch Planning Analysis to Estimate Safety and Operational Impacts of Proposed ATM Deployment ............................................45
Step 3: Detailed Simulation Analysis of Possible Safety and Operational Impacts of Proposed ATM Deployment ............................................49
Step 4: Ongoing Monitoring and Assessment of Safety and Operational Benefits of ATM Deployments ..........................................................51 Task 4: A Framework for Further Including ATM in the Planning Process .......................53 Overview ........................................................................................................53 Descriptions of the Ten Practices Comprising the Framework ......................55 CONCLUSIONS………………………….. ................................................................................59

vi
RECOMMENDATIONS .............................................................................................................61 IMPLEMENTATION PROSPECTS .........................................................................................62 Feasibility of Implementing Each Recommendation ............................................................62 Complexity Associated With Recommendations 1, 5, and 6 ................................................63 Opportunity Associated With Recommendation 6 ...............................................................64 ACKNOWLEDGMENTS ...........................................................................................................64 REFERENCES .............................................................................................................................65 APPENDIX A. EXAMPLE OF A FRAMEWORK FOR FURTHER INCLUDING ATM IN THE PLANNING PROCESS ......................................................................................75 APPENDIX B. ESTIMATES OF DELAY REDUCTION FOR ATM ON I-66 WEST .......89

vii
LIST OF ACRONYMS AADT Average annual daily traffic AASHTO American Association of State Highway and Transportation Officials ATM Active Traffic Management CDTC New York’s Capital District Transportation Committee CLRP Constrained Long-Range Plan CDTC [New York] Capital District Transportation Committee CMAQ Congestion Mitigation and Air Quality Improvement Program CMP Congestion Management Process or Congestion Management Plan DOT Department of transportation DVRPC Delaware Valley Regional Planning Commission DMS Dynamic message sign FHWA Federal Highway Administration HOT High-occupancy toll HRTPO Hampton Roads Transportation Planning Organization ITS Intelligent transportation systems km/h Kilometers per hour LOS Level of service MOE Measure of effectiveness MOITS Management, Operations, and Intelligent Transportation Systems MPO Metropolitan planning organization NCRTPB National Capital Region Transportation Planning Board NRO VDOT’s Northern Region Operations OSD VDOT’s Operations and Security Division PDO Property damage only PSRC Washington State’s Puget Sound Regional Council RCTO Regional concept of transportation operations SEMCOG Southeastern Michigan Council of Governments SYIP Six-Year Improvement Program SOV Single-occupant vehicle STARS Strategically Targeted Affordable Roadway Solutions STIP Statewide Transportation Improvement Program TIP Transportation Improvement Program TSM Transportation Systems Management TMPD VDOT’s Transportation and Mobility Planning Division VDOT Virginia Department of Transportation veh/hr Vehicles per hour veh/hr/lane Vehicles per hour per lane v/c ratio Volume to capacity ratio VCTIR Virginia Center for Transportation Innovation and Research VSL Variable speed limit WFRC Utah’s Wasatch Front Regional Council WSDOT Washington State Department of Transportation

viii

1
FINAL REPORT
PLANNING FOR ACTIVE TRAFFIC MANAGEMENT IN VIRGINIA: INTERNATIONAL BEST PRACTICES AND IMPLEMENTATION STRATEGIES
Michael D. Fontaine, Ph.D., P.E.
Senior Research Scientist
John S. Miller, Ph.D., P.E. Associate Principal Research Scientist
INTRODUCTION
A number of European countries have implemented programs that use technology to manage congestion dynamically. These programs are collectively termed Active Traffic Management (ATM). European ATM programs have produced significant improvements in traffic flow and safety at a lower cost than traditional capacity expansion projects. A recent European scan by the Federal Highway Administration (FHWA) and the American Association of State Highway and Transportation Officials (AASHTO) identified a number of promising ATM techniques that could potentially be transferred to roads in the United States (Mirshahi et al., 2007). The FHWA/AASHTO scan examined ATM systems in Greece, Denmark, the Netherlands, Germany, and the United Kingdom. The scan found significant, broad benefits of using ATM, including the following:
• increases in throughput of 3% to 7% during congested periods • decreases in primary incidents of 3% to 30% and decreases in secondary incidents of
40% to 50%
• increased trip reliability
• improved ability to delay the onset of breakdown conditions (Mirshahi et al., 2007).
Although the FHWA/AASHTO scan results represent only one data point in the assessment of ATM, they provide positive indications regarding the potential impacts of ATM on congestion and safety. The scan found several categories of ATM techniques that showed particular promise, specifically:
• speed harmonization using variable speed limit (VSL) systems • dynamic use of the shoulder • junction control and dynamic lane control • queue warning systems (QWSs) • dynamic ramp metering.

2
Although Europe has had experience with ATM techniques, applications in the United States are more limited. The Washington State Department of Transportation (DOT) (WSDOT) recently implemented VSL systems and lane control signs on S.R. 520, I-5, and I-90 (Jacobson, 2012). The Virginia Department of Transportation (VDOT) has begun exploring the use of ATM methods. Virginia deployed a VSL system on the Capital Beltway at the Woodrow Wilson Bridge in an attempt to mitigate the impacts of construction lane closures (Fudala and Fontaine, 2010). VDOT has a project underway to deploy ATM along I-66.
Despite the interest in ATM, it is not necessarily clear how best to consider ATM as an
alternative to traditional capacity improvements. Potential opportunities for clarifying the role of ATM in the planning process include changes to policy documents (e.g., the surface transportation plan); funding programs (e.g., the Strategically Targeted Affordable Roadway Solutions [STARS] program); analysis methodologies (e.g., roadway safety assessments); and decision points where investments are selected (e.g., a metropolitan planning organization’s [MPO’s] Transportation Improvement Program [TIP]). VDOT’s Operations and Security Division (OSD) indicated an interest in determining types of conditions in which ATM projects might be successful and methods to incorporate these projects into planning and funding processes alongside traditional capacity expansion projects.
PURPOSE AND SCOPE
A high-level goal of VDOT is to improve safety and traffic flow as effectively and inexpensively as possible. The purpose of this study was to provide a better understanding of the capabilities of ATM techniques and determine the best ways to include the consideration of operations projects in the transportation planning process, thereby enhancing VDOT’s ability to produce more cost-effective mobility and safety improvements.
The objectives of the study were as follows:
1. Determine the operating characteristics and effectiveness of ATM techniques that
have been implemented in the field. 2. Generalize the results of deployments to define guidelines regarding the conditions
under which the use of ATM techniques may be appropriate; key considerations for deployment; the data needed to apply the guidelines; and methods to assess the effectiveness of projects.
3. Develop guidelines on how to integrate consideration of ATM in the traditional
planning and operations planning process. Such guidance would identify measures of effectiveness (MOEs) that would enable a side-by-side comparison of ATM projects and traditional capacity expansion projects. To make these MOEs viable, such guidance would include measurement methods, data sources, and a variety of MOEs that reflect the impacts of ATM on operations, safety, and cost.
3
The scope of the study was limited to past deployments of ATM; no new data were collected. The focus was on freeway applications rather than other facility types, such as signalized arterials. The focus of this report is on operational initiatives rather than demand management initiatives that are part of Active Transportation and Demand Management.
METHODOLOGY
Overview
Four tasks were carried out to achieve the study objectives:
1. Review available information on ATM.
2. Review best practices for including consideration of operational improvements in the planning process.
3. Develop guidelines for the use of ATM techniques in Virginia.
4. Develop a framework for further including ATM in the planning process.
Task 1: Review Available Information on ATM
First, past field deployments of ATM systems were reviewed. The focus was on systems that were intended to address congestion or safety-related problems. In the interest of brevity, systems that addressed weather-related safety issues were not comprehensively reviewed, although several deployments that have findings relevant to congestion mitigation are summarized. Although many simulation-based studies of ATM techniques are available, this task focused on results demonstrated through field deployments only. In many cases, simulation studies involve a number of assumptions that may not be valid for an actual field deployment.
Available studies were examined to determine the following:
• What traffic and geometric conditions were present at each site?
• What were the operational characteristics of the treatment? For example, how was the technology controlled and how was information communicated to the driver?
• What were the effects of the ATM treatment on traffic flow and safety?
• What was the level of compliance with the technique tested?
• How was the treatment evaluated? Are any specialized tools needed to perform the
evaluation?
4
Second, studies providing general guidance for selecting ATM techniques were reviewed.
Third, the effect of different ATM approaches when used in combination was examined.
Task 2: Review Best Practices for Including Consideration of Operational Improvements
in the Planning Process
The literature was reviewed to determine the best practices of states other than Virginia in which operational improvements have been successfully integrated into the planning process. Specific processes used to consider operational improvements; relevant performance measures that facilitate comparisons between operational improvements and capacity expansion projects; and other relevant best practices were reviewed.
Best practices for considering operational improvements in the planning process were obtained through (1) reviewing critiques of the conventional transportation planning process; (2) examining existing planning processes that incorporate operational elements; and (3) identifying those best practices that may be adapted to Virginia.
Task 3: Develop Guidelines for Application of ATM Techniques at Specific Sites in Virginia
The information obtained in Task 1 was synthesized to develop guidelines for applying various ATM techniques at specific sites in Virginia. The guidelines developed were separated into four categories:
1. basic guidelines for application, i.e., site conditions required for the particular ATM treatment to be effective
2. methods for performing a sketch planning analysis of the safety and operational
impacts of the ATM technique 3. methods for conducting a more detailed simulation analysis of the impacts of the
ATM technique 4. key considerations for ongoing monitoring and assessment of the safety and
operational benefits of the ATM deployment.
When data supported them, the guidelines were to contain specific thresholds or ranges of different criteria that would trigger consideration of an ATM treatment. Methods for performing the analysis were also to be described. Additional analyses that might be required to determine whether the ATM treatment would be beneficial were also to be noted.

5
Task 4: Develop a Framework for Further Including ATM in the Planning Process
In this task, a framework for including consideration of ATM techniques in traditional planning processes and operations planning was developed. The framework focused on ways to facilitate a side-by-side comparison of ATM projects and traditional capacity expansion projects. The framework was developed using one Virginia MPO’s Constrained Long-Range Plan (CLRP) and TIP as a model. Data for a hypothetical ATM project at a specific location in the region were obtained from internal databases available to VDOT staff, and appropriate MOEs were calculated. In this step, the researchers sought to frame ATM projects in a manner comparable to those in an existing CLRP and TIP. Because VDOT’s OSD has assumed intelligent transportation systems (ITS) planning and programming responsibilities for the entire VDOT state system, the finalized OSD processes were also explicitly examined.
Accordingly, the framework considered the following elements:
1. ways to consider ATM projects in regional comprehensive plans and the TIP 2. network condition data needed to show the potential impacts of the ATM projects 3. calculation of MOEs from potential network condition data sources 4. how to identify preliminary costs and potential funding sources.
RESULTS
Task 1: Review of Available Information on ATM Review of ATM Deployments Deployments of five ATM techniques were reviewed in this task:
1. VSL systems. VSL systems change the posted speed limit based on current traffic or roadway conditions. Sensors detect current traffic flow, and speed limits are altered to reduce speeds coming into the start of congestion. They also encourage more uniform speed distributions and can produce operational and safety improvements (Mirshahi et al., 2007).
2. Queue warning systems (QWSs). QWSs provide advanced notice to drivers of stopped or slowed traffic ahead. Sensors detect slow-moving or stopped traffic and activate variable message signs in advance of the end of the queue to alert oncoming drivers.
3. Hard shoulder running. VDOT has experience allowing travel on the shoulder on I-66 and I-264 during peak periods. In ATM systems that use hard shoulder running, the shoulder is dynamically opened to travel when congestion occurs. Thus, sensors determine when congestion is present and dynamically open and close the shoulder to

6
travel. This allows the system to be responsive to incidents, temporary work zones, special events, and other non-recurring conditions that could create congestion.
4. Dynamic junction control. Dynamic junction control systems dynamically change lane assignment between the mainline and on-ramps as demand fluctuates between the two routes. This allows lane capacity to be allocated dynamically between different routes. This builds on lane control signals that are commonly used in different ATM techniques.
5. Dynamic ramp metering. Ramp metering serves to improve mainline flow on the freeway by breaking up platoons of vehicles merging onto the highway from entrance ramps. Although ramp metering that operates using fixed time-of-day plans is not considered ATM, ramp metering methods that use adaptive algorithms that monitor mainline operations and use that information to adjust ramp meter timings (i.e., dynamic ramp metering) are considered an ATM technique.
The discussion of each ATM measure includes the following subsections:
• Installation characteristics. This section summarizes the physical characteristics of
the installations reviewed.
• Operational characteristics. This section summarizes available information on how the systems were operated.
• Effects on traffic flow and safety. This section summarizes the effect of the system on traffic flow and safety.
• Guidelines or business case for installation. This section reviews any guidelines that have been developed based on field experiences with the ATM technology.
Some of these subsections may be omitted if there are no relevant study results for a particular measure. Although each ATM technique was examined separately, it is common for multiple techniques to be deployed at the same site. In some cases, it was difficult to separate the effects of techniques that were deployed simultaneously. Variable Speed Limit Systems VSL systems have been widely used to improve safety and operations. The principle behind VSL systems is to post a speed limit that is appropriate for current conditions. This provides an opportunity to warn drivers of downstream conditions and encourage more uniform flow. VSL systems have been one of the more heavily researched ATM techniques, and a number of deployments have occurred, especially in Europe.
Installation Characteristics. VSL systems have been deployed in a number of locations, including Germany, the United Kingdom, the Netherlands, Australia, and the United States. These installations have slightly different characteristics, as described here.

7
In Germany, VSLs have been used since the 1970s (Mirshahi et al., 2007). It is estimated that VSL systems are installed on more than 800 km (497 mi) of road in Germany (Papgeorgiou et al., 2008). The German VSL systems use gantries placed over the road to display the VSLs, lane control messages, and pictographs representing congestion, when present. Spacing of overhead gantries varies depending on the roadway. Autobahn A5 uses a gantry spacing of 1 km (0.62 mi), and congestion pictographs are provided on either side of the structure for queue warning (Mirshahi et al., 2007; Tignor et al., 1999). On an 18-km (11.2 mi) stretch of Autobahn A9 near Munich, overhead gantries were placed at an average spacing of 1.8 km (1.12 mi) (Bertini et al., 2006). Inductive loop detectors spaced between 340 and 1750 m (1115 to 5741 ft) on this road were also used to provide detection.
In the United Kingdom, VSL systems have been installed on the M25 and M42 motorways. The M25 systems were installed in 1995. The M25 is a freeway with four lanes in each direction, and VSLs were placed on overhead gantries spaced at 1-km (0.62 mi) intervals (Tucker et al., 2005). Inductive loops were placed at 500-m (1,640 ft) spacings to monitor traffic and provide data used by the VSL system to determine the appropriate speed limits (Tignor et al., 1999). A QWS was also present (Tignor et al., 1999). The other U.K. VSL system is on a 17-km stretch of the M42 (Olyott, 2005). This road has an average annual daily traffic (AADT) of 120,000 vehicles, and a total of 50 gantries holding 250 signs were installed. Gantries were spaced every 0.5 to 1 km (0.31 to 0.62 mi) (Fuhs, 2010). In the Netherlands, VSLs have been used since 1981 (Mirshahi et al., 2007). Overhead VSLs and lane control signals are deployed every 500 m (1640 ft).
In Australia, a VSL system was developed for the Western Ring Road, which has an
AADT of approximately 100,000 vehicles, with 15% trucks (Beans, 2002). The system is implemented on a 26-km (16.16 mi) section of road that has a base speed limit of a 100 km/h (62.14 mph). Loop detectors were placed using an 0.5-km (0.31 mi) spacing.
There have been several VSL deployments in the United States. A VSL system was deployed on a 10-mile section of I-4 in Orlando, Florida, in 2008 (Atkins Consulting, 2009; Haas et al., 2008). This section had an AADT of approximately 200,000 vehicles. A total of 20 VSL signs were installed at 16 locations, and inductive loops were used to measure speed, volume, and occupancy at 30-sec intervals.
In August 2010, WSDOT installed VSL systems and QWSs on 7 miles of I-5 northbound
as it approaches downtown Seattle (Fuhs, 2010; Jacobson, 2012). Similar systems were installed on 8 miles of S.R. 520 eastbound and westbound in November 2010 and on I-90 eastbound and westbound in June 2011 (Jacobson, 2012).
The Minnesota DOT is also operating VSL systems, lane control signs, and a QWS on a
10-mile segment of I-35W in the Minneapolis–St. Paul area (Fuhs, 2010). Signs are spaced 0.5 mile apart (Arseneau, 2012). An extension of the system is planned on an 8-mile section of I-94 between downtown St. Paul and downtown Minneapolis in summer 2012 (Arseneau, 2012).

8
The Missouri DOT installed 65 VSL signs along 38 miles of I-270 and I-255 in St. Louis (Kianfar et al., 2010).
As of early 2012, VDOT had installed VSL systems on several bridge and tunnel facilities. These VSLs are used to reduce speeds primarily because of incidents and weather conditions and are reduced manually by operators. Two VSL systems are currently in development to mitigate safety issues related to foggy conditions on I-64 at Afton Mountain and I-77 at Fancy Gap, but they have not yet been deployed. Both of those planned systems will dynamically change speed limits based on available sight distance during fog events. To support those two deployments, VDOT’s Traffic Engineering Division (TED) issued a policy for VSL use in Virginia (VDOT TED, 2011b). Some key aspects of this policy include:
• a requirement that the VSL subsystem be fully integrated into the Traffic Operations Center’s (TOC) current operating software platform
• specifications for the appearance of the VSL signs and advance warning signs to alert drivers that they are entering a VSL zone
• guidance on the placement, spacing, and location of VSL signs.
General guidance on VSL algorithm design is also provided, but no specific methods to determine speed limits are defined. Requirements for the concept of operations are also presented.
Operational Characteristics. The manner in which the deployed VSL systems are operated and maintained varied significantly among locations.
In Germany, on Autobahn A9, the VSL system changes speed limits based on predefined speed-flow-density relationships (Bertini et al., 2006); no specific data on the algorithm were provided. Speeds on the A9 can vary between 60 and 120 km/h (37.28 to 74.56 mph), with decreases of 20 km/h (12.43 mph) being used. Poor weather conditions and incidents can also trigger VSL reductions. Use of combined speed-flow data to set VSLs has also been cited for another German VSL site (Papageorgiou et al., 2008). In the United Kingdom, the VSL system on the M25 motorway used a system termed the Motorway Incident Detection and Advanced Signaling (MIDAS) system to manage detectors on the VSL section (Tucker et al., 2005). Occupancy and speed are used to set VSLs and determine whether the QWS should be activated (Tignor et al., 1999). Speed limits could be set at 40, 50, or 60 mph. The 40 mph limit was used when queue protection was needed (Tucker et al., 2005). Speeds limits began to be gradually transitioned to lower speeds at least 1 mile upstream of congestion or incidents to give drivers time to adjust to lower speeds ahead (Fuhs, 2010).
Speeds on the M25 are enforced using automated speed enforcement (Fuhs, 2010). Cameras are placed throughout the section and are randomly activated for enforcement. An enforcement threshold of 10% above the posted speed plus 2 mph has been defined. High levels

9
of compliance with this threshold have been achieved, with 95% of drivers complying when the speed limit is 50 mph or higher and 84% complying when 40 mph is posted.
The U.K. deployments also used lane control arrows along with VSLs to alert drivers when a lane was blocked. One area of concern with this configuration relates to driver understanding of lane control arrows (Fuhs, 2010). A U.K. survey found that 25% of local drivers did not understand the meaning of lane use arrows. The study authors noted that education and outreach may be needed to fully attain the benefits of the system. In the Netherlands, the manner in which speed limits can change on the VSL systems was similar to that in other countries. In the Netherlands, the standard speed limit is 120 km/h (74.56 mph), but the speed limit can drop to 50, 70, or 90 km/h (31.07, 43.50, 55.92 mph) based on current conditions (Mirshahi et al., 2007).
In Australia, on the Western Ring Road, speed limits are varied between 50 and 100 km/h (31.06 and 62.14 mph) in 10-km/h (6.21 mph) steps (Beans, 2002). Speed limits cannot change more than 20 km/h (12.43 mph) between adjacent signs (Beans, 2002). Automated speed enforcement is used to enforce compliance, and speed limits are changed automatically.
With regard to VSL deployments in the United States, the Orlando, Florida, I-4 system
reduced the speed limit when a work zone, incident, bad weather, or congestion was present (Haas et al., 2008). Speeds had to be within 5 mph of the base speed limit before the speed limit was returned to normal. Congestion was classified as free flow, light congestion, or heavy congestion (Haas et al., 2008). A 30 mph limit was posted for heavy congestion, and a 40 mph limit for light congestion. The posted speed limit cannot change more than 10 mph between adjacent signs, so there was a gradual step down to lower speed limits from the base speed limit. Congestion thresholds were defined by occupancy ranges, and different thresholds were set for lowering and raising speed limits to limit oscillation between speeds (Atkins Consulting, 2009). For lowering speed limits, light congestion was defined as between 16% and 28% occupancy, and heavy congestion was defined as occupancy exceeding 28%. For raising speed limits, light congestion was defined as between 12% and 25% occupancy, and heavy congestion was defined as occupancy exceeding 25%. Occupancy thresholds had to be met for two consecutive minutes before a speed limit change was recommended. When these thresholds were met, operators in the traffic operations center were notified, and an operator had to approve speed limit changes.
The WSDOT system uses an 0.5-mile gantry spacing, and messages are shown on two
gantries upstream of any congestion (Fuhs, 2010). Messages are shown four gantries upstream of lane blocking incidents. Several issues were noted with overnight operations of the VSL system, so the algorithm had to be changed to increase smoothing of speed limits when the number of vehicles was low (Jacobson, 2012). The WSDOT deployment also allowed general purpose and HOV lanes to have different posted speed limits (Jacobson, 2012). The lowest automatic speed limit that could be posted was 35 mph, but it could be manually dropped by an operator to 30 mph (Jacobson, 2012). No targeted enforcement of the speed limits was performed (Jacobson, 2012).

10
With the Minnesota system (Fuhs 2010), messages were displayed two gantries upstream of regular congestion and five gantries upstream of incidents that blocked a lane. The speed limits were advisory only (Arseneau, 2012). The algorithm used to change the speed limits used the following procedure (Kwon et al., 2011):
• Collect speed and density data from all detector stations every 30 sec.
• Estimate the deceleration/acceleration rate between adjacent detector stations using a
linear rate.
• Identify starting stations and boundaries for each speed control zone using pre-defined thresholds based on acceleration/deceleration rates.
• Determine advisory speed limits for each VSL sign using a fixed deceleration rate
and the distance between signs. Specific details regarding the equations used to make these changes, as well as the thresholds, are provided by Kwon et al. (2011).
With the St. Louis, Missouri, system, speed limits varied from 40 to 60 mph in 5-mph increments and were updated every 5 min (Kianfar et al., 2010).
Maine has VSLs installed on portions of their interstate system, but speeds are lowered
only because of weather, crashes, special events, and construction (Belz and Garder, 2009). VSLs are not dynamically changed in response to congestion. The Maine system could display only a 45 mph speed limit, which had to be approved by the state police prior to system activation (Belz and Garder 2009).
Effects on Traffic Flow and Safety. Several studies evaluated VSL operational and safety impacts on the German Autobahn. On the A5 Autobahn, crash rates fell by 20% after VSL systems were installed and increased by 10% at a comparable site with no VSL system (Tignor et al., 1999). There was also a 67 percent decline in secondary crashes. Secondary crashes are generally defined as crashes that occur as a result of congestion caused by an initial primary crash, although the researchers did not specify any time or distance thresholds for identifying secondary crashes in this case. Reduced travel times, decreased fuel consumption, and lower emissions were also cited as benefits of the system (Tignor et al., 1999). The A5 Autobahn underwent several other significant safety improvements after VSLs were installed (Fuhs, 2010; Mirshahi et al., 2007). A 3% reduction in property damage only (PDO) crashes with light damage and a 27% reduction in PDO crashes with heavy damage occurred. A 30% reduction in injury crashes also occurred. For the A9 Autobahn, researchers found that the VSL system responded well to traffic but congestion and shockwaves were still present (Bertini et al., 2006).
One set of researchers used available detector data to examine the flow-speed-density
relationships on the German Autobahn when VSLs were in use (Papgeorgiou et al., 2008). They found that VSLs decreased the slope of the flow-occupancy diagram at undercritical conditions,

11
shifted occupancy to higher values, and enabled higher flows at the same occupancy in overcritical conditions. The speed-flow diagram showed that a 50 mph VSL clearly had a higher critical flow rate than when no VSL was posted, indicating that heavy flow could be sustained for a longer period before breakdown occurred. Although there was significant stochastic variation in flow and speed, the critical occupancy was about 5% higher with the VSLs active than when they were not.
A number of studies of the operational and safety effects of VSLs have also been performed in the United Kingdom. A 2-year study on the M25 found that the VSL system produced more even headways (Tignor et al., 1999). Results from the first year of operation showed a 28% reduction in injuries and a 25% reduction in PDO crashes. A 25% to 30% reduction in rear-end crashes was also observed. Data from the second year of operation showed that these results had been maintained. It was also estimated that the system increased capacity by 5% to 10%.
A subsequent study in 2005 also examined the M25 (Tucker et al., 2005). That study reported that the VSLs produced the following impacts:
• a neutral impact on travel time and travel time reliability • a 15% reduction in injury crashes • an estimated 2% to 8% reduction in emissions • an estimated fuel consumption reduction of 10% • a 1.5% increase in throughput • a 5% improvement in speed limit compliance.
Another analysis conducted using 7 years of data after the M25 VSL deployment began
showed a 10% to 20% reduction in injuries (National Audit Office, 2004). However, this report noted that the motorway was widened on either end of the section during the study period, so the volumes fluctuated during the study period. This was not mentioned in other studies, and may serve to explain some of the positive results reported in other studies. A subsequent expansion of M25 VSLs by 8 km (4.97 mi) found that travel times did not change significantly but injuries fell by 10% on the new section.
Several other results were reported from deployments in other European countries. A work zone VSL system was installed on M3 around Copenhagen, Denmark (Mirshahi et al., 2007). Incidents did not increase during construction despite reduced lane widths at that site.
Studies of VSL systems in the Netherlands showed that throughput increased between
3% and 5% (Mirshahi et al., 2007). Collisions were also reduced by about 16%. A study at 4 test locations in the Netherlands found a 20% to 30% reduction in NOx and a 10% reduction in particulate matter below 10 microns (PM10) when VSLs were implemented (Fuhs, 2010).
Several studies have evaluated the effects on traffic flow and safety of VSL systems in
the United States. The Orlando VSL system was evaluated by looking at speed data from 4 P.M.to 6 P.M. for 1 month before VSL activation as compared to 1 month after VSL activation (Atkins Consulting, 2009). The data showed that speed changes were more strongly correlated

12
with changes in occupancy than changes in the posted speed limit. The evaluators concluded that the VSL had no significant impact on speed compliance or mean travel speed. A crash analysis was also conducted, but no conclusions could be drawn because of limited data.
In Washington, evaluation results were more limited. There was a 6 month time lag
between when a crash actually occurred and when it was entered into the DOT crash database, so WSDOT was unable to make definitive assessments of the safety impact of the system as of early 2012 (Jacobson, 2012). Preliminary analysis examined the ATM segment of I-5, a segment immediately downstream, and 3 other urban segments further removed from the ATM segment. The preliminary 2011 trends showed that collisions at the ATM segment and the segment immediately downstream declined, whereas crashes at the other 3 segments increased (Jacobson, 2012). These are preliminary data, however, and no firm conclusions can be drawn. The WSDOT deployment did identify some safety-related benefits in terms of work zone and incident management since speed limits and lane control signs could be used to supplement traditional traffic control.
Minnesota conducted a preliminary evaluation of the safety and operational effects of
their system (Kwon et al., 2011). Measures were compared for 3 months after the VSL system was activated to the same 3 months during the year before the VSL system was installed. Analysis of the detector data showed that the average maximum deceleration declined by 19.6% with the VSL, indicating smoother transitions between flow regimes. Travel times did increase by 13.3% with the VSL, however, because of posting slower speeds while transitioning from free flow to congested flow. It was also estimated that throughput increased by 6.1% at a known bottleneck because of reduced shock wave impacts. Crashes were not evaluated in this study.
Data from the St. Louis deployment were evaluated using 150 days of data before and
after the deployment (Kianfar et al., 2010). Conditions on typical weekdays were examined using 3 point sensors, and the speed-occupancy-flow relationships were examined before and after the VSLs were activated. The results indicated that the speed-flow-occupancy curve changed after the VSLs were activated, although direction of the change was not consistent at the three sites. Capacity increased at one site, declined at another, and remained the same at the third. The same trends were observed in mean speed. Speed variance did decline at all sites, however.
Analysis of compliance with the Maine VSLs during poor weather showed low compliance to the 45 mph limit (Belz and Garder, 2009). The researchers did note, however, that the system was often left active when it was not warranted which may have eroded confidence in the system. A small survey of drivers was also conducted to assess driver perceptions of the system. Of 62 drivers surveyed, only 56% found the system to be useful and only 45% said they altered their speed in response to the VSLs. The researchers recommended that speed limits in the future be set based on available stopping sight distance and surface conditions.
Guidelines or Business Case for Installation. An analysis of crash costs on the A5
Autobahn in Germany estimated that the system produced a $4 million savings in reduced crash costs (Tignor et al., 1999). The system was expected to pay for itself in these benefits in 2 to 3 years.

13
Based on experiences on the M25 in the United Kingdom, researchers recommended installing VSLs only at sites with recurring congestion (Tucker et al., 2005). The researchers noted that delays could increase for vehicles that exceed the speed limit if they are brought into compliance with the posted speed. The authors also noted that a benefit-cost ratio of 3.9 was obtained for a 10-km (6.21 mi) road with an AADT of 150,000 and benefits assessed over a 60-year span (Tucker et al., 2005).
The WSDOT deployment provides an indication of potential costs for a U.S. deployment
of VSLs. Average costs for the WSDOT project were $3.2 million per directional mile for three-lane sections and $4 million per mile for five-lane sections (Fuhs, 2010). Queue Warning Systems QWSs are used to provide advance warning of stopped or slowed traffic and serve primarily as a safety countermeasure. In Europe, QWSs are often implemented in conjunction with other ATM techniques such as VSLs. In these cases, the sensors deployed are used to support both the VSL and QWS functions, and the QWS is installed on overhead gantries with VSLs and lane control signals.
Installation Characteristics. A number of QWSs have been installed in Europe and internationally. Some deployments include:
• Belgium: A QWS was installed on the E313 between Antwerpen and Hasselt (Wiles
et al., 2002). A total of 18 VMSs were installed at 500-ft spacings to provide queue warning.
• Denmark: A QWS was installed near Aalborg (Wiles et al., 2002).
• The Netherlands: The Netherlands has deployed QWSs on 1000 km of roadway
(Mirshahi et al., 2007).
• Norway: A QWS was installed on the E18 in Oslo (Wiles et al., 2002). Detection was accomplished using eight video detection units.
• United Kingdom: A QWS was installed on 52 miles of the M1 (Wiles et al., 2002).
A QWS was also installed with VSLs on the M42 (Fuhs, 2010).
• Japan: Another system was installed on the Metropolitan Expressway in Tokyo (Wiles et al., 2002). The system had 10 VMSs, and used ultrasonic detectors placed every 300 m.
Documented U.S. deployments of QWSs are more limited. A QWS consisting of a static
sign with congestion-activated flashers was tested at two congestion-prone sites in Houston (Pesti et al., 2008). Both sites involved high volumes of exiting traffic that spilled back onto the freeway.

14
Operational Characteristics. QWSs generally rely on speed and occupancy thresholds to determine when to activate the system. A Belgian QWS on the E313 used video detection to measure speed and occupancy (Wiles et al., 2002). Queue warnings were activated when the occupancy exceeded 50% and the speed fell below 50 km/h (31.07 mph) in one or more lanes. The Aalborg, Denmark, QWS was activated when speeds fell below 50 km/h and was displayed prior to the end of queue (Wiles et al., 2002).
An evaluation of the Norway QWS helped fine-tune occupancy thresholds (Wiles et al.,
2002). The QWS was initially activated when speeds fell below 50 km/h (31.07 mph) and occupancy was higher than 30% (Wiles et al., 2002). These thresholds had to be exceeded for at least 15 sec to activate the system, and the system de-activated if the thresholds were not met for 20 sec. Subsequent evaluations determined that the occupancy threshold should be raised to 50% to improve performance. Several systems have been deployed in the United Kingdom. On the M1, the QWS was activated when speeds dropped below 50 km/h (31.07 mph) (Wiles et al., 2002). On the M42, queue warning is provided on lane control signals upstream of a crash (Fuhs, 2010). Lane control signals 4 gantries upstream of a crash are used to alert drivers of the incident. The first two signs display a reduced speed, and then two diagonal arrows move traffic out of the affected lane.
The Tokyo system examined speed and occupancy every 1 min to determine congestion
(Wiles et al., 2002). In the United States, the Houston QWS flashers were activated if 3 consecutive vehicles
were detected traveling below 25 mph (Pesti et al., 2008).
Effects on Traffic Flow and Safety. Evaluations of the benefits of QWSs have generally focused on either directly or indirectly measuring safety improvements. A study of a system in Finland showed that the QWS reduced speeds by 2.4 mph in the right lane and 3.4 mph in the left lane (Wiles et al., 2002).
In the Netherlands, safety assessments conducted in 1983 and 1996 showed an increase in
traffic stream stability (Mirshahi et al., 2007); a 15% to 25% reduction in primary crashes, and a 40% to 50% reduction in secondary crashes when implemented in conjunction with a QWS.
An evaluation of the QWS in Norway found speed reductions of between 1.8 and 3.2
mph following QWS activation (Wiles et al., 2002). Brake light activations also increased between 1.5% and 12.6%.
In the United Kingdom, the QWS on the M1 produced a number of safety benefits (Wiles
et al., 2002), including
• 29% reduction in single-vehicle crashes • 20% reduction in multi-vehicle crashes • 50% reduction in secondary crashes.
15
With the Tokyo system, rear-end crashes declined 4% after implementation (Wiles et al., 2002).
In the United States, Pesti et al. (2008) found that a Houston system produced a 2% to 6% reduction in sudden braking and a 2 to 3% reduction in erratic maneuvers. There was no significant difference in mean speed, but speed variance declined at the beginning of the congested period when the QWS was active.
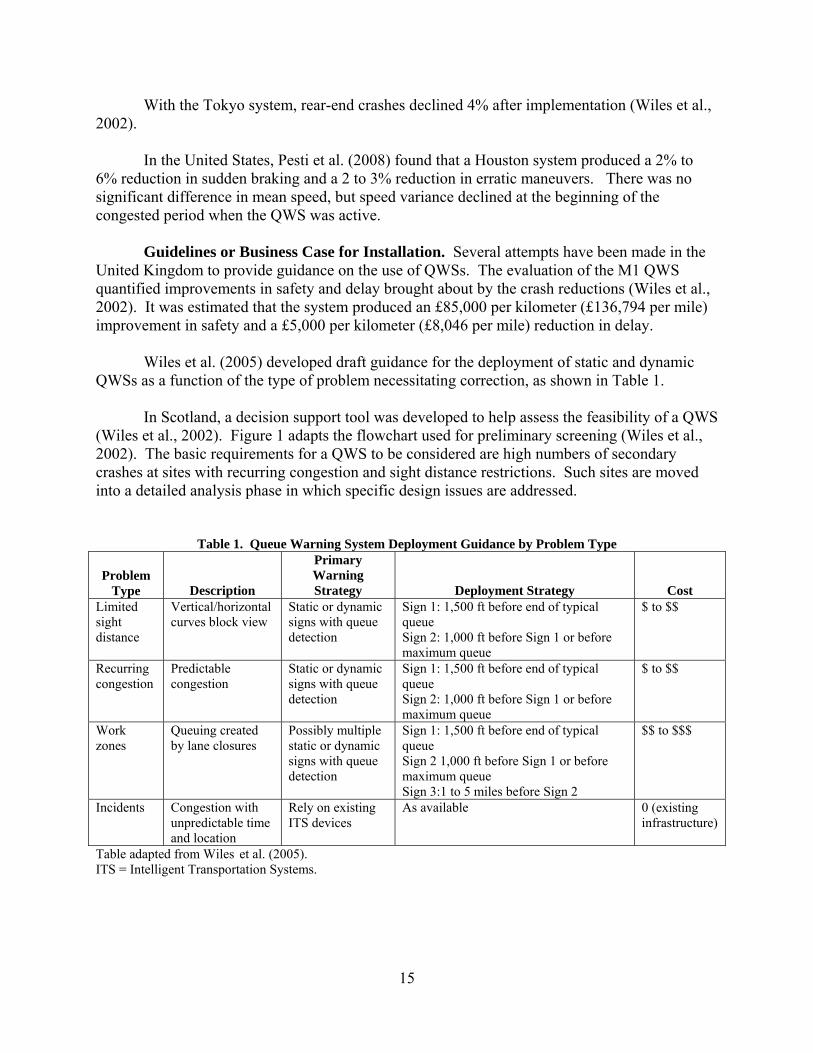
Guidelines or Business Case for Installation. Several attempts have been made in the United Kingdom to provide guidance on the use of QWSs. The evaluation of the M1 QWS quantified improvements in safety and delay brought about by the crash reductions (Wiles et al., 2002). It was estimated that the system produced an £85,000 per kilometer (£136,794 per mile) improvement in safety and a £5,000 per kilometer (£8,046 per mile) reduction in delay. Wiles et al. (2005) developed draft guidance for the deployment of static and dynamic QWSs as a function of the type of problem necessitating correction, as shown in Table 1.
In Scotland, a decision support tool was developed to help assess the feasibility of a QWS (Wiles et al., 2002). Figure 1 adapts the flowchart used for preliminary screening (Wiles et al., 2002). The basic requirements for a QWS to be considered are high numbers of secondary crashes at sites with recurring congestion and sight distance restrictions. Such sites are moved into a detailed analysis phase in which specific design issues are addressed.
Table 1. Queue Warning System Deployment Guidance by Problem Type
Problem Type
Description
Primary Warning Strategy
Deployment Strategy
Cost Limited sight distance
Vertical/horizontal curves block view
Static or dynamic signs with queue detection
Sign 1: 1,500 ft before end of typical queue Sign 2: 1,000 ft before Sign 1 or before maximum queue
$ to $$
Recurring congestion
Predictable congestion
Static or dynamic signs with queue detection
Sign 1: 1,500 ft before end of typical queue Sign 2: 1,000 ft before Sign 1 or before maximum queue
$ to $$
Work zones
Queuing created by lane closures
Possibly multiple static or dynamic signs with queue detection
Sign 1: 1,500 ft before end of typical queue Sign 2 1,000 ft before Sign 1 or before maximum queue Sign 3:1 to 5 miles before Sign 2
$$ to $$$
Incidents Congestion with unpredictable time and location
Rely on existing ITS devices
As available 0 (existing infrastructure)
Table adapted from Wiles et al. (2005). ITS = Intelligent Transportation Systems.

16
Figure 1. Queue Warning System (QWS) Screening Tool From Scotland. Adapted from Wiles et al. (2002). Hard Shoulder Running Although VDOT has experience operating shoulder lanes as travel lanes on I-66 and I-264, the operation of these shoulder lanes differs substantially from the more active management of shoulder travel lanes in Europe. In Europe, shoulders are dynamically opened as congestion forms, rather than on a fixed time-of-day basis. European shoulder lanes have also typically been installed in conjunction with other ATM measures, such as VSL and QWSs. In both Europe and the United States, the use of shoulder travel lanes has usually improved operations (Kuhn, 2010), but safety benefits in Europe have been much more conclusive (Kuhn, 2010). This is perhaps attributable to the coordinated effects of implementing shoulder lanes with other ATM measures.
Installation Characteristics. A number of European countries dynamically open shoulder lanes for use as travel lanes. The M42 Motorway in the United Kingdom has been one of the more thoroughly researched deployments of hard shoulder running. Hard shoulder

17
running was implemented on a 17-km (10.56 mi) stretch of the M42 in 2006 (Olyott, 2005; Chase and Avineri, 2008). This deployment includes installation of inductive loops on the shoulder every 100 m (328.10 ft), and refuge areas that are available when shoulders are open. The refuge areas have a 25 m (82.02 ft) entrance taper and a 45 m (147.64 ft) exit taper (Kuhn, 2010). More than 200 CCTV cameras were also installed to ensure that the shoulder is clear prior to opening it to travel. There were also VSLs on this section (Sisiopiku et al., 2009). The AADT of this section of road was 120,000 vehicles per day. Emergency pullouts with call boxes are provided on the M42 every 1,600 ft (Fuhs, 2010). In the case of hard shoulder operations in the U.K., vehicles traveling on the shoulder are forced to exit at interchanges and cannot travel through on the mainline (Kuhn, 2010).
Another hard shoulder running deployment was installed at the junction of the A3 and A86 highways in Paris over a 700-m (2297 ft) section (Toffin, 2004). At this site, a four-lane freeway merges with a two-lane facility and combines into a four-lane section. Hard shoulder running was instituted to allow a five-lane cross section. The AADT of the combined section was 120,000 vehicles per day. Hard shoulders have been deployed in the Netherlands on seven sections totaling 25 km (15.53 mi) since 1996 (Chase and Avineri, 2008). Emergency pulloffs are provided every 500 to 1000 m (0.31 to 0.62 mi) on those roads (National Audit Office, 2004). Hard shoulders can occur on the right or left shoulder, and VSLs are used to reduce speed limits when travel is permitted on the hard shoulders (Mirshahi et al., 2007). Several additional features are installed when hard shoulder running is permitted, including overhead lane control signs, emergency refuge areas, VMSs at junctions, CCTV cameras, incident management programs, and roadway lighting.
More than 200 km (124.27 mi) of sections that permit dynamic hard shoulder running were reported in Germany in 2008 (Sisiopiku et al., 2009). VSL systems post reduced speed limits when travel on the shoulders is permitted (Mirshahi et al., 2007). This technique has been in use in Germany since the 1990s, with the first deployment occurring on the A4 Autobahn near Cologne (Mirshahi et al., 2007). CCTV is also used to ensure that disabled vehicles are not blocking the shoulder. Emergency pulloffs are provided every 500 to 1000 m (0.31 to 0.62 mi) (National Audit Office, 2004). Some countries also perceive continuous roadway lighting to be an important required feature when allowing hard shoulder running. Germany and the Netherlands had found continuous lighting to be beneficial (International Technology Scanning Program, 2010). Over time, the United Kingdom has found the continuous lighting is not essential, however (International Technology Scanning Program, 2010).
Operational Characteristics. On the M42, hard shoulders are open only when there is a probability of flow breakdown and the maximum speed limit that can be posted when the shoulder is open is 50 mph (Chase and Avineri, 2008; Mirshahi et al., 2007). Opening of the hard shoulder is not automatic on the M42 since an operator had to verify that the shoulder was clear prior to opening the lane (Fuhs, 2010).

18
The Paris system uses video detection to identify the presence of stopped vehicles on the shoulder, and retractable barriers were used to open or close the shoulder to travel (Toffin, 2004). The barriers were placed using 10 to 20 meter (32.81 to 65.62 ft) intervals between barriers, and they could be deployed manually or dynamically based on traffic demand. Overhead lane signs also indicated whether the shoulder was open for travel. In Germany and the Netherlands, the decision to open the shoulder to traffic is made using an automated algorithm (Kuhn, 2010). No operator intervention is required.
Effects on Traffic Flow and Safety. European experiences have shown that dynamic use of the shoulder can create significant improvements in operations. The U.K. M42 hard shoulder running system in the United Kingdom has been evaluated in a number of ways. Researchers conducted a series of interviews with stakeholders to assess the advantages and disadvantages of hard shoulder running on the M42 (Chase and Avineri, 2008). Principal concerns expressed during the interviews were related to the safety of motorists whose vehicles became disabled. Concerns were also expressed about acceleration distances out of the emergency pulloffs. In the first 6 months of operation, M42 travel times were estimated to have declined by 26% in one direction and 9% in the other (Sisiopiku et al., 2009). Crashes fell from an average of 5 per month to 1.5 per month during this time period, although this was based on limited data. Emissions and fuel consumption were also estimated to have been reduced by 10% and 4%, respectively. The combination of VSLs and hard shoulder running on the M42 was estimated to have increased capacity by 7% (Fuhs, 2010). Several studies reported safety benefits through the use of hard shoulder running in the Netherlands. A 50% reduction in crashes was reported when hard shoulder running and reduced speed limits were in place (National Audit Office, 2004). Another study reported that crashes declined at four sites where hard shoulder running was deployed, with reductions in crashes ranging from 5% to 55% (Mirshahi et al., 2007). Positive effects have been observed in the German deployments (Chase and Avineri, 2008). The Gottingen deployment experienced a slight decrease in crashes. The Cologne system saw a decrease in congestion of between 68% and 82%; the average speed increased by 9%, and the number of congestion-related crashes fell significantly. Several studies have attempted to define the potential capacity improvement that could be created by opening shoulder lanes to travel. An evaluation of the Paris system showed that the overall capacity of the road increased by 1000 veh/hr in one direction, and 660 veh/hr in the other direction (Toffin, 2004). In the Netherlands, the capacity of the road was estimated to have increased by between 7% and 22% (Mirshahi et al., 2007). Another study of a hard shoulder running deployment on an Autobahn near the city of Hessen showed that allowing hard shoulder running increased the capacity of a three-lane section by nearly 20% to 7,000 veh/hr (Sisiopiku et al., 2009).
Guidelines or Business Case for Installation. The economic costs of the M42 hard shoulder running system were quantified in several studies. An economic analysis of the hard shoulder project on the M42 found that the cost of the ATM project was 20% of the estimated

19
cost to widen the road by one lane (Sisiopiku et al., 2009). The estimated cost per mile for VSLs and hard shoulder running for the M42 was $18 million per mile (Fuhs, 2010).
Germany performs a benefit-cost analysis using a custom computer program that analyzes a number of factors related to the potential viability of hard shoulder running at a site (Mirshahi et al., 2007). Some of the factors that are accounted for include capital costs, maintenance costs, safety effects, impact on incidents, impacts on speed, and impacts on emissions. Average benefit-cost numbers were not reported, however.
Sisiopiku et al. (2009) defined some general design requirements that must be satisfied prior to using shoulders as travel lanes. They determined that the shoulder should have the following characteristics:
• have the same width as a full travel lane and be designed similarly to a regular lane • have no adverse superelevation • be continuous • be able to withstand heavy vehicle loading • be composed of the same material as the regular lanes.
One project estimated the cost for operating a hard shoulder running lane in the
Birmingham, Alabama area (Sisiopiku et al., 2009). The estimated operating costs were $2.244 million per year, with a benefit-cost ratio of between 3 and 13 depending on the assumptions used in the CORSIM model to evaluate operational benefits. Dynamic Junction Control
Dynamic junction control involves dynamically opening and closing lanes at an interchange to improve total throughput through the interchange. Overhead lane control signs are used to move vehicles out of the rightmost lane on the mainline to facilitate merging traffic from a high volume on-ramp. This would be done dynamically to more evenly distribute delay between the mainline and a high volume on ramp.
Although there is information in the literature on the concept of dynamic junction control (Mirshahi et al., 2007), limited information on its effectiveness and operation was found. One study reported on a pilot test that occurred in the Netherlands (Fuhs, 2010). That study reported that mean travel times could be reduced by 7% to 8%. Times declined by 4% on the mainline and 13% on the ramp. No other specific information on the design and operation of dynamic junction control systems could be located.
The only example from the United States that was found was on I-35W in Minneapolis
(Arseneau, 2012). In this case, in-pavement lighting was used to ease merges around a priced dynamic shoulder lane. Winter maintenance activities had a negative impact on the in-pavement lighting used to perform the dynamic junction control, however, resulting in large maintenance issues with the system (Arseneau, 2012).

20
Dynamic Ramp Metering To be considered an ATM technique, a ramp metering system must dynamically adjust timings based on current system conditions. A number of traffic responsive ramp metering techniques have been developed and implemented and can generally be categorized as either local or coordinated algorithms. Local algorithms examine conditions only in the immediate vicinity of the ramp, whereas coordinated algorithms examine conditions over a larger geographic footprint to determine how to optimize ramp meters over the entire system. An overview of ramp metering algorithms was provided by Zhang et al. (2001). Key traffic responsive ramp metering algorithms that have been implemented and tested are described in this section. Many other algorithms have been developed, but they have not been implemented as broadly in the field.
Installation and Operational Characteristics. In the case of traffic responsive ramp metering, a number of methods to operate the ramp meters have been developed. These methods are often tied directly to a specific installation, so discussion of the installation and operational characteristics are combined in this section. Local ramp metering algorithms that have been developed include:
• Asservissement Lineaire d’entrée Autoroutiere (ALINEA). ALINEA is a feedback-
based ramp metering strategy that has been implemented at many locations in Europe (Papageorgiou et al., 1997). The ALINEA algorithm uses ramp flows from the previous time interval, downstream mainline occupancy, and a defined critical occupancy to determine desired ramp flow rates during the current interval. This is done for each individual ramp, so this serves as a local algorithm. Notable deployments of ALINEA have occurred on the Boulevard Peripherique in Paris and the A10 West Motorway in Amsterdam (Papgeorgiou et al., 1997). ALINEA systems have been in place in both of these locations since the early 1990s.
• Zone algorithm. In the zone algorithm, freeways are divided into multiple zones; the upstream end of the zone is at free flow, and the downstream end is a bottleneck (Zhang et al., 2001). For each zone, the algorithm sets metering rates for each ramp to maintain the mainline below a defined density level. This algorithm has been in use in the Minneapolis–St. Paul area for some time.
Key coordinated algorithms that have been developed include:
• System-Wide Adaptive Ramp Metering (SWARM). The SWARM algorithm is a
coordinated ramp metering algorithm that was first implemented by Caltrans in the 1990s (Monsere et al., 2008). SWARM divides the network into contiguous freeway sections bounded by bottleneck locations. Each section may contain multiple on and off ramps. SWARM has two competing modes of operation, which are both evaluated: global and local. The global method forecasts densities at the bottlenecks, whereas the local method focuses on conditions near the ramp being analyzed. Metering rates are calculated using both the global and local approaches, and the

21
more restrictive of the two is applied. The SWARM algorithm was implemented on the Portland, Oregon, freeway network in 2005 (Monsere et al., 2008).
• Helper algorithm. The helper algorithm was implemented in Denver and includes
centralized control to monitor and override locally determined metering rates (Lipp et al., 1991). Between one and seven ramps are grouped together, and one of six preset metering rates is used depending on local conditions. If a ramp is at the minimum metering rate and the occupancy on the ramp exceeds a preset value, than it is classified as a critical ramp. The ramp metering rate on the critical ramp is then increased by one level and the upstream ramp metering rate is reduced by one level. This is done iteratively for all ramps, starting with the ramp furthest downstream.
• Bottleneck algorithm. This algorithm computes metering rates based on both local
conditions and global conditions on the network (Jacobsen et al., 1989). The more restrictive of the two options is then used. This algorithm was implemented on I-5 north of the Seattle downtown area in 1981.
This is not a comprehensive list of demand responsive ramp metering algorithms; information on other algorithms was provided by Zhang et al. (2001).
Effects on Traffic Flow and Safety. The ALINEA algorithm has been evaluated several times both at isolated locations and when implemented on a series of adjacent ramps. One of the earliest evaluations focused on the Brancon entrance ramp of the Boulevard Peripherique in Paris (Papageorgiou et al., 1997). Several ramp metering strategies were evaluated, and ALINEA was found to produce the lowest mainline travel time, lowest ramp waiting time, highest mainline mean speed, and shortest congestion duration. A later study compared ALINEA to a British algorithm at the same ramp and found that ALINEA produced a 7.8% increase in mainline travel speed over the other algorithm. Another study at the Coentunnel ramp on at A10 West Motorway in Amsterdam found that ALINEA increased mainline speeds by 8% over what was observed without meters (Papageorgiuou et al., 1997). Following the evaluations on single ramps, the use of ALINEA was expanded to multiple consecutive ramps on both the Boulevard Peripherique and the A10 West Motorway. On the Boulevard Peripherique, ALINEA was applied to a 6-km section (3.73 mi) which consisted of three on ramps with ALINEA and two non-metered ramps (Papageorgiou et al., 1997). ALINEA was found to produce a 5% to 7% improvement in mainline travel speeds over a no ramp meter alternative. On the A10 West Motorway, ALINEA was applied at four consecutive ramps (Papgeorgiou et al., 1997). ALINEA was found to produce an 18.8% reduction in time lost versus a no ramp meter alternative.
The effectiveness of the zone algorithm was evaluated during an 8-week period in the fall of 2000 when all ramp meters in Minneapolis were shut down (Cambridge Systematics, Inc., 2001). A before and after study showed that congestion and crash rates increased following the shutdown of the ramp meters. On average, freeway volumes declined by 9% and throughput declined by 14% during peak periods. Changes in travel patterns were also observed as the freeways became more congested. Increased freeway congestion was also determined to make

22
the freeway twice as unreliable as when the ramp meters were in operation. Crash rates on the freeways and ramps also increased by 26% following deactivation of the ramp meters. The conclusion was that the ramp meters created significant system wide benefits, with an overall benefit-cost ratio of 15:1.
A study of the bottleneck algorithm was performed on I-5 in Seattle (Jacobsen et al., 1989). The results of the study were very positive. Even though mainline volumes increased by between 62% and 86%, travel times on the mainline decreased by 48% as compared to the no ramp meter case. Crash rates also declined by 39%, likely as a result of improved flow. Ramp delays were typically less than 3 min. The operational effects of the SWARM algorithm was evaluated on I-205 and Oregon 217 during the morning and afternoon peak periods using archived ITS data (Monsere et al., 2008). Results from the evaluation were mixed. On I-205, delays declined between 7.9% and 18.1%, and the standard deviation of delay also declined. On OR 217, delays increased by between 34.9% and 55.0% following the implementation of SWARM, and the standard deviation of delay increased as well. The researchers hypothesized that the higher delays on OR 217 were attributable to tighter ramp spacings and numerous auxiliary lane additions and drops. Also, the SWARM metering rates generally permitted higher flows onto OR 217 than the pretimed meters, which contributed to delays.
Guidelines or Business Case for Installation. The SWARM evaluation in Portland noted the importance of having a robust communications system and high-quality sensor data when applying a traffic responsive ramp meter system (Monsere et al., 2008). The SWARM controllers polled sensors and issued commands to signal controllers every 20 sec. This resulted in a high communications load on the system, causing commands to be queued and not received by the signal controllers in a timely manner. As a result, the percentage of communications failures increased from 1.5% with a pre-timed ramp metering system to 14% after SWARM was implemented. This may have impacted the effectiveness of the system. General Guidance for Selecting ATM Techniques
Several studies have attempted to develop general guidance for the selection of different ATM techniques. These have typically taken the form of high level discussions of the potential benefits of different methods, rather than specific quantitative guidelines. For example, Mirshahi et al. (2007) developed a matrix of potential benefits of different ATM techniques, shown in Table 2.
For hard shoulder running:
• deploy with VSLs • uniform treatments through entrance and exit ramps • adequate installation of sign gantries • placement of lane control signals over each lane • uniform marking of shoulders • CCTV cameras

23
• provision of pullouts for minor incidents with detection • lighting to enhance visibility of shoulder • incident management capability and incident detection • connection to TOC.
Table 2. Potential Benefits of Active Traffic Management Strategies
Strategy
Potential Benefit
Incr
ease
d T
hro
ugh
pu
t In
crea
sed
Cap
acit
y
Dec
reas
e in
Pri
mar
y In
cid
ents
Dec
reas
e in
Sec
ond
ary
Inci
den
ts
Dec
reas
e in
Inc
iden
t S
ever
ity
Incr
ease
d S
pee
d U
nif
orm
ity
Dec
reas
ed H
ead
way
s
Mor
e U
nif
orm
Dri
ver
Beh
avio
r
Incr
ease
d T
rip
Rel
iab
ilit
y
Del
ay O
nse
t of
Bre
akdo
wn
Red
uct
ion
in N
oise
Red
uct
ion
in E
mis
sion
s
Red
uct
ion
in F
uel
Con
sum
pti
on
Variable speed limits Hard shoulder running Queue warning system Dynamic junction control Table adapted from Mirshahi et al. (2007).
For queue warning systems:
• deployment with VSLs • dense sensor deployment • at least one visible gantry at all times • expert system • uniform signing • TOC connection.
For dynamic junction control:
• junction of two major ramps • expert system to deploy based on current conditions • CCTV camera monitoring • lane control signals over each lane • uniform signing • bypass lane for exempt users • need TOC connection.
Complementary ATM Techniques
Many ATM techniques can be used together in a complementary manner. Fuhs (2010) developed a matrix (Table 3) that showed when several approaches are complementary.

24
Table 3. Compatibility of Active Traffic Management Techniques
Technique
Technique Variable
Speed Limits
Queue Warning System
Hard Shoulder Running
Dynamic Junction Control
Dynamic Ramp
Metering Variable Speed Limits N/A Queue Warning System N/A Hard Shoulder Running N/A Dynamic Junction Control N/A Dynamic Ramp Metering N/A
Table adapted from Fuhs (2010). Checkmark indicates compatibility.
Fuhs (2010) also provided some high level considerations for screening potential
locations for various ATM measures. It was suggested that the following factors be reviewed when the start and end point of a proposed system are determined:
• travel patterns • freeway geometrics • observed locations with recurring congestion or persistent queuing • locations with higher than expected crash rates.
Further, Fuhs (2010) suggested that existing equipment, detection, and systems should be
reviewed to ensure that they can be used for their original intent and also for the ATM application. Since many ATM approaches require a high level of detection, the ability to maintain this detection is critical for many applications. Communications availability and bandwidth should also be assessed.
Fuhs (2010) also identified several key issues that need to be addressed prior to the deployment of ATM techniques. First, continued operations and maintenance funding is critical. This includes funding for continuous TOC staffing as needed. Second, there is a need to focus on educating the driving public about new ATM measures. Third, coordination with emergency responders on enforcement protocols and procedures when strategies such as hard shoulder running are in use is important. Summary of Key Features of ATM Techniques Reviewed Select aspects of deployments of VSLs, QWSs, hard shoulder running, and dynamic ramp meters are summarized in Table 4. Dynamic junction control is not included because of limited data on its effectiveness. These techniques can all also be potentially deployed in combination. This information was used to develop specific guidelines for application of ATM.

25
Table 4. Summary of Typical Characteristics of Variable Speed Limits, Queue Warning Systems, Hard Shoulder Running, and Dynamic Ramp Metering Characteristica Variable Speed Limits Queue Warning Systems Hard Shoulder Running Dynamic Ramp Metering Installation characteristics
• Signs posted on overhead gantries at spacings of 0.5 to 1 km (0.31 to 0.62 mi)
• Inductive loops used for detection at spacings of 0.5 to 1 km
• Lane control signs commonly implemented on gantries
• Signs posted on overhead gantries or roadside installations at varying spacings; may be implemented with VSLs
• Emergency refuge areas with detection may be used; refuge areas spaced every 0.5-1 km
• CCTV and/or shoulder detection needed to determine if shoulder can be used for travel
• Overhead lane control signs used to indicate appropriate travel lanes; supplemental barriers sometimes present
• Need mainline detection to determine whether shoulder should be opened to travel
• Detection needs on ramps and mainline vary depending on specific algorithm used
• Good sensor data quality and strong communications needed to ensure effectiveness
Operational characteristics
• Changing speed thresholds based on speed-occupancy relationships commonly used
• Incidents and weather can also trigger reductions
• Reduced speeds typically posted 1 to 2 miles upstream of reduced speeds
• Automated enforcement key aspect of European deployments
• Speed and occupancy thresholds generally used to trigger queue warnings
• Shoulders often opened only when speed limits reduced
• Local and coordinated options available
• Operations vary depending on specific algorithms used
Effects on safety • Property damage only crashes declined by up to 30%
• Injury crashes declined by 10%-30%• Secondary crashes declined by 2/3
• 29% reduction in single-vehicle crashes
• 20% reduction in multi-vehicle crashes• 15%- 25% reduction in primary
crashes; 40%-50% reduction in secondary crashes
• Crashes fell 5%-70%
• Crash reductions possible if congestion is reduced on mainline, with 1 study reporting 39% reduction in crash rate
Effects on operations
• More even headways• Higher critical flow rates• 1.5%-10% increase in capacity• Inconsistent impacts on travel times
and speed compliance
• Speed reductions 0-3.4 mph• Decline in speed variance
• Travel times declined 9%-26%• Capacity increased 7%-22%• Speeds increased 9%
• Speed improvements on mainline between 5% and 8% typical
• Delays reduced by up to 18.1%• Can produce limited or negative
effects depending on siteAreas of application
• Most appropriate in areas with significant recurring congestion because of economic cost of system
• Most appropriate at areas with recurring queuing and many secondary crashes so that signs can be located appropriately; especially useful when sight distance limited
• Best used in areas with recurring congestion where shoulder construction and detection can support system
• Improves flow on freeway, but must have storage on ramps to avoid harming arterial operations
• Freeway must be regularly congested to realize benefit on mainline
CCTV = Closed Circuit Television aDynamic junction control was not included because of limited data on its effectiveness.

26
Task 2: Best Practices for Considering Operational Improvements in the Planning Process
Critiques of the Conventional Transportation Planning Process
Four critiques of the conventional transportation planning process are directly relevant to the issue of ensuring that ATM may be considered in the planning process:
1. The planning process needs to accommodate processes, not just projects. 2. The planning process should emphasize performance measures, not technologies. 3. Operations projects should be implicitly or explicitly included. 4. It is feasible to estimate benefits of operations at a sketch planning level.
The Planning Process Needs to Accommodate Processes, Not Just Projects After reviewing documents common to regional and statewide planning processes—the
CLRP, the TIP, and the Statewide Transportation Improvement Program (STIP)—Tarnoff (2006) identified conflicts between traditional and operations-oriented planning processes as follows:
• defining investments in terms of projects rather than processes
• using planning horizons of two decades [for the CLRP] rather than of a few years
[typical for operations initiatives]
• emphasizing long-term consensus rather than flexibility for unanticipated situations. For example, although the traditional planning process might be appropriate for planning a large rail facility (a specific project requiring decades to construct and necessitating agreement among affected jurisdictions and stakeholder groups), it is not necessarily designed for an operational investment—such as a signal retiming (which requires a sustained commitment to a process of continuously updating timings and can be implemented quickly).
This emphasis on operations investments in processes, as opposed to projects, is not new.
Almost two decades ago, the Institute of Transportation Engineers emphasized a three-pronged maintenance process for signal systems (preventative maintenance, troubleshooting, and design revisions) for which a key part of the process was keeping records of changes made to the system (Morales, 1995). During the earlier stages of the implementation of ITS, FHWA’s interim guidance for incorporating ITS into the planning process (TransCore, 1998) noted that a challenge for such incorporation was the view of ITS as “support technologies” rather than of a set of “strategies” for addressing specific transportation problems. In their review of California investments, Dahlgren and Lee (2004) recommended describing ITS efforts as operations initiatives rather than construction initiatives, such as “sensing dangerous driving conditions or vehicle behavior and providing information, traffic control, or roadway treatment to reduce the danger,” rather than presumably describing the technical components of an ITS system that would perform such monitoring.

27
The Planning Process Needs to Emphasize Performance Measures, Not Technologies Recognizing two groups of professionals that influence planning for operations—
transportation planners and transportation operators—Berman and Mayhew (2004) identified several techniques that appear relevant to any initiative designed to improve collaboration among disparate groups:
• Encourage operators to participate in planning and investment decisions.
• Encourage planners to include operations in the development of various regional
plans.
• Encourage communication between the two groups.
Two other techniques to improve collaboration are implied that appear worthy of further study:
1. Use performance measures to present the benefits of capital and operations investments in common terms.
2. Use these metrics to select an optimal combination of operations and capital
investments.
In practice, not all performance measures can capture the impacts of operational investments to an equal extent; Lyman and Bertini (2008) found that prioritizing corridors on the basis of the buffer index (a measure of reliability based on the 95th percentile travel time and mean travel time) and the travel time index (a more traditional measure of congestion based on the peak hour travel time and free flow travel time) yielded different results. The authors recommended that reliability-based metrics be incorporated in transportation planning to a greater extent than is currently the case, which should encourage greater consideration of operations strategies such as ramp metering, the provision of information to travelers, and incident management (Lyman and Bertini, 2008). A variety of metrics at the individual project level (e.g., travel time index, buffer index, and planning time index) and the regional level (e.g., number of jobs within a certain travel time) are defined by Cambridge Systematics, Inc., et al. (2008).
Operations Initiatives Should Be Implicitly or Explicitly Included
There is support for incorporating ITS into the traditional planning process, as was noted for the specific examples of toll facilities such as high-occupancy toll (HOT) lanes (DKS Associates et al., 2009), but some literature also noted that historically ITS has been left out of the planning process (Tarnoff, 2006). There is not a consensus, however, as to whether ITS and operations projects merit their own category of funds. Dahlgren and Lee (2004) emphasized in particular that ITS projects should not be given a separate funding category but instead that “ITS projects can compete with other projects on their merits.” Grant et al. (2010a) simply noted both alternatives: a regional plan can either have a section that explicitly focuses on operations projects or could include operations strategies within the context of other goals (e.g., the use of

28
shoulder lanes for transit might be included within an environmental objective). Because individual operations initiatives may not be included in the TIP, Koonce et al. (2009) recommended using a system of such initiatives; e.g., a regional traffic signal operations program can be included in the TIP. The authors further noted that some MPOs have listed signal timing as a line item in the TIP but did not indicate an amount of funding, which enables the MPO to transfer funds to such efforts if funds become available from other sources, such as capital projects that are delayed. It Is Feasible to Estimate Benefits of Operations at a Sketch Planning Level The long-range planning process is often supported by the application of the urban travel demand forecasting process—a series of models that perform the iterative steps of trip generation, trip distribution, mode choice, and traffic assignment for the entire region. Detailed analysis of specific operational strategies at a specific site can be accomplished with microscopic simulation models. Both approaches—long-range travel demand modeling and shorter term microscopic modeling—generally require a substantial investment of effort to ensure that the models will yield accurate results. The literature noted that it is possible to estimate the benefits of operational strategies with sketch planning approaches; although some accuracy is lost, these approaches can be used in instances where only limited data are available. Three categories of approaches were noted:
1. Approaches based on traffic flow. These analytical techniques include queuing theory, speed-volume relationships (e.g., the Bureau of Public Roads [BPR] equation relating speed to volume), and elasticity. Operations benefits have been estimated at a sketch planning level for the following investments: ramp metering (with and without bypass lanes for high-occupancy vehicles [HOV]), incident management (e.g., the use of additional tow trucks, traffic management systems, and lane control), motorist diversion (e.g., through the use of changeable message signs), electronic toll collection, and transit preemption (TransCore, 1998). Hadi et al. (2008) used queuing equations to estimate benefits of delay and queue reductions because of better traffic management center operations; further, the reduced idling was used to estimate emissions and fuel consumption benefits.
2. Historical incident approaches. To the extent that operational strategies will
mitigate or prevent incidents, historical incident data may be used to determine the extent to which non-recurring congestion is problematic in a region. For example, Dowling et al. (2008) estimated the benefits of an ITS technology that could reduce incident duration by 10 min through the use of historical incident probabilities, durations, and resulting post-queue flows. The authors reported that such a change would increase the annual average post-queue flow by 24.5 veh/hr, which was a 0.40% increase in capacity—a nominally small amount but, which the authors noted yields “significant benefits” when considered over a 1-year period.

29
3. Off-the-shelf analysis packages. FHWA (2006a) reported that Dynasmart-P, a “traffic assignment analysis tool” designed explicitly to integrate the traffic assignment process (used in traditional long-range transportation planning models) and traffic simulation models (used in shorter-term operations analyses) to evaluate traffic management strategies, including the use of one-way streets. Additional operations strategies that may be evaluated with this tool include congestion pricing, incident management, and ramp metering (FHWA, 2006a)). Other analysis packages such as the Surface Transportation Efficiency Analysis Model (FHWA, 2010) and the ITS Deployment Analysis System (Grant et al., 2010a) are designed to help evaluate the benefits of various operational strategies based on the outputs of traditional travel demand models. FHWA (2009a) has provided a spreadsheet tool for estimating the benefits of applications such as signal coordination, ramp metering, and incident management. Depending on the package used, there may be considerable time and effort required to analyze a site, however.
Existing Planning Processes That Incorporate Operational Elements The literature describes 10 MPOs and states that have incorporated operational elements into some combination of three elements of the planning process: the Congestion Management Process (CMP), the CLRP, and the TIP, as well as approaches used abroad. Each entity was chosen by the researchers because it accentuated a particular theme regarding how planning and operations can be integrated. These themes are:
• Operations initiatives are processes (Colorado and Virginia).
• A regional concept of transportation operations (RCTO) can be used (Arizona, Michigan, and Virginia).
• Existing tools may be adapted to evaluate non-capacity projects (Taiwan). • The CMP can be used (New Jersey and Pennsylvania, New York, and Washington
State). • Performance measures may influence investment decisions (Utah and Virginia). • A few performance measures are better than none (California and Oregon). • A variety of performance measures are feasible (Washington, D.C.).
Operations Initiatives Are Processes (Colorado and Virginia) FHWA (2009b) reported on the Traffic Signal System Improvement Program of the Denver Regional Council of Governments (DRCOG) and in so doing exemplified the view that operations are better understood as a process rather than a project. Prior to the passage of the Intermodal Surface Transportation Efficiency Act (ISTEA) of 1991, DRCOG, with the support

30
of its member jurisdictions, had initiated a program to coordinate traffic signals across jurisdictional boundaries. At its inception, the program did not provide any capital improvements but rather funded one traffic engineer to improve signal timings. With the availability of funds from the Congestion Mitigation and Air Quality Improvement Program (CMAQ) in 1994, however, $1 million has been available per year for the program (that amount is $3.7 million per year for the 2008-2013 period). This operational benefit of coordinated signals is not expected from a one-time investment but rather from a long-term program (FHWA, 2009b). Related operational projects, such as transit priority, are also included. DRCOG (2010) estimated the benefits of these initiatives in terms of gallons of fuel saved, emissions reduced, and delay reduced.
Operations initiatives are a process in another sense: they may both originate from early communications among professionals and provide a forum for coordination across regional entities. Within Virginia’s Hampton Roads Transportation Planning Organization (HRTPO), FHWA (2004) noted the use of workshops on the topic of “emergency management” initiated when HRTPO experienced “challenges in getting emergency planners to participate in regional M&O [maintenance and operations] planning efforts.” An example of an established forum for regional operations coordination is the Hampton Roads Transportation Operations Subcommittee, which meets every 2 months (Nichols, 2012). FHWA (2004) stated that HRTPO may have realized the benefits of collaboration because it was created by merging two smaller planning district commissions [PDCs]; this, combined with a merger of the two large transit agencies serving the region, showed the need to collaborate across jurisdictions and agencies. Although FHWA indicated that the PDC merger and the transit merger occurred at the same time, Nichols (2012) explained that the former occurred several years before the latter; the lesson from FHWA (2004) is that these realignments contributed to a “culture of enhanced collaboration and communication.” An RCTO Can Be Used (Arizona, Michigan, and Virginia) The purpose of an RCTO is to develop operations-related strategies that can be incorporated into the CLRP and TIP. For example, in the Detroit, Michigan, area, the RCTO led to the inclusion of signal retiming in the region’s TIP (Southeastern Michigan Council of Governments [SEMCOG], 2007). In Tucson, Arizona, the Pima Association of Governments’ RCTO identified strategies such as “multi-jurisdictional sharing of traffic management resources such as dynamic message signs” (FHWA, 2009c). In Virginia, the aim of the Hampton Roads RCTO is to “build upon the existing spirit of cooperation” that results from better incident management such that other initiatives that require coordination can be undertaken (HRTPO, 2009). . Three characteristics of these RCTOs are noteworthy.
1. They have a limited number of objectives. The Tucson RCTO focused on just three areas (providing traveler information, managing work zones, and improving operations of arterials); FHWA (2009c) reported that this resulted because initially the committee had identified 17 operations objectives but that “stakeholder enthusiasm and participation began to wane” because of the difficulty of identifying actions to support

31
each objective. The Hampton Roads RCTO focused on incident management, with three of its six objectives specific to incident clearance: increase responder safety, decrease incident clearance time, and decrease the frequency of secondary incidents (HRTPO, 2009).
2. The RCTO may assist with bringing projects to fruition. The Tucson RCTO identified
specific funding sources, such as the TIP and funds from the creation of a regional transportation authority, for some of these operational initiatives. (FHWA, 2009c). An objective of the Hampton Roads RCTO is to identify additional resources that agencies can use for incident management, including funding from external sources (HRTPO, 2009); stronger connections between operations and planning personnel concerning “funding opportunities” (Bauer et al., 2011) should also be helpful in this regard.
3. The RCTO may help move operations projects into the CLRP. SEMCOG (2007)
reported that several initiatives—a safety service patrol (formally called the freeway courtesy patrol), a signal retiming program, and ITS initiatives in place—are listed in the CLRP as line items and can be funded through the TIP.
Existing Tools May Be Adapted to Evaluate Non-Capacity Projects (Taiwan)
Chen et al. (2010) described a goal-driven planning process for the city of Kaohsiung where the goal was to increase the mode share of public transportation to at least 25%. To some extent, the planning process resembled a more “traditional urban transportation planning process” (Chen et al., 2010) where transport demand is estimated through the four steps of trip generation, trip distribution, mode choice, and traffic assignment, with a regional model and transportation network being defined. At this point, however, the process diverged from a more traditional use of the travel demand model in two ways.
1. Instead of focusing on traditional measures of congestion, such as the relationship of
volume to capacity, the model focused on the mode share of public transportation. Thus, the investments required to raise public transportation’s share to 25% were noted rather than the investments needed to achieve a given volume to capacity (v/c) ratio or level of service (LOS).
2. In addition to the capacity investments of additional light rail, non-capacity
alternatives were examined—increased parking prices (a large increase and a small increase), subsidized transit services, strengthened parking enforcement, reduced parking spaces, greater frequency of transit service, the addition of a shuttle bus service, and greater enforcement of traffic laws. Although these are not considered ATM techniques, the methodology for incorporating these in the regional model appears relevant to using the regional model to evaluate operations investments.
To examine these alternatives within the regional model, Chen et al. (2010) reported that
the “parameters” associated with travel time and cost were modified, which then influenced the trip distribution, mode choice, and assignment steps. For example, in the mode choice step,

32
which determines whether a given individual would use bus, light rail, or auto, presumably an increased parking price for the auto alternative would manifest as a change in the cost parameter for the utility or a change in the value of the cost variable. After the regional travel demand model was executed and the combination of alternatives that would yield a 25% transit share was found (i.e., construction of a light rail transit route; a “small” increase in parking prices of about $1.18 per hour for cars; and an increase in driving costs from 9.7 to 14.7 cents per kilometer), a subsidy for the required transit service was computed. The CMP Can Be Used (New Jersey and Pennsylvania, New York, and Washington State) In New Jersey and Pennsylvania, the Delaware Valley Regional Planning Commission (DVRPC) used a series of performance measures in its long-range planning efforts. According to Grant et al. (2010a), with respect to a series of regional indicators collected by DVRPC:
The resulting products feed back into future long range plan updates and subsequent performance measures to provide a valuable interface between the region’s investment pattern and evaluative process.
One such metric was the percentage of traffic count stations that had a v/c ratio of 0.85 or higher (DVRPC, 2008a). This threshold was chosen because it was DVRPC’s definition of what constitutes a congested location. Although the volumes were collected on an annual basis from about 1,000 to 1,500 count stations, the capacities were based on the regional model. If the same metric is tracked over a period of time, longer term trends can be determined; e.g., based on the finding that the percentage of links with a v/c ratio greater than 0.85 has oscillated between 18% and 22% for an 8-year period (with the latest year having a value of 20%), DVRPC (2008a) reported that regional congestion is “surprisingly stable.”
DVRPC (2009b) reported that the CMP influences future investments not only by suggesting projects for the TIP (whether as stand-alone projects or refined ideas from other submitters) but also by influencing where annual corridor studies will be conducted (the outcome of which may influence the TIP in the future). Although the TIP document for the New Jersey portion of the TIP does not mention performance measures or v/c ratios per se, it does mention various corridor studies that led to the development of the project that would be included in the TIP (DVRPC, 2009a). DVRPC (2009b) also noted the use of supplemental strategies for projects that add a “significant” amount of capacity for single-occupant vehicles (SOVs) in selecting TIP projects. (“Significant does not refer to statistical significance but rather is defined in §450.320(d) as “a new general purpose highway on a new location or adding general purpose lanes, with the exception of safety improvements or the elimination of bottlenecks.”) Such strategies are required for MPOs that have a population in excess of 200,000 (and are hence Transportation Management Areas) and are non-attainment for ground level ozone. Such strategies include operational initiatives such as signal retiming and the use of pedestrian-actuated signals (DVRPC, 2008b) and could include ATM techniques. To be clear, DVRPC (2009b) encouraged the analyst first to consider ways of solving a problem at a congested location without building additional capacity. This is consistent with federal regulations as cited by DVRPC [2008b]) where in non-attainment Transportation Management Areas, “travel demand reduction and operational management strategies” will be considered as an alternative to adding SOV capacity. If, however, SOV capacity is still warranted, such strategies will be

33
considered in conjunction with the capacity investment “to extend the useful life of the capacity-adding project” (DVRPC, 2008b). New York’s Capital District CMP, which provides information about system performance, “feeds the Plan [CLRP] development and short range programming process,” but in practice, the CMP, the CLRP, and the TIP “are not so easily differentiated” (Capital District Transportation Committee [CDTC], 2007). The CMP noted that projects are evaluated in seven program areas (bridge, pavement, transit, safety, bicycle/pedestrian, community/economic development, and mobility/congestion). Relevant metrics include travel time savings, vehicle-hours of delay, and excess delay (defined as the time spent at an intersection or along a highway segment where LOS is E or F). Of special note was that the regional highway model explicitly was not used for evaluating incident-related delay. Three reasons were cited by the working group for not using the regional model: (1) capacities predicted by the Highway Capacity Manual were exceeded by the observed flows; (2) the observed responses to congestion reduced delay more than methods predicted from the regional model; and (3) the regional model does not forecast incidents. The portion of delay that was recurrent was compared to the portion of delay that was attributable to an incident through the use of 15-min periods available for each expressway segment and lane. Such metrics were used to complete a “project evaluation fact sheet,” which drives the programming process for the TIP. The project evaluation sheet included the aforementioned performance measures (e.g. a benefit-cost ratio with benefits based in part on travel time savings) and other impacts in terms of hydrocarbon emissions reductions, noise impacts, and community disruption. In short, operational projects were explicitly supported through three distinct mechanisms: (1) their need is identified in the CMP )especially through its explicit focus on incident delay rather than only general delay); (2) the project evaluation sheet used to select shorter term project for the TIP allows a side-by-side comparison of traditional and operations-oriented projects; and (3) the measures of performance (e.g., delay) can be addressed through both conventional and operations-oriented initiatives. If measures were restricted to, say, an increase in capacity, some operations-oriented initiatives would not be feasible. Grant et al. (2010a) reported that a number of agencies have similarly used measures of performance to determine where operational solutions are required. In addition to New York’s CDTC, such agencies include the East-West Gateway Coordinating Council (St. Louis, Missouri) and the Capital Area Metropolitan Planning Organization (Austin, Texas).
DKS Associates et al. (2009) reported that based on a survey of 10 managed lane projects in the United States, Washington State’s Puget Sound Regional Council’s (PSRC) regional network of tolled facilities was the most integrated with the regional planning process. (The report defined managed lanes any type of pricing for the use of lanes such as high occupancy toll lanes or general tolled lanes.) The evaluation of congestion pricing was part of the analysis of alternatives in the regional plan, and the MPO provided guidelines in its CMP for the evaluation of various alternatives. Examination of Appendix A of this multimodal CMP (PSRC, 2009) showed that both ITS and traditional improvements were included. The CMP identified seven corridors, and for each corridor five alternatives, with each alternative including major capacity improvements (e.g., interstate widening), nonmotorized facilities (e.g., bicycle paths), tolling options (e.g., HOT lanes), transit investments (e.g., bus rapid transit), ITS investments (e.g., regional signal coordination and traffic management centers), and travel demand management

34
initiatives (e.g., regional vanpools and parking surcharges). Then, for each alternative in each corridor, transit and vehicle commute times were given. It is apparent that the CMP was a primary factor in developing the year 2040 regional transportation plan (PSRC, 2010); whereas the regional plan includes environmental criteria (e.g., emissions, runoff, and preservation of open space), crash risk considerations, and consideration of nonmotorized travel, the regional plan appears to have made congestion relief a high priority, given the emphasis on linking the regional plan to the mobility-driven CMP. Performance Measures May Influence Investment Decisions (Utah and Virginia) Utah’s Wasatch Front Regional Council (WFRC) (2007) regional model identified operations-related projects that can delay a capacity expansion; such projects are defined as “signal coordination, ramp metering, incident management, other intelligent transportation systems, and access management.” These strategies are categorized as Transportation Systems Management (TSM) but, except for access management, could be described as operations efforts. The CLRP for the region makes use of two types of performance measures to influence investment decisions:
1. Level of service. WFRC (2007) reported 10 links (e.g., discrete sections of roadway facilities) where such TSM projects were chosen because of their ability to improve LOS to D or higher; the authors also noted that such locations meeting this criterion are usually isolated segments. Regarding an earlier version of the long-range plan, FHWA (2004) reported that WFRC had also actively used the Congestion Management System (the predecessor of the CMP) to identify locations where congestion could be addressed with TSM (e.g., operations, in this instance) solutions. In this case, this performance measure (LOS) was used as an indicator for identifying links where operations-related improvements should be made.
2. Comprehensive cost savings. WFRC (2007) also reported the use of cost savings
measured across three areas—delay, safety, and the environment—for the “Commuter Link” initiative, which entailed changeable message signs to divert motorists in the event of an incident, ramp metering strategies, and signal coordination. Delay benefits were computed using a savings of $12 per hour; environmental benefits were based on monetizing reductions in fuel consumption and emissions; and safety benefits were reported as being based on “Federal Highway Administration estimates” (which are believed to be a monetized value for each crash reduced). Delay reductions accounted for about 65% of the total benefits, suggesting that environmental and safety impacts were not insignificant; further a relatively high benefit-cost ratio of 17 was reported. In this case, this performance measure (comprehensive cost savings) was used to justify further investments such as increased personnel and the connecting additional traffic signals to the system.
Virginia’s HRTPO accommodates operations within its planning process through two mechanisms. First, the MPO set aside a specific category for “ITS and M&O [Management and Operations]” projects that would be funded with Regional Surface Transportation Program funds

35
(a funding category over which MPOs exceeding 200,000 in population have control). Criteria such as impact on incidents and impact on peak travel performance were used to select projects for the TIP (Ravanbakht et al., 2006). Second, the planning process recognizes operations-related documents; for example, an additional criterion for selecting ITS projects in the TIP is whether the project is “in the regional ITS plan and architecture” (Ravanbakht et al., 2006). A Few Performance Measures Are Better Than None (California and Oregon)
A chief recommendation of Dahlgren and Lee (2004) after reviewing California efforts to incorporate ITS projects in the traditional planning process was to quantify potential benefits, such as reductions in crashes or travel time, for specific projects—and, in particular, to use sketch planning methods rather than more sophisticated models to do so. Sketch planning simply refers to techniques that can be done relatively quickly, typically with spreadsheets or calculators, to estimate the benefits of transportation investments (TransCore, 1998). The emphasis is less on critiquing detailed models and more on finding ways to initiate formal evaluations relatively early in the process, leading the authors to state:
Providing better information on benefits does not need to take major effort, and precise answers are not essential; any estimates would be better than what is provided currently. . . . For example, to evaluate the impacts of a traffic management system serving a
mountainous four-lane highway, Dahlgren and Lee (2004) used a “simple deterministic queuing model” to estimate total incident delay; results of the model are indicators such as maximum queue length, queue dissipation time, and incident duration. While the equations defining the specific model used by Dahlgren and Lee (2004) were not reported, such indicators can be obtained from queuing models used in the Highway Capacity Manual and reported in Gerlough and Huber (1975); these models can be coded into a spreadsheet and are generally suitable for initial estimates of performance. Based on measured traffic volumes, assumed capacities and efficacies of ITS impacts (e.g., a 4-min reduction for a given incident), and historical records of the number of incidents, an estimate of the ITS impact in direct performance (e.g., travel time reduction) or monetized delay savings can be estimated. Examples of sketch planning techniques were also provided by TransCore (1998).
Dahlgren and Lee (2004) pointed out the complexity of the transportation planning
process, emphasizing the federal role (which recognizes the TIP; the STIP; and key federal funding sources such as CMAQ and the Regional Surface Transportation Program, which is controlled by MPOs with more than 200,000 people) and the state and local role, including, for example, county congestion management agencies that can suggest projects to MPOs or the state DOT. Figure 2 illustrates the number of paths through which a transportation project may be developed in Virginia.
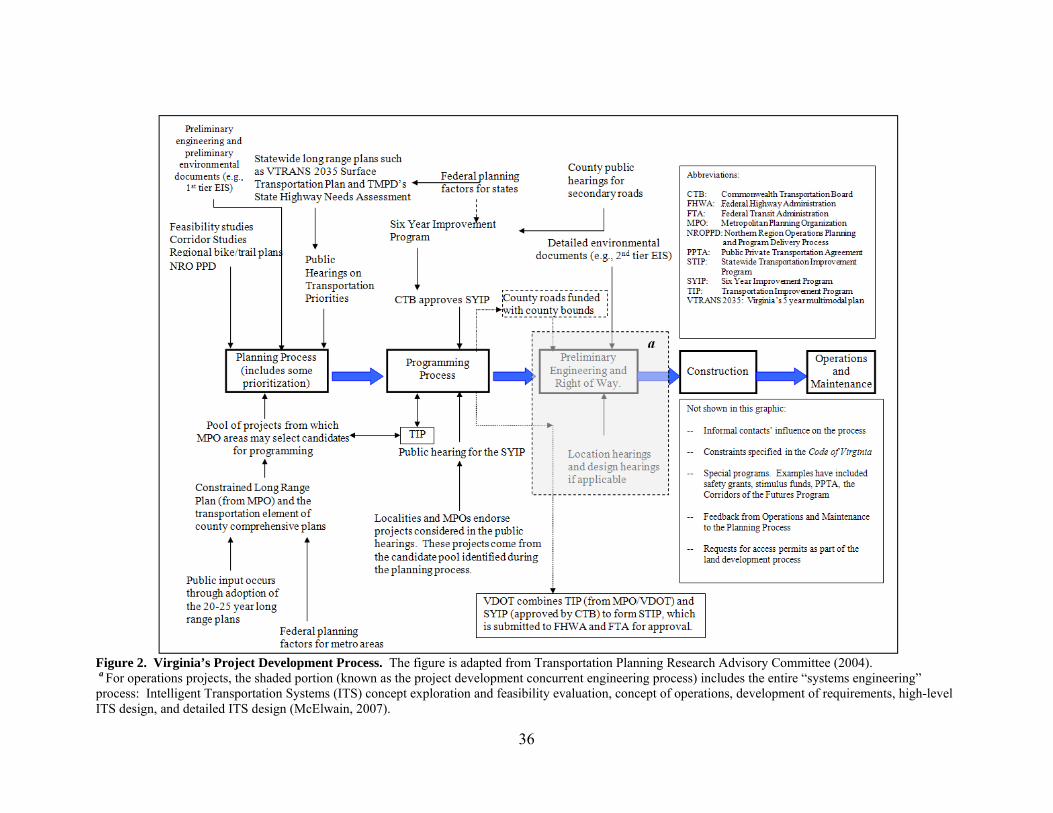
36
Figure 2. Virginia’s Project Development Process. The figure is adapted from Transportation Planning Research Advisory Committee (2004). a For operations projects, the shaded portion (known as the project development concurrent engineering process) includes the entire “systems engineering” process: Intelligent Transportation Systems (ITS) concept exploration and feasibility evaluation, concept of operations, development of requirements, high-level ITS design, and detailed ITS design (McElwain, 2007).

37
Figure 2 shows that ideas for projects arise not only through policies set at the state level but also from individual county plans; Dahlgren and Lee (2004) recommended including ITS/operations projects in these county plans (to the extent that such projects are productive).
For Oregon, Coffman and Makler (2007) described how providing a few performance measures for the seemingly most productive ITS projects is expected to increase the inclusion of such projects in the planning process for the Portland area MPO. Examples of such performance measures are provided in Table 5. Although only two of the five initiatives show a delay-based performance measure, four of the initiatives provide information that suggests a delay reduction is likely and the fifth—the trip check—at least assists travelers with avoiding such delay. A critical feature of Table 5 is that all of the performance measures are computed based on historical operations investments rather than future investments.
A special challenge regarding safety-related performance measures is that establishing targets may be difficult because while one desires realistic targets, the ideal target for the number of injuries or fatalities is zero (Grant et al., 2010b). Further, the stochastic nature of crashes and the difficulties obtaining crash data from multiple sources can make the use of crash-based performance metrics challenging. Accordingly, non-crash performance metrics may be considered, such as the miles (or hours) of freeway covered by a safety service patrol (Minnesota); the amount of funds invested in areas recommended by the State Highway Safety Plan (inferred from New Hampshire’s objective of seeking to implement SHSP recommendations quickly) (Grant et al., 2010b); and the percentage of the public satisfied with transportation safety, which may be obtained with a customer satisfaction survey) (Oregon DOT, 2004). Further, although quantification of performance measures is generally desirable, this is not always necessary: e.g., DVRPC uses a series of “yes/no" questions for safety- and security-related metrics that influence project selection such as: “Will the project directly reduce the number and severity of accidents that occur on highways or transit systems” (AECOM Consulting Transportation Group et al., 2002)?
Table 5. Performance Impacts of Select Operations Investmentsa
Initiative
Impact
Time Period Data Were Collected
Ramp metering • Throughput decreases by 14% without metering 1 week (when meters were deactivated)
Automated weigh stations
• 524,000 hr for drivers • $39 million in operating costs
7 years
Transit signal priority • 2 to 3 min per route • 17% reduction in travel time variability • Savings of $120,000/route over 5- to 10-year period
because buses did not have to be added
Not stated
Travel information via website
• More than 1 million visitors per month in some cases 7.5 years
a Data based on Coffman and Makler (2007). A Variety of Metrics Are Feasible (Washington, D.C.)
The Management, Operations, and Intelligent Transportation Systems (MOITS) Strategic Plan for the National Capital Region Transportation Planning Board (NCRTPB) (the MPO for the Washington, D.C., metropolitan region, which includes portions of Virginia and Maryland)

38
also supports the use of performance measures (Franklin et al., 2010), noting two linkages between the planning process and the operations planning process. This MPO is supported by the Metropolitan Washington Council of Governments, an umbrella organization that serves as staff for NCRTPB (Transportation Planning Research Advisory Committee, 2008).
First, several performance measures are used in the MOITS Strategic Plan that are
potentially part of the CLRP. For convenience, as shown in Table 6, these may be categorized as usage measures (e.g., traffic volume or transit ridership), mobility measures (e.g., LOS), and safety or environmental measures (e.g., incident duration and emissions reductions). Citing relatively high benefit-cost ratios for various operational strategies (e.g., ranges from 16/1 to 25/1 for traveler information, 4/1 to 20/1 for signal coordination, and 7/1 to 25/1 for integrated corridor management), Franklin et al. (2010) indicated that with respect to performance measures such as those listed in Table 6:
The MOITS program should strengthen its understanding of performance measurement and benefit-cost analysis to better advise decision makers on potential impacts (including for congestion and air quality), and comparison to traditional capital investments (emphasis added). Second, a limited number of these performance measures were used in the CMP. For
example, one component of the CMP entailed monitoring transportation performance, and a subcomponent of such monitoring was conditions in interstate facilities (NCRTPB, 2010a). For these facilities, the CMP (Skycomp, Inc., 2009) reported three performance measures for interstate facilities—queue length, LOS, and average travel speed. A fourth metric—density—was reported for the top 10 congested corridors, one of which was I-66 West, with a speed range of 14 to 20 mph and a density of 100 passenger cars per mile per lane. A fifth metric, i.e., delay, was reported for the top 10 corridors with the greatest delay; an example is I-66 East outside the Beltway (between Route 234 and I-495) with a delay of 21 min. These data are collected every 3 years; photographs from fixed wing aircraft are obtained for select highway sections, which are
Table 6. Performance Measures Identified in MOITS Strategic Plan
Category Usage Measures Mobility Measures Safety/Environmental Measures Auto related • Capacity
• Traffic volume • Speedb • Vehicle densityb • Vehicle classification • Vehicle occupancy • Vehicle miles traveled • Vehicle trips
• Ratio of peak travel time to free flow travel time a
• Volume/capacity ratio • Level of serviceb • Vehicle-hours of delayc•
• Total number of fatalities • Number of fatalities • Number of injuries • Emissions reduction • Incident duration • Number of regional incidents
Transit related • Transit ridership • Person-miles traveled
• Person-hours of delay • Modal shares
• Number of fatalities
Truck related • Truck-hours of travel • Number of fatalities
Source: Franklin et al. (2010). MOITS = Management, Operations, and Intelligent Transportation Systems. a This ratio is the travel time index. The strategic plan also defines planning time index as 95th percentile travel time ÷ Free flow travel time and buffer index as (95th percentile travel time – Average travel time) ÷ Average travel time. b Values are publicly available in the region’s Congestion Management Process for some facilities. c This metric is reported as average minutes of delay per vehicle in the Congestion Management Process.

39
then used to compute density on these sections, with the focus being on weekday morning and evening congested periods (Skycomp, Inc., 2009). The CMP (NCRTPB, 2010a) indicated that impacts of various operational strategies on performance measures are examined and in particular noted that congestion management alternatives must be considered even for traditional capacity expansion projects. Summary of Themes in States Linking Planning and Operations Table 7 identifies salient lessons from each city, MPO, or state regarding the integration of operations into the planning process. To some degree, the common elements of Table 7—using performance measures, ensuring that operations initiatives are fully considered in a CMP, and directly comparing operations and capacity strategies—are not necessarily novel to Virginia. For example, Grant et al. (2010b) cited what appears to be the incorporation of operations projects into the planning process in VDOT’s Northern Region Operations (NRO):
VDOT NRO staff has made some significant progress in integrating operations components into the planning process for “nonoperations” or conventional transportation projects. This is primarily due to the outreach efforts of operations planning staff to proactively engage transportation planners, construction design staff, and other regional stakeholders with VDOT NRO’s plans and tools. Further, other documentation (FHWA, 2009b,c; Grant et al., 2010a,b) suggested that
many states and MPOs in addition to Virginia have successfully brought operations into the planning process. Thus the utility of Table 7 is not that it presents lessons that have never been implemented, but rather that it suggests concepts that should continue to be enhanced given that the energy of planners may be diverted to other priorities. Summary of Best Practices That May Be Adapted to Virginia
The best practices for incorporating ATM into the planning process entail modifying the planning process to accommodate ATM projects and providing additional information for these projects so that they may be incorporated into the planning process. These best practices are:
1. Include initiatives directly in the CMP. To the extent that the CMP is an institutionalized planning requirement that influences the long-term CLRP and the short-term TIP, moving operations projects into the CMP encourages their early consideration by planning stakeholders. MPOs that have successfully used the CMP to link operations and the planning process as noted by FHWA (2004) include Delaware’s Wilmington Area Planning Council (with a focus on impacts of growth in population and employment), Florida’s METROPLAN ORLANDO (with a focus on interagency coordination), Utah’s WFRC (2007) (to identify TIP or CLRP projects), Florida’s Miami-Dade MPO (to identify TIP projects costing less than $500,000), and the New York City Region MPO (to focus on incident delay). Further, Washington State’s PSRC (2010) also uses the CMP to identify operations-related projects.

40
Table 7. Summary of City, MPO, and State Practices for Incorporating Operations Into the Planning Process State (Agency) Source Themes Exemplified
Colorado (DRCOG) FHWA (2009b) • Operations initiatives are processes rather than projects in that they (1) require continued commitment to implementation and (2) may originate through information exchange among planners and operations experts.
Virginia (HRTPO) Ravanbakht et al. (2006)
Arizona (PAG) FHWA (2009c) • A dedicated group, such as an RCTO subcommittee, can champion operations projects and move them into planning process.
• May be productive to focus on just a few operations areas to increase stakeholder input, which also enables sharing of information between operations and planning personnel.
Michigan (SEMCOG) SEMCOG (2007) Virginia (HRTPO) HRTPO (2009)
Taiwan (City of Kaohsiung)
Chen et al. (2010) • Existing tools may be adapted to evaluate non-capacity projects. • Infrastructure and operational investments are jointly considered with respect to their ability to
achieve particular goal—an increase in public transportation’s mode share. New Jersey and Pennsylvania (DVRPC)
DVRPC (2008a,b; 2009a,b) • CMP influences operational investments through its support of supplemental strategies. • Operational initiatives are supported by CMP (which focuses on incident delay) and project
evaluation sheet for TIP that allows comparison of operations and traditional projects. • CMP, which was a priority in developing the CLRP, compared capacity improvements and ITS
improvements side by side in evaluating alternatives for congested corridors.
New York (CDTC) CDTC (2007); Grant et al. (2010a)
Washington State (PSRC)
DKS Associates et al. (2009); PSRC (2010)
Utah (WFRC) WFRC (2007) • Performance measures may influence investments: because operations projects may delay capacity investment; they are identified in CMP and recommended in CLRP.
• Other metrics include impact on peak travel and incidents. Virginia (HRTPO) Ravanbakht et al. (2006)
California (Caltrans)
Dahlgren and Lee (2004) • A few performance measures are better than none, so quantify potential benefits early in process. • Let ITS projects be evaluated on merits rather than as dedicated funding category. • A performance report for already deployed ITS strategies may encourage inclusion of future ITS
strategies in CLRP. • Besides number of crashes prevented, safety-based metrics exist such as funds invested in safety-
related programs and miles of freeway covered by safety service patrols.
Oregon (Metro)
Coffman and Mackler (2007)
Various other states Grant et al. (2010b)
Washington, D.C. (NCRTPB)
Franklin et al. (2010) • Variety of performance measures exist that may allow comparisons of capacity and operations improvements.
• Performance measures may be supported by CMP. In alphabetical order: CDTC = Capital District Transportation Committee [Albany MPO]; CLRP = Constrained Long Range Regional Plan; CMP = Congestion Management Plan or Process; DRCOG = Denver Regional Council of Governments [Denver MPO]; DVRPC = Delaware Valley Regional Planning Commission [Philadelphia MPO]; FHWA = Federal Highway Administration; HRTPO = Hampton Roads Transportation Planning Organization; ITS = Intelligent Transportation Systems; Metro = Portland MPO; NCRTPB = National Capital Region Transportation Planning Board (Washington, D.C., MPO); PAG = Pima Association of Governments [Tucson MPO]; PSRC = Puget Sound Regional Council (Puget Sound MPO); RCTO = Regional Concept of Transportation Operations; TIP = Transportation Improvement Program; WFRC = Wasatch Front Regional Council (Salt Lake City MPO).
41
2. Include indicators of performance for operations projects. Examples are transit and vehicle commuting time, as instituted in Washington State (PSRC, 2010) and advocated in California (Dahlgren and Lee, 2004). To help make operations projects more broadly understandable, their impact (e.g., travel time reductions, queue reductions) rather than their technical components (e.g., number of CCTV cameras) should be emphasized (Tarnoff, 2006); in this way they can be compared to more traditional capacity investments. As reported by Lyman and Bertini (2008), measures based on reliability should be considered in addition to more traditional measures of congestion. As exemplified by one regional plan (WFRC, 2007), a performance measure can serve either of two purposes—to help decision makers decide which investment should be made (e.g., initiative x reduces delay more than initiative y so initiative x should be funded) or to show the benefits of a given initiative to the public (e.g., initiative x has a high benefit-cost ratio so enhancements to initiative x should be funded).
3. Provide some information, rather than no information, on impacts. Dahlgren and Lee
(2004) encouraged consideration of operations projects early in the planning process—and this can be done with some sketch planning techniques even though precision may be sacrificed. The use of historical information regarding deployed operations projects, as described by Coffman and Mackler (2007), is germane to such an effort. The work by Chen et al. (2010) suggested that existing tools may be adapted to evaluating operations impacts in the longer term.
4. Involve operations experts early in the long-range planning process. An early
planning step is identifying stakeholders to help develop goals and objectives; FHWA (2004) stated that “outreach oriented toward public safety and transportation operations stakeholders can be particularly effective at this stage.” Because planning is a continuous process, opportunities to integrate planning and operations may arise in a number of occasions (see Figure 1); thus, early and continued involvement of operations-oriented personnel should maximize such opportunities, such as in influencing how future corridor studies are conducted, as noted by DVRPC (2009b).
5. Continue planning’s long-term focus. Because of the difference in the planning and
operations time frames, a risk of integrating operations into the planning process is that short-term planning can dominate long-term planning; FHWA (2004) noted that the MPO should actively coordinate shorter and longer term planning but should not prioritize the former over the latter. Elsewhere, in cases where planning and transit operations are performed by the same agency, it has been remarked that “[o]perations can dominate planning” (Kozlak, 2007). For this reason, opportunities to encourage systems of ATM projects (as discussed by Koonce et al. [2009]) should be considered. As exemplified by FHWA (2009b), operations initiatives are processes rather than one-time capital investments.
6. Recognize ITS or operations planning efforts directly in the planning process. Three
techniques are available for such recognition. First, one technique is to use appropriate criteria. One criterion for selecting ITS projects for funding in the TIP

42
has been whether the project is in the region’s ITS architecture (Ravanbakht et al., 2006). Second, the identification of funding sources (FHWA, 2009c; SEMCOG, 2007) can help with implementing such initiatives. Third, performance measures that emphasize reliability (Lyman and Bertini, 2008) can be included with more capacity-oriented metrics.
7. Relate ongoing system monitoring efforts to operations initiatives. For example,
changes in 15-min speeds at a given location may be related, in some cases, to operations-oriented initiatives; if such speed data feed the region’s CMP, they should directly influence the CLRP and TIP. Coupling this practice with Item 4 (early involvement of operations persons in the planning process) may help bridge the planning process’ emphasis on consensus (Tarnoff, 2006) with operations’ shorter-term focus on flexibility.
Task 3: Guidelines for Application of ATM Techniques at Specific Sites in Virginia
Based on the review of ATM deployments in Task 1, guidelines for applying the various ATM techniques in Virginia were developed. Given the many impacts of site-specific characteristics such as lane configuration, ramp spacing, and ramp volumes, a four-step approach was developed to ensure a proposed ATM technique would be suitable for a specific site. The four steps are as follows:
1. Assess the proposed ATM deployment site to determine if it has the infrastructure
and operational conditions required for the particular ATM treatment to be effective. 2. Conduct a sketch planning analysis to estimate the safety and operational impacts of
the proposed ATM deployment. 3. Conduct a more detailed simulation analysis of the possible safety and operational
impacts of the proposed ATM deployment. 4. Conduct ongoing monitoring and assessment of the safety and operational benefits of
the ATM deployment.
These steps are mostly sequential. Generally, if a particular site meets the necessary condition requirements, a sketch planning analysis will provide a better indication of the potential effectiveness of a particular ATM technique at the site. If the sketch planning analysis shows large safety and operational benefits, a more detailed simulation analysis may be used to determine whether investment in the particular ATM deployment appears justified. Because the monitoring and assessment of new deployments are needed to guide future ATM investment decisions, the final step involves considerations for assessing the performance of the ATM deployment after installation.

43
Step 1: Assessment of Proposed ATM Deployment Site for Required Infrastructure and Operational Conditions for Particular ATM Treatment: Basic Guidelines for Application
The basic guidelines for application will help decision makers determine whether a site
has the basic prerequisites necessary for the effective application of a particular ATM technique. The four main categories of basic guidelines for application are:
1. observed problems that can be potentially corrected by the ATM treatment 2. infrastructure requirements necessary to deploy the treatment effectively 3. operational requirements necessary to ensure that the ATM measure works
effectively 4. institutional requirements such as internal and external relationships and outreach
required to ensure the ATM treatment performs as desired.
Tables 8 through 12 provide an overview of the basic guidelines for application of each ATM technique. These tables serve as a preliminary site screening tool for each ATM technique and were derived from the findings of Task 1. These guidelines are primarily qualitative at this stage since site-specific characteristics can dictate the operational effectiveness and overall cost of any proposed treatment. More detailed analysis is required to assess fully whether a treatment is likely to be effective at a specific site.
In practice, Categories 3 and 4 (operational requirements and institutional requirements)
require coordination with other agencies for funding and outreach. As a consequence, when considering a large number of sites, VDOT may find it more effective to complete Categories 1 and 2 of the conditions for application, then perform a sketch planning analysis as discussed in the next section, and then consider categories 3 and 4 of the conditions for application only for the sites where a sketch planning analysis suggests ATM is warranted. However, such a decision rests with operations staff. Variable Speed Limit Systems
Table 8 summarizes conditions for the application of VSLs on freeways. These should be used as preliminary screening tools to narrow potential locations. The existing VSL policy issued by VDOT’s TED should also be consulted when specific sites are assessed (VDOT TED, 2011b).
Queue Warning Systems Table 9 summarizes conditions for the application of QWSs on freeways. These should be used as preliminary screening tools to narrow potential locations for QWSs. Hard Shoulder Running Table 10 summarizes conditions for the application of hard shoulder running on freeways. These should be used as preliminary screening tools to narrow potential locations to implement hard shoulder running.

44
Table 8. Conditions for Application of Variable Speed Limits (VSLs)
CCTV = Closed Circuit Television; DMV = Virginia Department of Motor Vehicles; FHWA = Federal Highway Administration; MUTCD = Manual on Uniform Traffic Control Devices; TOC = Traffic Operations Center; VDOT = Virginia Department of Transportation; VSP = Virginia State Police.
Category Item 1. Observed Problems
A. Recurring congestion and queuing during multiple days of week B. High number of crashes, especially rear-end crashes, during congested periods of day
2. Infrastructure Requirements
A. Power must be available to site or able to be installed at cost-effective rate B. Right of way to install VSL signs and/or overhead sign gantries must be available C. Communications to TOC must be available D. CCTV monitoring of site should be present to monitor system performance E. VSL signs must be placed so that at least 1 is visible at all times. Signs should be placed to contain the end of queuing at site fully and extend through bottleneck that creates queuing. F. VSL signs should conform to speed limit sign requirements in MUTCD or VDOT must seek FHWA approval to use European style overhead signs. G. Sensors to support VSL operation must be installed at close spacings. Sensors should be located prior to and past any ramp entrances where flow state will change. H. If VSLs are to be enforced using traditional enforcement, there must be sufficient space on shoulder to permit enforcement officers to pull over violators.
3. Operational Requirements
A. A concept of operations for system needs to be developed and adhered to. Responses to incidents, weather events, and other non-recurring events should be established. B. VSL system should have an expert system that recommends speed limits for automatic posting and/or operator approval. The expert system should be well validated prior to deployment in field, and VDOT staff should have a clear understanding of its operation. C. Speed limit changes should be archived in a secure database. An archive of speed limit changes will be essential if limits will be challenged in court. D. TOC staff should monitor system continuously to ensure it is operating properly. E. Funding must be allocated to operate and maintain the system properly after installation. Well-performing sensors are critical to proper operation of VSLs and must be maintained to a high level.
4. Institutional Requirements
A. VDOT must coordinate with VSP and other enforcement agencies to develop enforcement plan for VSLs. Unless automated speed enforcement becomes legal in Virginia, VDOT will need to rely on traditional enforcement to maintain credibility of system. Items to be defined include method used to notify enforcement agencies of changes in speed limit and processes to provide official records of posted speed limit in place at a given time for court cases. B. VDOT, VSP, and local enforcement agencies will need to engage local judiciary to educate them on system and its legal basis. Effectiveness of system will be undermined if it is not enforced effectively. C. Public outreach on goals and benefits of system will be essential to gain public acceptance. D. VDOT should coordinate with DMV to discuss simple ways of including a mention of VSL in driver training programs.

45
Table 9. Conditions for Application of Queue Warning Systems (QWSs)
CCTV = Closed Circuit Television, TOC = Traffic Operations Center Dynamic Junction Control Table 11 summarizes conditions for the application of dynamic junction control at a freeway interchange on ramp. These should be used as preliminary screening tools to narrow potential locations for use of dynamic junction control. Dynamic Ramp Meters Table 12 summarizes the basic guidelines for application of dynamic ramp meters. Given that different dynamic ramp meter algorithms have different data requirements, installations would need to be tailored to the specific configuration being used. Step 2: Sketch Planning Analysis to Estimate Safety and Operational Impacts of Proposed ATM Deployment If a site complies with the conditions for application of the particular ATM technique in accordance with Tables 8 through 12 as appropriate (or at least complies with the conditions for Categories 1 and 2, i.e., observed problems and infrastructure requirements), it should be subjected to a sketch planning analysis. This analysis examines operational impacts, safety impacts, and costs. This will quantify the benefits of the ATM technique at an order of magnitude level of analysis and help decision makers compute a preliminary benefit-cost ratio for a project.
Category Item 1. Observed Problems
A. Recurring congestion and queuing during multiple days of the week (non-recurring congestion will be difficult to address cost-effectively with a QWS) B. High number of rear-end or secondary crashes during congested periods of day C. Limited sight distance in advance of locations with high numbers of rear-end crashes
2. Infrastructure Requirements
A. Power must be available to site or able to be installed at cost-effective rate. B. Right of way to install QWS signs and/or overhead sign gantries must be available. C. Communications to TOC must be available. D. CCTV monitoring of the site should be present to monitor system performance. E. Signs should be placed to contain end of queuing fully at site. F. Sensors to support QWS operation must be installed at close spacings. Sensors should be located prior to and past any ramp entrances where flow state will change.
3. Operational Requirements
A. A concept of operations for system needs to be developed and adhered to. B. QWS should have expert system that recommends either advisory speeds or queue warning messages for automatic posting and/or operator approval. Expert system should be validated prior to deployment in field. C. TOC staff should monitor system continuously to ensure it is operating properly. D. Funding must be allocated to operate and maintain system after installation. Well-performing sensors are critical to proper operation of QWSs and must be maintained to a high level.
4. Institutional Requirements
A. Public outreach on goals and benefits of system will be essential to gain public acceptance.

46
Table 10. Conditions for Application of Hard Shoulder Running
CCTV = Closed Circuit Television; TOC = traffic operations center; VSLs = variable speed limits. Sketch Planning Safety Analysis Most of the documented safety benefits of different ATM measures were reported in European studies, and at the moment little direct safety data are available for U.S. deployments. Assessing the potential safety improvement of an ATM system prior to implementation is inherently imprecise given the large differences between the United States and Europe in enforcement, driver behavior, roadside environment, and vehicle fleet. Further, many European
Category Item 1. Observed Problems
A. Recurring congestion and queuing during multiple days of week
2. Infrastructure Requirements
A. Sufficient right of way must be available to accommodate shoulder travel throughout section. Roadside should be reviewed to determine if additional guardrail or barrier needs to be installed if travel is permitted on shoulder. B. Shoulders should be as wide as a travel lane to facilitate movements when lane is open to travel. Pavement depth should be sufficient to handle projected traffic on lane. They should have no adverse superelevation and be composed of same materials as regular lanes. C. Methods to accommodate shoulder travel through interchanges safely should be developed and provided. D. Power must be available to site or able to be installed at cost-effective rate. E. Right of way to install overhead sign gantries must be available so lane control signs can be installed. F. Communications to TOC must be available. G. CCTV monitoring of site should be present to monitor system performance and incidents. H. Lane control sign gantries must be placed so that at least 1 is visible at all times. I. Sensors to support hard shoulder operation must be installed at close spacings. Sensors should also be located on shoulder to detect disabled vehicles. J. Continuous roadway lighting may provide safety benefit when hard shoulder running is operational. K. It may be desirable to include regularly spaced emergency pulloffs for use when shoulder lane is open to travel. L. Upgrades to allow shoulder to handle vehicular traffic should not compromise drainage of road.
3. Operational Requirements
A. A concept of operations for system needs to be developed and adhered to. Responses to incidents, weather events, and other non-recurring events should be established. B. Hard shoulder running system should have expert system that recommends when system should permit shoulder travel for automatic posting and/or operator approval. Expert system should be well validated prior to deployment in field. C. TOC staff should monitor system continuously to ensure it is operating properly. D. Funding must be allocated to operate and maintain system properly after installation. Well-performing sensors are critical to proper operation of hard shoulder running systems that operate dynamically and must be maintained to high level. Additional maintenance of shoulder will also be required because of increased traffic loads. E. VSLs may be implemented with hard shoulder running to reduce speeds when shoulder is open to travel. European experience has shown some positive safety benefits with this practice. F. Incident management program should be in place to allow quick response to incidents blocking shoulder.
4. Institutional Requirements
A. Agreements with towing companies to provide quick clearance of incidents may be beneficial, especially if emergency pulloffs are not used. B. Public outreach on goals and benefits of system will be essential to gain public acceptance. This is especially important if used outside Northern Virginia (these drivers may have experience with I-66 shoulder lanes).

47
Table 11. Conditions for Application of Dynamic Junction Control
CCTV = Closed Circuit Television; FHWA = Federal Highway Administration; TOC = traffic operations center. ATM systems were implemented in conjunction with automated speed enforcement and in combination with multiple ATM treatments. This can make isolating the effects of a single treatment difficult.
That being said, a planning level estimate of the potential effects of a U.S. deployment of an ATM can be derived using the documented European safety benefits as a starting point. If smaller values of observed safety benefits are assumed, reductions could conservatively be applied to PDO crash data at the site. The crash reductions can then be translated into a dollar savings using average per-PDO crash costs from standard references, such as the VDOT Highway Safety Improvement Program (HSIP) (VDOT, 2007). These projected PDO crash savings could then be accrued over the same analysis interval as the operational analysis as discussed in Appendix A.
Category Item 1. Observed Problems
A. Recurring congestion and queuing related to high volumes of merging traffic during multiple days of week B. High number of crashes, especially rear-end crashes on approaches to entrance ramp and sideswipes within ramp merge area, during congested periods of day C. Merging ramp flows must be high enough to justify re-allocating mainline lanes to ramp.
2. Infrastructure Requirements
A. Power must be available to site or available at cost-effective rate. B. Right of way to install overhead lane control sign gantries must be available in advance of and at interchange. C. Communications to TOC must be available. D. CCTV monitoring of site should be present to monitor system performance. E. Lane control signs must be placed so that at least 1 is visible at all times. Signs should be placed to contain end of queuing fully at site and extend through bottleneck that creates queuing. F. Sensors to support dynamic junction control operation must be installed at close spacings. Sensors should be located on ramp and mainline to measure incoming flows. G. Acceptable marking and signing systems must be developed, and FHWA must approve proposals prior to implementation. H. If shoulder is to be used as travel lane, requirements of hard shoulder running should be examined.
3. Operational Requirements
A. A concept of operations for system needs to be developed and adhered to. B. System should have expert system that recommends changes in lane use for automatic posting and/or operator approval. Expert system should be well validated prior to deployment in field. Signs should be posted far enough in advance of interchange to notify drivers of changes in lane configuration. C. TOC staff should monitor system continuously to ensure it is operating properly. D. Funding must be allocated to operate and maintain the system properly after installation. Well-performing sensors are critical to proper operation of system, and must be maintained to high level.
4. Institutional Requirements
A. Public outreach on goals and benefits of system will be essential to gain public acceptance. This would be new and novel approach to managing lanes and would likely require substantial education prior to implementation. B. Flow at interchange should be monitored to ensure that thresholds for changing lane use are acceptable.

48
Table 12. Conditions for Application of Dynamic Ramp Meters
CCTV = Closed Circuit Television; TOC = Traffic Operations Center; VDOT = Virginia Department of Transportation. Impacts on injury crashes can also be assessed to the extent they are supported by data and the literature. As shown in Appendix A, impacts on injury and PDO crashes should be presented as separate line items. For internal technical staff, such information may help develop better simulations of the safety impacts of ATM measures; for external decision makers, such information will help them better understand the impacts of the ATM measure. Sketch Planning Operational Analysis
Operational impacts are assessed by estimating changes in travel time. The aggregate time savings can then be translated into a dollar value using estimates of the value of time from the Urban Mobility Report by the Texas Transportation Institute (2009) or other widely cited sources. These monetary benefits are then accrued over some anticipated lifecycle of the project and may be compared to the “do nothing” scenario.
Appendix B demonstrates several sketch planning methods that may be used to estimate
this reduction in travel time. The most straightforward method is to use estimates of performance improvement from past deployments, as shown in Table 4, and then to apply them to the particular site using data readily available from existing databases. Such estimates may initially be used to forecast changes in several operational MOEs, each of which will affect travel time. These MOEs include (1) the probability of a breakdown in traffic flow attributable to high volumes, (2) the average amount of delay under congested conditions, (3) the delay attributable to queuing, and (4) the average travel speed. Regardless of the method employed, the MOEs that are calculated are used to estimate a net travel time reduction.
Category Item 1. Observed Problems
A. Recurring congestion on freeway created in part by high volumes of entering vehicles from ramps
2. Infrastructure Requirements
A. Power must be available to site or available at cost-effective rate. B. Right of way to install ramp meters and controllers must be available on ramp. C. Communications to TOC should be available. D. Sensors must be placed on ramp and mainline and maintained to high level. Exact number and configuration of sensors depend on type of ramp metering algorithm implemented. E. Ramps must have sufficient length to store queue of traffic waiting to access freeway without negatively impacting arterial operations.
3. Operational Requirements
A. A concept of operations for system needs to be developed and adhered to. VDOT must decide whether a local or coordinated system is needed. B. System should change metering rates dynamically based on selected algorithm, and faults should be reported to TOC. D. Funding must be allocated to operate and maintain system properly after installation. Well-performing sensors are critical to proper operation of system and must be maintained to high level.
4. Institutional Requirements
A. Public outreach on goals and benefits of system will be essential to gain public acceptance, especially in areas where drivers are unfamiliar with ramp meters since ramp delays will increase. B. VDOT will need to coordinate with cities controlling adjacent arterials to ensure that ramp meters do not create problems on surface streets.
C. Enforcement plans for ramp meters will need to be developed and implemented.

49
Planning-Level Benefit-Cost Analysis The results of the planning-level operational and safety analysis can be used to determine an overall benefit-cost ratio for a project. Some safety benefits, along with the operational benefits, can be monetized using the procedures discussed in the preceding sections. Anticipated project costs can be developed from either the information gathered in Task 1 or preliminary cost estimates generated for a specific project. Both capital costs and operations/maintenance costs should be considered. Projects with a benefit-cost ratio greater than 1 would be undergo more detailed analysis and design using microsimulation. Step 3: Detailed Simulation Analysis of Possible Safety and Operational Impacts of Proposed ATM Deployment
If the preliminary planning-level analysis reveals potential net benefits from a particular ATM treatment, it is usually desirable to conduct more detailed analyses using various microscopic traffic simulation models. This approach allows for a detailed analysis of site-specific geometry and traffic conditions, which is not fully accounted for in the planning-level analyses discussed earlier. Further, simulation allows for more explicit examination of the performance of each ATM technique under different roadway conditions, including variations in traffic demand and incidents. This analysis of the impact of sources of non-recurring congestion could further refine estimates of the operational benefits of the system and provide insight into how each measure responds as site conditions change. As a result, any simulation analysis should consider the performance of the ATM strategy under a variety of assumptions related to traffic demand and available capacity. Since many ATM measures will provide benefits through improved reliability, microscopic simulation is often the best avenue to quantify how the proposed design would work under a variety of common conditions.
Several key issues must be defined prior to the development of a microscopic simulation.
These include: • What is the geographic footprint of the simulation? First, the analyst needs to define
the size and scope of the network to be evaluated. It is generally good practice to ensure that the network is large enough to encompass the entire ATM deployment and any queues that regularly occur on the mainline, side streets, and ramps. Some software packages do not capture MOEs if vehicles back up off the modeled network, so it is important to ensure that the end of all queues at the site are contained on the network. Any downstream bottlenecks that could impact operations at the site should also be included.
• What traffic volume scenarios will be simulated? It is generally recommended that
analysts test multiple traffic volume scenarios representing different times of the day or days of the week. Although peak hours scenarios should always be simulated, it is often important to model the natural build up and dissipation of queues since some ATM measures primarily have the effect of delaying the onset of congestion or speeding recovery. Thus, modeling the shoulders of the peak is often a valuable tool for assessing the performance impacts of ATM.
50
• Will any incidents or other capacity losses be simulated? The ability of ATM to mitigate sudden capacity losses is also often an important trait worth examining. Existing incident and crash data could be used to define “typical” incidents that occur in the area. One or more incident scenarios representing different magnitudes and durations of capacity loss can help show the benefits of the ATM system.
• How will the ATM measure operate? Before development of the simulation, a basic
concept of operations for the ATM technique should exist. This may be a critical input into the decision of which software package to use for the evaluation. It is possible that the simulation could also be used to compare several possible operational approaches before a decision of made regarding the final approach to implement in the field.
• How will drivers react to the ATM measure? Finally, assumptions about how drivers
will react to the proposed project need to be defined; for example, will speed distributions change, will compliance with traffic regulations increase, will routing decisions change? Given the limited U.S. experience with ATM, it may be desirable to examine performance over a range of plausible driver responses.
Once these issues have been defined, the analyst can determine the data required to
construct the model and select a traffic simulation package. In developing an experimental plan, the analyst should seek to balance the desire to evaluate all possible combinations of variables comprehensively and the time and effort required to run and process many different alternatives. If a full factorial design is used, the number of required runs can quickly grow to a very large number. A proposed set of VSL simulations with the following parameters may be considered as an example:
• 4 volume scenarios (weekday A.M. peak, weekday midday, weekday P.M. peak, and
peak period on a Saturday) • 3 incident scenarios (no incident, 1 lane blocked, 2 lanes blocked) • 4 algorithms for operating a VSL system • 2 assumptions for driver compliance • 20 discrete runs per combination of factors.
Under this scenario, 1,920 unique simulations would need to be run and processed if all combinations of variables were evaluated. Evaluating additional scenarios can greatly increase the workload, so analysts should attempt to make the number of scenarios evaluated as small as possible while still addressing questions of direct importance to the project.
An important consideration when using simulation is that the selected simulation package
must be able to evaluate explicitly the ATM technique under consideration. Many commonly used programs such as Synchro and CORSIM have limited capability to evaluate measures such

51
as VSL systems or dynamic hard shoulders that change dynamically based on traffic conditions, Software such as VISSIM or PARAMICS that allows for user-developed logic to be incorporated must often be used to create simulations. Further, there is limited experience in the United States with ATM, so analysts may often need to make multiple assumptions about how drivers might respond to different ATM techniques. These assumptions could produce dramatic changes in the model results, creating additional uncertainty regarding whether the simulation model accurately predicts what will happen after implementation of ATM. Thus, the model should be able to replicate assumed driver behavior. Development and analysis of the simulation results may be a very time-consuming activity, so this step should be performed only when preliminary analyses indicate that ATM is likely to be successful at a specific location.
When a simulation model is developed for a site, both safety and operational MOEs can
be evaluated. Although crashes are not simulated directly in a model, certain safety surrogate measures can be examined as indicators of the relative performance of different measures. Table 13 shows different simulation MOEs that may be appropriate when different ATM techniques are examined. Care should be taken to select MOEs that directly measure the problem the specific technique being evaluated will address. For example, a QWS evaluation should focus on safety surrogate measures that address the severity of decelerations as the end of the queue is approached. Examples of relevant MOEs for each ATM technique are shown later in this report in Table 15.
Each of these MOEs could be aggregated at different spatial or temporal levels. For
example, travel time could be presented for a specific link, a specific route, or the entire network.
Table 13. Potential Simulation Measures of Effectiveness (MOEs) Operational MOEs Safety Surrogate MOEs
Mean speed Mean number of stops Mean travel time Total number of stops Total travel time Standard deviation of speed Delay Mean number of lane changes Total delay Total number of lane changes Mean queue length Mean headway Maximum queue length Changes in speed approaching congestion Maximum throughput Travel time reliability (Buffer time index or planning time index) Step 4: Ongoing Monitoring and Assessment of Safety and Operational Benefits of ATM Deployments Given the limited U.S. experience with ATM, an ongoing field monitoring and evaluation program of deployed systems will be essential to establish operational and safety benefits. By collecting data specific to Virginia, it should be possible for decision makers to use those results to predict better the benefits of future ATM deployments in the state. Table 14 shows operational and safety data elements that should be readily available for evaluation from either existing VDOT systems or ATM sensors.
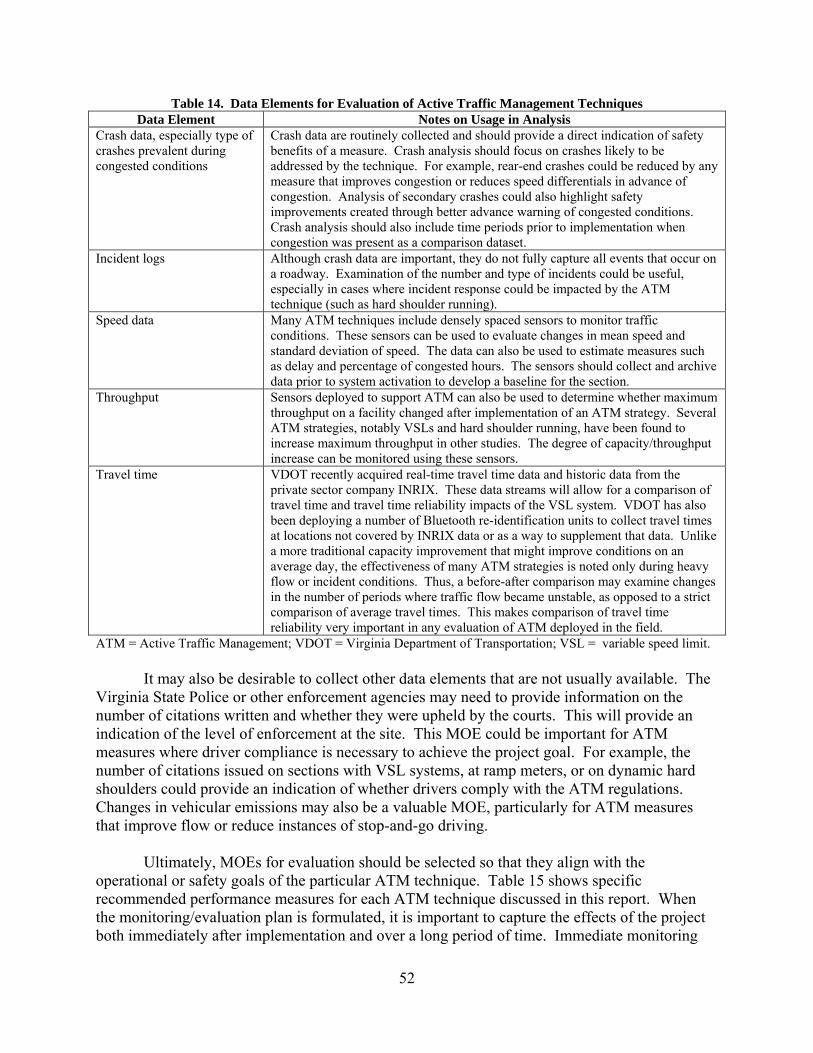
52
Table 14. Data Elements for Evaluation of Active Traffic Management Techniques Data Element Notes on Usage in Analysis
Crash data, especially type of crashes prevalent during congested conditions
Crash data are routinely collected and should provide a direct indication of safety benefits of a measure. Crash analysis should focus on crashes likely to be addressed by the technique. For example, rear-end crashes could be reduced by any measure that improves congestion or reduces speed differentials in advance of congestion. Analysis of secondary crashes could also highlight safety improvements created through better advance warning of congested conditions. Crash analysis should also include time periods prior to implementation when congestion was present as a comparison dataset.
Incident logs Although crash data are important, they do not fully capture all events that occur on a roadway. Examination of the number and type of incidents could be useful, especially in cases where incident response could be impacted by the ATM technique (such as hard shoulder running).
Speed data Many ATM techniques include densely spaced sensors to monitor traffic conditions. These sensors can be used to evaluate changes in mean speed and standard deviation of speed. The data can also be used to estimate measures such as delay and percentage of congested hours. The sensors should collect and archive data prior to system activation to develop a baseline for the section.
Throughput Sensors deployed to support ATM can also be used to determine whether maximum throughput on a facility changed after implementation of an ATM strategy. Several ATM strategies, notably VSLs and hard shoulder running, have been found to increase maximum throughput in other studies. The degree of capacity/throughput increase can be monitored using these sensors.
Travel time VDOT recently acquired real-time travel time data and historic data from the private sector company INRIX. These data streams will allow for a comparison of travel time and travel time reliability impacts of the VSL system. VDOT has also been deploying a number of Bluetooth re-identification units to collect travel times at locations not covered by INRIX data or as a way to supplement that data. Unlike a more traditional capacity improvement that might improve conditions on an average day, the effectiveness of many ATM strategies is noted only during heavy flow or incident conditions. Thus, a before-after comparison may examine changes in the number of periods where traffic flow became unstable, as opposed to a strict comparison of average travel times. This makes comparison of travel time reliability very important in any evaluation of ATM deployed in the field.
ATM = Active Traffic Management; VDOT = Virginia Department of Transportation; VSL = variable speed limit. It may also be desirable to collect other data elements that are not usually available. The
Virginia State Police or other enforcement agencies may need to provide information on the number of citations written and whether they were upheld by the courts. This will provide an indication of the level of enforcement at the site. This MOE could be important for ATM measures where driver compliance is necessary to achieve the project goal. For example, the number of citations issued on sections with VSL systems, at ramp meters, or on dynamic hard shoulders could provide an indication of whether drivers comply with the ATM regulations. Changes in vehicular emissions may also be a valuable MOE, particularly for ATM measures that improve flow or reduce instances of stop-and-go driving.
Ultimately, MOEs for evaluation should be selected so that they align with the operational or safety goals of the particular ATM technique. Table 15 shows specific recommended performance measures for each ATM technique discussed in this report. When the monitoring/evaluation plan is formulated, it is important to capture the effects of the project both immediately after implementation and over a long period of time. Immediate monitoring

53
Table 15. Recommended Performance Measures by Active Traffic Management (ATM) Technique ATM Technique Operational Performance Measures Safety and Other Performance Measures Variable speed limits • Throughput/capacity
• Travel time • Travel time reliability • Duration of congestion
• Crash frequency/rate, especially for rear -end crashes
• Queue length • Citation count • Standard deviation of speed • Compliance with posted speed limits • Emissions changes
Queue warning systems • Travel time • Travel time reliability
• Crash frequency/rate, especially rear-end crashes
• Queue length • Speed distribution approaching end of
queue Hard shoulder running • Throughput/capacity
• Travel time • Travel time reliability • Duration of congestion
• Crash frequency/rate, especially when shoulder is open to travel
• Incident frequency • Emissions changes
Dynamic Junction control
• Throughput/capacity at ramp junction
• Travel time • Travel time reliability • Duration of congestion
• Crash frequency/rate, especially rear-end crashes and lane changes at merge area
• Queue lengths on all approaches • Emissions changes
Dynamic ramp meters • Throughput/capacity on mainline • Travel time on mainline and on
ramps • Travel time reliability on mainline • Duration of congestion on mainline,
ramps, and nearby surface streets
• Emissions changes • Queue lengths on ramps, including any
spillback onto arterial network
will enable quick changes to system operations to address immediate issues, and longer term monitoring will indicate whether initial benefits decline over time as drivers become accustomed to the project. Responsibilities for conducting ongoing data collection and methods for using this feedback to change system operation should be defined in the deployment plan. Table 15 could also be used to define MOEs to be examined during a simulation analysis.
Task 4: A Framework for Further Including ATM in the Planning Process
Overview
A framework for including ATM in the planning process was developed based on the best practices reviewed in the literature and the ability of the authors to relate such practices to the planning process.
The 10 elements of the framework are as follows:
1. Encourage the inclusion of operations-related policies in local and regional plans. 2. Encourage the inclusion of reliability-based performance measures. 3. Provide historical information on the impacts of previous ATM projects. 4. Continue to make operations-related data available for the purposes of evaluation.

54
5. Relate ATM to statewide policies. 6. Highlight the non-capacity impacts of ATM. 7. Ensure the CMP and proposed screening guidelines support the project location. 8. Quantify impacts in a manner suitable for the CLRP, TIP, and related processes. 9. Document assumptions used for quantifying these impacts. 10. Help identify costs and funding sources.
Practices 1 and 7 demonstrate ways to consider ATM projects in regional comprehensive plans and the TIP; the execution of Practice 8 shows the types of data needed to show potential ATM impacts, and Practice 10 suggests how to identify preliminary costs and funding sources. Because the planning process is iterative rather than linear, the term “practice” rather than the term “step” is used.
Figure 3 shows two strategies for including ATM in the planning process: 1. Modify the transportation planning process to accommodate ATM. 2. Fit ATM into the planning process.
As pointed out by Grant et al. (2010b), many states—including Virginia—have already
taken steps to integrate operations practices into the transportation planning process; thus, the value of the framework in Figure 3 is that it suggests a few practices that should receive continued emphasis given the many priorities faced by operations and planning personnel.
Figure 3 aims to avoid duplication of existing planning-related processes. For example,
because Practice 1 entails problem identification and because Practice 2 entails analysis of a given project’s impacts, then clearly a necessary intermediate action—evaluation of alternatives—is missing. However, in practice, this identification and evaluation of candidate alternatives already occur within some operations-specific documents, notably the Long Range Intelligent Transportation Systems Plan (as discussed in VDOT NRO [2008] and the Northern Region Operations (NRO) FY–10 Strategic Investment Program Plan [VDOT, 2009]).
It may not be productive for staff to implement each practice in the framework for all potential ATM initiatives. Rather, the 10 practices are a menu of options that may be considered as necessary as their relative importance may vary on a case-by-case basis. The 10 practices are presented in the order in which they appear in Figure 3.
For the purposes of illustration, Appendix A demonstrates each practice with one
hypothetical ATM initiative in the Washington, D.C., metropolitan area: a VSL system (also known as a speed harmonization system) on I- 66 West, operational between noon and 8 P.M., near Milepost 72 in Arlington County. This example was chosen because unlike some other ATM strategies, a sketch planning methodology for estimating the congestion-related benefits was not readily available in the literature.

55
Figure 3. Framework for Including Active Traffic Management (ATM) in Planning Process. CMP = Congestion Management Process; MPO = Metropolitan Planning Organization; STARS = Strategically Targeted Affordable Roadway Solutions program; SYIP = Six Year Improvement Program; TIP = Transportation Improvement Program; VSTP = Virginia Surface Transportation Plan (2035). The planning process shown was simplified to emphasize linkages with potential ATM initiatives. For example, in theory, the TIP influences the MPO portion of the SYIP, with the TIP and SYIP being combined into the State Transportation Improvement Program (STIP) and submitted to the Federal Highway Administration/Federal Transit Administration (FHWA/FTA) for approval. In Virginia, however, projects that are desired for the SYIP influence to some degree those selected for the TIP; further, the opportunities for operations-planning linkage are at the TIP/SYIP level rather than the STIP level. Thus, Figure 3 omits the STIP and reflects Virginia’s 2-way relationship between the TIP and SYIP.
Descriptions of the Ten Practices Comprising the Framework 1. Encourage inclusion of operations-related goals in local and regional plans.
Practice 1 is accomplished by involving operations experts early in the long-range planning process, which nominally entails coordination between the appropriate VDOT operations unit, the MPO, and localities. The appropriate documents include the MPO’s CLRP, the transportation element of the city and county comprehensive plans, and planning documents produced by the VDOT operations unit for the MPO region. In the particular example provided in Appendix A, a relatively strong linkage already exists the Management, Operations, and Intelligent Transportation Systems (MOITS) Strategic Plan for the National Capital Region Transportation Planning Board (Franklin et al., 2010) and the VDOT NRO strategic plan (VDOT, 2008 and there is an opportunity to strengthen the connection between these documents and the transportation element of a particular local plan (County of Fairfax, 2009).

56
2. Encourage inclusion of reliability-based performance measures. As is the case with practice 1, practice 2 involves operations expertise early in the planning process. Traditional performance measures, such as those based on LOS, may not reflect of the ability of operations improvements to make incremental but tangible improvements to transportation system performance. Thus metrics such as the buffer index and vehicle-hours of delay, which can reflect an ability to respond to incidents, should be encouraged within the CMP. This encouragement may take the form of ongoing discussions between planners and operations personnel (see Practice 2 in Appendix A) or the provision of data that facilitate the use of these metrics. For instance, Table 16 relates the four ATM techniques summarized in Table 4 to potential performance measures for which the techniques might be expected to perform favorably. Table 16 is based only on a logical consideration of the expected impacts of the techniques. Over time, as ATM techniques are used in Virginia and data from other sources, such as INRIX, are collected and it may be possible to update Table 16 with more specific data elements. For instance, as mentioned in Practice 2 of Appendix A, there may be an opportunity to include a reliability-based metric such as the planning time index on the VDOT Dashboard (VDOT, 2012).
Table 16. Performance Measures for Which Active Traffic Management (ATM) Techniques May Be Expected to Perform Favorablya
Performance Measure ATM Technique Rationale for Strong Performance Buffer index Planning time index
Variable speed limits Dynamic ramp metering Queue warning systems
Systems expected to reduce variability in travel time such that 95th percentile travel time is brought closer to mean travel time (for buffer index) or the free flow travel time (for planning time index).
Travel time index Total delay
Hard shoulder running To extent that hard shoulder running is analogous to a capacity expansion, it should reduce overall delay.
Delay per vehicle Hard shoulder running Variable speed limits
Although all ATM systems reduce delay, these 2 should increase capacity and thus increase number of vehicles in system, resulting in lower delay per vehicle.
Average duration of periods with speed < 30 mph
Queue warning systems System should alert motorists to existing backups and, although not preventing them, may over time reduce additions to queue.
Number of periods with 30 mph < speed < 50 mph Number of periods with speed < 30 mph
Variable speed limits Dynamic ramp metering Hard shoulder running Queue warning systems
Barring changes in behavior because of latent demand, systems are expected to reduce number of slowed traffic periods.
Monetized value of crash reductions. Mainline rear-end crashes
Variable speed limits Dynamic ramp metering Hard shoulder running Queue warning systems
Systems are expected to reduce crash frequency. However, different types of crashes may be reduced by different systemsa
Same-direction sideswipe crashes attributable to weaving
Dynamic ramp metering
It is possible that all ATM techniques will reduce these crashes; however, ramp metering may lead to higher reductions because of reduced turbulence.
aIt can be argued that provided site conditions are appropriate, all ATM techniques may have a good performance for all measures shown, since generally ATM techniques will smooth traffic flow. Table 16 simply aims to discriminate: it identifies metrics where a given ATM technique should have a strong performance relative to other ATM techniques based on how the given ATM technique affects traffic characteristics.

57
3. Provide historical information on impacts of previous ATM projects. As ATM projects are deployed in Virginia and elsewhere, information from these deployments may be made available for future reference, especially when the benefits and costs of these projects are under scrutiny. Studies that have shown limitations of ATM projects should also be included, such as observations of compliance rates in the United States. 4. Continue to make operations-related data available for purposes of evaluation.
VDOT operational data may be used for two purposes: (1) to identify locations where certain initiatives may be productive, which in essence complements the region’s CMP, and (2) to assess the performance of previous ATM initiatives. For example, if an ATM project is deployed to reduce queue lengths at a given location, probe data may be used to quantify the resultant change in queue lengths. 5. Relate ATM to statewide policies.
Although the MPO makes regional decisions, a selling point for ATM can be to relate
these techniques to statewide policies. For example, the long-range statewide surface transportation plan for 2035 stated that Virginia can use advanced technologies and programs that “effectively and reliably [move] people and goods while reducing the impact on the environment” (Commonwealth of Virginia, 2010). The plan cites 23 locations where ATM projects may be implemented in the medium-term timeframe of 8 to 15 years, and although most locations are in urban areas, some (e.g., I-77) are in more rural locations.
As another example, VDOT’s STARS program, led by VDOT’s Transportation and
Mobility Planning Division (TMPD), seeks to identify low-cost engineering modifications that have congestion- and safety-related benefits (VDOT, 2008). Such improvements typically can be deployed within 36 months, require no or minimal right-of-way acquisition, and have costs under $10 million (VDOT TMPD, 2009).
Koonce et al. (2009) reported that some MPOs have listed certain ATM initiatives as a
line item in the TIP. The advantage of such an approach is that it enables the MPO to place funds with such initiatives when such funds become available, even if a funding amount has not been designated. However, reviewers of an earlier draft of the VCTIR report pointed out that an unintended consequence (of the suggestion noted by Koonce et al. [2009]) could be that planners view ATM techniques as a special category of projects rather than techniques that need to be considered alongside more conventional capacity-based projects. 6. Highlight non-capacity impacts of ATM.
ATM projects generally have several characteristics that differentiate them from traditional capacity investments: ATM projects do not require substantial right-of-way investments (hence they may offer an environmental benefit); they may have a lower capital cost; there may be important associated safety implications; and they may require a greater

58
operations commitment once the project is deployed. Such impacts are appropriate to emphasize within the context of the regional or local vision for transportation improvements.
7. Ensure CMP and proposed screening guidelines support project location.
Ideally, the CMP will identify the project location as a congested area. An overview of
the CMP (NCRTPB, 2010b) indicated that the CMP “is important to long-range planning to help determine priorities for implementation and funding.” Inclusion in the CMP is not a guarantee of funding, but given the CMP’s emphasis on operational strategies, such as traveler information, safety service patrols, and TOCs, consideration of the CMP is appropriate.
By itself, the CMP will not indicate that a particular ATM technique will be effective, but
it will at least indicate the need for some type of operations-related solution. For this reason, the screening guidelines provided in Tables 8 through 12 would need to be applied as appropriate. For example, a site with few periods of recurring congestion over a 6-month interval would not likely yield operational benefits and a site with substantial run-off-the-road crashes would not likely yield substantial safety benefits. 8. Estimate impacts in manner suitable for CLRP, TIP, and related processes.
A suitable method for determining impacts is a method that meets these three criteria:
1. It can be applied within the data and time constraints of the planning process. For example, it may not be feasible to perform an advanced operations analysis for each proposed project.
2. It is transparent such that if assumptions are revised, the resultant change in impacts can be quantified. For example, although the best data may initially show a proposed ATM project will increase capacity during an incident by 3%, further study may show that capacity may increase only 1%. In such a scenario, the impact on travel time of these different capacity changes could be noted. Transparency is especially critical for benefit-cost calculations.
3. It enables the impacts of the ATM project to be framed in a manner that is consistent with the impacts of other projects in other planning documents. For example, the CLRP for the Washington, D.C., region identifies areas where speeds will be below 30 mph (NCRTPB, 2010c). The TIP provides estimates of costs, including costs for grouped operations projects such as smart traffic center upgrades, sensor installation, and the deployment of “bus information technology” for Route 244, etc. (NCRTPB, 2009). The CMP reports values of queue lengths and average travel speeds (Skycomp, Inc., 2009), and a proposed metric is vehicle-hours of delay (Franklin et al., 2010).
As an illustration of the third criterion, the crash reduction benefits of ATM and other
improvements could be quantified. A review of a report by Sinha and Labi (2007) and the Bureau of Labor Statistics’ CPI Inflation Calculator (Bureau of Labor Statistics, undated)

59
suggest that prevention of each nonfatal injury crash yields between $25,000 and $203,000 in societal benefits, depending on the assumed severity of the injury. These values are similar to the range of $22,900 to $188,000 reported by VDOT (2007). As shown in Figure 2, there are several planning-related processes: the CLRP and TIP are noted herein, but so are local plans and corridor studies. There may be ways to adapt the sketch-level techniques provided in Appendices A and B to a corridor study; the challenge would be that there would be more assumptions than are required at the project level. However, the decision maker may be in a position to determine whether, at an order of magnitude level, ATM is viable for a particular corridor. 9. Document assumptions in performance measure calculations.
As suggested by Dahlgren and Lee (2004), Franklin et al. (2010), Grant et al. (2010a),
and Tarnoff (2006), a performance measure, such as vehicle-hours of delay saved per calendar day, can be estimated for ATM projects. However, an agency can place its credibility at risk by providing such estimates because they are based on a number of assumptions that can be challenged with a more detailed study. Although eliminating such estimates can eliminate this risk, this framework does not suggest that these estimates be withheld. Rather, the framework suggests articulating the methodology that led to these estimates, which can then be revised during the planning process if stakeholders provide better information than what is currently available. 10. Help identify costs and funding sources.
Estimation of costs is analogous to estimation of impacts in that both require a substantial number of assumptions. However, some type of cost information is required for the TIP; further, identification of potential funding sources (e.g., the availability of CMAQ funds for a project that will reduce emissions) may increase the likelihood of implementation. If specific cost information is not available, one approach for identifying costs is to present a range of values based on costs identified in the literature—not surprisingly, such variability will be high but will simply reflect what is known at the planning stage.
CONCLUSIONS 1. Although Europe has substantial experience using ATM, deployments in the United States
are few and relatively new. Because of limited domestic data, it is difficult to ascertain how transferable European experiences are to the United States. Legal barriers to automated enforcement and differences in driver behavior in the United States could mitigate some of the benefits observed in Europe.
2. Basic site screening guidelines can be developed to assess locations where ATM may be
appropriate, how the deployments should be evaluated, and how ongoing monitoring should be conducted, but specific, quantitative thresholds cannot be created because of the strong influence of site- and deployment-specific characteristics.

60
3. Planning documentation suggests that operational initiatives are already being considered to some degree within the planning process. MPOs in Virginia and other states (FHWA, 2009b,c; Grant et al., 2010a,b; Ravanbakht et al., 2006) provided examples of operational initiatives being mentioned in the CLRP, the TIP, or planning-related documents.
4. An opportunity exists to increase the possibility that ATM initiatives will be considered by
facilitating the computation of appropriate performance measures. An example of this opportunity is that in one Virginia MPO a variety of operations-friendly performance measures were identified (Franklin et al., 2010). This opportunity may be exercised in three ways.
• Computation of congestion measures. Because the literature provides a methodology to
compute these measures for only some ATM initiatives at a sketch planning level (TransCore, 1998), techniques for computing measures for other ATM initiatives, as exemplified in Table A1 of Appendix A, may be needed. Eight specific congestion-related performance measures that VDOT may wish to consider include buffer index, planning time index, travel time index, total vehicle-hours of delay, average delay per vehicle, number of periods where the average travel speed is between 30 and 50 mph, number of periods where the average travel speed is below 30 mph, and average duration of periods where speeds are below 30 mph.
• Computation of safety and environmental metrics. Table 15 aligns potential safety,
congestion, and environmental metrics with select ATM techniques based on information currently available.
• Computation of benefit-cost. Benefit-cost (Franklin et al., 2010) is one way to include safety- and emissions-related benefits to the extent that these externalities can be monetized. The high societal cost of crashes renders a safety-related performance measure relevant if ATM strategies can be shown to reduce crash risk in Virginia applications.
5. Opportunities exist to influence the planning process to consider ATM techniques more fully.
Processes are dynamic: although the elements may nominally be fixed (e.g., compute a project’s benefits), their interpretation may be more flexible (e.g., define benefits as not only the reduction in average delay but also as a reduction in travel time variability.) Conclusion 3 signifies that ATM techniques may already be considered in the existing planning process. Other ways to encourage the inclusion of ATM within the planning process are explicitly mentioning ATM initiatives in local plans; documenting key assumptions regarding ATM benefits as noted in Appendix A; linking ATM initiatives to a region’s CMP; articulating the environmental and safety impacts of ATM initiatives to the extent supported by data; and facilitating the computation of the metrics noted in Conclusion 4. Although their congested nature renders urban areas a logical test bed for initial ATM strategies, none of these opportunities excludes rural areas from considering ATM strategies to the extent they are supported by the metrics in Conclusion 2.

61
RECOMMENDATIONS 1. VDOT’s OSD should consider using the guidelines presented in this report as a preliminary
screening tool to assess potential ATM deployments. If a proposed deployment site passes the preliminary screening, more detailed simulation analysis may be warranted to ensure that the specific project is viable.
2. The Virginia Center for Transportation Innovation and Research (VCTIR), in cooperation
with VDOT’s OSD, TED, and TMPD, should conduct a workshop or a series of workshops to educate VDOT decision makers, VDOT technical staff, and MPO staff regarding the benefits of ATM initiatives and considerations for their deployment. A planning committee for the workshops consisting of VCTIR, OSD, TED, and TMPD would be formed to define the agenda, format, and intended audience for these workshops. It is recommended that at least two workshops be conducted: one short, focused workshop for executive leadership and another, longer workshop for technical staff. Potential agenda items might include ATM effectiveness; guidelines for deployment, analysis, and monitoring of ATM projects; data sources available for evaluation; selection of the most meaningful performance measures, and methods to integrate consideration of ATM into the planning process.
3. VDOT’s OSD should work with the VDOT regions to monitor the impact of any ATM
projects deployed in Virginia. Given the limited U.S. experience with ATM, it is difficult to predict how drivers might react to these treatments. Any deployments should be comprehensively monitored so that analysis assumptions used in subsequent deployments can be further improved and refined. The concept of a workshop, as described in Recommendation 2, is a key outreach effort to OSD and the regions so that they can be aware of the importance of monitoring the effects of ATM deployments.
4. VCTIR, in conjunction with VDOT’s OSD, TED, and regions, should pursue an additional
project that would demonstrate how to conduct a detailed ATM pre-deployment analysis for a specific site. Although this report provides some screening guidelines for applying ATM, there is a need to provide a case study that illustrates a detailed analytical procedure for assessing a specific site for ATM. Future work could analyze sites in the Central Region or Eastern Region as a demonstration of this process. The workshops described in Recommendation 2 would be used to help define potential case study locations for this task.
5. VDOT district staff who serve on an MPO technical advisory committee or equivalent should
consider encouraging MPOs to use actively at least one performance measure that shows the potential of operational strategies. Details of how this may be performed statewide are given in the “Implementation Prospects” section of this report. The workshops described in Recommendation 2 would be used to help educate technical staff on the importance of performance measurement when evaluating ATM projects.
6. The same VDOT staff who serve on the MPO technical advisory committee should consider
encouraging use of the framework, shown in Figure 3, as appropriate in order to incorporate ATM more fully into the planning process. Elements of this framework include providing an estimate of impacts at the sketch planning level when more detailed impact data are not
62
available; documenting key assumptions for computing such impacts, using Appendix B as a template for adapting new sketch planning methods when necessary; and linking planning documentation with operations documentation. This would occur following the workshop outreach effort described in Recommendation 2.
7. VDOT’s OSD, TED, and TMPD should continue to pursue the use of performance measures
to quantify the operational impacts of both traditional capacity expansion projects and operational improvements such as ATM. VDOT currently uses a small number of operational performance measures on the VDOT Dashboard (VDOT, 2012). VDOT’s OSD, TED, and TMPD should continue to advocate the use of performance measures, and expand division capabilities to track operational impacts on Virginia’s roads. As noted in Appendix A, Practice 2, there may be an opportunity to include a particular reliability measure on the VDOT Dashboard; this option could be explored in tandem with the selection of performance measures noted in Recommendation 2.
IMPLEMENTATION PROSPECTS
Feasibility of Implementing Each Recommendation
Recommendation 1 will be able to be adopted by VDOT’s OSD and will be useful as
additional ATM projects are developed. Recommendation 2 has the support of VDOT’s OSD, TED, and TMPD and should be
able to be implemented. For the goals of the workshops to be achieved, executive leadership and key decision makers will need to be in attendance. Coordination of schedules could prove to be a barrier to the wide dissemination of information through the workshops, but it is anticipated that key personnel will be able to attend.
Recommendation 3 will require a commitment by VDOT staff to track and quantify benefits over time. This will require staff resources as well as analytical tool and data streams that will be able to show the benefits of the system. The workshops from Recommendation 2 will help staff identify the resources required to conduct this evaluation.
Recommendation 4 will require additional work by VCTIR in cooperation with VDOT’s
Central Office and the selected VDOT region; however, the analysis will help facilitate usage of the guidelines in this report and provide a model analysis for reference in future ATM deployments. The workshops may help define a location.
Recommendation 5 may be implemented in several ways. As an illustration, more than
two dozen metrics are listed in Table 6 as being potentially used by the NCRTPB and eight congestion-related metrics were computed in Table A1. Although it is not necessary to compute all of these metrics, VDOT may encourage the use of at least one metric that is based on travel time reliability since such a metric can more readily show the impact of operations strategies than other measures of congestion. VDOT’s recent acquisition of archived and real-time INRIX data should provide a new data stream that is well suited to many operational performance

63
measures and should increase the likelihood that this recommendation is adopted. Encouragement may result from VDOT providing sample results from some of its 45 continuous count stations in Northern Virginia (or other sources such as the INRIX data) as appropriate. Appendix A, Practice 2, illustrates the computations from one continuous count station for the eight performance measures identified in Conclusion 4.
Recommendations 5 and 6 may be implemented through the appropriate VDOT district
staff who serve on MPO technical advisory committees. The particular VDOT staff who serve on these committees vary by MPO; usually one VDOT staff person is the main contact and one is the alternate. Examples of position titles of such staff are senior transportation engineer, transportation engineer, assistant district administrator, transportation planning engineer, and program administration specialist II. The MPO technical advisory committee differs from the voting members of the MPO policy board; although VDOT is a member of these boards, representation is usually at the level of the district administrator. In at least one rural MPO, however, there is no technical advisory committee; if these recommendations were to be implemented, implementation would logically fall to the VDOT representative on the policy board. Further, although the VDOT district staff are the liaisons to the MPO technical advisory committees, they can be supported by the operations entities. For example, the VDOT staff who serve on the NCRTPB Technical Advisory Committee can be supported by either VDOT’s NRO staff or VDOT’s OSD staff in the computation of one or more performance measures. The workshops may help with both of these efforts.
Recommendation 7 will require additional staff time and resources from VDOT’s TED
and OSD to implement. VDOT recently purchased statewide INRIX data, and a number of Bluetooth re-identification units have been deployed around the state. These new data sources provide a rich source of speed and travel time data that can be used to monitor congestion changes. Although new data streams are enriching the roadway status information available, staff time is required to process the data and transform it into useful information for decision makers. An ongoing commitment from VDOT’s TED and OSD is required to develop and improve operational performance measures beyond what is currently used by VDOT.
Complexity Associated With Recommendations 1, 5, and 6 Although conceptually straightforward, Recommendations 1, 5, and 6 are more complex
in practice than they may appear for two reasons.
1. Performance measurement may denote an array of values rather than a single value describing a project’s impact. The VSL system deployment on the Woodrow Wilson Bridge may be used as an example. For just a single “performance measure” such as speed, a review of Nicholson et al. (2011) demonstrated that conceivably several dozen values could be reported, based on three possible time periods (morning, noontime, and evening peak); three methodologies (average speed, median speed, and 85th percentile speed); location (e.g., upstream of the bottleneck, downstream of the bottleneck, and overall); and time frame (e.g., Month 1, Month 2, and so forth). Given that there are multiple performance measures of interest for a given project, a

64
comparison of project benefits at a systems level can require the synthesis of a large amount of data.
2. Planning is collaborative. Elements of regional planning, such as establishment of a
vision; identification of alternatives; and selection of projects for the shorter range TIP or the longer range CLRP—is a collaborative process with large groups of stakeholders. As is the case with other stakeholders, this planning process is influenced by, but not controlled by, VDOT participation.
For both reasons, although the VDOT district staff are the liaisons to the MPOs, it is
logical that such staff would require support from a VDOT work unit that has direct involvement with computing performance measures based on ATM techniques. A possible source of this support is thus the statewide or regional operational units within VDOT, such as NRO or OSD. These operational units are not the only possible source of support but may be the units with the greatest vested interest in ensuring that the necessary technical resources are available if VDOT chooses to move forward with Recommendations 1, 5, and 6.
Opportunity Associated With Recommendation 6
Although the hypothetical case study associated with Appendices A and B was conducted at the site (e.g., project) level, the 10 practices can be conducted at the corridor level, where a variety of alternatives may be considered. The challenge in such an application would be the development of quantifiable metrics in support of Practice 8 (e.g., where the impacts of potential ATM strategies are estimated). This challenge results because although state DOTs can draw upon a rich database for understanding traditional capacity improvements (e.g., the first edition of the Highway Capacity Manual was published in 1950), there is much less information for quantifying ATM impacts, especially at the corridor level where more assumptions must be made than at the project level. However, such corridor studies are an opportunity to introduce decision makers to ATM concepts, and thus corridor studies are an appropriate avenue to explore further. In this regard, the information from Recommendation 3 can inform decision makers. As noted by one reviewer of this report, an assessment of ATM at the corridor level “provides a rational transition to advancing ATM to the TIP and CLRP planning process” (Pardo, 2012).
ACKNOWLEDGMENTS
This report benefitted strongly from insights provided by the project’s technical review panel: Chris Francis, Robin Grier, Mena Lockwood, and Valerie Pardo (Virginia Department of Transportation) and Keith Nichols (Hampton Roads Transportation Planning Organization).

65
REFERENCES AECOM Consulting Transportation Group, Bellomo-McGee Inc., and Ned Levine & Associates.
Considering Safety in the Transportation Planning Process. Federal Highway Administration, Washington, DC, 2002. http://tmip.fhwa.dot.gov/resources/clearinghouse/docs/safety/. Accessed April 20, 2010.
Arseneau, B. Active Traffic Management in Minnesota. Presented at the 91st Annual Meeting of the Transportation Research Board, Washington, DC, January 2012.
Atkins Consulting. I-4 Variable Speed Limits Effectiveness Study. Orlando, FL, 2009.
Banks, J.H. Effect of Time Gaps and Lane Flow Distributions on Freeway Bottleneck Capacity. In Transportation Research Record: Journal of the Transportation Research Board, No. 1965. Transportation Research Board of the National Academies, Washington, DC, 2006, pp. 3-11.
Bauer, J.K., Smith, M.C., and Pecheux, K.K. The Regional Concept for Transportation Operations: A Practitioner’s Guide. FHWA-HOP-11-032. Federal Highway Administration, Washington, DC, 2011. http://ops.fhwa.dot.gov/publications/fhwahop11032/fhwahop11032.pdf. Accessed May 25, 2012.
Beans, S. A Dynamic Variable Speed Limit System. 9th World Congress on Intelligent Transportation Systems. Chicago, 2002.
Belz, N.P., and Garder, P.E. Maine Statewide Deployment and Integration of Advanced Traveler Information Systems. In Transportation Research Record: Journal of the Transportation Research Board, No. 2129. Transportation Research Board of the National Academies, Washington, DC, 2009, pp. 16-23.
Berman, W., and Mayhew, R. Regional Collaboration to Improve Safety, Reliability, and Security. Public Roads, Vol. 68, No. 3, 2004, pp. 9-13.
Bertini, R.L., Boice, S., and Bogenberger, K. Dynamics of Variable Speed Limit System Surrounding Bottleneck on German Autobahn. In Transportation Research Record: Journal of the Transportation Research Board, No 1978. Transportation Research Board of the National Academies, Washington, DC, 2006, pp. 149-159.
Bureau of Labor Statistics. CPI Inflation Calculator. http://www.bls.gov/data/inflation_calculator.htm. Accessed October 14, 2010.
Cambridge Systematics, Inc.. Twin Cities Ramp Meter Evaluation: Final Report. Oakland, CA, 2001.
Cambridge Systematics, Inc., Dowling Associates, Inc., System Metrics Group, Inc., and Texas Transportation Institute. Cost-Effective Performance Measures for Travel Time Delay,

66
Variation, and Reliability. NCHRP Report No. 618. Transportation Research Board of the National Academies, Washington, DC, 2008.
Capital District Transportation Committee. The Metropolitan Congestion Management Process. Albany, 2007. http://www.cdtcmpo.org/rtp2030/materials/cm-doc.pdf. Accessed August 23, 2010.
Chase, P., and Avineri, E. Maximizing Motorway Capacity Through Hard Shoulder Running: UK Perspective. The Open Transportation Journal, 2008, Vol. 2, pp. 7-18.
Chen, Y.-W., Chiang, Y.-S., and Wei, C.-H. A Comprehensive Performance Evaluation Framework of Urban Transport Policies Integrating Investment, Pricing, Regulation and Subsidy Options. In TRB 89th Annual Meeting Compendium of Papers DVD. Transportation Research Board of the National Academies, Washington, DC, 2010.
Coffman, M.T., and Makler, J. State of ITS: Telling the Intelligent Transportation Systems Success Story for Portland, Oregon. In TRB 86th Annual Meeting, Compendium of Papers CD-ROM. Transportation Research Board of the National Academies, Washington, DC, 2007.
Commonwealth of Virginia. Virginia Surface Transportation Plan 2035. Richmond, 2010. http://www.vtrans.org/resources/VSTP_Entire_Report.pdf. Accessed February 29, 2012.
Conkey, C. I-95 Panel Plans Satellite Traffic-Report Network. The Wall Street Journal, January 29, 2008, p. D5. http://online.wsj.com/article/SB120156134514523581.html?. Accessed October 12, 2010.
County of Fairfax. Fairfax County Comprehensive Plan, 2007 Edition, Policy Plan Transportation, Amended Through 3-9-2009. Fairfax, VA, 2009. http://www.fairfaxcounty.gov/dpz/comprehensiveplan/policyplan/transportation.pdf. Accessed August 24, 2010.
Dahlgren, J., and Lee, D.B., Jr. Integrating ITS Alternatives Into Investment Decisions in California. UCB-ITS-PRR-2004-40. University of California, Berkeley, 2004.
Delaware Valley Regional Planning Commission. Tracking Progress Toward 2030: Regional Indicators for the DVRPC Long Range Plan. Philadelphia, 2008a. http://www.dvrpc.org/reports/07027.pdf. Accessed August 23, 2010.
Delaware Valley Regional Planning Commission. 2008 Supplemental Projects Status Memorandum: DVRPC Congestion Management Process. Philadelphia, 2008b. http://www.dvrpc.org/CongestionManagement/pdf/2008-03_CMPStatus.pdf. Accessed August 24, 2010.
Delaware Valley Regional Planning Commission. DVRPC CMP Strategies by Subcorridor. 2009a. http://www.dvrpc.org/CongestionManagement/pdf/NJ_CMP_Strategies.pdf. Accessed August 23, 2010.

67
Delaware Valley Regional Planning Commission. Overview of the Congestion Management Process [CMP]. Philadelphia, 2009b. http://www.dvrpc.org/reports/09028A.pdf. Accessed August 23, 2010.
Denver Regional Council of Governments. Traffic Signal System Improvement Program 2010 Update Summary Report [Draft], Denver, 2010. http://www.drcog.org/documents/Draft%20TSSIP%202010%20Update%20Summary%20Report.pdf. Accessed August 24, 2010.
DKS Associates, PBSJ, and Jack Faucett Associates. A Domestic Scan of Congestion Pricing and Managed Lanes. Federal Highway Administration, Washington, DC, 2009.
Federal Highway Administration. Getting More by Working Together—Opportunities for Linking Planning and Operations. Washington, DC, 2004.
Federal Highway Administration. Priority, Market-Ready Technologies, and Innovations: DYNASMART-P. Washington, DC, 2006a.
Federal Highway Administration. Transportation Conformity Reference Guide. Washington, DC, 2006b. http://www.fhwa.dot.gov/environment/conformity/ref_guid/chap5.htm#reg_sig. Accessed August 25, 2010.
Federal Highway Administration. Applying Analysis Tools in Planning for Operations. 2009a. http://www.plan4operations.dot.gov/casestudies/analysis.htm. Accessed August 7, 2012.
Federal Highway Administration. The Denver Region Traffic Signal System Improvement Program: Planning for Management and Operations. Washington, DC, 2009b.
Federal Highway Administration. Regional Concept for Transportation Operations Fosters Planning for Operations in the Tucson Metropolitan Area. Washington, DC, 2009c.
Federal Highway Administration. Surface Transportation Efficiency Analysis Model (STEAM). Washington, DC, 2010. http://www.fhwa.dot.gov/steam/. Accessed August 24, 2010.
Franklin, C.A., Meese, A.J., Nelson, D., Vaughn, K., and J. Yin. Draft Strategic Plan for the Metropolitan Washington Management, Operations, and Intelligent Transportation Systems (MOITS) Planning Program. Metropolitan Washington Council of Governments, Washington, D.C., 2010. http://www.mwcog.org/uploads/committee-documents/fF5ZVlZW20100609100430.pdf. Accessed August 20, 2010.
Fudala, N.J. and Fontaine, M.D. Work Zone Variable Speed Limit Systems: Effectiveness and System Design Issues. VTRC 10-R20. Virginia Transportation Research Council, Charlottesville, 2010. http://www.virginiadot.org/vtrc/main/online_reports/pdf/10-r20.pdf. Accessed September 10, 2010.
Fuhs, C. Synthesis of Active Traffic Management Experiences in Europe and the United States. FHWA-HOP-10-031. Federal Highway Administration, Washington, DC, 2010.

68
Gerlough, D.L., and Huber, M.J. Traffic Flow Theory. Transportation Research Board of the National Academies, Washington, DC, 1975.
Grant, M., Bauer, J., Plaskon, T., and Mason, J. Advancing Metropolitan Planning for Operations: An Objectives-Driven, Performance-Based Approach: A Guidebook. Federal Highway Administration, Washington, DC, 2010a.
Grant, M., Bowen, B., Jasper, K., Maggiore, M., and Wallis, E. Statewide Opportunities for Integrating Operations, Safety, and Multimodal Planning: A Reference Manual. Federal Highway Administration, Washington, DC, 2010b. http://www.fhwa.dot.gov/planning/statewide/manual/manual.pdf. Accessed August 27, 2010.
Haas, R., Carter, M., Perry, E., Tombly, J., Bedsole, E., and Margiotta, R. iFlorida Model Deployment Final Evaluation Report. FHWA-HOP-08-050. Federal Highway Administration, Washington, DC, 2008.
Hadi, M., Shen, L., Zhan, C., Xiao, Y., Corbin, S., and Chen, D. Operation Data for Evaluating Benefits and Costs of Advanced Traffic Management Components. In Transportation Research Record: Journal of the Transportation Research Board, No. 2086. Transportation Research Board of the National Academies, Washington, DC, 2008, pp. 48-55.
Hampton Roads Transportation Planning Organization. Operations Planning. Chesapeake, 2009. http://hrtpo.org/TPO_OpPlanning.asp. Accessed May 23, 2012.
International Technology Scanning Program. Executive Summary: Freeway Geometric Design
for Active Traffic Management in Europe. Federal Highway Administration, Washington, DC, 2010.
Jacobson, L., Henry, K., and Mahyar, O. Real-Time Metering Algorithm for Centralized Control. In Transportation Research Record: Journal of the Transportation Research Board, No. 1232. Transportation Research Board of the National Academies, Washington, DC, 1989, pp. 17-26.
Jacobson, L. Active Traffic Efforts in the Seattle Area. Presented at the 2008 Northwest Transportation Conference, Oregon State University, Corvallis, 2008. http://www.oregon.gov/ODOT/TD/TP_RES/docs/2008NWTC/2008_presentations/2A_2_jacobson.pdf?ga=t. Accessed September 9, 2010.
Jacobson, L. Smarter Highways: Seattle ATM Update. Presented at the 91st Annual Meeting of the Transportation Research Board, Washington, DC, January 23, 2012.
Kianfar, J., Edara, P., and Sun, C. Empirical Evaluation of Variable Speed Limit Systems on FreewaysA Case Study of Deployment in Missouri. Unpublished manuscript. University of Missouri-Columbia, 2010.

69
Koonce, P., Lee, K., and Urbanik, T. Regional Traffic Signal Operations Programs: An Overview. Federal Highway Administration, 2009. http://www.ops.fhwa.dot.gov/publications/fhwahop09007/fhwahop09007.pdf. Accessed August 26, 2010.
Kozlak, M.C. The Future of MPOs: MPOs Combined with Operations and Management—The Twin Cities Experience. In The Metropolitan Planning Organization, Present and Future. Conference Proceedings 39. Transportation Research Board of the National Academies, Washington, DC, 2007, pp. 44-45.
Kuhn, B. Efficient Use of Highway Capacity Summary. Report FHWA-HOP-10-023. Texas Transportation Institute, College Station, 2010.
Kwon, E., Park, C., Lau, D., and Kary, B. Development and Field Assessment of Variable Advisory Speed Limit System. In 18th World Congress on Intelligent Transportation Systems Proceedings. Orlando, FL, 2011.
Lipp, L.E., Corcoran, L.J., and Hickman, G.A. Benefits of Central Computer Control for Denver Ramp Metering System. In Transportation Research Record: Journal of the Transportation Research Board, No. 1320. Transportation Research Board of the National Academies, Washington, DC, 1991, pp. 3-6.
Lyman, K., and Bertini, R.L. Using Travel Time Reliability Measures to Improve Regional Transportation Planning and Operations. In Transportation Research Record: Journal of the Transportation Research Board, No. 2046. Transportation Research Board of the National Academies, Washington, DC, 2008, pp. 1-10.
Martin, W.A., and McGuckin, N.A. Travel Estimation Techniques for Urban Planning. NCHRP Report 365. Transportation Research Board of the National Academies, Washington, DC, 1998.
Mazzenga, N.J., and Demetsky, M.J. Investigation of Solutions to Recurring Congestion on Freeways. VTRC 09-R10. Virginia Transportation Research Council, Charlottesville, 2009.
McElwain, A.T. Approaches for Integrating Systems Engineering Into Your Agency’s Business Practices. Talking Technology and Transportation (T3) Webinar, 2007. http://www.pcb.its.dot.gov/t3/s070802/s070802_mcelwain.pdf. Accessed October 9, 2012.
Mirshahi, M., Obenberger, J., Fuhs, C.A., Howard, C.E., Krammes, R.A., Kuhn, B.T., Mayhew, R.M., Moore, M.A., Sahebjam, K., Stone, C.J., and Yung, J.L. Active Traffic Management: The Next Step in Congestion Management. Federal Highway Administration, Washington, DC, 2007.
Monsere, C.M., Bertini, R.L., Ahn, S., and Eshel, O. Using Archived Data to Measure Operational Benefits of a System-wide Adaptive Ramp Metering (SWARM) System. Portland State University, Portland, OR, 2008.

70
Montes de Oca, N., and Levinson, D. Network Expansion Decision Making in Minnesota’s Twin Cities. In Transportation Research Record: Journal of the Transportation Research Board, No. 1981. Transportation Research Board of the National Academies, Washington, DC, 2006, pp. 1-11.
Morales, J. Improving Traffic Signal Operations: A Primer. Federal Highway Administration, Washington, DC, 1995.
National Audit Office. Tackling Congestion by Making Better Use of England’s Motorways and Trunk Roads. London, 2004.
National Capital Region Transportation Planning Board. Transportation: The TPB Vision. Metropolitan Washington Council of Governments, Washington, DC, 1998. http://www.mwcog.org/transportation/activities/vision/. Accessed September 10, 2010.
National Capital Region Transportation Planning Board. TPB Travel Forecasting Model, Version 2.2, Specification, Validation, and User’s Guide. Washington, DC, 2008. http://www.mwcog.org/uploads/committee-documents/kl5fWlle20080303164551.pdf. Accessed May 11, 2010.
National Capital Region Transportation Planning Board. Transportation Improvement Program for the Metropolitan Washington Region [Northern Virginia] FY 2010– 2015. Metropolitan Washington Council of Governments, Washington, DC, 2009. http://www.mwcog.org/clrp/projects/tip/fy1015tip/VA_FY_2010-2015_TIP.pdf. Accessed October 12, 2010.
National Capital Region Transportation Planning Board. Major CMP Components. Metropolitan Washington Council of Governments, Washington, DC, 2010a. http://www.mwcog.org/clrp/elements/cmp/components.asp. Accessed August 20, 2010.
National Capital Region Transportation Planning Board. What Is the CMP? Metropolitan Washington Council of Governments, Washington, DC, 2010b. http://www.mwcog.org/clrp/elements/cmp. Accessed August 20, 2010.
National Capital Region Transportation Planning Board. CLRP: Long-Range Transportation Plan. Metropolitan Washington Council of Governments, Washington, DC, 2010c. http://www.mwcog.org/clrp/default.asp. Accessed September 7, 2010.
Nichols, K. Email to Michael Fontaine, April 5, 2012.
Nicholson, R.T., Crumley, S.C., Romero, M., and Usman, A.S. Field Implementation of Variable Speed Limits on the Capital Beltway (I-95/I-495) for Woodrow Wilson Bridge Project. In TRB 90th Annual Meeting Compendium of Papers DVD. Paper No. 11-0529. Transportation Research Board of the National Academies, Washington, DC, 2011.
Olyott, S. Active Traffic Management Control System for English Motorways: Reducing Congestion Through Innovation. In Proceedings of the 12th World Congress on Intelligent Transportation Systems. ITS America, San Francisco, 2005.

71
Oregon Department of Transportation. Annual Performance Progress Report: Executive Summary Time Period: Fiscal Year 2003-2004. Salem, 2004. http://www.oregon.gov/ODOT/CS/PERFORMANCE/docs/ODOTPerformance04.pdf?ga=t. Accessed October 13, 2010.
Papageorgiou, M., Hadi-Salem, H., and Middelham, F. ALINEA Local Ramp Metering: Summary of Field Results. In Transportation Research Record: Journal of the Transportation Research Board, No. 1603. Transportation Research Board of the National Academies, Washington, DC, 1997, pp. 90-98.
Papgeorgiou, M., Kosmatopoulos, E., and Papmichail, I. Effects of Variable Speed Limits on Motorway Traffic Flow. In Transportation Research Record: Journal of the Transportation Research Board, No. 2047. Transportation Research Board of the National Academies, Washington, DC, 2008, pp. 47-48.
Pardo, V. E-mail to John Miller, May 18, 2012.
PB Americas, Inc., Carter + Burgess, EarthTech, Inc., and Telvent Farradyne. Active Traffic Management (ATM) Feasibility Study. Washington State Department of Transportation, Seattle, 2007. http://www.psrc.org/assets/524/ATMfeasiblitystudy.pdf. Accessed September 7, 2010.
Pesti, G., Wiles, P., Cheu, R.L., Songchitruksa, P., Shelton, J., and Cooner, S. Traffic Control Strategies for Congested Freeways and Work Zones. FHWA/TX-08/0-5326-2. Texas Transportation Institute, College Station, 2008.
Puget Sound Regional Council. Appendix A: Transportation 2040 Alternatives Analysis Congestion Management Process Report (T240 DEIS Appendix I May 2009). Seattle, 2009. http://psrc.org/assets/3544/Smart_Corridors_Appendix_A.pdf. Accessed July 21, 2010.
Puget Sound Regional Council. SMART Corridors/CMP Report. Seattle, 2010. http://psrc.org/assets/3543/CMPChap1-4.pdf. Accessed July 21, 2010.
Ravanbakht, C., Akan, G., Hanshaw, S., and Allsbrook, L. Linking Planning and Operations to Improve Regional Mobility and Safety in Hampton Roads, Virginia. In Transportation Research Record: Journal of the Transportation Research Board, No. 1978. Transportation Research Board of the National Academies, Washington, DC, 2006, pp. 184-192.
Ristola, T., and Muurinen, I. Local Queue Warning SystemA Solution to Reduce Rear End Collisions? In Intelligent Transportation: Realizing the Future. Abstracts of the Third World Congress on Intelligent Transportation Systems. ITS America, Orlando, FL, 1996.
Schrank, D., and Lomax, T. 2009 Urban Mobility Report. Texas Transportation Institute, College Station, 2009.

72
Science Applications International Corporation. Rural Intelligent Transportation Systems (ITS) Toolbox. Federal Highway Administration, Washington, DC, 2002. http://www.itsdocs.fhwa.dot.gov/JPODOCS/REPTS_TE/13477.html. Accessed September 7, 2010.
Sinha, K.C., and Labi, S. Transportation Decision Making. John Wiley & Sons, Inc., Hoboken, NJ, 2007.
Sisiopiku, V.P., Sullivan, A., and Fadel, G. Implementing Active Traffic Management Strategies in the U.S. University Transportation Center for Alabama, UTCD Report 08206. Birmingham, 2009.
Skycomp, Inc. Traffic Quality on the Metropolitan Washington Area Freeway System. Metropolitan Washington Council of Governments, Washington, DC, 2009. http://www.mwcog.org/uploads/pub-documents/81ZdXg20090526131814.pdf. Accessed August 20, 2010.
Southeastern Michigan Council of Governments. Regional Concept for Transportation Operations (RCTO) Final Report: Southeast Michigan Experience, Detroit, 2007.
Tarnoff, P. J. Now There’s a Thought: Planning for Traffic Management and Operations. Traffic Technology International, December 2005/January 2006, pp. 40-44.
Tignor, S.C., Hawkins, H.G, Brown, L.L., Butner, J.L., Cunard, R., Davis, S.C., Fischer, E.L., Kehrli, M.R., Rusch, P.F., and Wainwright, W.S. Innovative Traffic Control Technology and Practice in Europe. Federal Highway Administration, Washington, DC, 1999.
Toffin, E., Intelligent Hard Shoulder: When Congestion Relief Meets Safety. Institute of Transportation Engineers 2004 Annual Meeting and Exhibit. Lake Buena Vista, FL, 2004.
TransCore. Integrating Intelligent Transportation Systems Within the Transportation Planning Process: An Interim Handbook. Federal Highway Administration, Washington, DC, 1998.
Transportation Planning Research Advisory Committee. TPRAC Minutes. Virginia Transportation Research Council, Charlottesville, 2004. http://www.vtrc.net/tprac/pdf/MinutesSpring2004.pdf. Accessed October 10, 2012.
Transportation Planning Research Advisory Committee. Draft Minutes of the Transportation
Planning Research Advisory Committee, Virginia Transportation Research Council, November 10, 2008. http://www.vtrc.net/tprac/pdf/MinutesFall2008%20_2_.pdf. Accessed May 25, 2012.
Tucker, S., Tarry, S. Abou-Rahme, N., and Rees, T. The Control of Traffic Using Variable Speed Limits: The UK Experience of Controlled Motorways. In Proceedings of the 12th World Congress on Intelligent Transportation Systems. ITS America, San Francisco, 2005.

73
Virginia Department of Transportation. Highway Safety Improvement Program, Fiscal Year 2008-2009. Richmond, 2007.
Virginia Department of Transportation. VDOT Road Safety Assessment Guidelines. Richmond, 2008. http://www.virginiadot.org/business/resources/traffic_eng_hsip/VDOT_RSA_Guidelines_200804.pdf. Accessed February 29, 2012.
Virginia Department of Transportation. Northern Region Operations (NRO) FY–10 Strategic
Investment Program Plan (SIPP). Chantilly, 2009. Virginia Department of Transportation, Northern Region Operations. Concept of Operations
Guidance Document and Template. Chantilly, 2009. http://vdot-itsarch.com/docs/VDOTNROConOpsGuideandTemplateV1(2009-09-25).doc. Accessed October 12, 2010.
Virginia Department of Transportation, Traffic Engineering Division. Highway Safety Improvement Program (HSIP): Fiscal Year 2012-13. Richmond, 2011a. http://www.virginiadot.org/business/resources/ted_hsip_2011/HSIP_Guidelines_FY12-13.pdf. Accessed May 23, 2012.
Virginia Department of Transportation, Traffic Engineering Division. Variable Speed Limit Implementation Requirements and Guidance. Traffic Engineering Division Memorandum 370.0. Richmond, 2011b.
Virginia Department of Transportation. Highway Performance. Richmond, 2012. http://dashboard.virginiadot.org/Pages/Performance/Performance.aspx. Accessed October 16, 2012.
Virginia Department of Transportation, Transportation Mobility Planning Division. Request for
Proposal: Strategically Targeted Affordable Roadway Solutions (STARS), Reference No. TMPD 11-01. Richmond, 2009. http://www.virginiadot.org/RFP_STARS_12-3-2010_3_.pdf. Accessed February 29, 2012.
Waller, S.T., Ng, M.W., Ferguson, E., Nezamuddin, N., and Sun, D. Speed Harmonization and Peak-period Shoulder Use to Manage Urban Freeway Congestion. University of Texas at Austin, 2009. http://www.utexas.edu/research/ctr/pdf_reports/0_5913_1.pdf. Accessed August 19, 2010.
Washington State Department of Transportation. Active Traffic Management: Innovative Techniques for the Future. Olympia, September 2007.
Wasatch Front Regional Council. Wasatch Front Urban Area Regional Transportation Plan:
2007-2030 Technical Report 46. Salt Lake City, 2007. http://www.wfrc.org/cms/publications/Adopted_2007-2030_RTP/Chapter%208%20-%20Recommended%20Improvements.pdf. Accessed August 27, 2010.

74
Wiles, P.B., Cooner, S.A., Walters, C.H., and Pultorak, E.J. Advance Warning of Stopped Traffic on Freeways: Current Practices and Field Studies of Queue Propagation Speeds. FHWA/TX-03/4413-1, Texas Transportation Institute, College Station, 2002.
Wiles, P.B., Cooner, S.A., Rathod, Y., and Wallace, D.G. Advance Warning of Stopped Traffic on Freeways: Field Studies of Congestion Warning Signs. FHWA/TX-05/0-4413-2. Texas Transportation Institute, College Station, 2005.
Zhang, M., Kim, T., Nie, X., Jin, W., Chu, L., and Recker, W. Evaluation of On-ramp Control Algorithms. California PATH Research Report UCB-ITS-PRR-2001-36. University of California, Davis, 2001.

75
APPENDIX A
EXAMPLE OF A FRAMEWORK FOR FURTHER INCLUDING ATM IN THE PLANNING PROCESS
This appendix describes the application of 10 practices, discussed in Figure 3, that are designed to incorporate consideration of VSL systems into the planning process. By applying the 10 practices, the analyst is better able to compare ATM impacts with the impacts of other transportation investments that are also considered during the planning process. To clarify how the practices are executed, a hypothetical case study was developed. The case study reflects a real location: I-66 West in the Washington, D.C., metropolitan area (Arlington County near Milepost 72) and a real time period (noon to 8 P.M.). The term hypothetical denotes the fact that the ATM investment—a VSL system, also known as a speed harmonization system—has not actually been deployed at that location at this point in time. Because they are quite lengthy and their inclusion would disrupt the flow of the writing, the technical details of Practices 8 and 9 are given in Appendix B.
1. Encourage the inclusion of operations-related goals in local and regional plans.
In the Northern Virginia region, documents such as the Northern Region Operations Strategic Plan (VDOT, 2008) and the Management, Operations, and Intelligent Transportation Systems (MOITS) Strategic Plan for the National Capital Region Transportation Planning Board (Franklin et al., 2010) suggested such coordination already occurs or is intended to occur at an early stage. For example, VDOT (2008) noted that one of the NRO strategies is:
RSC-1. Planning Coordination – As an ongoing strategy, NRO will continue to support planning for operations both within the DC region as well as at the statewide level. These include participating in short-term and long-term strategic planning, emergency and incident response planning, and systems architecture development.
Similarly, a role of the MOITS Technical Subcommittee is:
advise the TPB on management, operations, and intelligent transportation systems issues as they relate to the CLRP and provide a forum for information exchange among the member agencies (Franklin et al., 2010).
One step VDOT can undertake is to ensure this project is discussed in the MOITS Technical Subcommittee. Another step is to encourage localities to adopt operations-friendly goals, objectives, or policies in their transportation plans. For example, Fairfax County’s (County of Fairfax, 2009) comprehensive plan states the following objective and policy:
Objective 10: Maximize the operational efficiency of transportation facilities. Policy a. Maximize the efficiency of existing roads through low-cost strategies to increase capacity such as channelization, turning lanes, optimized signalization, and signage, while avoiding negative impacts on pedestrians and bicyclists.

76
One modification would be to encourage the county to cite ATM projects explicitly within this Policy 10(a). Although such language would not commit the county to supporting ATM projects, it would provide guidance that such projects are an option in addition to the engineering improvements currently listed in Policy 10(a). A higher level opportunity may be to work with the National Capital Region Transportation Planning Board (NCRTPB). For example, its vision statement names specific safety strategies that should be considered, such as “skid-resistant pavements” and “better intersection controls.” If there is support for modifying the vision in the future, it could be appropriate to include operations-oriented examples within that particular strategy. 2. Encourage the inclusion of reliability-based performance measures.
Table 6 showed several reliability-based performance measures cited by the MOITS Strategic Plan (Franklin et al., 2010), such as the buffer index (Lyman and Bertini, 2008). Further, the CLRP for the region emphasizes the management and operations element of the CLRP, citing the importance of traveler information, traffic signal coordination, and incident management (NCRTPB, 2010c). Thus reliability is clearly a topic of interest.
The performance component of the CLRP has a section devoted to traditional measures
of congestion. Highway sections experiencing stop-and-go traffic flow (defined as below 30 mph) and congested flow (defined as 30 to 50 mph) and transit sections that are highly congested (100 to 120 people per car) or above capacity (more than 120 people per car) are identified for years 2008 and 2030.
One step VDOT can take is to encourage the inclusion of reliability-based metrics in
future updates to the performance section of the CLRP. Table A1 shows eight such metrics and applies them to a case study set. For example, for the section of I-66 discussed previously, VDOT speed monitoring data (Eq. A1) show that the buffer index for January-June 2010 would be approximately 1.3. The calculations in Eq. A1 assumed a 2-mile section of facility, although the length does not affect the results. Although the results in Table A1 were determined based on extrapolation of point detector data, these results could also be determined using archived travel time data from INRIX.
3.134.1minutes 2.19
minutes 2.19 - minutes 13.5
time travelAverage
time travelAverage - time travelpercentile5th 9indexBuffer
[Eq. A1]
Over time, VDOT may be able to make select data from its continuous count stations available for this purpose. Although there is a limited number of continuous count stations—a total of 45 stations at present in the Northern Virginia District (4 in Arlington, 29 in Fairfax, 5 in Loudoun, and 7 in Prince William)—these stations nonetheless provide some speed data in 15-min intervals that are relevant to the computation of these metrics. Additionally, other VDOT sources of data, such as that associated with the NRO’s Dynamic Message Sign (DMS) Travel Time Pilot Project (VDOT NRO, 2009) which makes use of vehicle probe data (Conkey, 2008)

77
Table A1. Eight Reliability-Based Performance Measures VDOT May Wish to Consider Performance Measure Definition Valuea
Buffer indexb (95th percentile travel time – Average travel time) ÷ Average travel time
1.34
Planning time indexb 95th percentile travel time ÷ Free flow travel time 2.56 Travel time indexb Peak travel time ÷ Free flow travel timec 1.15 Total vehicle-hours of delayb Number of vehicles (Free flow travel time – Travel
time) 63,380
Average vehicle-minutes of delayb Free flow travel time – Travel time 1.93 Number of congested flow periodsd Number of 15-min periods with speeds between 30 and
50 mph. 1,087
Number of periods with stop and go conditionsd
Number of 15-min periods with speeds below 30 mph 1,369
Average duration of stop and go conditionsb Average length of time speeds stayed below 30 mph 59 min VDOT = Virginia Department of Transportation. a Based on data for I-66 West at Link 190029 for the period January 1–May 20, 2010. b This performance measure is based on the Management, Operations, and Intelligent Transportation Systems (MOITS) Strategic Plan for the Transportation Planning Board (Franklin et al., 2010). c Peak period is defined as 6 A.M. to 9 A.M. and 4 P.M. to 7 P.M., consistent with the regional model (National Capital Region Transportation Planning Board, 2008). d This performance measure is based on the region’s constrained long range plan (National Capital Region Transportation Planning Board, 2010c). to provide travel time information. Further, INRIX data also provide information that may be used to compute values for some of these metrics. VDOT’s acquisition of INRIX data and recent additional deployments of Bluetooth readers are significantly expanding the size of the network with real-time and archived travel time data, which will be a powerful tool in future evaluations. It is conceivable that just as the VDOT Dashboard (2012) at present provides information on highway level of service (good, marginal, or poor), HOV travel speed performance (percentage of travel above 45 mph), incident duration (minutes of delay), and incident clearance (percentage of incidents cleared within 30, 30 to 60, 60 to 90, and 90+ minutes), the Dashboard could, in the future, provide information on how a key measure of reliability (e.g., the planning time index) was attained. 3. Provide historical information on impacts of previous ATM projects.
The impact of VSL systems will continue to be understood better as additional systems are deployed: a review of the literature by Fudala and Fontaine (2010) showed that VSL systems elsewhere have increased system throughput between 0% and 7%, and the review of Table 4 suggests a capacity increase of 1.5% to 10%. Safety impacts are variable, but Table 4 suggests VSL systems may potentially reduce injury crashes by 10% to 30% and PDO crashes by 30%.
In Virginia, a VSL application was shown to have potential benefits (Fudala and
Fontaine, 2010), but these benefits were contingent upon how the system is deployed and whether capacity is dramatically exceeded. Thus, one implication of these findings is that resources need to be expended in the operating years to ensure the system is deployed in a productive manner.

78
4. Continue to make operations-related data available for purposes of evaluation.
In this example, 15-min speed and volume data were available from a continuous count station available on I-66. Thus, although lessons from the literature are helpful, but Virginia-specific evaluation data can illustrate the potential of ATM initiatives to replace traditional investments—and some limitations to this approach, so that ATM initiatives may be fairly considered against other alternatives. If the VSL system is deployed at this location, for example, one could compare the number of periods with speeds less than 45 mph after deployment with the 232 such instances shown in Table B1 of Appendix B. This is another case where travel time data from INRIX or other sources would prove valuable. 5. Relate ATM to statewide policies.
The 2035 Virginia Surface Transportation Plan (Commonwealth of Virginia, 2010)
mentions advanced technologies and programs as a cost-effective way of moving people and goods while minimizing environmental impacts. ATM is listed as a line item in the plan on I-66 in the Northern Region between I-495 and Route 15 (e.g., west of the proposed location in this example). One technique could be to relate the performance at this location based on simulation or sketch planning methods (see Table A1) to performance at the location that is proposed in the Surface Transportation Plan.
Also of note is that in the recent past, VSL initiatives listed in the NRO Strategic Plan were not included in the TIP (VDOT, 2009), which is indeed reasonable, as individual initiatives such as this are not necessarily regionally significant. However, other operations initiatives have been included in the TIP even though they are not required, such as communication support for the traffic management center, CCTV equipment, and retrofits of changeable message signs. Thus if agreement with the MPO can be garnered, it may be appropriate to include bundles of ATM initiatives as a line item in the TIP if such bundling results from ensuring a complete project is included rather than viewing ATM projects as a special funding category.
Note also that projects that the interagency consultation process (which occurs between
the MPO, the state, and FHWA) has defined as not regionally significant do not have to be included in the TIP [FHWA, 2006b]. Thus, ATM projects may themselves be omitted from the TIP as line items, however, one would expect to still see these projects in other planning related documents such as the Six Year Improvement Program [SYIP]. Thus their inclusion in the TIP would be advantageous if one wanted to ensure there was MPO support for such projects. 6. Highlight the non-capacity impacts of ATM.
The NRO Strategic Plan (VDOT, 2009) emphasizes the need to prioritize operations-related efforts, stating that
NRO’s prioritized list of candidate projects is a useful tool to have when talking to those – CTB members, MPO members, elected officials, VDOT administrators, etc. – who might be able to influence the allocation of funding towards NRO’s projects.

79
In those instances, it may be productive to articulate the benefits of ATM projects relative to goals, objectives, and policies dictated by the MPO. For example, the NCRTPB’s vision includes eight general goals for how the region’s transportation system will develop; these goals are mapped to 30 objectives and 44 strategies. The impacts of VSL systems may be related to these goals, objectives, and strategies. For example, four characteristics of VSL systems may be considered:
1. The system does not increase the physical footprint of the roadway. 2. The system does not likely induce additional demand that might occur with a lane
widening; rather, most of its benefit is on addressing flow breakdowns. 3. The system may offer some emissions reductions in terms of VOCs. 4. The system may reduce crash risk through gradually reducing speeds (in advance of
an incident) rather than requiring a sudden stop by drivers who perceive stopped vehicles.
Each of these characteristics is implicitly contained in the NCRTPB vision. For example,
the fact that roadway expansion is avoided is supportive of the second goal’s fifth objective, which is providing transportation with “minimal adverse impacts” on the environment (e.g. air and water resources) and residents (including those who would be adversely affected by a highway expansion). The VSL characteristics may thus be directly related to elements of the vision of the NCRTPB (1998) as shown in Table A2.
Table A2 shows that these linkages are not always explicit but are nonetheless relevant.
For example, in 1998, the phrase “appropriate safety features in roadway design” likely referred to geometric elements such as sight distance, horizontal and vertical curvature, and signing (to avoid motorist information overload that might contribute to distracted driving). However, it may be pointed out that backwards forming shock waves arising from an incident also constitute a roadway hazard and thus a speed harmonization strategy that lessens the likelihood of full speed motorists suddenly encountering a queue of stopped vehicles is also a “roadway design” feature.
7. Ensure CMP and proposed guidelines support project location.
On I-66 West, the technical report supporting the interstate monitoring component of the CMP (Skycomp, Inc., 2009) reported congestion in the vicinity of Mileposts 69 through 72 (between Route 29 (Lee Highway) and Sycamore Street) after 6:30 P.M. when the HOV restrictions are not in place, with queues of 3 to 4 miles. Westbound congestion in the morning rush (when there are no restrictions in place) is also noted in the vicinity of Mileposts 68 through 71 (between Westmoreland Street and Fairfax Drive). Thus, according to the CMP, congestion is evident at this location.

80
Table A2. Ways to Link Variable Speed Limits (VSL) with Vision of National Capital Region Transportation Planning Board
Goala Objectivea Strategya Role of VSL 4. use the best available technology to maximize system effectiveness
4. Improved reliability and predictability of operating conditions on the region's transportation facilities
8. Develop operating strategies and supporting systems to smooth the flow of traffic
VSL is example of system that can smooth traffic flow
5. develop a transportation system that enhances and protects the region's natural environmental quality
4. reductions in 1999 levels of mobile source pollutants
1. Implement a regional congestion management program, including . . . traffic operations improvements
VSL has potential to reduce certain types of VOC emissions attributable to queue breakdowns
2. develop, implement, and maintain an interconnected transportation system
5. Efficient and safe movement of people, goods . . . with minimal adverse impacts on residents and the environment
1 . [take] full advantage of existing infrastructure b
VSL itself does not require a physical infrastructure expansion
3. give priority to management, performance, maintenance, and safety of all modes and facilities
2. Enhanced system safety through . . . appropriate safety features in facility design
3. Support the implementation of effective safety measures, including . . . elimination of roadside hazards
VSL may gradually reduce speeds of motorists who otherwise, when traveling at full speed, would encounter a queue of stopped vehicles
VOC = volatile organic compounds. a The goals, objectives, and strategies are direct quotations from National Capital Region Transportation Planning Board (1998). b Because the full strategy reads “Define and identify existing and proposed regional activity centers, taking full advantage of existing infrastructure, for the growth and prosperity of each jurisdiction in the region,” the emphasis is on where new land development is located. However, the use of Active Traffic Management techniques that serve densely populated or employed areas may be viewed as a way of helping maximize the transportation system’s performance for such areas.
Table A3 applies the basic guidelines from Table 8 (for VSLs) to this candidate site. A
weakness of Table A3 is that it shows only the results for this site; it may be the case that other sites, based on the criteria applied in Table A3, merit greater consideration for VSL. In practice, Table A3 might be created in tandem with Practices 8, 9, and 10. Accordingly, the last two rows of Table A3 might be completed only if Practices 8 and 9 showed VSL to be potentially useful at this location.
8. Estimate impacts in manner suitable for CLRP, TIP, and related processes.
Safety and operational impacts should be estimated for the period when the ATM would
have an effect, which is usually when recurring congestion is present at the site. A portion of the crash impacts—those based on PDO crashes—may be combined with operational benefits and then compared to projected system costs to determine a planning-level benefit-cost ratio. Note also that additional metrics besides those shown in Tables A4 and A5 may be estimated, such as emissions reductions or fuel consumption (Franklin et al., 2010).

81
Table A3. Conditions for Application of Variable Speed Limits (VSLs) as Applied to Candidate Site
CCTV = Closed Circuit Television; VDOT = Virginia Department of Transportation; ROW = right of way; VSP = Virginia State Police; NRO = Northern Region Operations; NCRTPB = National Capital Region Transportation Planning Board; DMV = Department of Motor Vehicles
Table A4. Sketch-Level Impacts of Variable Speed Limits (VSL) on I-66 West Rear-End Crashes
Crash Type
Annual Average
No. a
Cost of Each Crash b
No. of Crashes Reduced
Because of VSL
Monetized Value
of Crash Reduction
Include in Benefit-
Cost Ratio? Property damage only (PDO)
13.67 $6,500 c 4.10 $26,650
Yes
Injury 5.00 $48,200 c 1.00 $48,200 No a Reflects I-66 West for 2006-2008 from noon to 8 P.M. between Mileposts 70 and 74. A fatal crash and a PDO crash, both of which were run-off-the-road crashes, were excluded from the analysis. No other collision types occurred. b Costs are from the Virginia Department of Transportation (2007) Highway Safety Improvement Program, Fiscal Year 2008-2009. Because detailed severity information is not available, injury costs reflect injury type B. c These costs are periodically updated; e.g., the Highway Safety Improvement Program (HSIP):Fiscal Year 2012-13 (VDOT TED, 2011a) used a cost of $9,029 per PDO crash and a cost of $98,140 for per injury type B crash..
Category Item Interpretation 1. Observed Problems
During a 171-day period, there were 232 periods of congestion and 58 crashes, most of which (56) were rear-end.
Recurrent congestion and high proportion of rear-end crashes suggest VSL may be appropriate.
2. Infrastructure Requirements
There are no obvious impediments to power, communications with the traffic operations center, or CCTV monitoring. There appear to be locations adjacent to shoulder where VSL signs could be installed; however, a detailed ROW map would need to be confirmed. However, shoulder is bordered by jersey barriers on both sides, which may present obstacles to criterion 2H in Table 8 (i.e., providing sufficient space on shoulder to pull over violators).
Discussions need to occur between VDOT and VSP as to whether full shoulder on I-66 is sufficient to pull over violators (Criterion 2H in Table 8). There are no obvious impediments to Criteria 2A-2G in Table 8.
3. Operational Requirements
As this is a preliminary screening, no concept of operations has yet been developed (including development of an expert system for VSL deployment and an archival database for speed limit changes).
Key stakeholders, such as VDOT NRO, NCRTPB, and VSP, would need to decide whether funds exist to develop a concept of operations and associated elements. (The decision likely depends on results of these screening criteria at other sites.)
4. Institutional Requirements
Limited shoulder space emphasizes importance of ensuring that enforcement can be done in a safe manner, which highlights necessity of VSP and VDOT NRO discussions.
VDOT and VSP need to discuss enforcement approaches (see discussion of criterion 2H in the Infrastructure Requirements row of this table), and VDOT Public Affairs and DMV should consider feasibility of simple messages to describe VSL to general public and/or driver training programs in region.
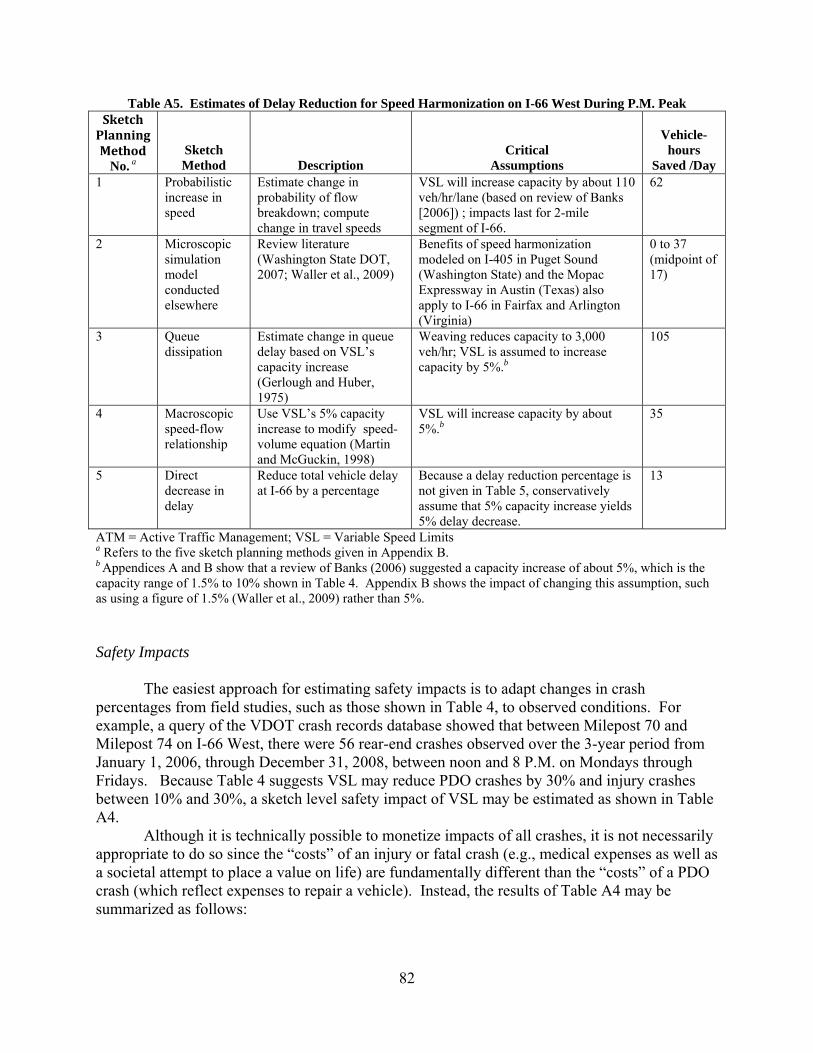
82
Table A5. Estimates of Delay Reduction for Speed Harmonization on I-66 West During P.M. Peak SketchPlanningMethod
No. a
Sketch Method
Description
Critical Assumptions
Vehicle-
hours Saved /Day
1 Probabilistic increase in speed
Estimate change in probability of flow breakdown; compute change in travel speeds
VSL will increase capacity by about 110 veh/hr/lane (based on review of Banks [2006]) ; impacts last for 2-mile segment of I-66.
62
2 Microscopic simulation model conducted elsewhere
Review literature (Washington State DOT, 2007; Waller et al., 2009)
Benefits of speed harmonization modeled on I-405 in Puget Sound (Washington State) and the Mopac Expressway in Austin (Texas) also apply to I-66 in Fairfax and Arlington (Virginia)
0 to 37 (midpoint of 17)
3 Queue dissipation
Estimate change in queue delay based on VSL’s capacity increase (Gerlough and Huber, 1975)
Weaving reduces capacity to 3,000 veh/hr; VSL is assumed to increase capacity by 5%.b
105
4 Macroscopic speed-flow relationship
Use VSL’s 5% capacity increase to modify speed-volume equation (Martin and McGuckin, 1998)
VSL will increase capacity by about 5%.b
35
5 Direct decrease in delay
Reduce total vehicle delay at I-66 by a percentage
Because a delay reduction percentage is not given in Table 5, conservatively assume that 5% capacity increase yields 5% delay decrease.
13
ATM = Active Traffic Management; VSL = Variable Speed Limits
a Refers to the five sketch planning methods given in Appendix B. b Appendices A and B show that a review of Banks (2006) suggested a capacity increase of about 5%, which is the capacity range of 1.5% to 10% shown in Table 4. Appendix B shows the impact of changing this assumption, such as using a figure of 1.5% (Waller et al., 2009) rather than 5%. Safety Impacts
The easiest approach for estimating safety impacts is to adapt changes in crash percentages from field studies, such as those shown in Table 4, to observed conditions. For example, a query of the VDOT crash records database showed that between Milepost 70 and Milepost 74 on I-66 West, there were 56 rear-end crashes observed over the 3-year period from January 1, 2006, through December 31, 2008, between noon and 8 P.M. on Mondays through Fridays. Because Table 4 suggests VSL may reduce PDO crashes by 30% and injury crashes between 10% and 30%, a sketch level safety impact of VSL may be estimated as shown in Table A4.
Although it is technically possible to monetize impacts of all crashes, it is not necessarily appropriate to do so since the “costs” of an injury or fatal crash (e.g., medical expenses as well as a societal attempt to place a value on life) are fundamentally different than the “costs” of a PDO crash (which reflect expenses to repair a vehicle). Instead, the results of Table A4 may be summarized as follows:

83
• Sketch planning estimates suggest that VSL may eliminate about 4.1 PDO crashes per year which has a monetized value of approximately $27,000.
• Sketch planning estimates suggest that VSL may eliminate about 1 injury crash per
year.
It should be emphasized that sketch level estimates are highly variable. For example, the 20% reduction in injury crashes is simply the midpoint of a relatively wide range (10% to 30%). Further, the monetization of crash impacts is also highly sensitive to assumptions. For example, a single fatal run-off-the-road crash had occurred and was excluded because of such collisions not necessarily being affected by VSL. If, however, the impact of the single fatal crash been monetized (which has a value of $3.76 million), then reducing just 20% of such a crash (based on Table 4) would yield benefits larger than all those shown in Table A4. Similarly, for injury-only crashes, the monetized impact per crash may range from $188,000 (for injury type A, an incapacitating injury) to $22,900 (for injury type C, no visible injury but complaint of pain). Accordingly, it is recommended that the impacts of ATM on fatal crashes and injury crashes not be monetized unless there is compelling evidence that such analysis is warranted. Delay Impacts
The best approach for determining impacts may be field studies completed in Virginia or elsewhere. Such impacts may be available in the form of published literature, records of previous deployments within Virginia, or syntheses of current practice (e.g., FHWA, 2009a), which provides estimates for operational strategies). However, for some ATM applications that are either novel to the practice or will occur in unique site conditions, field data may not be available or appropriate. In those instances, a sketch planning method may be used as an alternative to not providing any information.
Assuming that speed harmonization is an appropriate candidate alternative for this location, Appendix B applies five sketch planning methods to the task of speed harmonization on I-66. These five methods estimate delay reduction benefits for this particular ATM technique as between 0 and 105 veh-hr per day, which is between zero and 18,980 veh-hr annually. (The values in Table A5 already account for the fact that there will be holidays and weekends during which congestion may not be prevalent and thus no benefits would be realized.)
If all five methods were equally credible, a midpoint value would be about 52 hours per day. However, in practice not all methods will be equally credible. Conceptually, the theory behind Method 1 is appealing because it directly considers how speed harmonization’s documented increase in capacity can reduce the probability of flow breakdown during periods of heavy congestion only. The Method 5 provides a relatively safe lower bound in that the VSL’s documented 5% increase in capacity is assumed to be a 5% decrease in delay (whereas capacity would be expected to yield greater delay reductions during periods of turbulent flow). The advantages of Methods 2 and 4 are that they are based on work performed elsewhere and although not necessarily applicable to a given site, less susceptible to bias. Method 3 is based heavily on queue dissipation rates and is considered with caution because it yielded a delay reduction considerably higher than the other four methods.

84
Because VSLs have not been widely deployed in the United States., a sketch planning method should err on the side of caution meaning that if benefits cannot be estimated with precision, it would be better to underestimate the benefits than to overestimate them. Accordingly, one way to summarize the results might be as follows:
• Four different sketch planning methods yielded reductions of 13, 17, 35, and 62
vehicle-hours of delay per day. The average of the three lowest estimates suggests a reduction of about 22 veh-hr of delay per day or 8,030 veh-hr of delay per year.
• Assuming an auto occupancy of 1.0 (although during periods of HOV operation occupancy will be higher) and based on an average value of $15.47 per hour (Schrank and Lomax, 2009), the benefits are $0.124 M per year.
The higher value of truck travel time ($101.12 per hour) (Schrank and Lomax, 2009) is
not included because trucks are prohibited on I-66 inside the Beltway. Benefit-cost Ratio
Assuming a cost of $6.4 million based on applying a figure of $3.2 million (Fuhs, 2010) to I-66, a $0.464 million annual maintenance cost (Jacobson, 2008), a 20-year life cycle, and a 4% interest rate then the benefit-cost for this application would be approximately 0.161 as shown in Eq. A1.
0.161$0.464M0.0736$6.4M
M$0.027 M $0.124
cost OperatingCRFcost Capital
benefitsreduction crash PDO benefitsDelay
[Eq. A1]
where CRF = cost recovery factor.
This information may be summarized as follows. An aggregate benefit-cost ratio is 0.161, with most of the impact attributable to delay benefits rather than crash reduction benefits. The benefit-cost ratio does not include the VSL’s estimated impact of reducing 5 injury crashes per year. Had these impacts been monetized based on injury severity B, the benefit-cost ratio would have been 0.419. All safety, operational, and cost estimates are based only on preliminary sketch planning techniques.
9. Document assumptions in performance measure calculations.
Because of the benefit-cost ratio being below 1.0, this project would not likely be continued. Thus Practices 9 and 10 are for illustrative purposes only. For example, one assumption in Table A4 was the per-crash cost of $6,500 per PDO crash based on VDOT (2007). However, it has been pointed out that since these calculations were performed, VDOT has begun using a higher figure of $9,029 per PDO crash (Nichols, 2012). Had this higher figure been used, the benefit-cost ratio would have climbed from 0.161 to 0.172.

85
Additional key assumptions are detailed in Appendix B and may be summarized as: • The crash impacts are based on VSL reducing 30% (see Table 4) of rear-end crashes
observed on a 4-mile section of I-66 West.
• For Method 2, speed harmonization is presumed to have similar benefits to those reported elsewhere (PSRC, 2007; Waller et al., 2009).
• For Methods 1 and 3, speed harmonization is presumed to increase capacity by approximately 5% based on differences between pre and post queue flow reported by Banks (2006) in other locations.
• For Methods 1 and 3, the probabilities of a queue breakdown based on data from January through June 2010 for I-66 are expected to continue to be relevant.
• For Method 4, the capacity based on minimizing predicted and actual speeds (while using a speed-volume relationship from Martin and McGuckin [1998]).
• Method 5 estimated total delay as the number of vehicles multiplied by the difference between the speed limit (55 mph) and the actual speed (for cases where speeds were below 55 mph). Delay estimation was thus considerably simpler than the approach used in Method 1.
The problem with this step is that it initially presumed that performance measures drove
the project selection process and that a challenge was identifying metrics which allow side-by-side comparison of traditional and operations projects. Although that may be the case, the fact that others have reported that it can be difficult to pinpoint precisely how even traditional capacity projects are selected (e.g., Montes de Oca and Levinson, 2006) means that the use of metrics is not a panacea. However, it may be the case that operations projects are not fully understood by decision makers, and thus, consistent with the literature (Dahlgren and Lee, 2004) these PMs are shown. 10. Help identify costs and funding sources. Costs
Although cost information is needed for Practice 8, a range of costs may be obtained in order to determine the range of likely expenditures. Several costs for VSL systems have been given in the literature as shown in Table A6. At first glance the substantial variability in the cost information may indeed be troubling, given that details for key assumptions which influence these costs may not readily be available at the planning stage of the process. However, another perspective upon viewing Table A6 is that the table accurately portrays some of the uncertainty that can be expected at the early stages of planning for an operational investment. Until operational investments are sufficiently routine such that costs are readily available, the following observations may be noted:

86
Table A6. Potential Costs of Variable Speed Limit Systems
Source
Location
Capital Costs
Annual Operations and Maintenance
Costs Jacobson (2008); PB Americas, Inc., et al. (2007)
Seattle, Washington (I-405)
$12 M to $56 M (depending on how designed)a
$464,000
Science Applications International Corporation (2002)
Seattle, Washington (Snoqualmie Pass of I-90)
$ 5 M Not given
Mazzenga and Demetsky, 2009
Washington, D.C., metropolitan area (Woodrow Wilson Bridge, I-495)
Not given $1.5 M per year
a Note that cost estimates can evolve for a specific project. For example, for the 12-mile I-405 project, PB Americas, Inc., et al. (2007) reported a capital cost of $56 M whereas Jacobson (2008) reported a capital cost range of $12 M to $56 M, although both sources reported the same operations and maintenance costs. Fuhs (2010) cited costs of $3.2 to $4.0 M per directional mile (which, for a 12-mile section, would be between $38 M and $48 M and thus within the range offered by Jacobson (2008).
• Clearly the system design heavily influences the cost of the system; for example, PB
Americas et al. (2007) reported costs between $1 million and $4.7 million per mile depending on the type of display (including whether overhead or side-mounted signs are used).
• Based on this information, a 2-mile section of I-66 might require a capital costs with a midpoint value of $6 million and, more importantly a range of $2 to $10 million (for a purchase).
• Table A6 suggests that annual costs might be considerably less unless the system was leased, in which case a figure of $1.5 million could be suggested.
Funding Sources
Possible funding sources for a VSL include the following
• traditional state funding sources, such as the Six-Year Improvement Program (SYIP)
• traditional MPO funding sources, such as the Regional Surface Transportation Program
• innovative funding sources designed to satisfy a specific purpose, such as the CMAQ
Program.
Supporting documentation may be developed as appropriate for a given funding source. For example, if the project were to be based on CMAQ program funds, the data of Table B2 coupled with Figure A1 suggests a reduction in VOC emissions of about 44 kg per year. (VDOT‘S NRO has already been active in the use of CMAQ program funds for related operations initiatives, such as traffic signal synchronization in Vienna [VDOT, 2010].)

87
Figure A1. Freeway Volatile Organic Compound (VOC) Emissions Based on Executing MOBILE Version 6.2 with Defaults. Example: For a 2-mile section, raising the average speed from 27.55 to 40 mph (see Table B2) reduces VOC emissions from 0.259 to 0.237 g/mile (shaded in the figure). With a 2-mile section length and an average number of 4,284 vehicles affected per breakdown, the difference in emissions is 187 grams. If 110 such breakdowns are eliminated over a 171-day period, an estimated 44 kg of VOCs are reduced over 1 year. Summary of Results The results of applying this framework to the sample project are shown in Table A7.
0.000
0.100
0.200
0.300
0.400
0.500
0.600
0.700
0.800
0 10 20 30 40 50 60 70
Freeway Speed (mph)
VO
C E
mis
sio
ns
(g
ram
s/m
ile)
VOC reduction per vehicle-mile
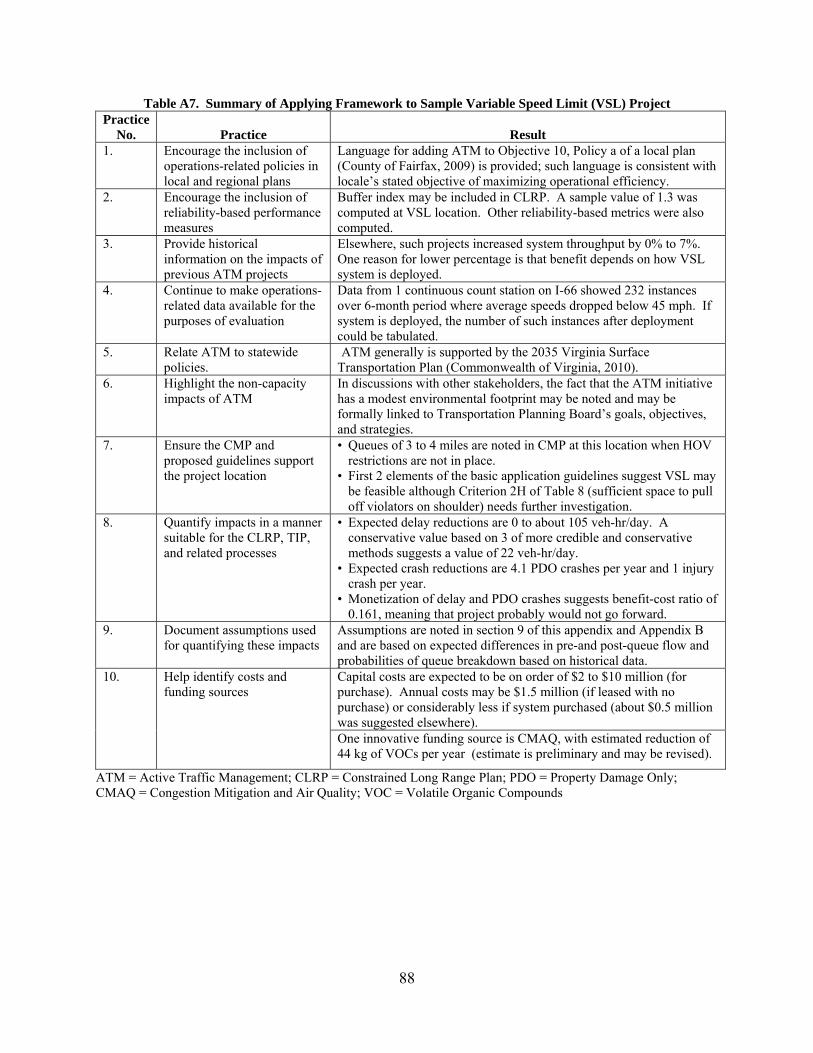
88
Table A7. Summary of Applying Framework to Sample Variable Speed Limit (VSL) Project Practice
No.
Practice
Result 1. Encourage the inclusion of
operations-related policies in local and regional plans
Language for adding ATM to Objective 10, Policy a of a local plan (County of Fairfax, 2009) is provided; such language is consistent with locale’s stated objective of maximizing operational efficiency.
2. Encourage the inclusion of reliability-based performance measures
Buffer index may be included in CLRP. A sample value of 1.3 was computed at VSL location. Other reliability-based metrics were also computed.
3. Provide historical information on the impacts of previous ATM projects
Elsewhere, such projects increased system throughput by 0% to 7%. One reason for lower percentage is that benefit depends on how VSL system is deployed.
4. Continue to make operations-related data available for the purposes of evaluation
Data from 1 continuous count station on I-66 showed 232 instances over 6-month period where average speeds dropped below 45 mph. If system is deployed, the number of such instances after deployment could be tabulated.
5. Relate ATM to statewide policies.
ATM generally is supported by the 2035 Virginia Surface Transportation Plan (Commonwealth of Virginia, 2010).
6. Highlight the non-capacity impacts of ATM
In discussions with other stakeholders, the fact that the ATM initiative has a modest environmental footprint may be noted and may be formally linked to Transportation Planning Board’s goals, objectives, and strategies.
7. Ensure the CMP and proposed guidelines support the project location
• Queues of 3 to 4 miles are noted in CMP at this location when HOV restrictions are not in place.
• First 2 elements of the basic application guidelines suggest VSL may be feasible although Criterion 2H of Table 8 (sufficient space to pull off violators on shoulder) needs further investigation.
8. Quantify impacts in a manner suitable for the CLRP, TIP, and related processes
• Expected delay reductions are 0 to about 105 veh-hr/day. A conservative value based on 3 of more credible and conservative methods suggests a value of 22 veh-hr/day.
• Expected crash reductions are 4.1 PDO crashes per year and 1 injury crash per year.
• Monetization of delay and PDO crashes suggests benefit-cost ratio of 0.161, meaning that project probably would not go forward.
9. Document assumptions used for quantifying these impacts
Assumptions are noted in section 9 of this appendix and Appendix B and are based on expected differences in pre-and post-queue flow and probabilities of queue breakdown based on historical data.
10. Help identify costs and funding sources
Capital costs are expected to be on order of $2 to $10 million (for purchase). Annual costs may be $1.5 million (if leased with no purchase) or considerably less if system purchased (about $0.5 million was suggested elsewhere). One innovative funding source is CMAQ, with estimated reduction of 44 kg of VOCs per year (estimate is preliminary and may be revised).
ATM = Active Traffic Management; CLRP = Constrained Long Range Plan; PDO = Property Damage Only; CMAQ = Congestion Mitigation and Air Quality; VOC = Volatile Organic Compounds

89
APPENDIX B
ESTIMATES OF DELAY REDUCTION FOR ATM ON I-66 WEST
Five sketch planning methods were used to estimate the possible benefits of one ATM technique—speed harmonization, also known as variable speed limits (VSLs)—on I-66 in Arlington County, Virginia, near the border with Fairfax County. Speed harmonization in this context may be defined as a series of variable message signs that attempt to maximize vehicle flow by reducing the speed limit. Figure B1 plots the volume and average spot speed of vehicles passing a continuous count station on I-66 West for 15-min periods on weekdays between noon and 8 P.M. Conceptually, as volumes increase, average speeds remain constant (in the uncongested regime) until capacity (around 900 veh/15 min given two lanes of traffic) is reached, at which point additional demand causes volume and speeds to drop (in the congested regime). The aim of speed harmonization is to keep traffic flow in the uncongested regime.
Figure B1. Average Speeds and Volumes on I-66 West (Link 190029, January 1–May 20, 2010)
0
10
20
30
40
50
60
70
0 100 200 300 400 500 600 700 800 900 1000
Volume (veh/15 min)
Av
era
ge
of
Sp
ot
Sp
ee
ds
Capacity
Congested Regime
Uncongested Regime

90
When field data for a given ATM technique are not available (because the ATM technique is novel) or transferable (because of unique site conditions), an alternative is to use a sketch planning method. Sketch planning methods may give an order of magnitude estimate of the impacts of an ATM technique at a specific location. Their weakness is threefold: they cannot estimate these impacts with precision, they cannot fully determine whether an ATM technique will achieve its desired objective, and they require several assumptions that substantially influence the results of the analysis. All three weaknesses can be answered only with a detailed operational analysis or multiple field studies conducted at other locations that are transferable to a given site. However, the strength of sketch planning methods is that, with limited data and analysis time they can indicate the potential benefits of an ATM technique—and thus they may be used as a screening tool to consider a variety of strategies. Thus, the five techniques presented here may be used if field data or published literature that directly relates to ATM deployments is not readily available. Five sketch planning methods for estimating the delay reduction benefits resulting from speed harmonization were developed:
1. probabilistic increase in speed 2. field studies or microscopic simulation modeling conducted elsewhere 3. queue dissipation 4. macroscopic speed-flow relationships 5. percentage decrease in delay.
Each method is discussed in the sections that follow, and each method can be applied in
less than 4 person-hours. It is not necessarily productive to develop multiple separate sketch planning methods for a given ATM initiative or even, necessarily, to use a particular sketch planning approach. For example, if field data from comparable deployments are available, actual performance would presumably be much more credible than any type of modeling. However, there may be instances when field data are not available—the ATM technique may be novel and/or data may not have been collected—such that the choice is between using some type of sketch planning approach or not performing an analysis.
Accordingly, this appendix provides five methods in order to highlight the different types
of assumptions that are necessary to adapt a given approach to a particular problem. Not all methods are universally appealing. For example, of the five methods, one might argue that Method 1 is the most attractive in terms of the underlying theory (it focuses on eliminating turbulence) but least attractive in terms of data required (it uses data from a continuous count station and such data are not available at all locations). An opposite assessment might result for Method 3: although its use of bottleneck theory is tenuous, its reliance on a limited amount of data might make it attractive for sites where continuous count data are not available. Method 5 has appeal in that it can make direct use of a percentage increase in capacity available from the literature.

91
Method 1: Probabilistic Increase in Speed Key Assumption Increasing volumes lead to a breakdown in flow; by reducing speeds, such breakdowns can be avoided. The benefit is computed as the difference in free flow speed and the difference in congested speed. Theory
Dowling et al. (2008) suggested that the probability of an increase in volume leading to the congested regime (see Figure B1) may be estimated as a function of volume; higher volumes mean it is more likely that unstable flow—the congested regime—will result. Data from Banks (2006) suggest that the median difference between pre-queue and post-queue flow rates is 106 veh/hr/lane. Eq. B1 may be used to estimate the potential benefits of speed harmonization at a particular location:
delay Average PeriodsATM)(with P-ATM)P(without volumes
i volumei volumei volume
all
[Eq. B1]
where
P = probability of a breakdown in flow (e.g., speeds less than 45 mph) i = particular category of volumes (e.g., all volumes between 1,800 and 1,900 veh/hr) Periods = number of periods where such volumes occurred (e.g., over a 6-month interval, there were 200 periods during which flow was between 1,800 and 1,900 veh/hr) Average delay = difference in the posted speed limit and the average congested speed for all periods during which breakdowns occur (e.g., 3 vehicle-hours of delay).
Example
For a section of I-66, Table B1 suggests that the probability of average speeds being less than 45 mph is affected by the volume observed during the previous 15-min period. For example, there were 17 periods in which 15-min volumes were between 900 and 950 vehicles; and for 6 of these cases (35.3%), the following 15-min period saw a speed less than 45 mph. By contrast, there were 287 periods in which volumes were between 600 and 650 vehicles, and for just one case (0.3%) did the following 15-min period have a speed of less than 45 mph.
Banks (2006) compared pre-queue flow, defined as the flow rate prior to a “breakdown,”
and post-queue flow, defined as the flow rate for queued vehicles to dissipate, at 15 interstate sites spread throughout Minneapolis, San Diego, and Seattle; at all sites detectors were located in the vicinity of an area where some type of lane change was likely (because of merging, diverging, or weaving). At all sites, the pre-queue flow exceeded the post-queue flow, and the median amount of this excess was 106 veh/hr/lane. If it is assumed that the ATM technique in this case—speed harmonization—could mitigate such bottlenecks by eliminating this difference

92
Table B1. Speed/Flow Relationships at Link 190029 on I-66 West, January-June 20, 2010
15-Min Volume
No. of Periodsa
Base Case Without ATM Revised Case With ATM
Given No. of Periods With
Speed < 45 mph
Calculated Probability of
Speed < 45 mph
Estimated Probability of
Speed < 45 mph
Estimated No. of
Periods With Speed < 45
mph ≥900 and <950 17 6b 35.3% 28.7% 5
≥850 and <900 108 31 28.7% 25.4% 27 ≥800 and <850 323 82 25.4% 14.4% 47 >750 and <800 478 69 14.4% 6.3% 30 ≥700 and <750 507 32 6.3% 2.1% 11 ≥650 and <700 524 11 2.1% 0.3% 2 ≥600 and <650 287 1 0.3% 0.0% 0 ≥550 and <600 154 0 0.0% 0.0% 0 Periods with speed < 45 mph 232c 122 ATM = Active Traffic Management. a The 15-min periods only include those observed on a weekday between noon and 8 P.M.. If 2 or more consecutive periods of speeds below 45 mph were observed, only the first period appears in the table in order to focus on the probability of a given volume causing a breakdown in flow. b For example, on January 7 from 2 P.M. to 2:15 P.M., the average speed was 59 mph and the 15-min volume was 902 vehicles. From 2:15 P.M. to 2:30 P.M., the average speed dropped to 33 mph. Thus, 1 period with speeds less than 45 mph and a volume between 900 and 950 veh/hr was recorded. Although average speeds stayed below 45 mph until 4 P.M., only 1 period is shown in the table because consecutive periods of speeds < 45 mph were not recorded. c This figure excludes 6 periods of volumes below 500 veh/15 min where speeds dropped below 45 mph. between pre- and post-queue flow, then a capacity increase for a two-lane facility is an increase 212 veh/hr or approximately 50 veh/15 min—a capacity increase of approximately 5%. By framing such an increase as a corresponding reduction in volume, Table B1 shows a reduced probability of a speed breakdown and, consequently, a reduction in the number of periods with speeds less than 45 mph.
Although it is possible to estimate the delay for each instance when speeds dropped below 45 mph, a simpler approach is to estimate the average delay for all such instances. Table B2 summarizes the steps for estimating this delay, which is based on the average flow when speeds are below 45 mph, the average speed with ATM which is assumed to be 40 mph, and a section length of 2 miles. For convenience, Table B2 also shows the remaining steps to completing Eq. B1, such that the average ATM reduction is found to be 62 hours per day.
Assumptions and Judgment
Several assumptions may be altered in the delay calculations and thus may be framed as variables. Such assumptions include:
• length of the area affected by ATM (2 miles). • speed of traffic with the ATM strategy (40 mph). • period for which probabilities are calculated (January–June 2010). • selection of the “breakdown” speed (45 mph). • use of the median duration when speeds < 45 mph (90 min).

93
Table B2. Steps for Estimating Delay Reduction of ATM Variable (units) Value How calculated
Average breakdown speed (mph) 27.55 Average of periods in which speeds < 45 mph Average speed with ATM in place (mph) 40.0a Assumed as some value greater than the breakdown
speed (27.55 mph) and less than the average speed without breakdowns (57.8 mph)
Average delay per vehicle (min) 1.36
hour 1
min 60
mph 40
miles 2
mph 27.55
miles 2
Number of vehicles affected per breakdown (vehicles)
4,284 (Average 15-min flow when speeds < 45 mph)(Median Duration) = (714 veh)(6 periods)
Average delay per breakdown (vehicle-hours)
97
min 60
hour 1
breakdown
veh 284,4
veh
min 36.1
Number of breakdowns reduced by ATM (breakdowns)
110 b 232 breakdowns without ATM – 122 breakdowns with ATM (see Table B1)
ATM daily delay reduction (vehicle-hours)
62
breakdown
hours 79
days 171
breakdowns 101
a Because this variable requires a large assumption, a sensitivity analysis is appropriate. If a value of 30 mph is used, then the last row shows a delay reduction of 16 (rather than 62 hours); a value of 50 mph would show a delay reduction of 90. b Once the VSL is deployed, such calculations can be verified for the purposes of informing future evaluations of VSL elsewhere.
Sensitivity tests with the data in Table B2 show the impact of these assumptions; for
example, changing the length of the area from 2 to 3 miles increases the delay reduction from 62 to 93 hours; changing the ATM speed from 40 to 45 mph could further increase the delay reduction to 116 hours—almost twice the original estimate. By contrast, if the ATM speed were only 35 mph and the length of the area was only 1 mile rather than 2, the delay reduction would be 21 hours—less than half the original estimate. (Changing only one assumption has a lesser impact: for example, if the ATM speed drops from the assumed value of 40 to the assumed value of 35 mph but no other assumptions are changed, then the delay reduction decreases from 62 to 43 hours; dropping this speed to 30 mph yields 16 hours.) Accordingly, the estimate of 62 hours is an order of magnitude estimate—it suggests the daily benefit will be on the order of 60 hours as opposed to 6 or 600. The decimals in Table B2 are thus for transparency of calculation only.
Judgment is also required to apply the sketch planning methods for the problem at hand.
For example, consider the probabilities derived from Table B1. The probabilities were calculated from the relationship between the volume at a given 15-min interval and the average of the spot speeds 15 min later. The reason for this approach was to understand causality between flow and volume—and this is exacerbated by the larger 15-min period than the 5-min analysis period that has been used elsewhere (Dowling et al., 2008). Further, when consecutive periods of breakdown flow were observed, only the initial period was recorded, as the focus was on determining the volume that triggered a breakdown. The fact that Table B1 shows increasing probabilities of breakdown with higher volumes suggests that this was a logical approach. A simpler approach that derived the probabilities of breakdown without time lags and without removing consecutive periods of congestion did not reveal a clear relationship between volume

94
and the probability of a breakdown—suggesting that the simpler approach is less reliable than the approach used in Table B1. However, had more precise data readily been available—such as shorter time periods on the order of 5 min and space mean speed data gathered over a section of a facility rather than averaged spot speeds from a specific point—perhaps the simpler approach could have been employed. Method 2: Field Studies or Microscopic Simulation Modeling Conducted Elsewhere Theory Field studies from other locations may provide real-world evidence of how an ATM technology has performed, including operational decisions that may govern the technology’s effectiveness. In cases where field study results are not readily available, then a less-desirable alternative is microscopic simulation models or other analytical approaches used in these other locations. As an illustration of how to adapt the results of such studies, this section discusses one microscopic simulation model used elsewhere.
The Washington State Department of Transportation (2007) used the VISSIM microscopic simulation model to estimate the benefits of speed harmonization on I-405 in Seattle, Washington, where a breakdown was defined as 35 mph. No delay reduction benefits were observed which the authors attributed to the algorithm employed (the algorithm aimed to reduce lane changing which should reduce crashes and hence delay, but the algorithm did not attempt to lower speed limits in order to prevent flow from entering the congested regime of Table B1). Waller et al. (2009) also used VISSIM to estimate the benefits of speed harmonization on the 2.5-mile Mopac Expressway in Austin, Texas; during periods of congestion, vehicle delay was reduced by between 3.6% and 18.0% depending on how the speed limit was set if historical data were used; a real-time algorithm reduced corridor delay by 28%. Using this latter figure, Eq. B2 may be used to estimate the delay reduction benefits on I-66 West. (Because of variability in simulation model results, see the section “Assumptions and Judgment” that follows the Example.) Example
Delay reduction =
intervalstudy theduring days 171
%28delayAveragePeriods [Eq. B2]
where Periods = number of periods where speed drops below 45 mph (e.g., 232 from Table B1) Average delay = average delay per period (e.g., 97 hours from Table B2) Thus the delay reduction may be estimated as 37 hours per day.

95
Delay reduction =
intervalstudy theduring days 171
%28hours 97Periods 232 = 36.8 hours
Assumptions and Judgment Four critical assumptions in estimating the delay reduction benefits are:
1. The algorithm for speed harmonization clearly affects the amount of delay reduction expected. In what is perhaps the clearest demonstration that operational initiatives are processes rather than projects, the delay reduction ranges from zero to 28% depending on the algorithm employed.
2. The literature (PRSC, 2007; Waller et al., 2009) suggests that other benefits of speed
harmonization are reduced incidents because of reduced speed variability. No attempt to estimate the impacts of reduced incidents have been undertaken in this calculation, but such benefits could be estimated from the literature (e.g., Fudala and Fontaine [2010]) reported reductions of 10% to 30% in Europe that resulted from speed harmonization).
3. Delay for the corridor and the system are not equivalent: Waller et al. (2009)
reported that the 28% corridor delay reduction also entailed an increase in delay for motorists entering or leaving the corridor.
4. Simulation models in other states were developed for a specific set of operational
assumptions, geometries, and traffic conditions. As with any sketch planning approach, the transferability of these models to other situations is debatable, and significant deviations between sites may be possible.
Method 3: Queue Dissipation Theory
Speed harmonization may produce benefits by slightly increasing capacity; these delay reductions may be modeled based on the amount of delay experienced by vehicles in a traffic queue (Gerlough and Huber, 1975) (but see the final item in the “Assumptions and Judgment” section that follows). Eqs. B3 and B4 may be used to estimate the duration of the queue and the total delay (in minutes):
q-s
s-sr duration Queue r [Eq. B3]
duration Queue60
s
60
q
2
r delay Total r
[Eq. B4]

96
where r = duration of the capacity reduction (e.g., 71 min) s = capacity of the facility (e.g., 4,800 veh/hr for 2 lanes of traffic) sr = reduced capacity because of weaving or other behavior q = volume. Example
Values of r, s, sr, and q may be chosen for this section of I-66 with the understanding that
these parameters are rough estimates; the rationale for each value is given in the bullets that follow:
r = 71 min (chosen because this value gives an average tq of 90 min in Table B3) s = 4,800 veh/hr (chosen because the Statewide Planning System (SPS) reports a capacity of 2,350 to 2,400 veh/hr/lane for I-66 sr = 3,000 veh/hr (chosen as an initial estimate but see the “Assumptions and Judgment” section that follows) q = 3,700 veh/hr (there were 6 instances where a 15-min volume of 900 to 950 veh/hr was observed that led to a breakdown)
Application of Eqs. B3 and B4 show that ATM could reduce delay by about 13,457 veh-
min—or about 224 veh-hr—for this particular case where a flow of about 925 veh/15 min was observed.
•
3,700-4,800
3,000-4,80071 duration Queue = 116.18 min without ATM
•
3,700-4,800
]3,000[1.05-4,80071 duration Queue = 106.5 min with ATM
• 18.11660
000,3
60
700,3
2
71 delay Total
= 48,118 veh-min without ATM
• 5.10660
]05.1[000,3
60
700,3
2
71 delay Total
=34,657 veh-min with ATM

97
• Delay reduction = 60
657,34118,48224.4 veh-hr.
The above calculations apply to just one instance for one particular value of flow. Table
B3 repeats these calculations for three sets of volumes that tended to lead to a breakdown in flow.
Table B3. Summary of Delay Reduction Estimates Based on Queue Dissipation
Parameter Range of Volumes (veh/15 min)
900 to 950 850 to 900 800 to 850 Midpoint value q (veh/15 min) 925 875 825 Number of instances when this flow was observeda 6 31 82 Queue duration without ATM (min)a 116 98 85 Delay reduction because of ATM (veh-hr) 224 174 137 Delay reductions over a 171 day period (veh-hr) 1,344 5,394 11,234 Average daily reduction (veh-hr) a 105
a Over the 171-day period, the average queue duration from these values is 90 min, which roughly corresponds with the median duration for flows being less than 45 mph.
Assumptions and Judgment
• The duration of the capacity reduction (r was assumed to be 71 min) may be altered. (A value of r = 71 was used because that gave an average queue duration of 90 min for all breakdowns in Table B3, which was the median duration of speed breakdowns over the 171-day period, but other values may be chosen).
• The capacity reduction (sr) may be altered—the value of 3,000 veh/hr was an initial
guess based on the fact that, as shown in Table B1, rarely did a flow of 750 veh/15 min lead to an increase in weaving. (However, the precise value of sr—that is the capacity reduction that results from weaving—will vary by situation and could vary from this 750 veh/15 min up to the maximum capacity shown in Figure B1 of about 950 veh/15 min).
• The capacity increase (about 5%) may be altered. For example, using a value of 1.5% (given that Waller et al. [2009] cited literature that gave a 1% to 2% increase in capacity at one deployment in the Netherlands], yields a value of approximately 33 hours rather than 105.
The largest assumption in this method is the decision to apply queuing theory concepts to
the problem of speed harmonization. Generally, queuing theory is best suited for a situation where capacity will be decreased from some external event, such as a lane closure, a stoppage because of a signal or ramp meter, or a slow-moving vehicle such that there is a backward forming shockwave from the location of this external event. The assumption that some sort of weaving event itself could be defined as a capacity reduction is somewhat tenuous, and would ideally be confirmed by visual inspection. (If queues are observed, the approach of Eqs. B3 and B4 may have merit, in which case attention can be focused on whether the amount of capacity increase offered by speed harmonization should be studied.)

98
Method 4: Macroscopic Speed-Flow Relationship Theory Martin and McGuckin (1998) reported that Eq. B5 may be used to estimate the travel time for a freeway section that has a free flow speed of 60 mph.
5.5
Capacity
Volume0.831 timeflow Free time
Congested [Eq. B5]
Example It is found that using a capacity of about 909 veh/15 min minimizes the difference
between congested speed (based on Eq. B5) and observed speeds at the site. If this capacity is increased by 5%, which is the percentage increase attributable to speed harmonization based on Banks (2006), then on average over the 171-day period there is a daily savings of about 35 veh-hr. Assumptions and Judgment
• The increase in capacity based on VSL was assumed to be 5% based on Banks (2006). Had a lower capacity increase been presumed, such as the 1.5% figure based on Waller et al. (2009), the daily savings would be about 12 hours.
• The capacity at this site was assumed to be 909 veh/15 min (which is 3,636 veh/hr for
the two-lane section or about 1,818 veh/hr/lane). This value had been chosen because it minimized the difference between predicted and actual speeds. However, had a capacity of 2,400 veh/hr/lane been presumed based on SPS, then a savings of just 7 vehicle-hours would have resulted.
Method 5: Percentage Decrease in Delay Theory
VSL should reduce delay by some percentage amount, and thus this percentage may be applied to the total delays recorded at the site.
Example
No percentage delay reductions were reported in Table 4. However, if it is assumed that the percentage increase in capacity corresponds to a similar reduction in delay, then a 5% reduction in delay may be assumed from Table 4.
Over the 171-day study period, total delays (defined as a 2-mile length where speeds were below the speed limit of 55 mph on weekdays between noon and 8 P.M.) were 42,795 veh-hr or an average of approximately 250 veh-hr per day.

99
A 5% decrease in delay would thus be about 13 veh-hr per day.
Assumptions and Judgment
• Delay does not decrease linearly with capacity, rather, at periods of heavy volume a small increase in capacity will generally yield a larger decrease in delay. Thus, this method does not accurately estimate delay reductions; rather, it provides a lower bound of such delay reductions that can be used to verify other estimates.
• Unlike Methods 1 through 4, the delay estimate herein is total delay rather than only
those periods of delay where flow was believed to be unstable. Methodologically the approach of Method 5 is easiest to replicate, but it does not necessarily capture the manner in which VSL should stabilize traffic flow.
Summary Table B4 summarizes the strengths and weaknesses of the five sketch planning methods and indicates how they may be used in the analysis. The highest delay reduction from Method 3 may be dropped. The values from the remaining Methods 1, 2, 4, and 5 may be reported, with the delay reductions from the methods that yielded the smallest amount of delay reduced (2, 4, and 5) being averaged and used for further analysis.

100
Table B4. Summary of Strengths and Weaknesses of the Five Sketch Planning Methods Method (No.) Strength Weakness How to Use
Probabilistic increase in speed (1)
• Because method explicitly considers periods at site where heavy volumes led to a breakdown in flow, it conceptually captures how VSL’s modest capacity increase could reduce delay.
• Effect of a modest capacity increase in literature may be directly incorporated into analytical model.
• Assumption must be made about resultant speed with ATM.
• If ATM helps avoid a breakdown, prevailing speeds should be relatively high; if not, speeds may be low.
• Report as 1 of 4 estimates of delay but do not include in average.
Field studies or microscopic simulation model conducted elsewhere (2)
• Method directly adapts results from a credible source to which skeptical reviewers may be referred.
• Results are valid only to extent that site conditions elsewhere (geometric, traffic, and system implementation) are replicated at site.
• Report as 1 of 4 estimates of delay and include in average value.
Queue dissipation (3)
• Method quantifies how reducing vehicle queues may reduce delay.
• Explicitly considers periods where heavy volumes led to a breakdown in flow.
• Method gave a higher reduction than the other methods.
• Not reported
Macroscopic speed-flow relationship (4)
• Method uses speed-volume relationships from literature.
• Capacity increase from literature may be directly incorporated into model.
• Explicitly considers periods where heavy volumes led to a breakdown in flow.
• Method is only as accurate as speed-volume relationships from literature.
• Report as 1 of 4 estimates of delay and include in average value
Percentage decrease in delay (5)
• Applies a percentage decrease in delay attributable to VSL to all periods where speeds dropped below speed limit.
• Computations are considerably simpler than those required for Methods 1, 3, and 4.
• Because a percentage decrease in delay attributable to VSL is not yet available, assumptions must be made relating capacity to delay.
• Report as 1 of 4 estimates of delay and include in average value.
ATM = Active Traffic Management.