Embed Size (px)
Citation preview
Ind
ust
rial E
lectr
ical En
gin
eerin
g a
nd
A
uto
matio
n
CODEN:LUTEDX/(TEIE-7269)/1-50/(2017)
Plant-wide model-based analysis of simultaneous precipitation on phosphorus removal in an activated sludge system with MBRs
Christian Kazadi Mbamba and Ulf Jeppsson
Division of Industrial Electrical Engineering and Automation Faculty of Engineering, Lund University
TECHNICAL REPORT
Plant-wide model-based analysis of simultaneous
precipitation on phosphorus removal in an
activated sludge system with MBRs
Dr Christian Kazadi Mbamba, Assoc. Prof Ulf Jeppsson
December 2017
Approved by: Stockholm Water and Waste AB
i
TABLE OF CONTENTS Executive summary .................................................................................................................. iii
Nomenclature ............................................................................................................................. v
1. Background and scope of work .............................................................................................. 1
2 Methodology ........................................................................................................................... 4
2.1 Pilot plant under study ..................................................................................................... 4
2.2 Membrane bioreactors ..................................................................................................... 6
2.3 Chemical additions ........................................................................................................... 7
2.4 Wastewater characterisation ............................................................................................ 7
2.4.1 SCADA data ............................................................................................................. 7
2.4.2 Plant routine measurement data ................................................................................ 7
2.4.3 Intensive sampling and offline analysis .................................................................... 8
2.5 Plant-wide model configuration ....................................................................................... 8
2.5.1 Plant model configuration ......................................................................................... 8
2.5.2 Physico-chemical model ........................................................................................... 9
2.5.3 Influent COD fractionation modelling .................................................................... 13
2.5.4 Synthetic (long-term) influent data generation ....................................................... 13
2.6 Model implementation ................................................................................................... 14
2.7 Parameters ...................................................................................................................... 14
2.8 Model scenarios ............................................................................................................. 15
3 Results and discussion .......................................................................................................... 16
3.1 Steady-state plant influent .............................................................................................. 16
3.2 Dynamic plant influent .................................................................................................. 18
3.3 Plant steady-state response ............................................................................................ 19
3.3.1 Model calibration .................................................................................................... 19
3.3.2 Impact of pH and Fe/P molar ratio ......................................................................... 22
3.3.3 Time constant of chemical precipitation ................................................................. 23
ii
3.4 Analysis of model variants ............................................................................................. 25
3.4.1 Plant-wide dynamic response ................................................................................. 25
3.4.2 Impact of controlling iron salt (FeSO4) dosing ....................................................... 29
3.4.3 Impact of iron dosing location ................................................................................ 30
3.5 Model performance and limitations ............................................................................... 32
4 Conclusions ........................................................................................................................... 34
5 Recommendations: operational and control strategies ......................................................... 35
References ................................................................................................................................ 36
Appendix .................................................................................................................................. 39
iii
Executive summary
Wastewater treatment technologies combined with membrane bioreactors and chemical
precipitation are gaining wide acceptance as a suitable pathway when very low effluent
phosphorus concentrations are the treatment target. A modelling study was carried out to
evaluate operational and control strategies for such a pilot scale system. The main purpose of
this work was to describe the use of iron salts (ferrous or ferric iron) in membrane bioreactors
(MBRs) and focuses on questions of possible interference with the biological mechanisms
arising from the addition of these iron precipitants. The specific objectives of the study are to:
(1) predict accurately the dynamic behaviour of the pilot plant (with MBR and chemical
precipitation); (2) perform dynamic simulations with the calibrated plant-wide model to
further increase understanding of underlying principles of the integrated system and provide
information for optimizing design and operations applicable to full-scale systems.
Sub-models from a recently upgraded version of the Benchmark Simulation Model No. 2
with an improved/expanded physico-chemical framework were used to develop the plant-
wide model for the pilot plant. The physico-chemical module includes an equilibrium
approach describing ion speciation and ion pairing, kinetic minerals precipitation (such as
hydrous ferric oxides (HFO) and FePO4) as well as adsorption and co-precipitation. Model
performance was evaluated against data sets from a pilot plant, assessing the capability to
describe water and sludge lines across the treatment process under steady-state operation.
With default rate kinetic and stoichiometric parameters, a good general agreement was
observed between the pilot-scale datasets and the simulated results under steady-state
conditions. Simulation results showed differences between measured and modelled
phosphorus as little as 5–10% (relative) throughout the entire plant. The study also showed
that environmental factors, such as pH as well as Fe/P molar ratios (1, 1.5 and 2), influence
the concentration of dissolved phosphate in the effluent. The time constant of simultaneous
precipitation, in the calibrated model, due to FeSO4 step change (decrease/increase) was
found to be roughly 5 days, indicating a slow dynamic response due to multi-steps involving
dissolution, oxidation, precipitation, aging, adsorption and co-precipitation processes. The
persistence effect of accumulated iron-precipitates (HFO particulates) in the activated sludge
was likely responsible for phosphorus removal and therefore the solid retention time plays a
crucial role. In order words, the reactivity of these iron-precipitates cycling in the MBR

iv
system over an extended period was apparently maintained through alternation of the sludge
between anoxic and aerobic conditions.
Dynamic influent profiles were generated using a calibrated influent generator and were used
to study the effect of long-term influent dynamics on plant performance. Model-based
analyses showed that controlling the addition of coagulants strongly influenced the
phosphorus removal in the activated sludge system, while the aerobic tank deemed to be the
most suitable dosing location for FeSO4 addition due to high oxidizing and good mixing
conditions.
The dynamic plant-wide model is a promising engineering tool that can be used to optimize
system design and operational aspects, such as control of chemical dosage under dynamic
loading conditions. This aspect is important as far as maintaining suitable biological nutrient
removal in the activated sludge systems.
v
Nomenclature
Ac- Acetate ion (g.m-3)
ADM1 Anaerobic Digestion Model No. 1
ai Chemical activities
Al+3 Aluminium ion
ASM Activated sludge model
ASM2d Activated sludge model No 2
BAP Biomass associated products
BOD7 7-day Biochemical Oxygen Demand (gCOD.m-3)
BR1/ANOX Anoxic bioreactor 1
BR2/ANOX Anoxic bioreactor 2
BR3/FLEX Swing bioreactor 3 (anoxic/aerobic)
BR4/AERO Aerobic bioreactor 4
BR5/AERO Aerobic bioreactor 5
BR6/DEOX De-aeration bioreactor 6
BR7/ANOX Post-anoxic bioreactor 7
BSM2 Benchmark Simulation Model No. 2
Bu- Buturate ion (moles.L-1)
Ca2+ Calcium ion (moles.L-1)
CAS Conventional activated sludge
Cl- Chloride ion (moles.L-1)
CO2 Carbon dioxide
CO3-2 Carbonate (moles.L-1)
COD Chemical oxygen demand (gCOD.m-3)
DO Dissolved oxygen (g.m-3)
EBPR Enhanced biological phosphorus process
removal
EPA Environmental Protection Agency
Fe Iron
FeCl3 Iron chloride
FeSO4 Iron(II) sulphate
HS- Sulphide (moles.L-1)
Iron(II) or Ferrous iron (moles.L-1)
vi
Fe2+
Iron(III) or
Fe3+
Ferric iron (moles.L-1)
ISS Inorganic suspended solids (gSS.m-3)
K+ Potassium ion (moles.L-1)
kcryst Precipitation kinetic rate parameter (d-1)
kFePO4 Rate of iron phosphate precipitation (d-1)
Ki Equilibrium constant
Ksp Solubility product constant
KspFePO4 Solubility constant for iron phosphate
MBR Membrane bioreactor
Mg Magnesium
Mg2+ Magnesium ion (mole.L-1)
MLSS Mixed liquor suspended solids (mole.L-1)
n Order of the precipitation reaction
Na Sodium
Na+ Sodium ion (mole.L-1)
NH3 Ammonia
NH4+ Ammonium ion (mole.L-1)
NH4-N Ammonia nitrogen (gN.m-3)
NO2- Nitrite
NO3-N Nitrate nitrogen (gN.m-3)
O2 Oxygen
pH Hydrogen potential (Standard)
PO4-3 Phosphate
PO4-P Orthophosphorus (gP.m-3)
Pro- Propionate (gP.m-3)
RAS Returned activated sludge
rFePO4 Rate of iron phosphate precipitation (d-1)
SA Fermentation products (gCOD.m-3)
SF Readily biodegradable (gCOD.m-3)
SI Inert biodegradable organics (gCOD.m-3)
SMP Soluble microbial product (g.m-3)

vii
SO2 Dissolved oxygen, (g.m-3)
SO4-2 Sulphate (g.m-3)
T Time (min, h, day)
T Temperature (oC, K)
TIC Total inorganic carbon (gC.m-3)
TN Total nitrogen (gN.m-3)
TOC Total organic carbon (gC.m-3)
TOTj Species contribution balance (moles.L-1)
TP Total phosphorus (gP.m-3)
TSS Total suspended solid (gSS.m-3)
UAP Utilization-associated products (gCOD.m-3)
Va- Valerate (gCOD.m-3)
VFA Volatile fatty acids (gCOD.m-3)
VSS Volatile suspended solids (gSS.m-3)
WAS Waste activated sludge
WWTP Wastewater treatment pant
XAUT Autotrophic biomass (gCOD.m-3)
XFePO4 Iron phosphate mineral state (gFe.m-3)
XH Heterotrophic biomass (gCOD.m-3)
XHFO Hydrous ferric oxide (g.m-3)
XHFO,H Hydrous ferric oxide with high adsorption
capacity
(g.m-3)
XHFO,H,P XHFO,H with adsorbed phosphate (g.m-3)
XHFO,L Hydrous ferric oxide with low adsorption
capacity
(g.m-3)
XHFO,L,P XHFO,L with adsorbed phosphate (g.m-3)
XI Inert non-biodegradable organics (gCOD.m-3)
XISS Inorganic suspended solid state (gSS.m-3)
XPAO Phosphorus-accumulating organism state (gCOD.m-3)
XPHA Polyhydroxy-alkanoate state (gCOD.m-3)
XPP Polyphosphate state (g.m-3)
XS Slowly biodegradable substrate state (gCOD.m-3)
XTSS Total suspended solid state (gTSS.m-3)
viii
y Experimentally measured output
Z(Fe3+) Chemical activity of ferric iron
Z(PO43-), Chemical activity of phosphate
zi Charge valency of ionic species 𝑖
Zi Concentration of ionic species 𝑖 (mole.L-1)
Zj Concentration of iterative species (mole.L-1)
𝛾 Activity coefficient
𝜎 Supersaturation
1
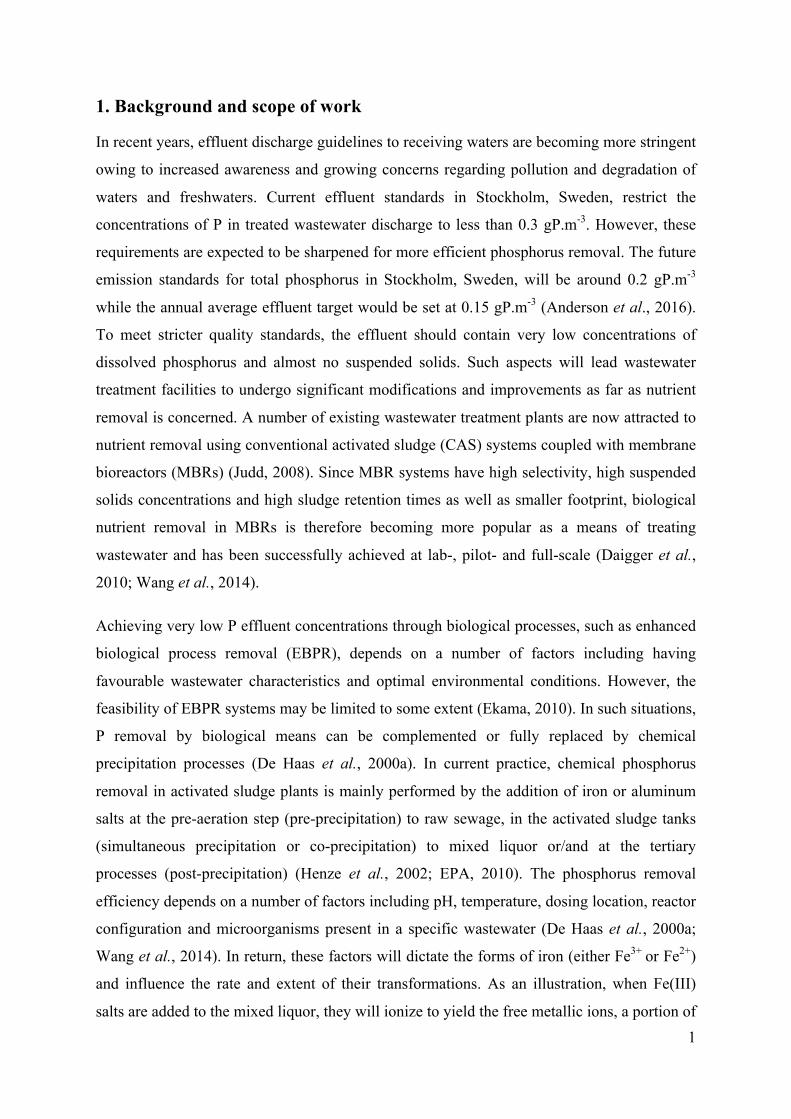
1. Background and scope of work
In recent years, effluent discharge guidelines to receiving waters are becoming more stringent
owing to increased awareness and growing concerns regarding pollution and degradation of
waters and freshwaters. Current effluent standards in Stockholm, Sweden, restrict the
concentrations of P in treated wastewater discharge to less than 0.3 gP.m-3. However, these
requirements are expected to be sharpened for more efficient phosphorus removal. The future
emission standards for total phosphorus in Stockholm, Sweden, will be around 0.2 gP.m-3
while the annual average effluent target would be set at 0.15 gP.m-3 (Anderson et al., 2016).
To meet stricter quality standards, the effluent should contain very low concentrations of
dissolved phosphorus and almost no suspended solids. Such aspects will lead wastewater
treatment facilities to undergo significant modifications and improvements as far as nutrient
removal is concerned. A number of existing wastewater treatment plants are now attracted to
nutrient removal using conventional activated sludge (CAS) systems coupled with membrane
bioreactors (MBRs) (Judd, 2008). Since MBR systems have high selectivity, high suspended
solids concentrations and high sludge retention times as well as smaller footprint, biological
nutrient removal in MBRs is therefore becoming more popular as a means of treating
wastewater and has been successfully achieved at lab-, pilot- and full-scale (Daigger et al.,
2010; Wang et al., 2014).
Achieving very low P effluent concentrations through biological processes, such as enhanced
biological process removal (EBPR), depends on a number of factors including having
favourable wastewater characteristics and optimal environmental conditions. However, the
feasibility of EBPR systems may be limited to some extent (Ekama, 2010). In such situations,
P removal by biological means can be complemented or fully replaced by chemical
precipitation processes (De Haas et al., 2000a). In current practice, chemical phosphorus
removal in activated sludge plants is mainly performed by the addition of iron or aluminum
salts at the pre-aeration step (pre-precipitation) to raw sewage, in the activated sludge tanks
(simultaneous precipitation or co-precipitation) to mixed liquor or/and at the tertiary
processes (post-precipitation) (Henze et al., 2002; EPA, 2010). The phosphorus removal
efficiency depends on a number of factors including pH, temperature, dosing location, reactor
configuration and microorganisms present in a specific wastewater (De Haas et al., 2000a;
Wang et al., 2014). In return, these factors will dictate the forms of iron (either Fe3+ or Fe2+)
and influence the rate and extent of their transformations. As an illustration, when Fe(III)
salts are added to the mixed liquor, they will ionize to yield the free metallic ions, a portion of
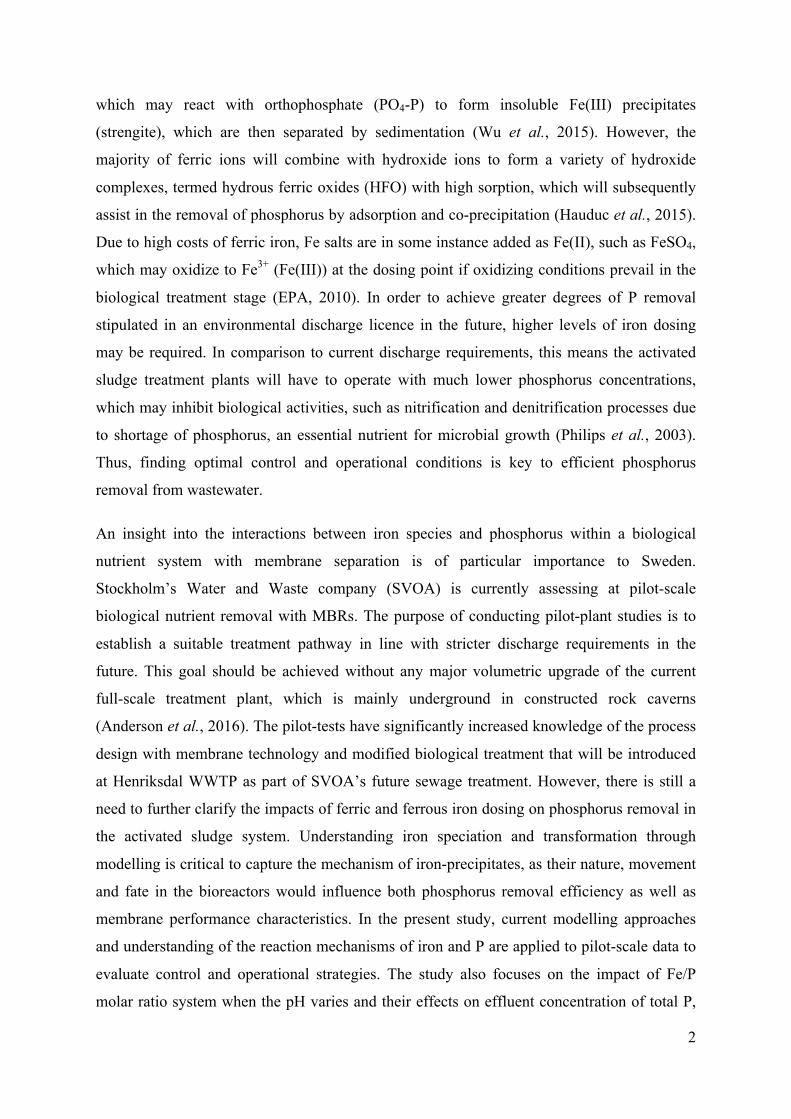
2
which may react with orthophosphate (PO4-P) to form insoluble Fe(III) precipitates
(strengite), which are then separated by sedimentation (Wu et al., 2015). However, the
majority of ferric ions will combine with hydroxide ions to form a variety of hydroxide
complexes, termed hydrous ferric oxides (HFO) with high sorption, which will subsequently
assist in the removal of phosphorus by adsorption and co-precipitation (Hauduc et al., 2015).
Due to high costs of ferric iron, Fe salts are in some instance added as Fe(II), such as FeSO4,
which may oxidize to Fe3+ (Fe(III)) at the dosing point if oxidizing conditions prevail in the
biological treatment stage (EPA, 2010). In order to achieve greater degrees of P removal
stipulated in an environmental discharge licence in the future, higher levels of iron dosing
may be required. In comparison to current discharge requirements, this means the activated
sludge treatment plants will have to operate with much lower phosphorus concentrations,
which may inhibit biological activities, such as nitrification and denitrification processes due
to shortage of phosphorus, an essential nutrient for microbial growth (Philips et al., 2003).
Thus, finding optimal control and operational conditions is key to efficient phosphorus
removal from wastewater.
An insight into the interactions between iron species and phosphorus within a biological
nutrient system with membrane separation is of particular importance to Sweden.
Stockholm’s Water and Waste company (SVOA) is currently assessing at pilot-scale
biological nutrient removal with MBRs. The purpose of conducting pilot-plant studies is to
establish a suitable treatment pathway in line with stricter discharge requirements in the
future. This goal should be achieved without any major volumetric upgrade of the current
full-scale treatment plant, which is mainly underground in constructed rock caverns
(Anderson et al., 2016). The pilot-tests have significantly increased knowledge of the process
design with membrane technology and modified biological treatment that will be introduced
at Henriksdal WWTP as part of SVOA’s future sewage treatment. However, there is still a
need to further clarify the impacts of ferric and ferrous iron dosing on phosphorus removal in
the activated sludge system. Understanding iron speciation and transformation through
modelling is critical to capture the mechanism of iron-precipitates, as their nature, movement
and fate in the bioreactors would influence both phosphorus removal efficiency as well as
membrane performance characteristics. In the present study, current modelling approaches
and understanding of the reaction mechanisms of iron and P are applied to pilot-scale data to
evaluate control and operational strategies. The study also focuses on the impact of Fe/P
molar ratio system when the pH varies and their effects on effluent concentration of total P,
3
for example due to routine membrane cleaning with acidic solutions. Furthermore, this work
intends to determine and explain (theoretically) the differing performance of precipitation
with respect to dosing Fe3+ compared with dosing Fe2+, the different effects on the residual
total phosphorus in the effluent as well as to determine the time constants of the system and
how these are related to the residence time and sludge age.
The present report focuses on pilot-plant modelling and is one of the deliverables of this
project. Two other deliverables include two plant-wide modelling tools for the pilot-plant and
the existing full-scale Henriksdal WWTP. The report is structured to first present the
underlying principles of the plant-wide model including the precipitation model, then the
validation step with static pilot-test data and other steady-state analyses, after which dynamic
simulations are used to examine the influence of operational and control factors.
4
2 Methodology
2.1 Pilot plant under study
The modelled MBR pilot-plant is located at the R&D facility Hammarby Sjöstadsverk, which
is adjacent to the Henriksdal wastewater treatment plant at Henriksdalsberget, Stockholm
(Sweden). The purpose of the pilot plant was to evaluate the design and optimize the
operation and control. Its design mimics the configuration of the future full-scale facility,
which consists of pre-aeration, pre-sedimentation, anoxic, aeration zones and membrane
bioreactors. The scale factor used in the design and rebuilding of the pilot plant compared
with the full-scale plant is 1:6,700, except for the primary sedimentation, which is relatively
small (scale factor 1:12,000), and as a result led to poorer TSS separation efficiency. A major
difference for operating strategy and control is that the pilot has only two membrane tanks
that can be put into operation for optimal / energy efficient membrane operation, whereas
each line in the full-scale system will have 12 membrane tanks.
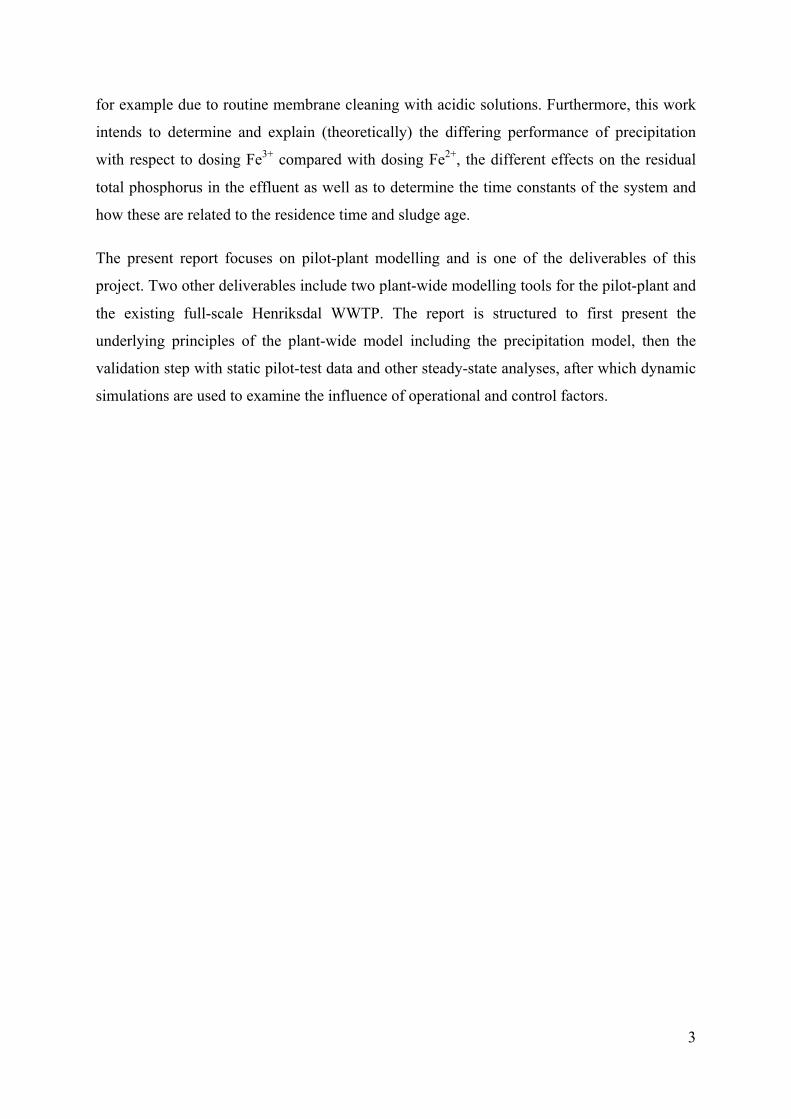
Figure 1 presents a simplified schematic flow diagram of the pilot-plant treatment process. It
consists of a conventional primary treatment including a pre-aeration step, where FeSO4 is
added, followed by seven bioreactors operated as a 4-stage modified Ludzack-Ettinger
(MLE) process consisting of two anoxic (BR1/ANOX and BR2/ANOX), one aerobic/anoxic
(BR3/FLEX), two aerobic (BR4/AERO and BR5/AERO), one de-aeration (BR6/DEOX) and
one post-anoxic (BR7/ANOX) compartment. The dimensions of each reactor are presented in
Table 1. The Henriksdal wastewater treatment plant consists of two influents: Sickla influent
(SIN) and Henriksdal influent (HIN). The influent to the pilot-plant was derived from HIN.
The mixed liquor suspended solids (MLSS) are treated in the membrane bioreactor tanks to
produce clarified permeate for final discharge. On the other hand, the retentate from the
MBRs are distributed to the bioreactors as returned activated sludge (RAS) as well as waste
activated sludge (WAS), which is pumped at a flow rate of 1.3 m3 d-1. A sludge treatment
facility was underway at the pilot plant but not in operation during this project; however,
anaerobically digested supernatant (Table 2) from Henriksdal WWTP was blended with the
RAS flow in the RAS-deox zone and then fed to the first anoxic reactor.
5
Figure 1 – Schematic process diagram of the pilot-plant treatment process.
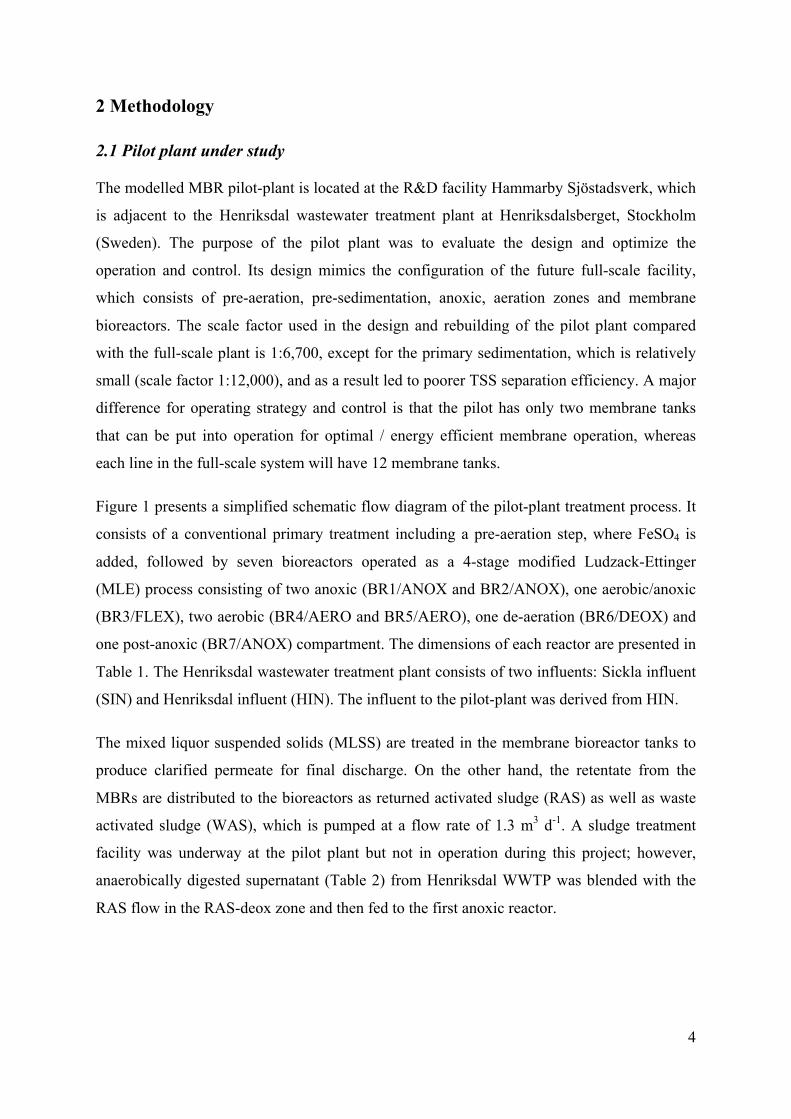
Table 1 – Configuration of the physical compartments in the activated sludge plant.
Activated sludge zone Physical tank volume (m3)
Anoxic (BR1/ANOx) 4.8
Anoxic (BR2/ANOx) 4.8
Anoxic/Aerobic Swing (BR3/FLEX) 4.8
Aerobic (BR4/AEROB) 4.8
Aerobic (BR5/AEROB) 1.5
De-aeration (BR5/DEOX) 3.3
Post-anoxic (BR6/ANOX) 4.8
MBR1 1.45
MBR2 1.45
RAS deoxygenation (RAS/DEOX) 2.7
6
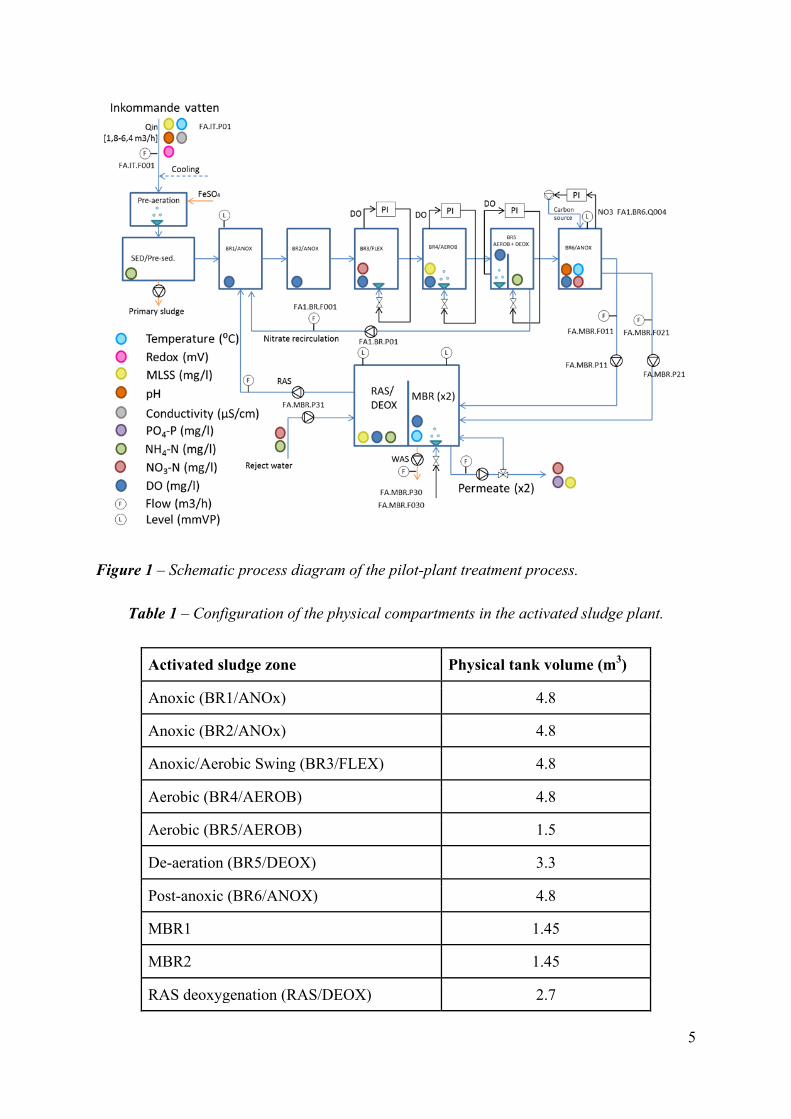
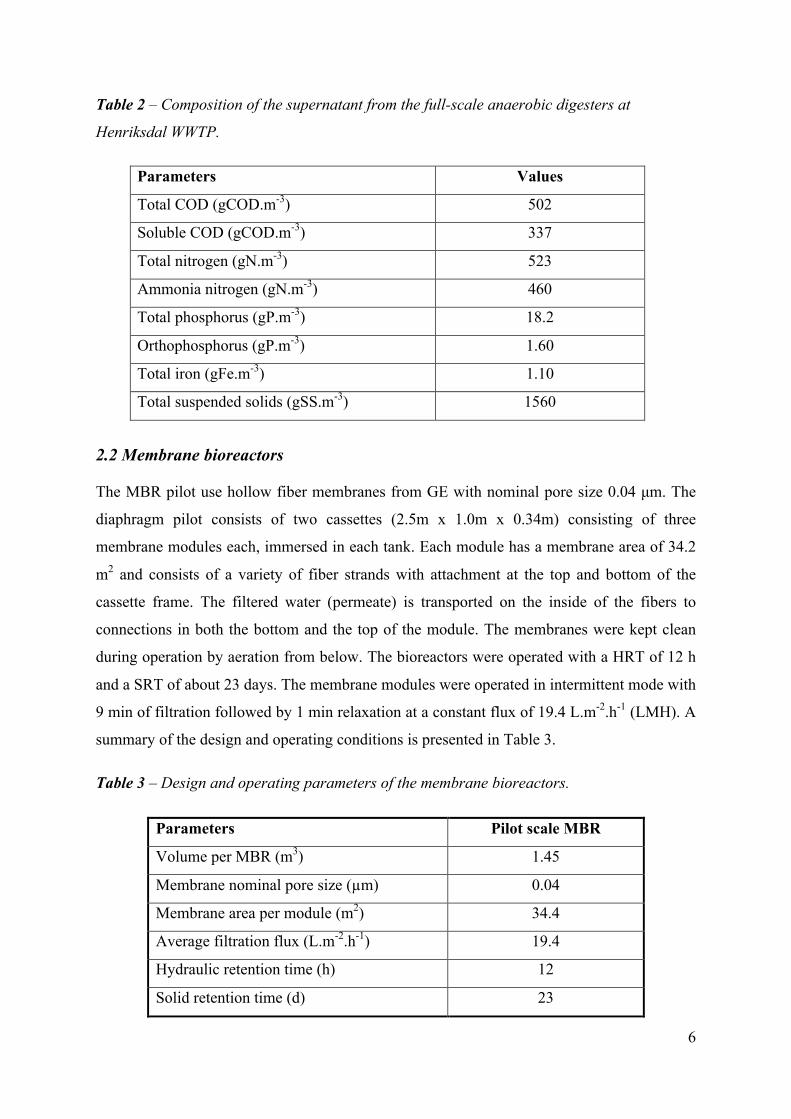
Table 2 – Composition of the supernatant from the full-scale anaerobic digesters at
Henriksdal WWTP.
Parameters Values
Total COD (gCOD.m-3) 502
Soluble COD (gCOD.m-3) 337
Total nitrogen (gN.m-3) 523
Ammonia nitrogen (gN.m-3) 460
Total phosphorus (gP.m-3) 18.2
Orthophosphorus (gP.m-3) 1.60
Total iron (gFe.m-3) 1.10
Total suspended solids (gSS.m-3) 1560
2.2 Membrane bioreactors
The MBR pilot use hollow fiber membranes from GE with nominal pore size 0.04 µm. The
diaphragm pilot consists of two cassettes (2.5m x 1.0m x 0.34m) consisting of three
membrane modules each, immersed in each tank. Each module has a membrane area of 34.2
m2 and consists of a variety of fiber strands with attachment at the top and bottom of the
cassette frame. The filtered water (permeate) is transported on the inside of the fibers to
connections in both the bottom and the top of the module. The membranes were kept clean
during operation by aeration from below. The bioreactors were operated with a HRT of 12 h
and a SRT of about 23 days. The membrane modules were operated in intermittent mode with
9 min of filtration followed by 1 min relaxation at a constant flux of 19.4 L.m-2.h-1 (LMH). A
summary of the design and operating conditions is presented in Table 3.
Table 3 – Design and operating parameters of the membrane bioreactors.
Parameters Pilot scale MBR
Volume per MBR (m3) 1.45
Membrane nominal pore size (µm) 0.04
Membrane area per module (m2) 34.4
Average filtration flux (L.m-2.h-1) 19.4
Hydraulic retention time (h) 12
Solid retention time (d) 23
7
2.3 Chemical additions
Phosphorus was removed in the aqueous phase by chemical precipitation with FeSO4.7H2O
(iron (II) sulfate heptahydrate) and FeCl3 (iron (III) chloride hexahydrate) added at three
distinct dosing points. FeSO4 was dosed in the pre-aeration tank before the primary clarifier
and in the aerobic tank (BR4/AEROB), whereas FeCl3 was added at the end of the post-
denitrification (BR6/ANOX) before the MBRs. The addition of FeSO4 to the pre-aeration
was flow proportional with an annual average flow of 10 gFe.m-3 while the addition of FeSO4
in the BRA4/AEROB was controlled towards a set point of 0.2 gP.m-3 in the treated effluent
with a maximum dose of 15 gFe.m-3. FeCl3 added before the MBRs was also controlled
towards a set point of 0.15 gP.m-3 in the effluent with a maximum dose of 15 gFe.m-3.
Brenntaplus (a mixture of proteins, sugars and alcohols) was used as an external carbon
source at a concentration of 1000,000 gCOD.m-3. It was dosed in the post-anoxic tank
(BR6/ANOX) and the dosage was controlled towards a preselected nitrate concentration (set
point 3 gN.m-3) in the effluent.
2.4 Wastewater characterisation
2.4.1 SCADA data
Daily data were obtained from the supervisory control and data acquisition (SCADA) system.
Data acquisition included online flow rates of water and sludge streams and air to the
activated sludge system, PO4-P, NO3-N on treated effluent, dissolved oxygen (DO),
suspended solids (SS), temperature and pH in MBR 2.
2.4.2 Plant routine measurement data
Data from routine sampling and offline analysis were provided by SVOA for use in the
model analysis. These included routine daily and weekly measurements on composite
samples from auto-samplers located at the influent, primary effluent, effluent (treated
outflow), bioreactor 4 and RAS/DEOX line. Analyses on the influent and effluent included
total organic carbon (TOC), 7-day biological oxygen demand (BOD7), total suspended solids
(TSS), volatile suspended solids (VSS), total suspended solids (TSS), total dissolved solids
(TDS), volatile fatty acid (VFA), ammonia (NH4-N), nitrate (NO3-), total nitrogen (TN),
phosphate (PO4-P), total phosphorus (TP), alkalinity, soluble calcium (Ca), magnesium (Mg),
sodium (Na) and potassium (K). Analyses were generally done using Standard Methods
(APHA, 2012). The samples were conserved with 1 part 4M sulfuric acid to 100 parts sample
8
volume, except for samples tested for TOC, which were conserved with 2M hydrochloric
acid in corresponding proportions. In addition to external analyses, other samples were
analysed internally (onsite) for TSS, filtered and total COD, total nitrogen and ammonium
nitrogen by colorimeter using a spectrophotometer (WTW Photolab 6600). Data collected
over the period from 20 June 2016 to 10 April 2017 were selected and averaged before use as
a representative measure of steady state conditions.
2.4.3 Intensive sampling and offline analysis
Intensive sampling and offline analyses were carried out to augment routine measurements at
the plant. Grab and composite samples were collected daily for a week over the period
12/07/2017 to 19/07/2017 from five different points: influent, primary effluent, mixed liquor,
effluent, from one of the bioreactors (BR4/AEROB) and RAS/DEOX return sludge. Samples
were stored in a cooler box with ice bricks and transported to an external laboratory (Eurofins
Environment Sweden AB), which conducted the analyses.
2.5 Plant-wide model configuration
2.5.1 Plant model configuration
The model was adapted from the Benchmark Simulation Model No. 2 (BSM2) (Gernaey et
al., 2014, Solon et al., 2017). Briefly, the primary settling tank was modelled as one non-
reactive settler (Otterpohl and Freund, 1992). Biological kinetics in the activated sludge plant
were described by ASM2d (Henze et al., 2000), expanded to include physico-chemical
processes as described below (Solon et al., 2017). Furthermore, the TSS in ASM2d was
computed from volatile suspended solids (VSS) and inorganic suspended solids (ISS). The
membranes were simply described as a reactive filtration system with wastewater entering at
the bottom, permeate exiting at the top of the membranes and retained biomass leaving from
the base to be recycled back to the activated sludge as returned activated sludge. Sludge
thickening and dewatering units were assumed to be ideal (with constant split fraction and
characteristics) with no hold-up volume (Jeppsson et al., 2007).
Although the plant under study did not have a sludge treatment train, an anaerobic digester
was set on the thickened sludge line. This allowed a full evaluation on the impacts of iron
salts to be carried out in the pilot plant as a whole. Biochemical conversion processes in the
anaerobic digester were described by the ADM1 (Batstone et al., 2002), which was upgraded
to include recent developments, such as physico-chemical and biological iron, sulphur and
9
phosphorus transformations (Flores-Alsina et al., 2016). For a full explanation of the
extended ADM1 model, as well as a detailed description on the matrix format used to
represent anaerobic digestion model, the original publication (Batstone et al., 2002; Solon et
al., 2017) should be consulted. To date, ASM and ADM1 have not been developed in a plant-
wide context and, importantly, have not had a common state set (mainly due to complexity
and simulation speed in single environment applications). For this reason, the ASM and
ADM1 models have typically required state conversion interfaces. To connect ASM and
ADM1, model interfaces were used to translate modelled state variables. The interfaces
between the ASM – ADM1 and ADM1 – ASM2d were modelled based on continuity
principles (Nopens et al., 2009) Additional details about how ASM2d and ADM1 models
were interfaced can be found in Solon et al. (2017).
The membrane bioreactor model consisted of two distinct sub-models that simulated
biological and physical mechanisms simultaneously, taking into account the interactions
between them. The first sub-model described the activated sludge processes, particularly
ASM2d, which was modified to consider the influence of soluble microbial products (SMPs)
consisting of the utilization-associated products (UAPs) and the biomass associated products
(BAPs) (Jiang et al., 2008). The second sub-model based on the membrane filtration
simulated the relevant physical processes that take place in the MBR and that directly or
indirectly influence the biological transformations. Membrane fouling was not taken into
account to avoid potential model complexity due to a large amount of parameters to calibrate
the fouling model. However, aeration was incorporated in the MBR model for fouling control
so that its impact on the activated sludge treatment could be evaluated. Backwashing and
relaxation were not physically modelled.
2.5.2 Physico-chemical model
The physico-chemical model consisted of two parts; an algebraic equation set for aqueous-
phase reactions (weak acid-base and ion-pair equilibrium) and rate expressions for minerals
precipitation, minerals dissolution and gas transfer (Kazadi Mbamba et al., 2015a; b).
a) Chemical equilibrium and ion pairing
Weak acid-base reactions and ion pairing were mathematically described with a set of non-
linear algebraic equations, which included one law mass-action for each aqueous phase
10
reaction and a number of molar contribution balances to satisfy the required degrees of
freedom for the calculation. In general form, the mass action laws are:
𝑎! = 𝐾! 𝑎!!!"!
!!! 𝑖 = 1,2… ,𝑁 (1)
where ai is an iterative species expressed in terms of chemical activities, aj is the activity of
an ion pair, Ki is the equilibrium constant for aqueous phase reaction i, vi,j is the
stoichiometric coefficient of the reactant or product j for aqueous phase reaction i. For a
typical wastewater, 20 universal iterative species (Ac-, Al3+, Bu-, CO32-, Ca+2, Cl-, Fe2+, Fe3+,
H+, HS-, K+, Mg2+, NH4+, NO2
-, NO3-, Na+, PO4
3-, Pro-, SO42-, Va-) and 118 species (ion
pairs) were identified and included in the speciation model.
In general form, the molar contribution balances are:
𝑇𝑂𝑇! = 𝑍! + 𝑣!"!!!! 𝑍! 𝑗 = 1, 2… ,𝑁 (2)
where 𝑇𝑂𝑇! is the total measurable concentration of an aqueous phase ingredient, which is
the sum contribution of that ingredient in various chemical forms in the aqueous phase. Zj is
the concentration of an iterative species and Zi is the concentration of an ion pair. Activity
coefficients (𝛾! or 𝛾!) were determined from the Davies approximation with temperature
correction, and equilibrium constants (Ki) were also corrected for temperature using the
constant-enthalpy form of the van’t Hoff equation (Stumm and Morgan, 1996; Flores Alsina
et al., 2015; Gustafsson, 2015).
b) Chemical precipitation model
The activated sludge system model was extended with the chemical precipitation processes of
two minerals, namely hydrous ferric oxide (HFO) and iron phosphate (FePO4). The theory of
coagulation and chemical precipitation reactions is very complex. A greatly simplified and
general scheme of chemical P removal involving processes, such iron oxidation-reduction,
precipitation and adsorption on HFO surfaces, is illustrated in Figure 2. Removal of P by
chemical precipitation and sorption were assumed to take place in parallel and therefore be
competing for soluble ferric iron ions in the wastewater within the bioreactors (Wu et al.,
2015).
Firstly, iron transformations was described using the hydrous ferric oxide model, which
describes how the precipitation of freshly formed and highly reactive HFO provides a number
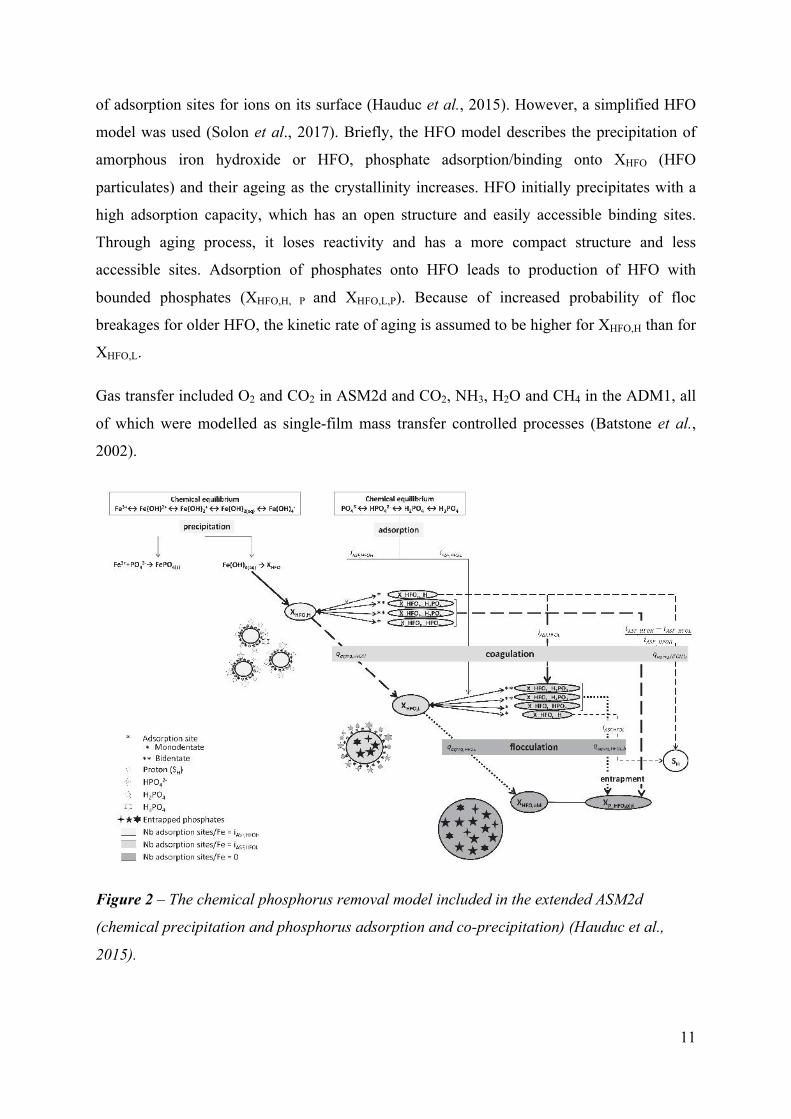
11
of adsorption sites for ions on its surface (Hauduc et al., 2015). However, a simplified HFO
model was used (Solon et al., 2017). Briefly, the HFO model describes the precipitation of
amorphous iron hydroxide or HFO, phosphate adsorption/binding onto XHFO (HFO
particulates) and their ageing as the crystallinity increases. HFO initially precipitates with a
high adsorption capacity, which has an open structure and easily accessible binding sites.
Through aging process, it loses reactivity and has a more compact structure and less
accessible sites. Adsorption of phosphates onto HFO leads to production of HFO with
bounded phosphates (XHFO,H, P and XHFO,L,P). Because of increased probability of floc
breakages for older HFO, the kinetic rate of aging is assumed to be higher for XHFO,H than for
XHFO,L.
Gas transfer included O2 and CO2 in ASM2d and CO2, NH3, H2O and CH4 in the ADM1, all
of which were modelled as single-film mass transfer controlled processes (Batstone et al.,
2002).
Figure 2 – The chemical phosphorus removal model included in the extended ASM2d
(chemical precipitation and phosphorus adsorption and co-precipitation) (Hauduc et al.,
2015).

12
When iron salts, such as FeSO4, are added to the aerobic tank, Fe2+ will undergo oxidation
into ferric iron as follows:
Fe2+ + ¼ O2 + H+ → Fe3+ + ½ H2O (3)
The reaction consumes a stoichiometric amount of 0.14 g O2/g Fe2+. The oxidation of
dissolved ferrous iron leads to the formation of amorphous to poorly crystalline ferric-
precipitates with a very high sorption capacity for phosphorus. HFO precipitates, formed by
oxidation of Fe2+ in the mixed liquor, will affect the removal of P by adsorption and co-
precipitation.
Secondly, iron phosphate precipitation (XFePO4) was described as a reversible process using
the supersaturation as the chemical driving force. The rate expression for iron phosphate
(strengite) precipitation rate was (Kazadi Mbamba et al., 2015b):
𝑟!"#$! = 𝑘!"#$!𝑋!"#$!𝜎! (4)
where 𝑟!"#$! is the iron phosphate precipitation rate (gFe.m-3.d-1), 𝑘!"#$! is an empirical
kinetic rate coefficient (d-1), 𝑋!"#$! (gFe.m-3) is the concentration of precipitate at any time t
(a dynamic state variable). n is the order of the precipitation reaction (equal to 2 for iron
phosphate) with respect to supersaturation, calculated as follows for iron phosphate as an
example:
𝜎 =!(!"!!)! !(!"!!!)
!"#!"#$!
! − 1 (5)
where Z(Fe3+) and Z(PO43-) are the chemical activities of ferric iron and phosphate ions in the
aqueous phase and KSP,FePO4 is the solubility product constant for iron phosphate.
In the extended ADM1, mineral precipitation is also described as a reversible process using
supersaturation as the chemical driving force. The multiple minerals in ADM1 include
calcite, aragonite, amorphous calcium phosphate and struvite. Furthermore, the extension of
ADM1 includes iron phase transformation. Ferric iron in the form of hydrous ferric oxides
(XHFO,L, XHFO,H) undergoes reduction to ferrous iron using hydrogen and sulfide as electron
donor (Solon et al., 2017). Once released Fe2+ can preferentially bind with S2- to form iron
sulphide. Additionally, Fe2+ in excess may also combine with soluble phosphate present in
13
the anaerobic digester to form vivianite (Fe3(PO4)2). FePO4, if undersaturated, may undergo
dissolution releasing Fe3+ and soluble P.
2.5.3 Influent COD fractionation modelling
The fractionation of COD in the influent was performed using the routine data provided by
the pilot plant operator. The organic matter in the influent was fractionated into fermentable,
readily biodegradable organic compounds (SF), fermentation products (SA), inert soluble
organic compounds (SI), slowly biodegradable organic compounds (XS) and inert particular
organic compounds (XI) (Henze et al., 1995). Briefly, the biodegradable COD (SF + SA + XS)
concentration was estimated based on BOD7 test data made available by the plant operator
and using the method as described by Grady Jr et al. (2011). Fermentation products (SA) were
estimated to be equal to measured VFAs. Readily biodegradable COD (SF + SA) was
estimated using the floc/filtration procedure proposed by Mamais et al. (1993), based on the
assumption that suspended solids and colloidal particulates are captured and removed by
flocculation with a zinc hydroxide precipitate to leave only truly dissolved organic matter
after filtration. 90% of the soluble COD measured in secondary effluent samples was
assumed to be non-biodegradable soluble COD (SI) (Siegrist and Tschui, 1992).
The values of influent variables, such as total suspended solids (XTSS), total dissolved
ammonia nitrogen (SNH4), nitrate (SNO3) and inorganic soluble phosphorus (SPO4), were
assumed to be equal to experimentally measured values (average measured for weekly
composite samples). Other variables in the influent, such as dissolved oxygen (SO2) and
dinitrogen (SN2), were set to zero. Particulate components, namely nitrifying organisms
(XAUT) and heterotrophic organisms (XH) were assumed to be negligible in the influent as per
Henze et al. (1995). Since phosphorus was removed chemically, all the bio-P processes were
deactivated in ASM2d and therefore, phosphate-accumulating organisms (XPAO),
polyphosphates (XPP) and poly-hydroxy-alkanoates (XPHA) were assumed to be equal to zero
in this study.
2.5.4 Synthetic (long-term) influent data generation
The static influent characteristics obtained from the analysis above, were used to estimate
dynamic influent base characteristics. A simplified dynamic influent generator was used to
re-create long-term dynamics (Gernaey et al., 2011). Since data related to influent wet
weather flow-rate conditions were missing for the pilot-system, the measured flow rate data
14
were used. A temperature module was not included in the model since the measured data
were available and used instead. Finally, an additional module had to be included in order to
capture the dynamics of cations (Na, K, Ca, Mg) and anions (Cl). The influent generator
results were validated against a corresponding dataset for a subset of influent characteristics.
2.6 Model implementation
The combined biological and physico-chemical models together form a differential-algebraic
equation set, which was implemented as Matlab C-MEX files and was solved in
MATLAB/SIMULINK (Version 8.1, Mathworks Inc., USA) as described elsewhere
(Gernaey et al., 2014; Kazadi Mbamba et al., 2016; Flores-Alsina et al., 2015; Solon et al.,
2017).
2.7 Parameters
A systematic step-wise calibration procedure was performed in which a few kinetic
parameters were adjusted to minimize discrepancies between the model output and static
measured data from the pilot-plant (Kazadi Mbamba et al., 2016). With the exception of the
influent characterisation, model parameters for ASM2d and ADM1 were kept at default
values (Henze et al., 2000; Batstone et al., 2002). The autotrophic saturation coefficient for
phosphorus in growth was reduced from 0.01 to 0.001 gP.m-3 due to lower concentration of
PO4 that could be reached in the bioreactors as a result of chemical treatment. The Davies
approximation to activity coefficients was used with temperature correction, and equilibrium
constants were also adjusted for temperature using the constant-enthalpy form of the van’t
Hoff equation (Stumm and Morgan, 1996). For minerals precipitation reactions in the
anaerobic digester, precipitation rate coefficients (kcryst) estimated in a previous study were
used (Kazadi Mbamba et al., 2015b).
The default parameter values defined in BSM2 were first used for the primary clarification
model (Gernaey et al., 2014). However, the use of these values overestimated the efficiency
performance. So, based on empirical knowledge, the efficiency correction factor was altered
from 0.65 to 0.3 in the primary clarifier model and the WAS flow was adjusted accordingly
to change the concentrations of suspended solids in the RAS and mixed liquor to observed
values of 6,500 g.m-3 and 8,500 g.m-3, respectively.
15
2.8 Model scenarios
Scenario analyses were used to investigate the performance of the plant-wide model and the
impact of simultaneous precipitation on phosphorus removal under steady-state and dynamic
conditions. The criteria that were used to assess model performance were effluent quality in
the water line including soluble ammonia nitrogen, nitrate and phosphate. The following five
scenarios were selected for model evaluation:
i) Scenario 1 (Base case) – plant-wide model with MBR, chemical precipitation, closed loops
for DO in the aerobic zones and NO3 in the post-anoxic zone were implemented. The DO
concentrations in the aerobic tanks were controlled towards a set point of 2.0 g.m-3 by
manipulating the air supply rate, while an external carbon was added to the pre-anoxic tank to
maintain the concentration of NO3 at 3 gN.m-3.
ii) Scenario 2 with changed concentration of FeSO4. This scenario was designed to assess the
(response) time constant under dynamic conditions when the concentration of iron salts
change and how this will affect the phosphorus removal.
iii) Scenario 3 with phosphorus controller. The base case was simulated as in Scenario 1
except that dosing of Fe salts was controlled towards a predefined concentration of
phosphorus in the effluent by manipulating the metal flow rates (FeSO4 or FeCl3). This
scenario examined whether inclusion of a phosphorus controller in chemical precipitation
would be essential to achieve low P effluent while at the same time avoiding too low P
concentrations, which is detrimental to biological processes in the bioreactors.
iv) Scenarios 4, 5 & 6 were designed to investigate the impact of changing the location of
dosing of iron sulphate fed to the activated sludge system. During this simulation analysis,
the iron sulphate additions were varied between three different reactors: aerobic, anoxic and
DEOX/RAS.
The different scenarios above were analysed based on 294 days of simulation with dynamic
influent conditions. To ensure that the model had reached steady-state before beginning the
analysis, a simulation was run for at least 300 days with a static influent and results at the end
of this simulation was reused as initial values for the dynamic simulations.
16
3 Results and discussion
3.1 Steady-state plant influent
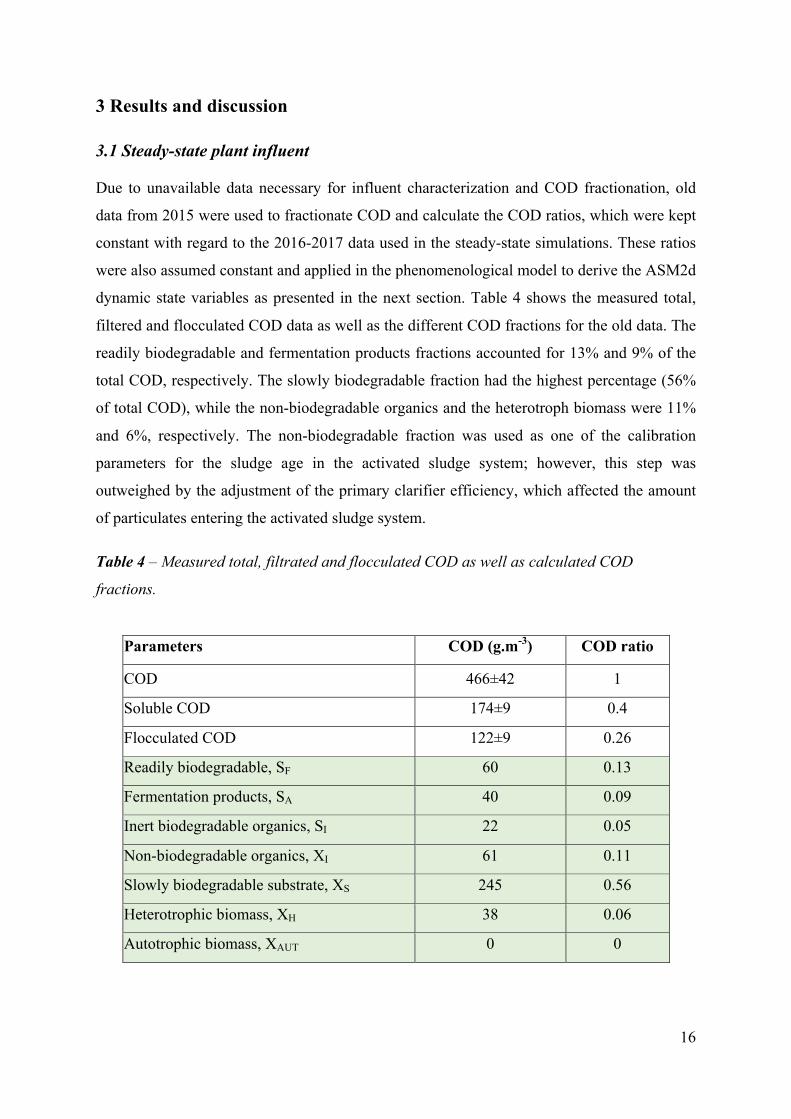
Due to unavailable data necessary for influent characterization and COD fractionation, old
data from 2015 were used to fractionate COD and calculate the COD ratios, which were kept
constant with regard to the 2016-2017 data used in the steady-state simulations. These ratios
were also assumed constant and applied in the phenomenological model to derive the ASM2d
dynamic state variables as presented in the next section. Table 4 shows the measured total,
filtered and flocculated COD data as well as the different COD fractions for the old data. The
readily biodegradable and fermentation products fractions accounted for 13% and 9% of the
total COD, respectively. The slowly biodegradable fraction had the highest percentage (56%
of total COD), while the non-biodegradable organics and the heterotroph biomass were 11%
and 6%, respectively. The non-biodegradable fraction was used as one of the calibration
parameters for the sludge age in the activated sludge system; however, this step was
outweighed by the adjustment of the primary clarifier efficiency, which affected the amount
of particulates entering the activated sludge system.
Table 4 – Measured total, filtrated and flocculated COD as well as calculated COD
fractions.
Parameters COD (g.m-3) COD ratio
COD 466±42 1
Soluble COD 174±9 0.4
Flocculated COD 122±9 0.26
Readily biodegradable, SF 60 0.13
Fermentation products, SA 40 0.09
Inert biodegradable organics, SI 22 0.05
Non-biodegradable organics, XI 61 0.11
Slowly biodegradable substrate, XS 245 0.56
Heterotrophic biomass, XH 38 0.06
Autotrophic biomass, XAUT 0 0
17
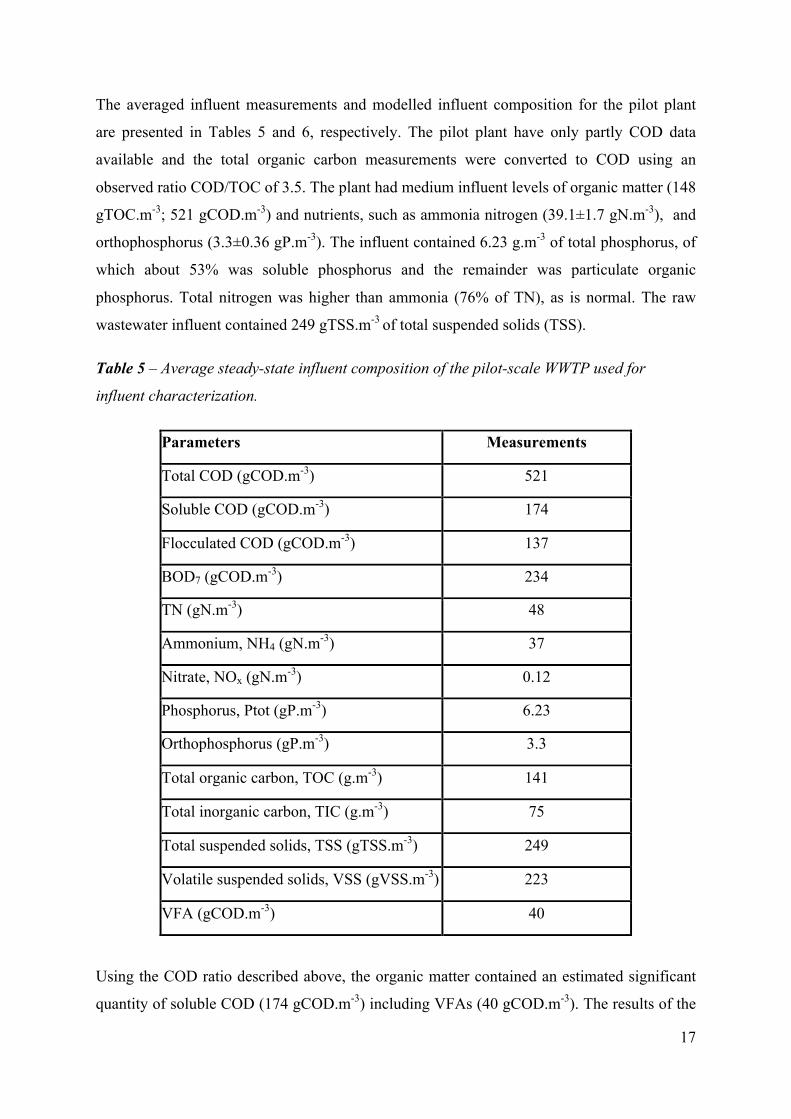
The averaged influent measurements and modelled influent composition for the pilot plant
are presented in Tables 5 and 6, respectively. The pilot plant have only partly COD data
available and the total organic carbon measurements were converted to COD using an
observed ratio COD/TOC of 3.5. The plant had medium influent levels of organic matter (148
gTOC.m-3; 521 gCOD.m-3) and nutrients, such as ammonia nitrogen (39.1±1.7 gN.m-3), and
orthophosphorus (3.3±0.36 gP.m-3). The influent contained 6.23 g.m-3 of total phosphorus, of
which about 53% was soluble phosphorus and the remainder was particulate organic
phosphorus. Total nitrogen was higher than ammonia (76% of TN), as is normal. The raw
wastewater influent contained 249 gTSS.m-3 of total suspended solids (TSS).
Table 5 – Average steady-state influent composition of the pilot-scale WWTP used for
influent characterization.
Parameters Measurements
Total COD (gCOD.m-3) 521
Soluble COD (gCOD.m-3) 174
Flocculated COD (gCOD.m-3) 137
BOD7 (gCOD.m-3) 234
TN (gN.m-3) 48
Ammonium, NH4 (gN.m-3) 37
Nitrate, NOx (gN.m-3) 0.12
Phosphorus, Ptot (gP.m-3) 6.23
Orthophosphorus (gP.m-3) 3.3
Total organic carbon, TOC (g.m-3) 141
Total inorganic carbon, TIC (g.m-3) 75
Total suspended solids, TSS (gTSS.m-3) 249
Volatile suspended solids, VSS (gVSS.m-3) 223
VFA (gCOD.m-3) 40
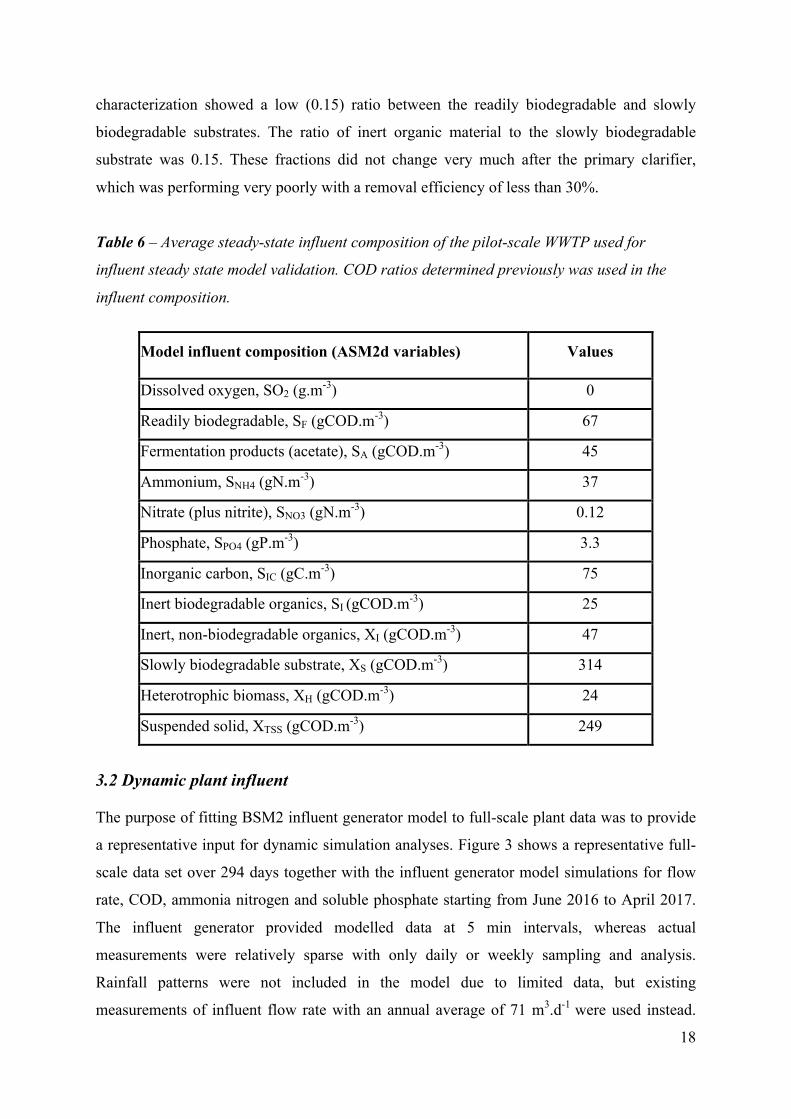
Using the COD ratio described above, the organic matter contained an estimated significant
quantity of soluble COD (174 gCOD.m-3) including VFAs (40 gCOD.m-3). The results of the
18
characterization showed a low (0.15) ratio between the readily biodegradable and slowly
biodegradable substrates. The ratio of inert organic material to the slowly biodegradable
substrate was 0.15. These fractions did not change very much after the primary clarifier,
which was performing very poorly with a removal efficiency of less than 30%.
Table 6 – Average steady-state influent composition of the pilot-scale WWTP used for
influent steady state model validation. COD ratios determined previously was used in the
influent composition.
Model influent composition (ASM2d variables) Values
Dissolved oxygen, SO2 (g.m-3) 0
Readily biodegradable, SF (gCOD.m-3) 67
Fermentation products (acetate), SA (gCOD.m-3) 45
Ammonium, SNH4 (gN.m-3) 37
Nitrate (plus nitrite), SNO3 (gN.m-3) 0.12
Phosphate, SPO4 (gP.m-3) 3.3
Inorganic carbon, SIC (gC.m-3) 75
Inert biodegradable organics, SI (gCOD.m-3) 25
Inert, non-biodegradable organics, XI (gCOD.m-3) 47
Slowly biodegradable substrate, XS (gCOD.m-3) 314
Heterotrophic biomass, XH (gCOD.m-3) 24
Suspended solid, XTSS (gCOD.m-3) 249
3.2 Dynamic plant influent
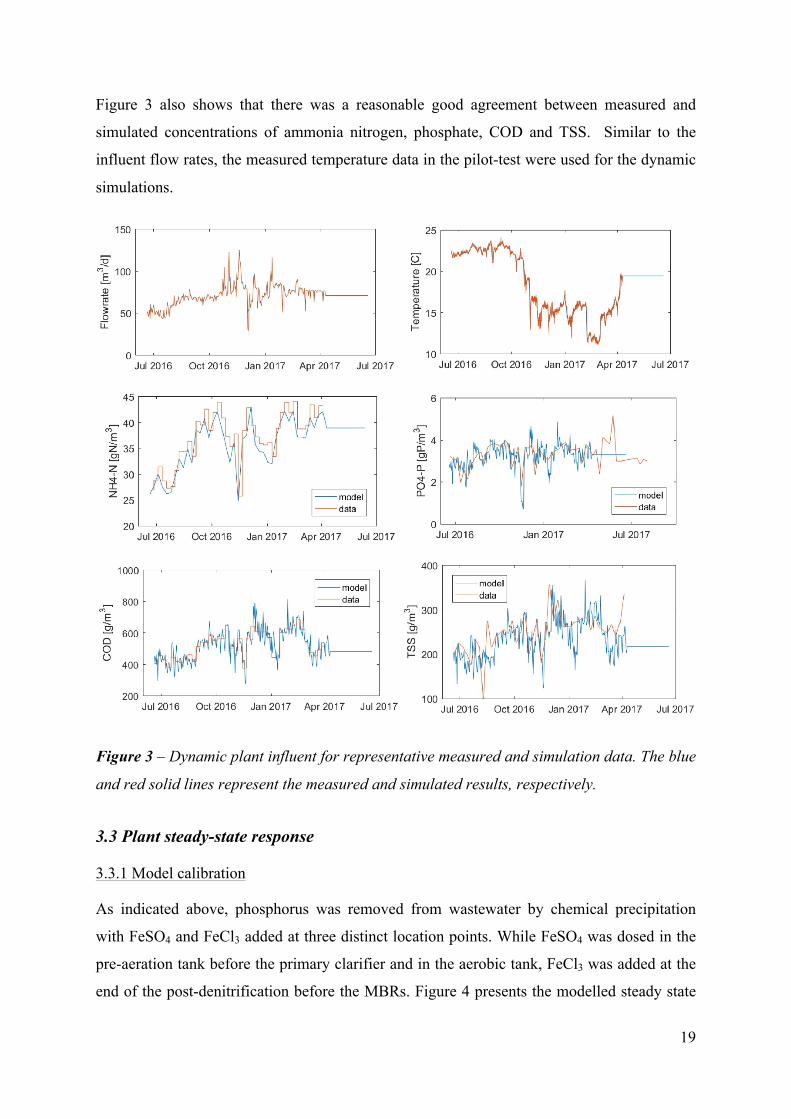
The purpose of fitting BSM2 influent generator model to full-scale plant data was to provide
a representative input for dynamic simulation analyses. Figure 3 shows a representative full-
scale data set over 294 days together with the influent generator model simulations for flow
rate, COD, ammonia nitrogen and soluble phosphate starting from June 2016 to April 2017.
The influent generator provided modelled data at 5 min intervals, whereas actual
measurements were relatively sparse with only daily or weekly sampling and analysis.
Rainfall patterns were not included in the model due to limited data, but existing
measurements of influent flow rate with an annual average of 71 m3.d-1 were used instead.
19
Figure 3 also shows that there was a reasonable good agreement between measured and
simulated concentrations of ammonia nitrogen, phosphate, COD and TSS. Similar to the
influent flow rates, the measured temperature data in the pilot-test were used for the dynamic
simulations.
Figure 3 – Dynamic plant influent for representative measured and simulation data. The blue
and red solid lines represent the measured and simulated results, respectively.
3.3 Plant steady-state response
3.3.1 Model calibration
As indicated above, phosphorus was removed from wastewater by chemical precipitation
with FeSO4 and FeCl3 added at three distinct location points. While FeSO4 was dosed in the
pre-aeration tank before the primary clarifier and in the aerobic tank, FeCl3 was added at the
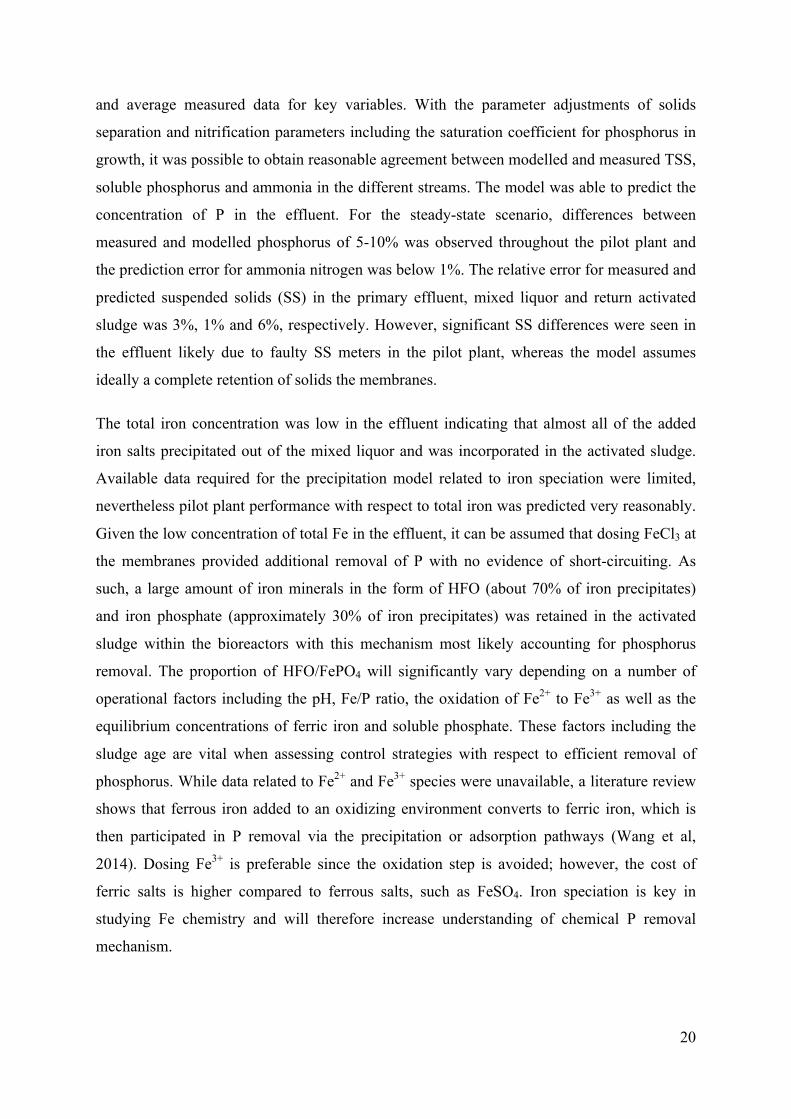
end of the post-denitrification before the MBRs. Figure 4 presents the modelled steady state
20
and average measured data for key variables. With the parameter adjustments of solids
separation and nitrification parameters including the saturation coefficient for phosphorus in
growth, it was possible to obtain reasonable agreement between modelled and measured TSS,
soluble phosphorus and ammonia in the different streams. The model was able to predict the
concentration of P in the effluent. For the steady-state scenario, differences between
measured and modelled phosphorus of 5-10% was observed throughout the pilot plant and
the prediction error for ammonia nitrogen was below 1%. The relative error for measured and
predicted suspended solids (SS) in the primary effluent, mixed liquor and return activated
sludge was 3%, 1% and 6%, respectively. However, significant SS differences were seen in
the effluent likely due to faulty SS meters in the pilot plant, whereas the model assumes
ideally a complete retention of solids the membranes.
The total iron concentration was low in the effluent indicating that almost all of the added
iron salts precipitated out of the mixed liquor and was incorporated in the activated sludge.
Available data required for the precipitation model related to iron speciation were limited,
nevertheless pilot plant performance with respect to total iron was predicted very reasonably.
Given the low concentration of total Fe in the effluent, it can be assumed that dosing FeCl3 at
the membranes provided additional removal of P with no evidence of short-circuiting. As
such, a large amount of iron minerals in the form of HFO (about 70% of iron precipitates)
and iron phosphate (approximately 30% of iron precipitates) was retained in the activated
sludge within the bioreactors with this mechanism most likely accounting for phosphorus
removal. The proportion of HFO/FePO4 will significantly vary depending on a number of
operational factors including the pH, Fe/P ratio, the oxidation of Fe2+ to Fe3+ as well as the
equilibrium concentrations of ferric iron and soluble phosphate. These factors including the
sludge age are vital when assessing control strategies with respect to efficient removal of
phosphorus. While data related to Fe2+ and Fe3+ species were unavailable, a literature review
shows that ferrous iron added to an oxidizing environment converts to ferric iron, which is
then participated in P removal via the precipitation or adsorption pathways (Wang et al,
2014). Dosing Fe3+ is preferable since the oxidation step is avoided; however, the cost of
ferric salts is higher compared to ferrous salts, such as FeSO4. Iron speciation is key in
studying Fe chemistry and will therefore increase understanding of chemical P removal
mechanism.
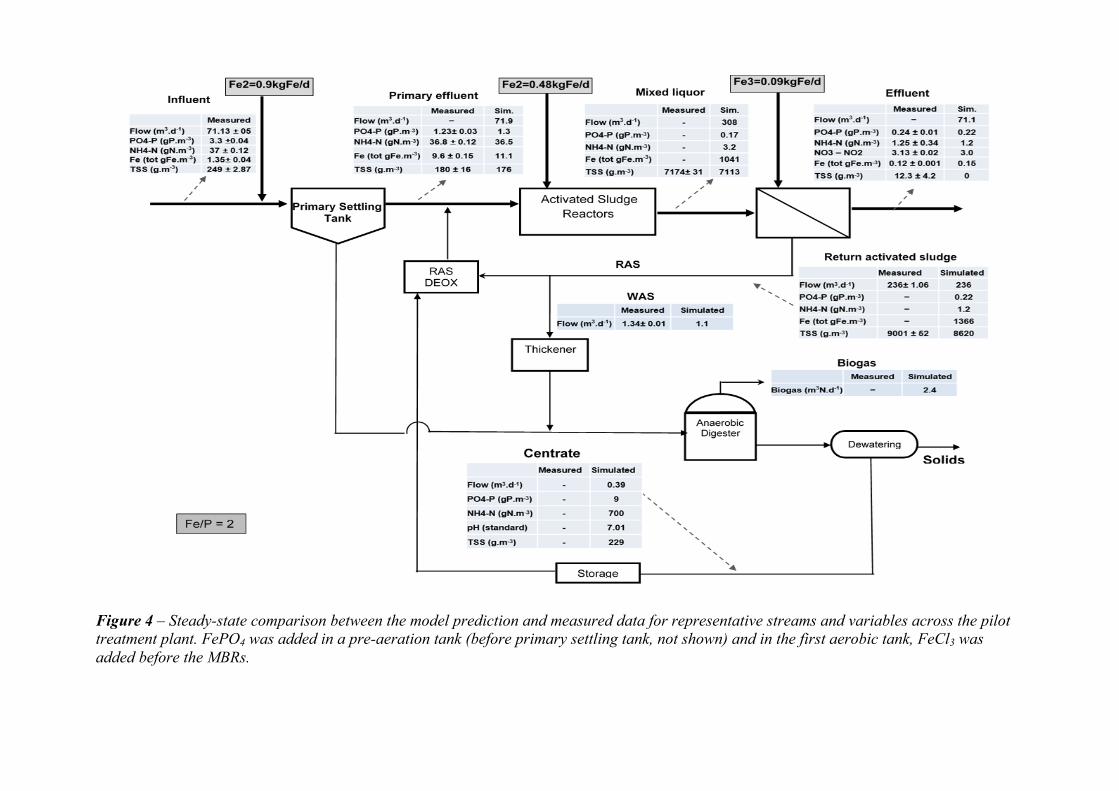
Figure 4 – Steady-state comparison between the model prediction and measured data for representative streams and variables across the pilot treatment plant. FePO4 was added in a pre-aeration tank (before primary settling tank, not shown) and in the first aerobic tank, FeCl3 was added before the MBRs.
22
The model simulated biogas production at 2.4 m3.d-1, which is lower probably due to a low
sedimentation efficiency in the primary clarifier (less than 30%). However, experimental data
were not available to evaluate the prediction accuracy since a sludge treatment facility at the
pilot plant was underway.
3.3.2 Impact of pH and Fe/P molar ratio
The calibrated plant-wide model was used to carry out further simulations to study the impact
of pH and molar ratio of Fe/P on the removal efficiency of phosphorus. The pH was varied
between 6.7 to 7.4 by changing the amount of sodium hydroxide in the influent whereas the
Fe/P ratio was varied by increasing proportionally the amount of iron salts added at all three
dosing points. Other parameters of the system’s phosphorus removal remained approximately
the same. As shown in Figure 5, the effluent P concentration significantly decreased with
decreasing pH at higher molar ratio between Fe and P. For example for the lowest ratio
(Fe/P=1), the effluent P dropped from 0.62 gP.m-3 at higher pH (7.4) to 0.1 at pH 6.7. This
shows that the pH and the molar ratio of iron to the phosphorus concentrations affect the
competition between hydroxyl ions and phosphates for ferric ions at the point of addition,
thus the fractions of HFO minerals and FePO4. These results are in good agreement with
other studies (Hauduc et al, 2016), except that the pH variation in the simulations has been
limited within the range in wastewater treatment. In general, the pH of a wastewater affects
chemical species distribution of the weak acid-base systems, such as phosphate, which in turn
dictate simultaneous chemical precipitation. FePO4 is likely to be the dominant phosphate
precipitate at low pH levels (6.5-6.7) due to increased levels of orthophosphate, whereas P
sorption of HFO surfaces appears to be the main removal mechanism affecting the fate and
transport of phosphorus at higher pH (from pH 6.7 and above). However, the relative
differences of P concentrations in the effluent between the highest and lowest Fe/P ratios was
higher (0.25) at higher pH but became smaller (0.06) at lower pH indicating that increasing
the concentrations of iron salts would not translate in further removal of phosphorus when the
residual P concentration is very low. This is in agreement with other studies, which have
reported that the efficiency of dosing chemicals drops significantly at low effluent
phosphorus concentrations (De Haas et al., 2000a, b, 2001).
23
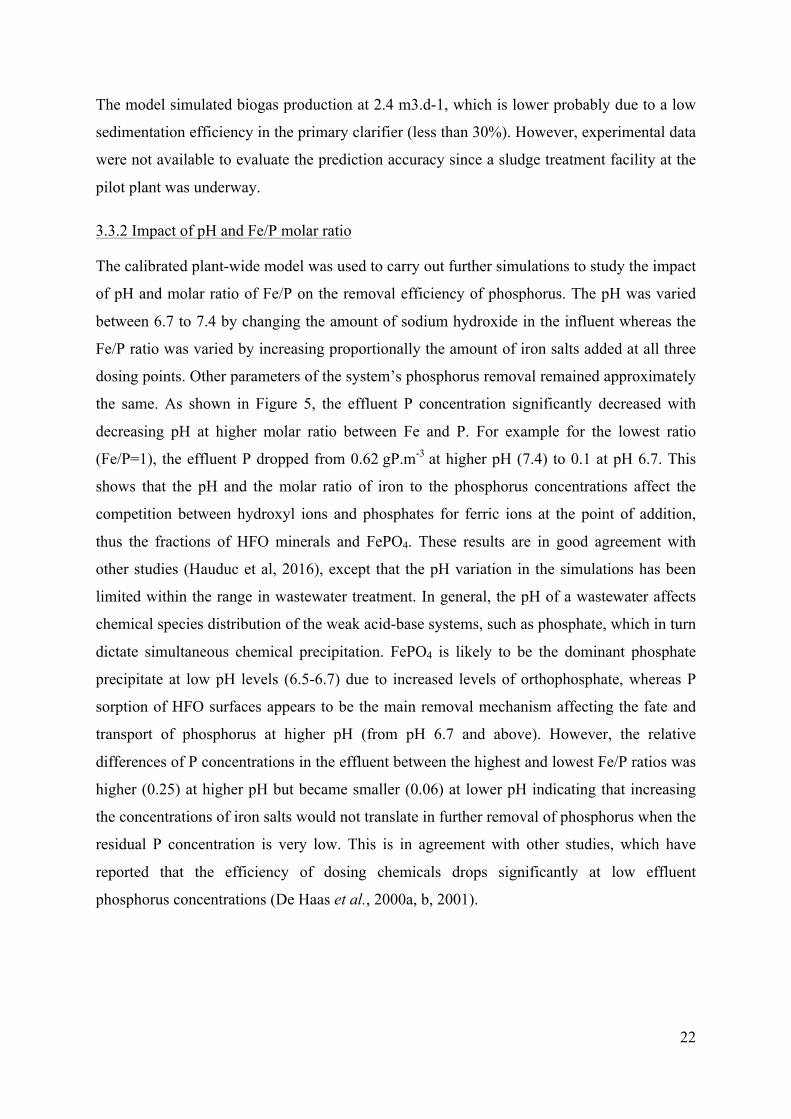
Figure 5 – The impact of pH and Fe/P molar ratio on the dissolved phosphorus in the
effluent.
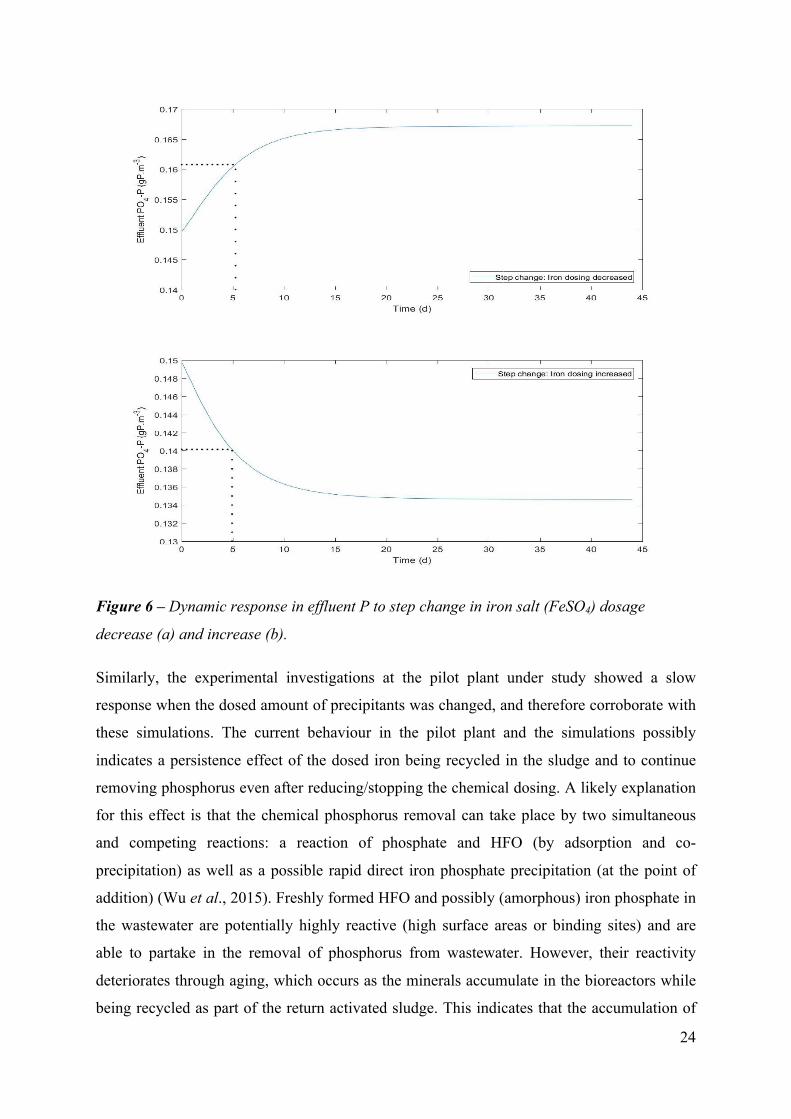
3.3.3 Time constant of chemical precipitation
Step change simulations were carried out making use of the calibrated plant-wide model to
determine the time constant of the chemical precipitation process. The time constant was
determined as the time required by the effluent P to reach 63.2% (from a FeSO4 step
decrease) or 36.8% (from a FeSO4 step increase) of its total change. Figure 6 presents the
results of the step changes. The time constants were found to be 5.25 d and 5 d when the flow
rate was decreased and increased by 10%, respectively. This indicates that when the dosing of
FeSO4 is changed in the wastewater treatment system, the effluent P will also vary
accordingly. The FeSO4 dosing has a direct and large effect on the effluent P, but with slow
dynamics. The change seems to be the largest in the beginning and eventually the effluent P
will approach a new equilibrium state at least in 5 days. The cause of the delay may be due to
dissolution, oxidation, formation, growth and aging of HFO complexes. The idea of feedback
control of a slow-responding process will be to adjust the dosage of precipitants such that the
effluent P is kept as close as possible within the acceptable operating region, in spite of
process disturbances.
24
Figure 6 – Dynamic response in effluent P to step change in iron salt (FeSO4) dosage
decrease (a) and increase (b).
Similarly, the experimental investigations at the pilot plant under study showed a slow
response when the dosed amount of precipitants was changed, and therefore corroborate with
these simulations. The current behaviour in the pilot plant and the simulations possibly
indicates a persistence effect of the dosed iron being recycled in the sludge and to continue
removing phosphorus even after reducing/stopping the chemical dosing. A likely explanation
for this effect is that the chemical phosphorus removal can take place by two simultaneous
and competing reactions: a reaction of phosphate and HFO (by adsorption and co-
precipitation) as well as a possible rapid direct iron phosphate precipitation (at the point of
addition) (Wu et al., 2015). Freshly formed HFO and possibly (amorphous) iron phosphate in
the wastewater are potentially highly reactive (high surface areas or binding sites) and are
able to partake in the removal of phosphorus from wastewater. However, their reactivity
deteriorates through aging, which occurs as the minerals accumulate in the bioreactors while
being recycled as part of the return activated sludge. This indicates that the accumulation of
25
the Fe precipitates appears to contribute to more efficient phosphorus removal. The
implication of this assertion is that the solid retention time (SRT) plays a critical role in
determining the effluent P concentration. In other words, during simultaneous precipitation,
iron dosed directly to the bioreactors or membrane tanks within the MBR system where
sludge recycling is taking place with much longer SRTs (23 days) will participate in P
removal. Additionally, the effluent P will decrease with increasing SRT indicating that the
sludge age is one of the key operational parameters controlling the iron sludge content in the
bioreactors and influences both the P in the effluent and eventually the MBR characteristics.
On the other hand, a higher SRT would involve more old sludge (less reactive), however
HFO reactivity is apparently maintained as iron, cycling in the MBR system, undergo
reduction-oxidation reactions while alternating between anoxic and aerobic conditions (Bligh
et al., 2017).
3.4 Analysis of model variants
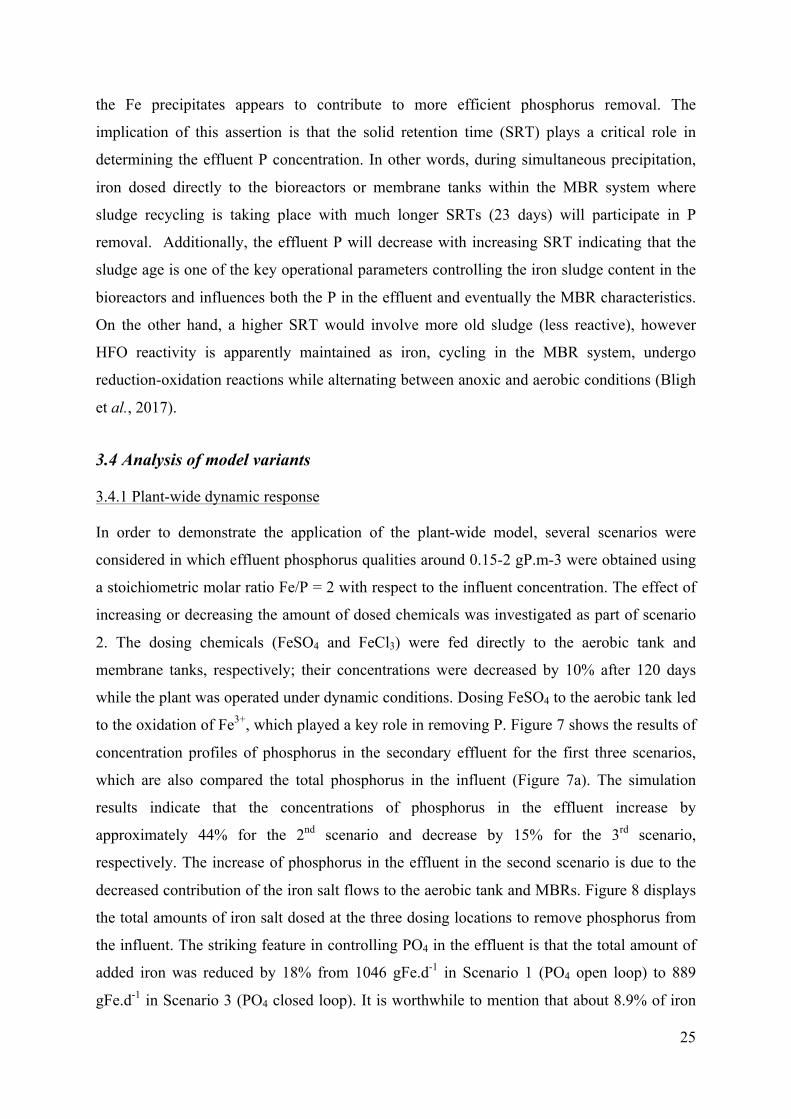
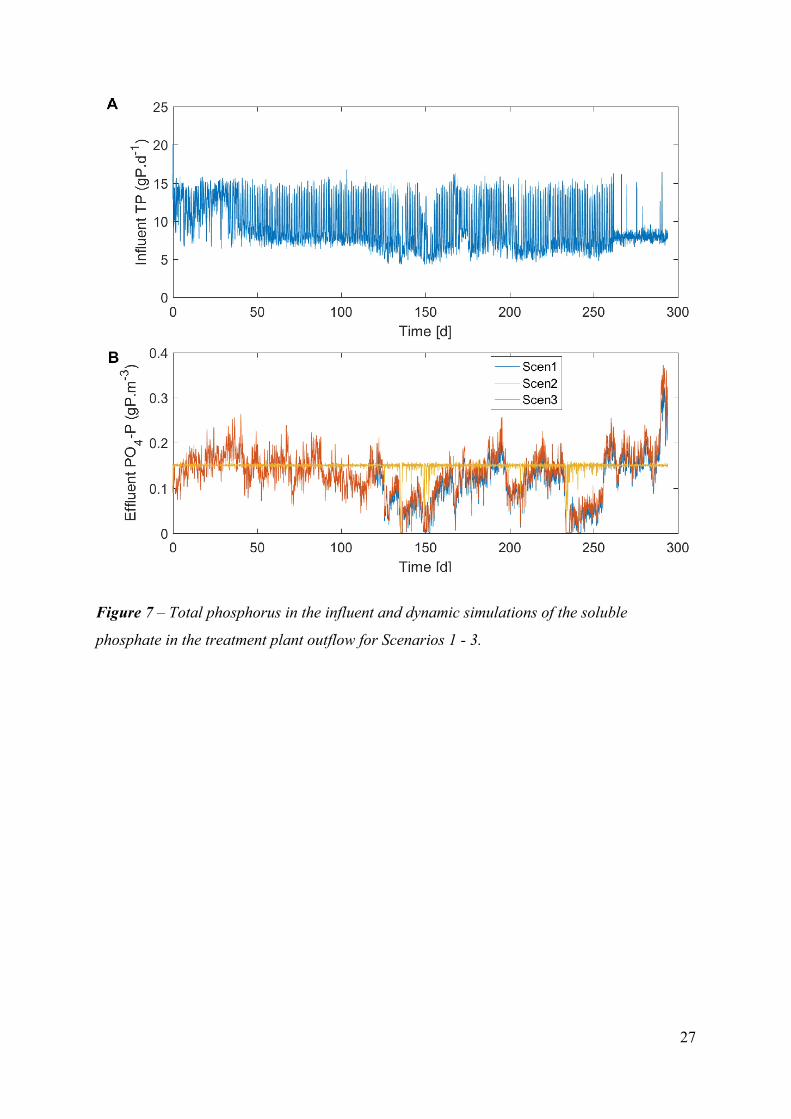
3.4.1 Plant-wide dynamic response
In order to demonstrate the application of the plant-wide model, several scenarios were
considered in which effluent phosphorus qualities around 0.15-2 gP.m-3 were obtained using
a stoichiometric molar ratio Fe/P = 2 with respect to the influent concentration. The effect of
increasing or decreasing the amount of dosed chemicals was investigated as part of scenario
2. The dosing chemicals (FeSO4 and FeCl3) were fed directly to the aerobic tank and
membrane tanks, respectively; their concentrations were decreased by 10% after 120 days
while the plant was operated under dynamic conditions. Dosing FeSO4 to the aerobic tank led
to the oxidation of Fe3+, which played a key role in removing P. Figure 7 shows the results of
concentration profiles of phosphorus in the secondary effluent for the first three scenarios,
which are also compared the total phosphorus in the influent (Figure 7a). The simulation
results indicate that the concentrations of phosphorus in the effluent increase by
approximately 44% for the 2nd scenario and decrease by 15% for the 3rd scenario,
respectively. The increase of phosphorus in the effluent in the second scenario is due to the
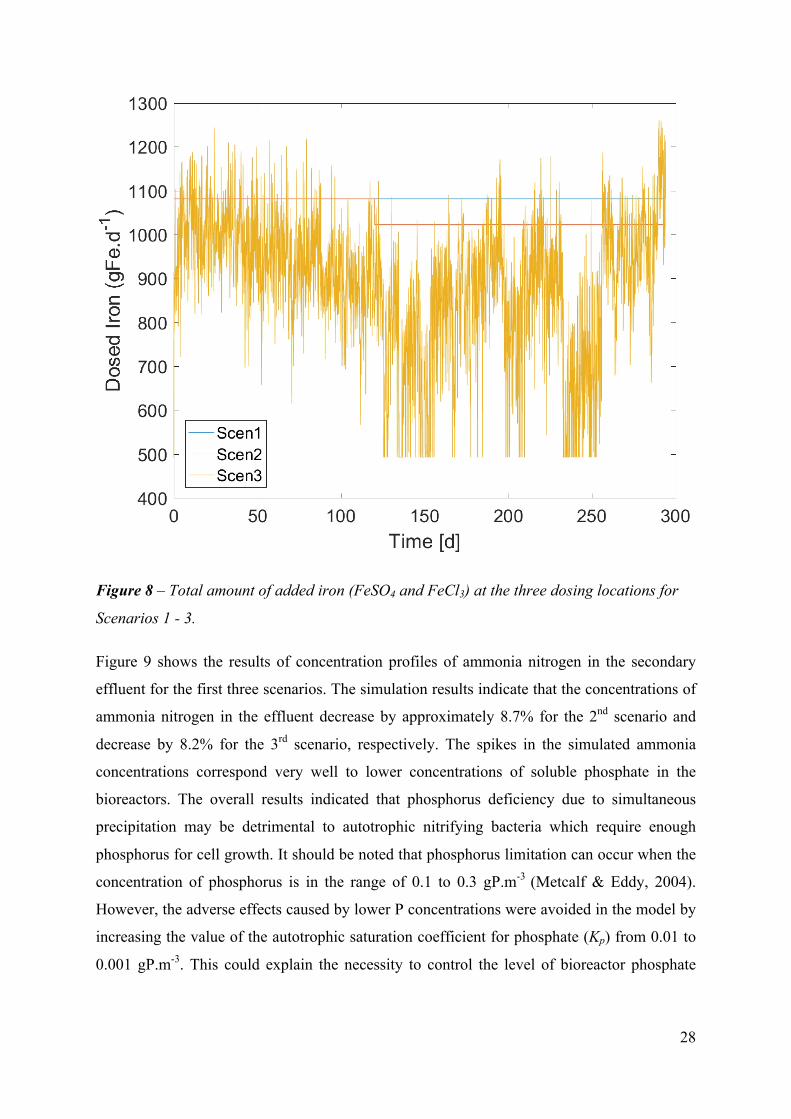
decreased contribution of the iron salt flows to the aerobic tank and MBRs. Figure 8 displays
the total amounts of iron salt dosed at the three dosing locations to remove phosphorus from
the influent. The striking feature in controlling PO4 in the effluent is that the total amount of
added iron was reduced by 18% from 1046 gFe.d-1 in Scenario 1 (PO4 open loop) to 889
gFe.d-1 in Scenario 3 (PO4 closed loop). It is worthwhile to mention that about 8.9% of iron
26
dosed in the first scenario was added as Fe(III) while the remaining (91.1%) was dosed as
FeSO4. The overall amount of Fe(III) was 8.6% in the second scenario, however it increased
significantly to 44.6% in Scenario 3 (see Section 3.4.2 for further discussion).
Scenario 2 was carried out to simulate the behaviour of the pilot plant when the FeSO4
dosage is increased or decreased and take corrective measures to ensure that the effluent
quality is maintained. For example, after a period of limited dosage due to incorrect
concentration precipitation chemicals, the modelling results show that this condition could be
compensated for by increasing or decreasing Fe salt dosage. As indicated above, this result is
in close agreement with observations at the pilot scale system under study, which showed a
slow response of effluent P when iron dosing was interrupted. The slow kinetics observed in
the pilot-test could indicate that the removal of phosphorus is not carried out by freshly added
ferrous or ferric iron, but rather by growing and aging iron-precipitates in the sludge. As
indicated above, redox cycling of iron in an MBR system is expected to maintain or reduce
the rate of HFO reactivity loss as a result of reduction in anoxic zones and oxidation in
aerobic zones (Blight et al., 2017). To this end, the presence of the accumulated precipitates
has a beneficial effect on phosphorus and appears to be the major mechanism possibly due to
the enhanced contact provided by the accumulated sludge, which lead to removal of P by
adsorption or co-precipitation. Thus, the amount and reactivity of existing minerals present in
the activated are indeed among the most influential factors for simultaneous precipitation
reactions.
27
Figure 7 – Total phosphorus in the influent and dynamic simulations of the soluble
phosphate in the treatment plant outflow for Scenarios 1 - 3.
28
Figure 8 – Total amount of added iron (FeSO4 and FeCl3) at the three dosing locations for
Scenarios 1 - 3.
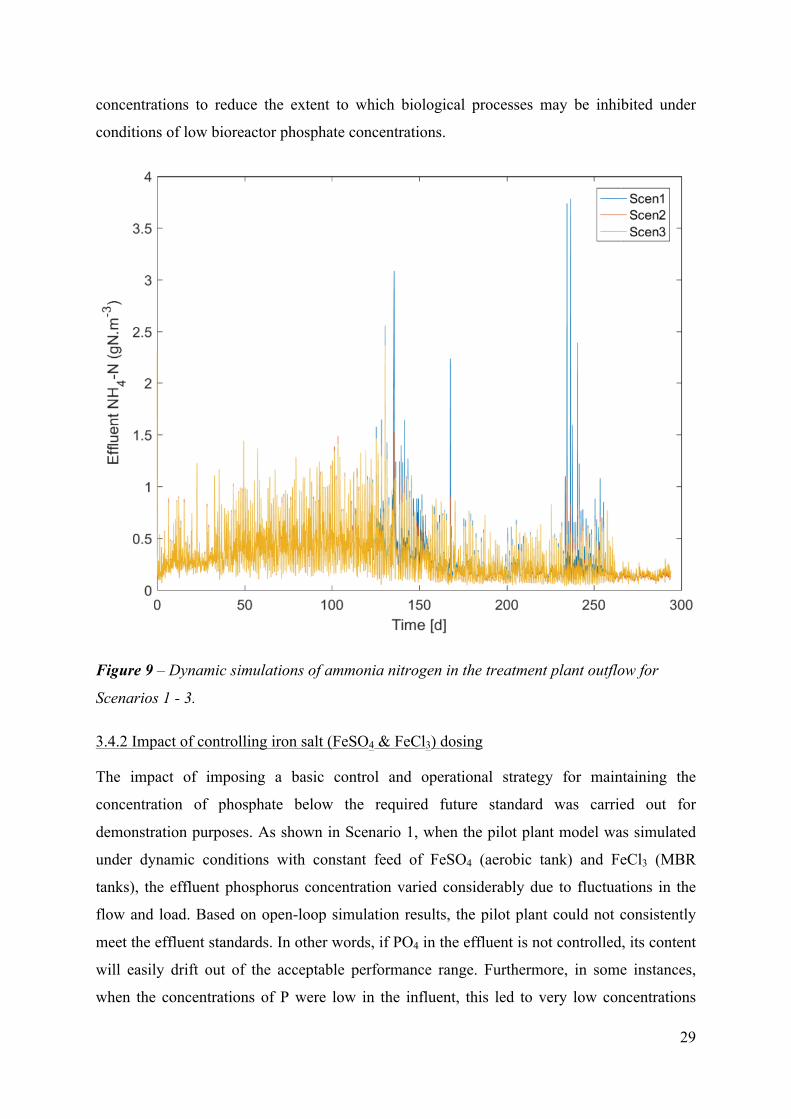
Figure 9 shows the results of concentration profiles of ammonia nitrogen in the secondary
effluent for the first three scenarios. The simulation results indicate that the concentrations of
ammonia nitrogen in the effluent decrease by approximately 8.7% for the 2nd scenario and
decrease by 8.2% for the 3rd scenario, respectively. The spikes in the simulated ammonia
concentrations correspond very well to lower concentrations of soluble phosphate in the
bioreactors. The overall results indicated that phosphorus deficiency due to simultaneous
precipitation may be detrimental to autotrophic nitrifying bacteria which require enough
phosphorus for cell growth. It should be noted that phosphorus limitation can occur when the
concentration of phosphorus is in the range of 0.1 to 0.3 gP.m-3 (Metcalf & Eddy, 2004).
However, the adverse effects caused by lower P concentrations were avoided in the model by
increasing the value of the autotrophic saturation coefficient for phosphate (Kp) from 0.01 to
0.001 gP.m-3. This could explain the necessity to control the level of bioreactor phosphate
29
concentrations to reduce the extent to which biological processes may be inhibited under
conditions of low bioreactor phosphate concentrations.
Figure 9 – Dynamic simulations of ammonia nitrogen in the treatment plant outflow for
Scenarios 1 - 3.
3.4.2 Impact of controlling iron salt (FeSO4 & FeCl3) dosing
The impact of imposing a basic control and operational strategy for maintaining the
concentration of phosphate below the required future standard was carried out for
demonstration purposes. As shown in Scenario 1, when the pilot plant model was simulated
under dynamic conditions with constant feed of FeSO4 (aerobic tank) and FeCl3 (MBR
tanks), the effluent phosphorus concentration varied considerably due to fluctuations in the
flow and load. Based on open-loop simulation results, the pilot plant could not consistently
meet the effluent standards. In other words, if PO4 in the effluent is not controlled, its content
will easily drift out of the acceptable performance range. Furthermore, in some instances,
when the concentrations of P were low in the influent, this led to very low concentrations
30
(below 0.15 gP.m-3) in the effluent, which indicated that dosing could be unnecessary under
such conditions. Consequently, a simultaneous precipitation control scheme was deemed
necessary and was implemented to maintain the PO4 concentration in the effluent at 0.15
gP.m-3 using a PI controller to adjust the dosage of FeCl3 to the membranes. In addition,
FeSO4 addition to the second aerobic tank was controlled towards a set point of 0.2 gP.m-3 in
the effluent. The PO4 sensor and actuator were modelled without noise or delay, their
performances were assumed to be ideal.
The results in Figure 7 (Scenario 3) indicate that the implemented PO4 strategy enabled the
plant to reach P effluent concentrations of about 0.15 gP.m-3 as stipulated by the future
effluent quality standard, while at the same time making sure that the coagulants were only
added when required. However, it should be pointed out that higher amounts of Fe salts were
required with PO4 controllers. For example, when the sensor for FeSO4 dosage was at the
same location (effluent) as the one for FeCl3 dosage, the simulation indicates that only the
FeCl3 controller with the lowest set point (0.15gP.m-3) was working. Moving the location of
the FeSO4 controller before the pre-anoxic tank led to a reduction of iron coagulant by 15%
since both controllers were working as per set criteria. Controlling Fe salts dosing also
provides additional benefits of maintaining optimal conditions for nitrification/denitrification
processes. Previous studies have shown that biological nutrient removal mechanisms function
less well in the presence of chemical precipitation under conditions where the P concentration
in the activated sludge is low and potentially limiting (Philips et al., 2015). In other words,
the chemical precipitation mechanism limits the extent to which biological nutrient removal
potential can be utilised by removing other nutrients in the system. This could be an
indication of limiting P conditions where denitrifying microorganisms have been depressed
or deprived of essential growth nutrients. Such conditions with low P may be prevalent in
WWTPs with MBRs and chemical P removal, such as the pilot-scale plant under study,
designed to reach very low effluent P content. Therefore, it is recommended to control the
addition of iron salts. When the P controllers are maintained at their set points by closed-loop
control, the WWTP will achieve lower P values in the effluent.
3.4.3 Impact of iron dosing location
To maximize the removal of phosphorus in the presence of iron salts, different iron dosing
locations including the aerobic tank, anoxic tank and RAS/DEOX stream were investigated.
Given that the dissolved oxygen content of the RAS/DEOX stream from the MBRs is high
31
and can have impact on the denitrification process in the anoxic tank, simulations were used
to analyse whether adding Fe(II) salts in this location could provide additional benefits in
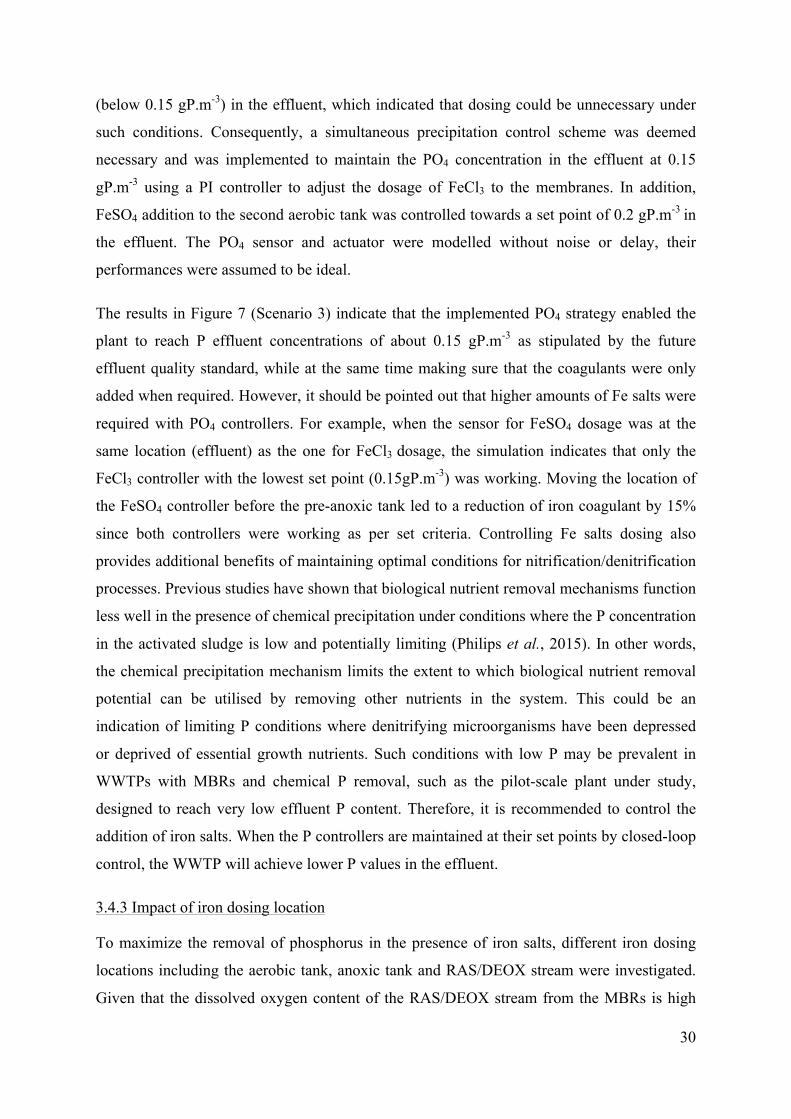
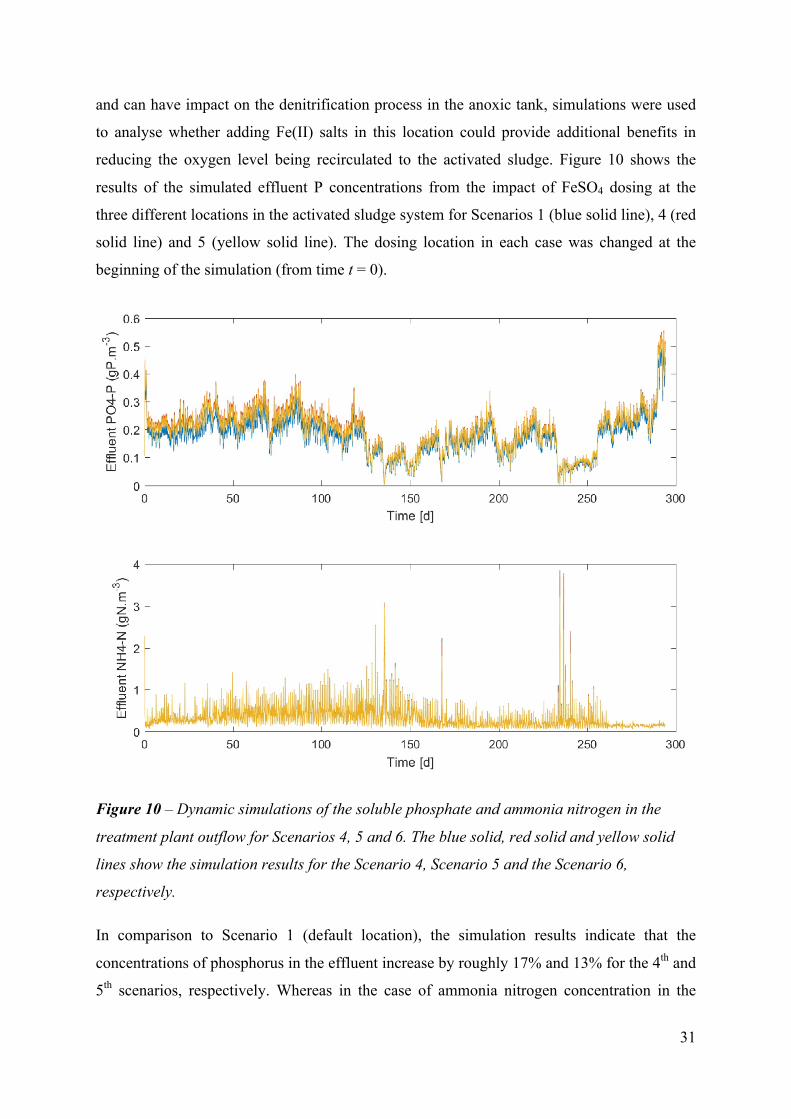
reducing the oxygen level being recirculated to the activated sludge. Figure 10 shows the
results of the simulated effluent P concentrations from the impact of FeSO4 dosing at the
three different locations in the activated sludge system for Scenarios 1 (blue solid line), 4 (red
solid line) and 5 (yellow solid line). The dosing location in each case was changed at the
beginning of the simulation (from time t = 0).
Figure 10 – Dynamic simulations of the soluble phosphate and ammonia nitrogen in the
treatment plant outflow for Scenarios 4, 5 and 6. The blue solid, red solid and yellow solid
lines show the simulation results for the Scenario 4, Scenario 5 and the Scenario 6,
respectively.
In comparison to Scenario 1 (default location), the simulation results indicate that the
concentrations of phosphorus in the effluent increase by roughly 17% and 13% for the 4th and
5th scenarios, respectively. Whereas in the case of ammonia nitrogen concentration in the
32
effluent, the reduction is small: 0.96% in the 4th scenario and 1.8% in the 5th scenario. The
decrease of nitrate in the effluent in the fifth scenario is due to the decreased contribution of
RAS/DEOX oxygen entering the anoxic tank. In general, the results show that iron addition
at these locations have a very slight impact on phosphorus removal performance. The
implication would be that FeSO4 dosing should be fed at an aeration stage in the activated
sludge process, where there is good mixing. When dosed prior to the aeration tank, ferrous
salts will dissolve and then some of the resulting Fe2+ will be oxidized to ferric iron by nitrate
(anoxic zone), whereas the remaining will undergo oxidation in the aerobic zone.
3.5 Model performance and limitations
The overall results of this study demonstrate the usefulness of a plant-wide model
incorporating iron transformation and precipitation. Such a model provides mechanistic
analysis of phosphorous transport and partitioning and could be used to develop control
strategies to optimize simultaneous precipitation while maximizing the nutrient removal.
However, it should be pointed out that the application of an activated sludge model combined
with chemical P removal requires fully characterised and adequately fractionated COD
components and additional influent characterization of soluble chemical components,
particularly iron species, to incorporate in the physico-chemical module. The pilot plant
under study only carries out limited routine measurements, which also include very limited
measurements of soluble chemical components. To increase the accuracy of predicting
simultaneous precipitation, it would be essential to perform additional measurements to cover
all the relevant components, including iron speciation, that play a significant role in
modelling simultaneous precipitation. The timing of the project did not allow a systematic
measurement campaign to be carried out due to summer holidays. However, if the proposed
plant-wide model is to be used for process performance and optimization for chemical
dosing, adequate influent characterization will be required.
While the concentrations of Fe(II) and Fe(III) were not measured as part of routine
measurements, underlying assumptions of chemical P removal in the model shed light
through the simulations. When iron sulphate was added to the aerobic tank, the majority of
ferrous iron was oxidized and converted to insoluble HFO due to abundance of dissolved
oxygen (DO > 2.0 g.m-3). Removal of P through direct precipitation of vivianite
(Fe3(PO4)2·8H2O) appears very unlikely at the minimum Fe(II) concentration since the
driving force for forming this ferrous phosphate mineral is very low. Furthermore, higher DO
33
levels (above 4 g.m-3) in the return activated sludge due higher aeration in the membrane
tanks would likely hamper the formation of any ferrous phosphate in MBRs. In prevailing
aerobic conditions, the precipitation of vivianite appears to be very slow and likely restricted
to anaerobic pockets (Wu et al., 2015). As a result, the addition of Fe(II) salts to either an
anoxic or aerobic zone should facilitate the formation of HFO precipitates and FePO4, and
remove phosphates in the mixed liquor. However, this assumption is in contrast to other
studies, which have hypothesized vivianite as a possible route for phosphorus removal in
activated sludge (Frossard et al., 1997; Wilfert et al., 2016). In this respect, to describe
reliably the movements and cycling of iron precipitates, iron-phosphorus speciation tests
should be carried out in the sludge for the pilot-plant under study with prevailing oxidizing
conditions, which have likely favoured the formation of Fe(III)–phosphorus minerals.
The model analysis focused quite extensively on the fate of iron and phosphorus in the
activated sludge system. However, it should be pointed out that the plant-wide model used
included a sludge treatment train which consisted of sludge thickening, digestion and
dewatering. During anaerobic digestion of waste activated sludge, the iron is released as a
result of iron phosphate dissolution leading to its increased soluble concentration of iron.
Sludge digestion also releases sulphide due to sulphate reduction and the degradation of
sulphur-containing organics (Batstone et al., 2002). The released sulphide will preferentially
bind with iron to form iron sulphide minerals leading to low concentration of dissolved
sulphide and hence reduced H2S concentration in the gas phase (Ge et al., 2013).
34
4 Conclusions
The present study has demonstrated that an integrated model (ASM2d, ADM1, physico-
chemical model) is suitable to model biological nutrient and chemical P removal
precipitation. In the physico-chemical framework, fast reactions in the aqueous phase were
modelled using equilibrium thermodynamics, while time-dependent reactions (such as
precipitation) were modelled using dedicated kinetic rate laws. The integrated model had the
least level of complexity but gave reasonable results with pilot-scale data. The following
were key modelling outcomes:
1) Despite limited operational and routine pilot-scale data, the plant-wide model was
able to replicate with acceptable accuracy the trends in effluent soluble ammonia and
phosphate, suspended solids and other variables under steady state and dynamic
conditions. Simultaneous precipitation was the main mechanism that removed
phosphorus during wastewater treatment.
2) The amount and types of existing iron mineral phases present in the mixed liquor was
one of the most influential factors for precipitation reactions. In a system without bio-
P process, phosphorus removal is a result of P adsorption and co-precipitation through
the accumulated HFO, as well as a competing reaction of iron phosphate. Ferric iron
precipitates originated from ferrous iron oxidation in wastewater affect the removal of
P in the activated sludge system and impact the cycling of P in wastewater treatment
within a plant-wide framework.
3) The simulations confirmed that the modelling approach was valid, particularly the
dependency on pH, which showed a strong effect. The ratio of Fe/P was also
identified as an influential factor that (where possible) should be set based on the
effluent P target. At higher ratios, lower P concentrations are expected in the influent.
However, when the P concentration in the mixed liquor is very low, increasing the
ratio does not translate linearly in further removal of P.
4) The dosing point of FeSO4 in the activated sludge system was analysed for three
different locations: aerobic, anoxic and RAS/DEOX tanks. Feeding at the aerobic tank
had a slightly higher effect on the chemical P removal; consequently, this location is
preferable due to high DO and good mixing conditions that could maximize the
formation of HFO particulates and iron phosphate.
35
5 Recommendations: operational and control strategies
The modelling results in this study suggest that current pilot-plant work has shown that
effective nutrient removal can be achieved in a conventional activated system with membrane
bioreactors and chemical P removal. The model was able to predict nitrification, as indicated
by the effluent total and ammonia nitrogen concentrations consistently below 6 and 2 gN.m-3,
respectively. On other hand, chemical phosphorus removal reduced effluent total phosphorus
values to well below 0.15 mg/L. Modelling experience of the pilot-plant in this study suggest
the following recommendations to achieve effective P removal:
1) Chemical precipitation takes place through fresh iron precipitates, which are
amorphous, metastable and their transformation into more stable phases during aging
results in P removal. The pH, Fe/P molar ratio and sludge age in the wastewater
treatment affect the aging of the iron-precipitates; these factors should be monitored
for effective P removal.
2) The most appropriate dosing point of FeSO4 is in an aerated zone where the Fe(II)
oxidation is more efficient.
3) Since iron salts are added in the pilot-system, controlling FeSO4 and FeCl3 is essential
for optimal P removal while at the same time avoiding overdosing during periods
when influent P is very low or when the effluent quality is below 0.15 gP.m-3. This
aspect is also important for suitable biological processes, such as nitrification, which
require P for microbial metabolism.
4) Sensors for controlling FeSO4 addition should be placed before the point where FeCl3
is dosed, whereas the sensor for the latter should be located at the effluent.
5) Prior knowledge was used to identify phosphorus-containing precipitates that would
form under the operating conditions of the pilot-plant. Given that influent
characteristics may affect the formation or inhibition of some of these minerals,
experimentally-based techniques, e.g. X-ray diffraction (XRD) and Mössbauer
spectroscopy as used in Wilfert et al. (2016), may be required in order to provide
improved characterization of the iron-precipitates in the activated sludge.
36
References
APHA (2012). Standard methods for the examination of water and wastewater, American Public Health Association, Washington, USA.
Andersson, S., Ek, P., Berg, M., Grundestam, J., & Lindblom, E. (2016). Extension of two large wastewater treatment plants in Stockholm using membrane technology. Water Practice and Technology, 11(4), 744-753.
Bligh, M.W., Maheshwari, P., & David Waite, T. (2017). Formation, reactivity and aging of amorphous ferric oxides in the presence of model and membrane bioreactor derived organics, Water Research, 124, 341-352.
Henze, M., Harremoes, P., la Cour Jansen, J., & Arvin, E. (2002). Wastewater Treatment: Biological and Chemical Processes. Springer, Berlin, Germany.
Batstone, D.J., Keller, J., Kalyuzhnyi, S.V., Pavlostathis, S.G., Rozzi, A., Sanders, W.T.M., Siegrist, H., & Vavilin, V.A. (2002). Anaerobic Digestion Model No. 1, IWA Publishing, London, UK.
Daigger, G.T., Crawford, G.V., & Johnson, B.R. (2010). Full-scale assessment of the nutrient removal capabilities of membrane bioreactors. Water Environment Research, 82(9), 806-818.
De Haas, D.W., Wentzel, M.C., & Ekama, G.A. (2001). The use of simultaneous chemical precipitation in modified activated sludge systems exhibiting biological excess phosphate removal: Part 5: Experimental periods using a ferrous-ferric chloride blend. Water SA, 27(2), 117-134.
De Haas, D.W., Ekama, G.A., & Wentzel, M.C. (2000a). The use of simultaneous chemical precipitation in modified activated sludge systems exhibiting biological excess phosphate removal – Part 1: Literature review. Water SA, 26(4), 439-452.
De Haas, D.W., Ekama, G.A., & Wentzel, M.C. (2000b). The use of simultaneous chemical precipitation in modified activated sludge systems exhibiting biological excess phosphate removal – Part 4: Experimental periods using ferric chloride. Water SA, 26(4), 485-504.
Ekama, G.A. (2010). The role and control of sludge age in biological nutrient removal activated sludge systems. Water Science and Technology, 61(7), 1645-1652.
EPA (Environmental Protection Agency) (2010). Nutrient Control Design Manual, State of Technology. The Cadmus Group Inc., USA.
Flores-Alsina, X., Kazadi Mbamba, C., Solon, K., Vrecko, D., Tait, S., Batstone, D.J., Jeppsson, U., & Gernaey, K.V. (2015). A plant-wide aqueous phase chemistry module describing pH variations and ion speciation/pairing in wastewater treatment process models. Water Research, 85, 255-265.
Flores-Alsina, X., Solon, K., Kazadi Mbamba, C., Tait, S., Gernaey, K.V., Jeppsson, U., & Batstone, D.J. (2016). Modelling phosphorus (P), sulfur (S) and iron (Fe) interactions during dynamic simulations of anaerobic digestion processes. Water Research, 95, 370-382.
Frossard, E., Bauer, J.P., & Lothe, F. (1997). Evidence of vivianite in FeSO4-flocculated sludges. Water Research, 31(10), 2449-2454.
37
Ge, H., Zhang, L., Batstone, D., Keller, J., & Yuan, Z. (2013). Impact of iron salt dosage to sewers on downstream anaerobic sludge digesters: Sulfide control and methane production. Journal of Environmental Engineering, 139(4), 594-601.
Gernaey, K.V., Flores-Alsina, X., Rosen, C., Benedetti, L., & Jeppsson, U. (2011). Dynamic influent pollutant disturbance scenario generation using a phenomenological modelling approach. Environmental Modelling & Software, 26(11), 1255-1267.
Gernaey, K.V., Jeppsson, U., Vanrolleghem, P.A., & Copp, J.B. (2014). Benchmarking of control strategies for wastewater treatment plants, IWA Publishing, London, UK.
Grady Jr, C.L., Daigger, G.T., Love, N.G., & Filipe, C.D. (2011). Biological wastewater treatment, CRC Press, Boca Raton, USA.
Gustafsson, J.P. (2015). Visual MINTEQ version 3.1, beta, Available at http://vminteq.lwr.kth.se/download/.
Hauduc, H., Takács, I., Smith, S., Szabo, A., Murthy, S., Daigger, G.T., & Spérandio, M. (2015). A dynamic physicochemical model for chemical phosphorus removal. Water Research, 73, 157-170.
Henze, M., Gujer, W., Mino, T., & van Loosdrecht, M.C.M. (2000). Activated sludge models ASM1, ASM2, ASM2d and ASM3. IWA Publishing, London, UK.
Henze, M., Gujer, W., Mino, T., Matsuo, T., Wentzel, M., & Marais, G.v.R. (1995). Wastewater and biomass characterization for the Activated Sludge Model No. 2: Biological phosphorus removal. Water Science and Technology, 31(2), 13-23.
Henze, M., Harremoes, P., Cour Jansen, J. la, & Arvin, E. (2002). Wastewater Treatment: Biological and Chemical Processes. Springer, Berlin, Germany.
Jeppsson, U., Pons, M.N., Nopens, I., Alex, J., Copp, J.B., Gernaey, K.V., Rosen, C., Steyer, J.P., & Vanrolleghem, P.A. (2007). Benchmark Simulation Model No 2: General protocol and exploratory case studies. Water Science and Technology, 56(8), 67-78.
Jiang, T., Myngheer, S., De Pauw, D.J.W., Spanjers, H., Nopens, I., Kennedy, M.D., Amy, G. & Vanrolleghem P.A. (2008). Modelling the production and degradation of soluble microbial products (SMP) in membrane bioreactors (MBR). Water Research, 42, 4955–4964.
Judd, S. (2008). The status of membrane bioreactor technology. Trends in Biotechnology, 26(2), 109-116.
Kazadi Mbamba, C., Batstone, D.J., Flores-Alsina, X., & Tait, S. (2015a). A generalised chemical precipitation modelling approach in wastewater treatment applied to calcite. Water Research, 68, 342-353.
Kazadi Mbamba, C., Tait, S., Flores-Alsina, X., & Batstone, D.J. (2015b). A systematic study of multiple minerals precipitation modelling in wastewater treatment. Water Research, 85, 359-370.
Kazadi Mbamba, K., Flores-Alsina, X., Batstone, D.J., & Tait, S. (2016). Validation of a plant-wide phosphorus modelling approach with minerals precipitation in a full-scale WWTP. Water Research, 100, 169-183.
38
Mamais, D., Jenkins, D., & Pitt, P. (1993). A rapid physical-chemical method for the determination of readily biodegradable soluble COD in municipal wastewater. Water Research, 27(1), 195-197.
Metcalf & Eddy (2004). Wastewater Engineering: Treatment and Reuse (Tchobanoglous, G., Burton, F. and Stensel, H. D., Eds., 4th ed.). Boston: McGraw-Hill, USA.
Otterpohl, R., & Freund, M. (1992). Dynamic models for clarifiers of activated sludge plants with dry and wet weather flows. Water Science and Technology, 26(5-6), 1391-1400.
Philips, S., Rabaey, K., & Verstraete, W. (2003). Impact of iron salts on activated sludge and interaction with nitrite or nitrate. Bioresource Technology, 88(3), 229-239.
Siegrist, H., & Tschui, M. (1992). Interpretation of experimental data with regard to the activated sludge model no. 1 and calibration of the model for municipal wastewater treatment plants. Water Science and Technology, 25(6), 167-183.
Solon, K., Flores-Alsina, X., Mbamba, C.K., Ikumi, D., Volcke, E.I.P., Vaneeckhaute, C., Ekama, G., Vanrolleghem, P.A., Batstone, D.J., Gernaey, K.V., & Jeppsson, U. (2017). Plant-wide modelling of phosphorus transformations in wastewater treatment systems: Impacts of control and operational strategies. Water Research, 113, 97-110.
Wang, Y., Tng, K.H., Wu, H., Leslie, G., & Waite, T.D. (2014). Removal of phosphorus from wastewaters using ferrous salts – A pilot scale membrane bioreactor study. Water Research, 57, 140-150.
Wilfert, P., Mandalidis, A., Dugulan, A.I., Goubitz, K., Korving, L., Temmink, H, Witkamp, G.J., & van Loosdrecht, M.C.M. (2016). Vivianite as an important iron phosphate precipitate in sewage treatment plants. Water Research, 104, 449-460.
Wu, H., Ikeda-Ohno, A., Wang, Y., & Waite, T.D. (2015). Iron and phosphorus speciation in Fe-conditioned membrane bioreactor activated sludge. Water Research, 76, 213-226.
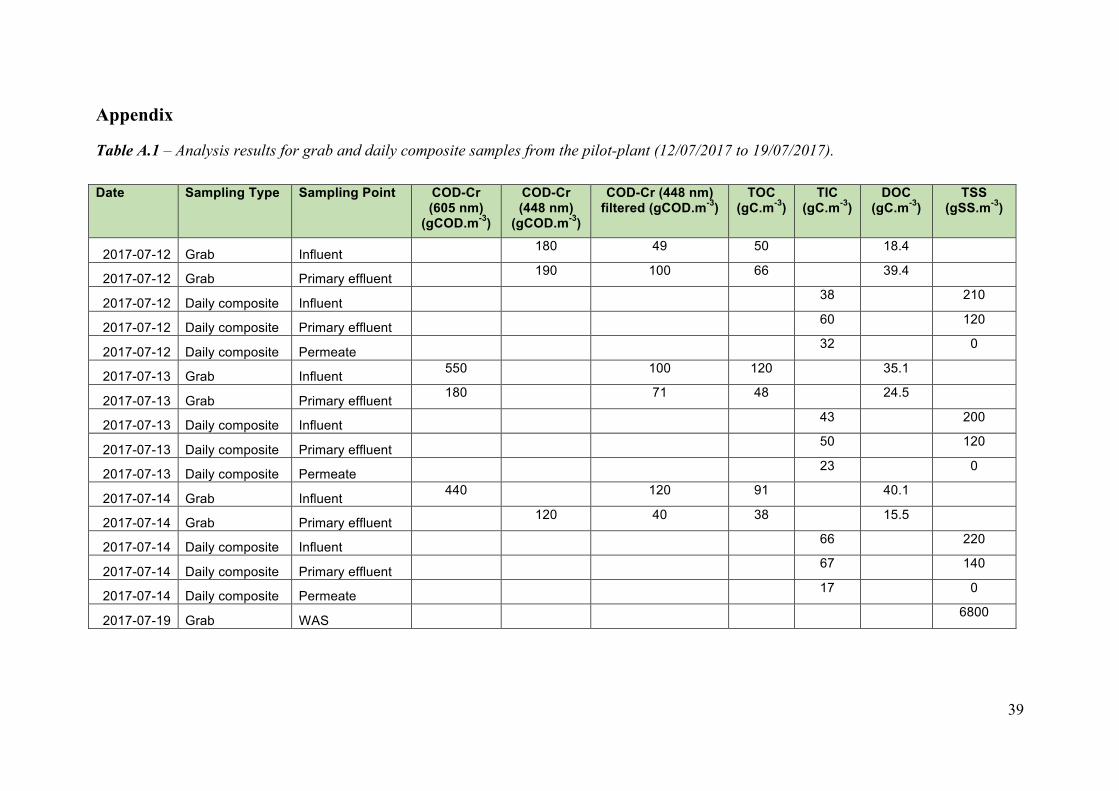
39
Appendix
Table A.1 – Analysis results for grab and daily composite samples from the pilot-plant (12/07/2017 to 19/07/2017).
Date Sampling Type Sampling Point COD-Cr (605 nm)
(gCOD.m-3)
COD-Cr (448 nm)
(gCOD.m-3)
COD-Cr (448 nm) filtered (gCOD.m-3)
TOC (gC.m-3)
TIC (gC.m-3)
DOC (gC.m-3)
TSS (gSS.m-3)
2017-07-12 Grab Influent 180 49 50 18.4
2017-07-12 Grab Primary effluent 190 100 66 39.4
2017-07-12 Daily composite Influent 38 210
2017-07-12 Daily composite Primary effluent 60 120
2017-07-12 Daily composite Permeate 32 0
2017-07-13 Grab Influent 550 100 120 35.1
2017-07-13 Grab Primary effluent 180 71 48 24.5
2017-07-13 Daily composite Influent 43 200
2017-07-13 Daily composite Primary effluent 50 120
2017-07-13 Daily composite Permeate 23 0
2017-07-14 Grab Influent 440 120 91 40.1
2017-07-14 Grab Primary effluent 120 40 38 15.5
2017-07-14 Daily composite Influent 66 220
2017-07-14 Daily composite Primary effluent 67 140
2017-07-14 Daily composite Permeate 17 0
2017-07-19 Grab WAS 6800
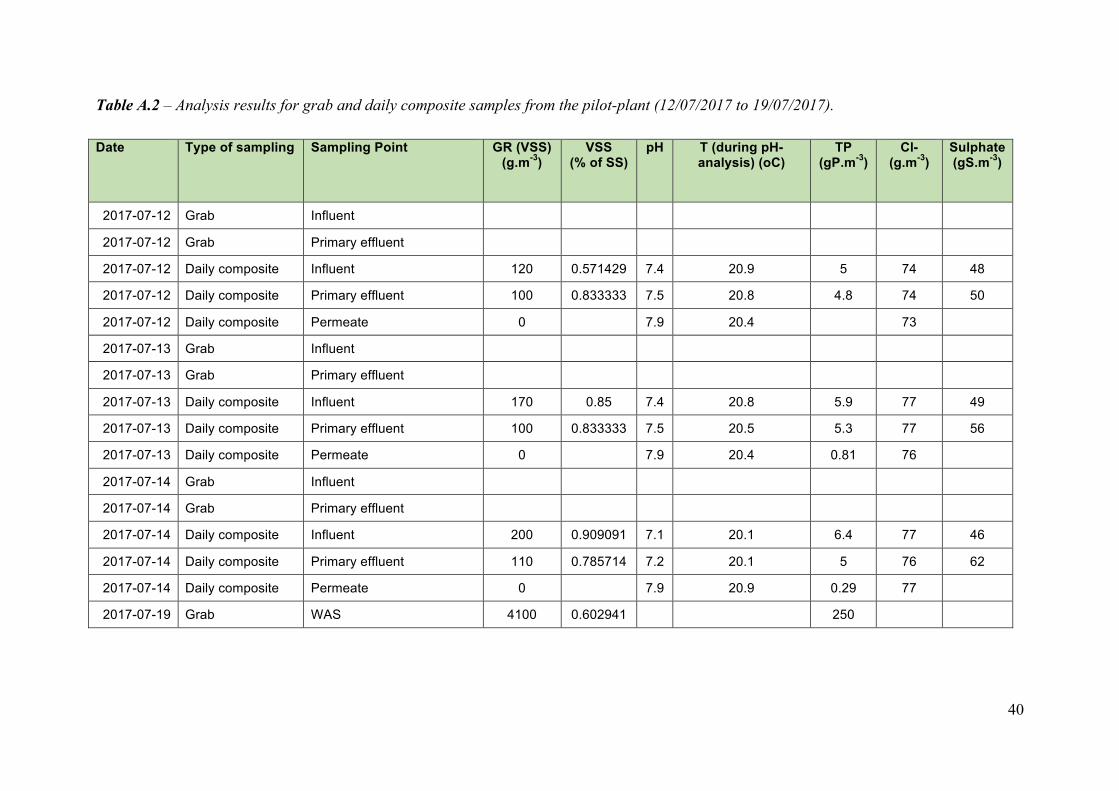
40
Table A.2 – Analysis results for grab and daily composite samples from the pilot-plant (12/07/2017 to 19/07/2017).
Date Type of sampling Sampling Point GR (VSS) (g.m-3)
VSS (% of SS)
pH T (during pH-analysis) (oC)
TP (gP.m-3)
Cl- (g.m-3)
Sulphate (gS.m-3)
2017-07-12 Grab Influent
2017-07-12 Grab Primary effluent
2017-07-12 Daily composite Influent 120 0.571429 7.4 20.9 5 74 48
2017-07-12 Daily composite Primary effluent 100 0.833333 7.5 20.8 4.8 74 50
2017-07-12 Daily composite Permeate 0 7.9 20.4 73
2017-07-13 Grab Influent
2017-07-13 Grab Primary effluent
2017-07-13 Daily composite Influent 170 0.85 7.4 20.8 5.9 77 49
2017-07-13 Daily composite Primary effluent 100 0.833333 7.5 20.5 5.3 77 56
2017-07-13 Daily composite Permeate 0 7.9 20.4 0.81 76
2017-07-14 Grab Influent
2017-07-14 Grab Primary effluent
2017-07-14 Daily composite Influent 200 0.909091 7.1 20.1 6.4 77 46
2017-07-14 Daily composite Primary effluent 110 0.785714 7.2 20.1 5 76 62
2017-07-14 Daily composite Permeate 0 7.9 20.9 0.29 77
2017-07-19 Grab WAS 4100 0.602941 250
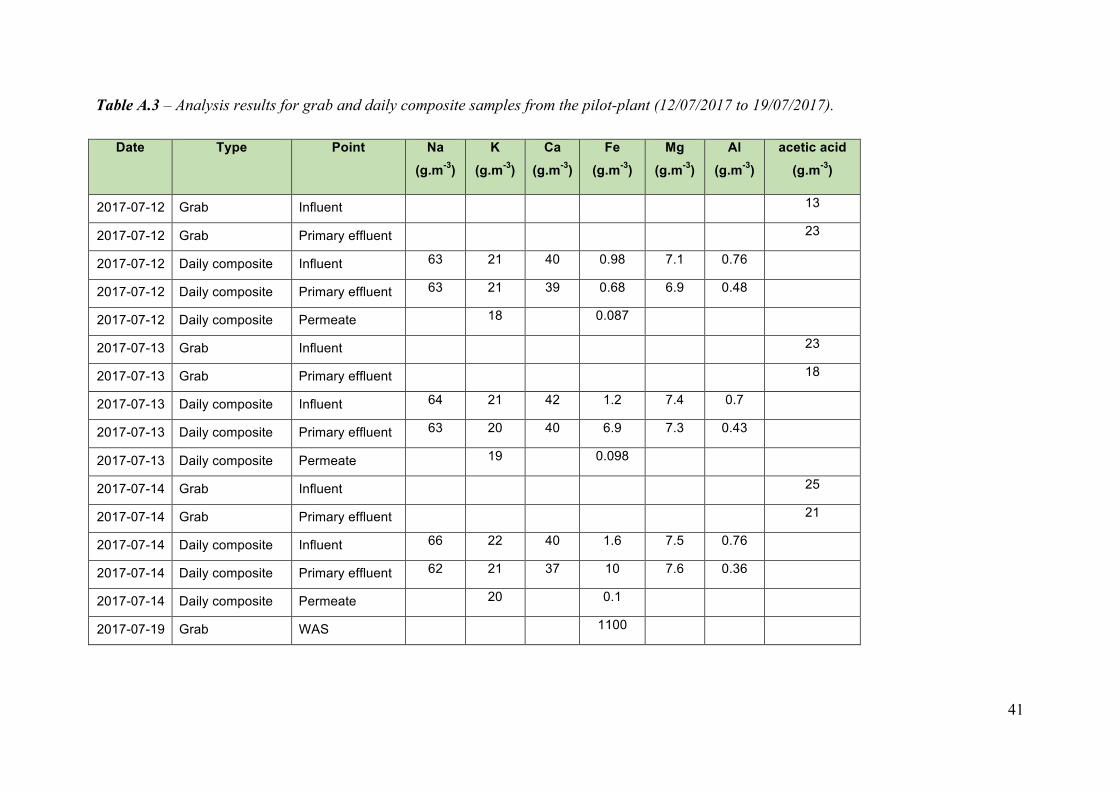
41
Table A.3 – Analysis results for grab and daily composite samples from the pilot-plant (12/07/2017 to 19/07/2017).
Date Type Point Na
(g.m-3)
K
(g.m-3)
Ca
(g.m-3)
Fe
(g.m-3)
Mg
(g.m-3)
Al
(g.m-3)
acetic acid
(g.m-3)
2017-07-12 Grab Influent 13
2017-07-12 Grab Primary effluent 23
2017-07-12 Daily composite Influent 63 21 40 0.98 7.1 0.76
2017-07-12 Daily composite Primary effluent 63 21 39 0.68 6.9 0.48
2017-07-12 Daily composite Permeate 18 0.087
2017-07-13 Grab Influent 23
2017-07-13 Grab Primary effluent 18
2017-07-13 Daily composite Influent 64 21 42 1.2 7.4 0.7
2017-07-13 Daily composite Primary effluent 63 20 40 6.9 7.3 0.43
2017-07-13 Daily composite Permeate 19 0.098
2017-07-14 Grab Influent 25
2017-07-14 Grab Primary effluent 21
2017-07-14 Daily composite Influent 66 22 40 1.6 7.5 0.76
2017-07-14 Daily composite Primary effluent 62 21 37 10 7.6 0.36
2017-07-14 Daily composite Permeate 20 0.1
2017-07-19 Grab WAS 1100