Embed Size (px)
Citation preview
Planted-Tree Inventory Protocol for
Halifax Regional Municipality’s Urban Forest
(ENVI 5508: MREM Final Project Report)
School for Resource and Environmental Studies
Dalhousie University
Chen Shi
12/15/2013

i

ii
Acknowledgements
I would love to thank Peter Duinker, John Charles, and John Simmons for their advice and
support throughout the duration of this project. No matter what country or province they were in,
they were always available to advise me on how to proceed. I would also like to give special
thanks to the entire REM lab and the UFMP team for continuing support in my endeavours.
iii
Table of Contents
1.0 Introduction .................................................................................................................... 1
1.1 Purpose of document ....................................................................................................................... 1
1.2 Why should HRM have a tree inventory protocol? ........................................................................ 1
1.2.1 Halifax Urban Forest: Value-Objective-Indicators-Target (VOIT) Approach .................... 2
1.3 Guiding principles for tree inventory protocol................................................................................ 3
2.0 Use of the HRM tree-inventory protocol ........................................................................ 4
2.1 Necessary pre-existing information ................................................................................................ 4
2.2 Paper versus digital data collection ................................................................................................. 4
2.3 Inventory Equipment....................................................................................................................... 5
2.4 Choosing data collectors and street tree inventory type .................................................................. 6
3.0 Planted-Tree Inventory Protocol .................................................................................... 8
3.1 List of Variables .............................................................................................................................. 8
3.2 Identifying Information ................................................................................................................... 9
3.3 Planting Data ................................................................................................................................. 12
3.4 1st Measurement ............................................................................................................................ 15
3.5 Re-Measurement Variables ........................................................................................................... 18
3.6 Tree Removal ................................................................................................................................ 19
4.0 Reference: ..................................................................................................................... 20
Appendix ............................................................................................................................ 24
Figure 1: Inventory Equipment ........................................................................................................... 24
Figure 2: Trunk Damage Example (variable 10) ................................................................................ 25
Figure 3: Distance to Curb Measurement Example ............................................................................ 26
Figure 4: DBH Ambiguous Situations ................................................................................................ 27
Table 1: Worksheet ............................................................................................................................. 28
Suggestions for Summarizing Data ..................................................................................................... 29
1
1.0 Introduction
1.1 Purpose of document
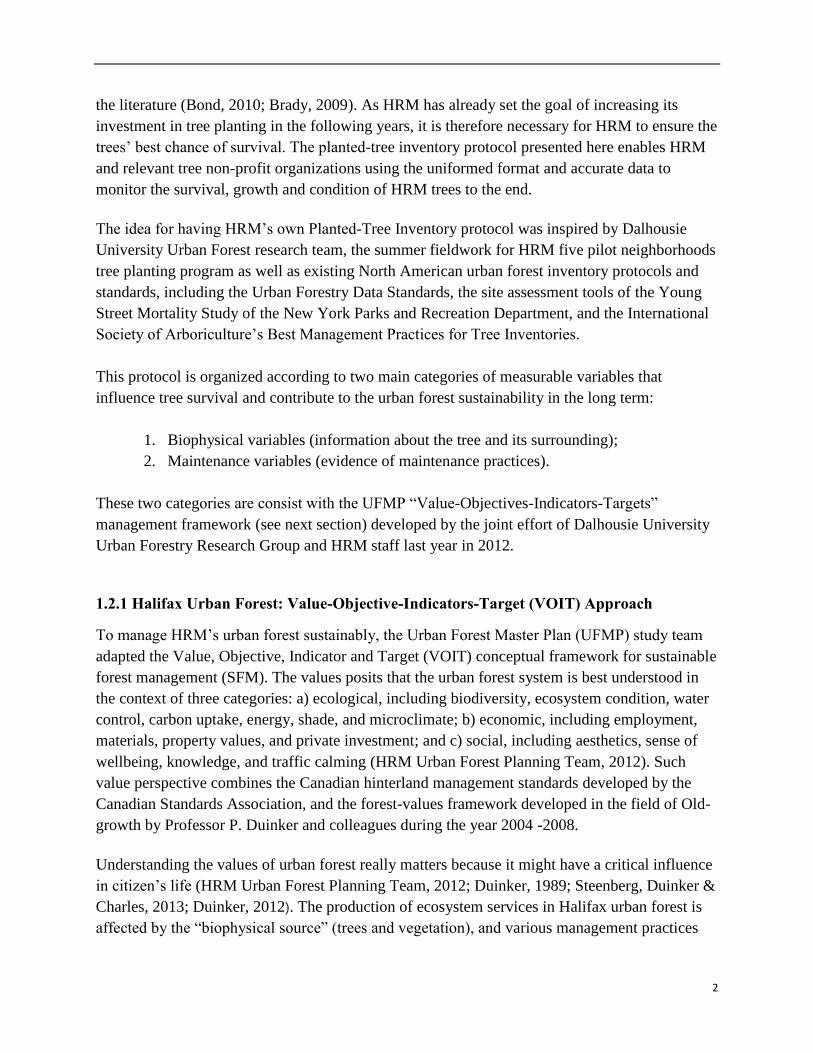
The purpose of this document is to provide a step-by-step guide for Halifax Regional
Municipality (HRM) staff, tree-planting organizations and public citizens on how to assess and
record planted-urban tree survival and mortality. The impetus for this protocol is the HRM pilot
tree-planting program initiated in this summer (May, 2013), which roughly 1000 new trees were
planted in the selected five urban forest neighborhood (Colby Village, Connaught/Quinpool,
Eastern Passage, Fairview and North End Halifax) and measured by Dalhousie University Urban
Forest Team. This protocol includes 27 variables that need to be recorded for a tree, on-site data
worksheet sample and some ideas about data analysis.
1.2 Why should HRM have a tree inventory protocol?
Trees are just as important to a city’s economic health as roads, bridges, water, sewer, electricity
and other services that a city needs to prosper (HRM website, 2013). Therefore, the HRM Urban
Forest Master Plan (UFMP) was made to ensure a sustainable future for our urban forest. The
first year tree-planting program initiated this summer is the first step in implementing the UFMP,
which aim to increase the number of trees in Halifax communities and urban tree canopy cover
(HRM, 2012). Urban forestry, tree-planting nonprofits and cities need to keep records of the
newly planted trees. However, few evidence can prove that HRM and non-profits organizations
in Halifax have a uniform format in recording cities tree, let alone systematically exchange
records to track trees mortality or measure growth rates over time (HRM website, 2013; HRM
Urban Forest Planning Team, 2012). Urban trees can improve quality of citizens’ life, improve
air quality by removing atmospheric carbon dioxide, and reducing feelings of fear and violence
(Duinker, 2012). Determining accurate survival rates of tree-planting programs can help HRM
make sure that trees’ benefits have been maximized and tree-planting resources are utilized to the
best advantage.
According to Ostrom (2007), the ecosystem services provided by urban trees are maximized
when trees survive and grow quickly to maturity. Mature trees in the urban forest provide the
greatest benefits. However, recent researches also show that one of the fundamental challenges
to city managers and civic groups is to ensure the survival of newly planted street trees especially
in places like urban cities (Phillip, Richard & Randolph, 1999; Turner, Lefler & Freedman, 2005;
Ostrom, 2009). Population growth, limited space and building and side walk designs all present
challenges to the contemporary HRM urban trees (HRM Urban Forest Planning Team, 2012).
Yet in order to maximize proven urban forestry benefits (both biophysical and social), trees must
reach maturity. While there is much research on soil regimes, nursery stock, and species
selection, survival rates still vary widely—from 34.7% to 99.7% according to a recent review of
2
the literature (Bond, 2010; Brady, 2009). As HRM has already set the goal of increasing its
investment in tree planting in the following years, it is therefore necessary for HRM to ensure the
trees’ best chance of survival. The planted-tree inventory protocol presented here enables HRM
and relevant tree non-profit organizations using the uniformed format and accurate data to
monitor the survival, growth and condition of HRM trees to the end.
The idea for having HRM’s own Planted-Tree Inventory protocol was inspired by Dalhousie
University Urban Forest research team, the summer fieldwork for HRM five pilot neighborhoods
tree planting program as well as existing North American urban forest inventory protocols and
standards, including the Urban Forestry Data Standards, the site assessment tools of the Young
Street Mortality Study of the New York Parks and Recreation Department, and the International
Society of Arboriculture’s Best Management Practices for Tree Inventories.
This protocol is organized according to two main categories of measurable variables that
influence tree survival and contribute to the urban forest sustainability in the long term:
1. Biophysical variables (information about the tree and its surrounding);
2. Maintenance variables (evidence of maintenance practices).
These two categories are consist with the UFMP “Value-Objectives-Indicators-Targets”
management framework (see next section) developed by the joint effort of Dalhousie University
Urban Forestry Research Group and HRM staff last year in 2012.
1.2.1 Halifax Urban Forest: Value-Objective-Indicators-Target (VOIT) Approach
To manage HRM’s urban forest sustainably, the Urban Forest Master Plan (UFMP) study team
adapted the Value, Objective, Indicator and Target (VOIT) conceptual framework for sustainable
forest management (SFM). The values posits that the urban forest system is best understood in
the context of three categories: a) ecological, including biodiversity, ecosystem condition, water
control, carbon uptake, energy, shade, and microclimate; b) economic, including employment,
materials, property values, and private investment; and c) social, including aesthetics, sense of
wellbeing, knowledge, and traffic calming (HRM Urban Forest Planning Team, 2012). Such
value perspective combines the Canadian hinterland management standards developed by the
Canadian Standards Association, and the forest-values framework developed in the field of Old-
growth by Professor P. Duinker and colleagues during the year 2004 -2008.
Understanding the values of urban forest really matters because it might have a critical influence
in citizen’s life (HRM Urban Forest Planning Team, 2012; Duinker, 1989; Steenberg, Duinker &
Charles, 2013; Duinker, 2012). The production of ecosystem services in Halifax urban forest is
affected by the “biophysical source” (trees and vegetation), and various management practices
3
(economic guidance, formal and informal rules, etc.). In short, the interactions between the
public, the biophysical source and management practices influence the types and magnitude of
ecosystem services (benefits of trees) provided by the urban forest (HRM Urban Forest Planning
Team, 2012).
1.3 Guiding principles for tree inventory protocol
A good tree-inventory protocol should be adaptable to different level of practitioners, yet flexible
for different situations (Street Tree Inventory, n.d.). As one of the summer tree-planting
volunteer’s expressed, “it would be pretty handy if a standardized HRM tree inventory protocol
is written with detailed descriptions and clearly guidance.” Other suggestions were to be
inclusive and involve various ideas, and keep protocol simple for citizens, rather than
“complicated and academic” (Personal communication, 2013). Through literature review and
communication with HRM and Dalhousie University Urban Forest Team, a set of guiding
principles for the development of protocols have being designed as following:
Simplicity: this tree inventory protocol should be straightforward and accessible to
practitioners and managers, and relevant to organizations that rely on interns and
volunteers for data collection.
Flexibility: the data collect by the urban forestry practitioners can be used for a variety of
purposes, so this tree-inventory protocol must be adaptable to different management
needs.
Inclusiveness: to ensure that the tree inventory protocol will be relevant to local arborists,
HRM, non-profit organizations, and other users, the protocol development process will
include suggestions from practitioners.
Reduction of Uncertainty: There must be clear uses for the data gathered from this on-site
fieldwork to answer key research questions about urban tree growth, health, mortality,
and longevity.
Management Relevance: Data collected should be useful for the HRM and local non-
profit organizations to manage urban forest resource and make adaptable changes.
4
2.0 Use of the HRM tree-inventory protocol
This protocol was designed to allow HRM staff, non-profit tree organizations and volunteers to
go to the field and measure their own trees—especially HRM publicly owned trees. Ideally, a re-
measurement of these new trees should occur between 3 and 5 years after first recording
(Altman, 2001; Bond, Jerry & Beth, 2006). This time slot means that the trees should be outside
the establishment phase (typically, 2 years for trees 3-5cm in caliper at planting). Additionally,
the removal information (reason, DBH, site condition and tree health) of the trees should also be
recorded.
2.1 Necessary pre-existing information
In order to record the newly planted or existing trees, it is necessary to have a list of the locations
of the trees at hand before the practitioners start measuring. Planting location is crucial so that
the trees planted by HRM can be found and justified if the trees were not planted in the planned
location. Also, having an original proposed tree planting address at hand can avoid tree
measurement redundancy. It is also recommended that tree address should be numbered in
sequence and marked on printed-paper by Google Earth or Geographic Information System
(GIS) software. Tracking locations by Global Positioning System (GPS) coordinates may also
work but only suggest using it when trees are planted more than 7-8 meters from each other
(“GPS Accuracy performance standard”, 2013).
Knowing the species of trees planted in the filed can also help the practitioners verify the
accuracy of the tree tags. However, species-relevant knowledge is desirable but not necessarily
required for the tree inventory.
2.2 Paper versus digital data collection
As mentioned in the previous section, generate a list of trees planting location and species (if
available) is quite necessary before collectors start measurement. The list can be in the form of a
spreadsheet where each tree is represented by a row of data, or any electronic database to which
collectors can add columns of new, tree-specific information collected in the inventory.
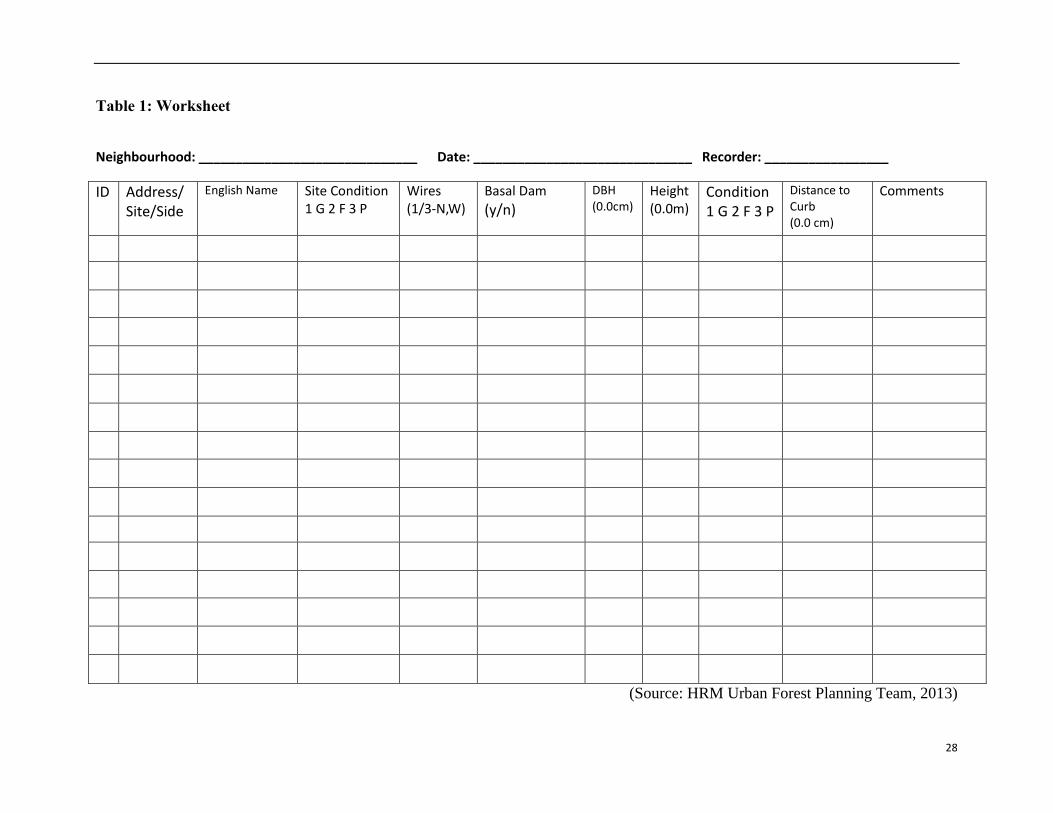
To collect inventory data on paper, the list should be transferred to a form with space for
additional information collected on the categories of variables included in the planted-tree
inventory protocol (See Appendix: worksheet). Data collected on paper should be transferred to a
permanent electronic format (e.g., Microsoft Access) as soon as possible following data
collection to help minimize the risk of losing data (Clark, Nelda & Victoria, 1997; Cristopher &
Geoffrey, 1997). It is highly recommended that electronic data entry should be performed by the
same individual who collected data in the field, as this reduces the risk of misinterpreting
handwriting and increases data accuracy and reliability (American Forests Organization, 2013).
5
Electronic data collection, on the other hand, usually results in greater consistency in the data
and also dramatically reduces processing time after data collection (Bond, Jerry, & Beth, 2006).
Electronic data collection devices can be handled personal digital assistants (PDAs),
smartphones, GPS-based devices, specialized tree inventory devices, and more. Devices can
either be live updating (accessing remotely served data from the cloud) or require data to be
manually downloaded to a computer (USDA, 2002; USDA, 2009). Admittedly, live-updating
devices are more favorable since they enable collection and analysis simultaneously and thus
allow organizations to see the results of inventory instantly.
So far, the collection of tree inventory data in HRM is still in the paper format. However, the
tendency of using low-cost personal digital assistant (PDA) or other similar devices for
collecting data on public and private trees is spreading so fast that HRM managers have already
started considering to buy it in the coming years (HRM website, 2013).
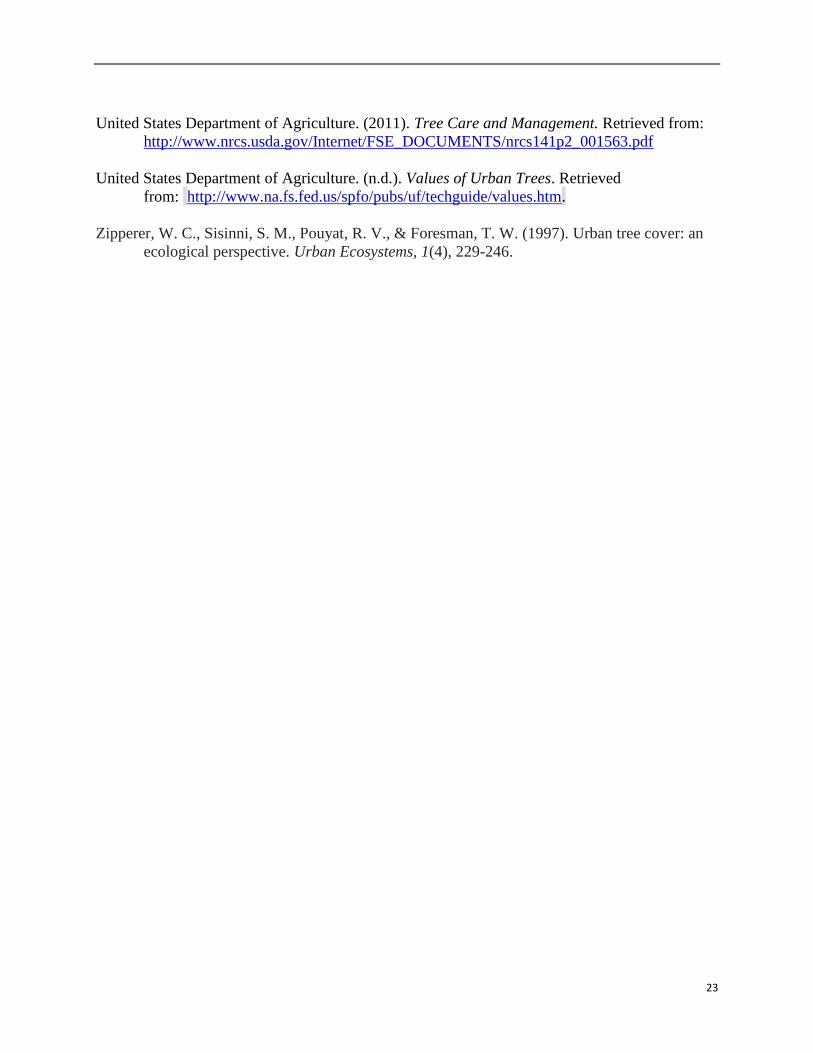
2.3 Inventory Equipment
Must-have equipment
The planted-tree inventory requires the following tools: (Note that each team need one set of the
tools)
Data recording equipment: for paper data collection, there will be need for pencils,
erasers, a clipboard, and enough paper data collection sheets.
Map: tree location maps (both whole view and detailed street view) are necessary and
useful. They can either provided by HRM or self-created by Google Earth. It is highly
recommended to color printed those maps by the past volunteers. In addition, an HRM
map is also necessary.
DBH tape: a DBH tape (also called D-tape) is a specialized measuring tape that is used to
measure the diameter of a cylindrical object by wrapping the tape around the
circumference of the object (Grosenbaugh, 1954). The diameter of a tree is typically
measured at breast height (1.37m). Thus, this measuring tape is also called DBH tape.
The numbers on one side of a DBH tape are already converted to diameter measurements
and the other side of the tape usually has standard metric or English units.
Meter Tape: a 50- or 100- long measuring tape in meters allows the practitioners to
measure small tree height and distance to curb. A meter tape is essential if the data
collection team just measuring the small trees (usually height less than 9 meters).
6
A Tree Identification Book: Nova Scotia has about 30 different species of native trees.
Having a tree identification book when practitioner outside measuring the trees is very
helpful and will help the measurer differentiate the species quicker and better.
Safety Vest: A bright orange, yellow or green safety vest with reflectors is important
when completing an inventory of street trees, boulevard or doing any measurement in
emergency to make sure data collectors are visible to passing vehicles.
Camera: Each tree or item measured should have an associated picture of adequate
resolution. Practitioners don’t have to be a photography expert. All need is to take good
representative pictures. It is not always possible to take a single picture of a tree.
Therefore, just take a picture of as much as possible, the trunk, up along the stem looking
into the canopy showing the limb structure.
Recommended equipment
Backpack: a backpack is useful to keep all equipment in one place and prevent it from
being lost. Backpacks can allow the collectors to carry water bottle or other personal
items during the whole day collection.
GPS units: a global positioning system (GPS) unit that makes measurement as accurate as
needed to determine the location of the tree. GPS capabilities are often incorporated in
other devices, such as smartphone, handheld PDAs, or specialized tree inventory device.
However, note that GPS-enabled devices vary in their accuracy. For instance, some can
identify location only to accuracy of within 10 m (Dwyer & Miller, 1999; Ecology
Action Center, n.d.; GPS Government, 2013). The majority of the trees in HRM are
planted closer together less than 10 meters. Therefore for those areas, the GPS may fail to
identify the tree location. Collectors may need to mark the tree location on printed map
by hand.
2.4 Choosing data collectors and street tree inventory type
This protocol was initially designed for use by HRM staff, Urban Forest Team and public
volunteers with the hope of fairly minimal training in urban forestry. In other words, data
collectors could be individuals from non-profit organization’s volunteer list or tree maintenance
team, interns, or any existing or recruited personnel suitable for the purpose. Through the past
summer experience, the urban forest group recommend that data collectors work in team of two
(P. Duinker, personal communication, June, 2013). Two-person team allows data collectors to
work more efficiently and to consult with one another on qualitative variables. This increases
overall accuracy and reliability. In addition, data collection teams should be trained using this
protocol as a guide or attending the walkabout held by the HRM. Part of the training should be
7
going through several example trees together to reach a consensus on the proper value for each
variable.
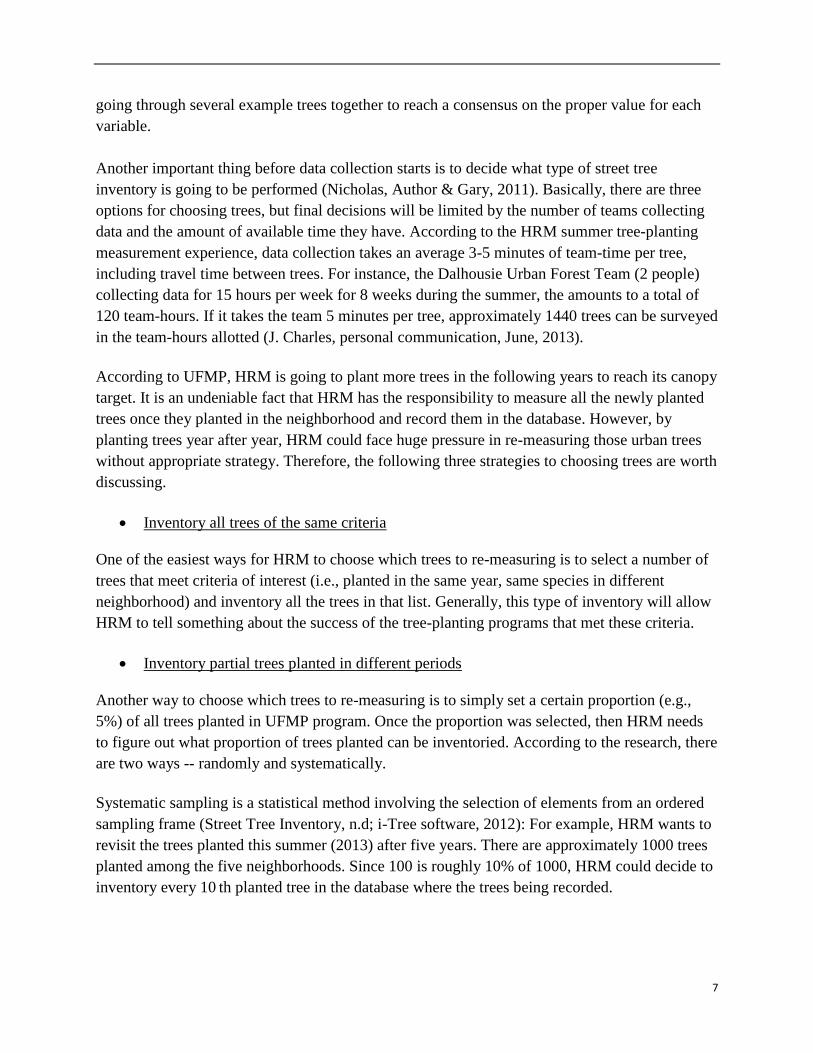
Another important thing before data collection starts is to decide what type of street tree
inventory is going to be performed (Nicholas, Author & Gary, 2011). Basically, there are three
options for choosing trees, but final decisions will be limited by the number of teams collecting
data and the amount of available time they have. According to the HRM summer tree-planting
measurement experience, data collection takes an average 3-5 minutes of team-time per tree,
including travel time between trees. For instance, the Dalhousie Urban Forest Team (2 people)
collecting data for 15 hours per week for 8 weeks during the summer, the amounts to a total of
120 team-hours. If it takes the team 5 minutes per tree, approximately 1440 trees can be surveyed
in the team-hours allotted (J. Charles, personal communication, June, 2013).
According to UFMP, HRM is going to plant more trees in the following years to reach its canopy
target. It is an undeniable fact that HRM has the responsibility to measure all the newly planted
trees once they planted in the neighborhood and record them in the database. However, by
planting trees year after year, HRM could face huge pressure in re-measuring those urban trees
without appropriate strategy. Therefore, the following three strategies to choosing trees are worth
discussing.
Inventory all trees of the same criteria
One of the easiest ways for HRM to choose which trees to re-measuring is to select a number of
trees that meet criteria of interest (i.e., planted in the same year, same species in different
neighborhood) and inventory all the trees in that list. Generally, this type of inventory will allow
HRM to tell something about the success of the tree-planting programs that met these criteria.
Inventory partial trees planted in different periods
Another way to choose which trees to re-measuring is to simply set a certain proportion (e.g.,
5%) of all trees planted in UFMP program. Once the proportion was selected, then HRM needs
to figure out what proportion of trees planted can be inventoried. According to the research, there
are two ways -- randomly and systematically.
Systematic sampling is a statistical method involving the selection of elements from an ordered
sampling frame (Street Tree Inventory, n.d; i-Tree software, 2012): For example, HRM wants to
revisit the trees planted this summer (2013) after five years. There are approximately 1000 trees
planted among the five neighborhoods. Since 100 is roughly 10% of 1000, HRM could decide to
inventory every 10 th planted tree in the database where the trees being recorded.
8
Random sampling, on the other hand, means a sample in which every element in the group has
an equal chance of being selected (i-Tree software, 2012). Using the same example as systematic
sampling, HRM could take the list of trees in the database, use a random number generator to
assign a number 1 through 10 to each tree, randomly select a single number between 1 and 10,
and inventory all the trees with this number.
Partial inventory can be used when the tree numbers are huge and lack of time and volunteer to
re-visit all the trees. This approach can let HRM evaluate the success of periodical planting.
Complete Tree Inventory:
Inventory all the urban trees and planting sites and revisits all of them every 3-5 years in the
HRM urban forest area. This approach needs detailed plan and huge public support but it will
definitely build a strong urban tree community.
Once HRM has chosen which trees to inventory, gathered the volunteers who will collect the
data, and prepared all the inventory equipment, the next step is to use the Planted-Tree Inventory
Protocol to record the HRM urban trees.
3.0 Planted-Tree Inventory Protocol
There are 27 variables covered in this Planted-Tree Inventory protocol. Details of each variable
are explained below. In the left-hand margins next to each variable, there is a boxed number,
which can be used to refer to that variable. Variables explanations are organized as follows: 1)
the first paragraph gives a definition and explanation of the variable and why it is useful; 2) the
second paragraph describes the units and equipment used to measure quantitative variables 3)
Tables or images are provided when necessary.
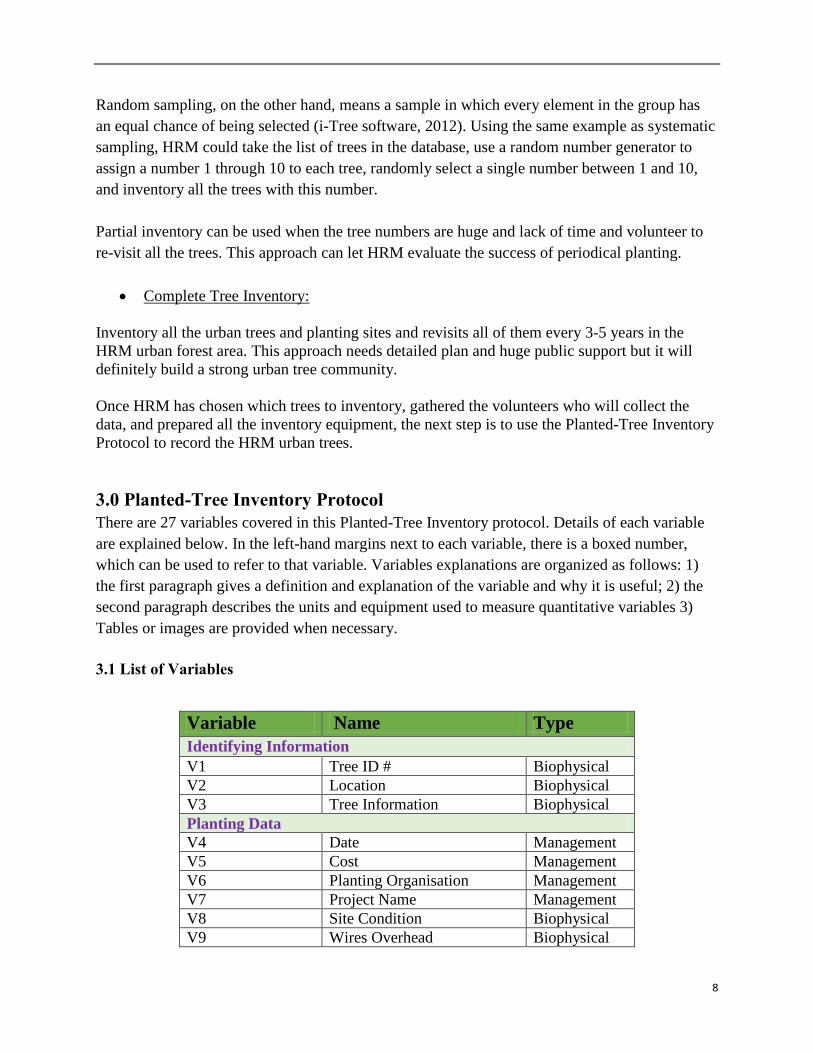
3.1 List of Variables
Variable Name Type
Identifying Information
V1 Tree ID # Biophysical
V2 Location Biophysical
V3 Tree Information Biophysical
Planting Data
V4 Date Management
V5 Cost Management
V6 Planting Organisation Management
V7 Project Name Management
V8 Site Condition Biophysical
V9 Wires Overhead Biophysical
9
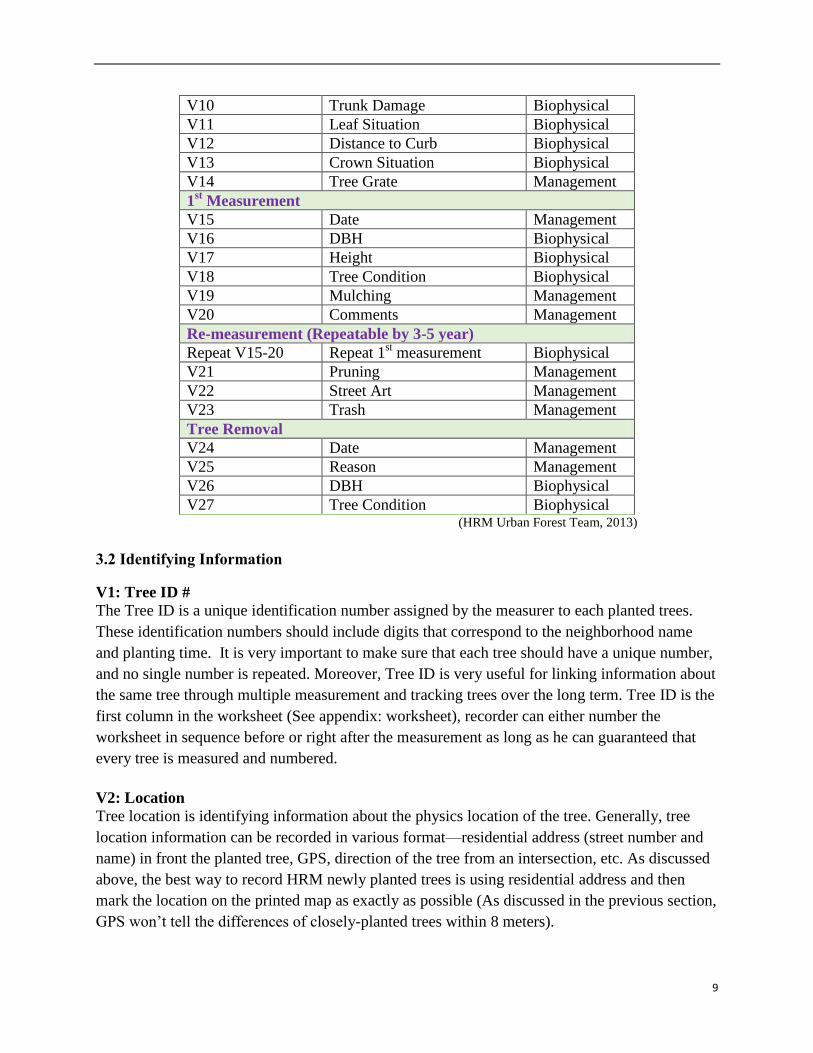
V10 Trunk Damage Biophysical
V11 Leaf Situation Biophysical
V12 Distance to Curb Biophysical
V13 Crown Situation Biophysical
V14 Tree Grate Management
1st Measurement
V15 Date Management
V16 DBH Biophysical
V17 Height Biophysical
V18 Tree Condition Biophysical
V19 Mulching Management
V20 Comments Management
Re-measurement (Repeatable by 3-5 year)
Repeat V15-20 Repeat 1st measurement Biophysical
V21 Pruning Management
V22 Street Art Management
V23 Trash Management
Tree Removal
V24 Date Management
V25 Reason Management
V26 DBH Biophysical
V27 Tree Condition Biophysical (HRM Urban Forest Team, 2013)
3.2 Identifying Information
V1: Tree ID #
The Tree ID is a unique identification number assigned by the measurer to each planted trees.
These identification numbers should include digits that correspond to the neighborhood name
and planting time. It is very important to make sure that each tree should have a unique number,
and no single number is repeated. Moreover, Tree ID is very useful for linking information about
the same tree through multiple measurement and tracking trees over the long term. Tree ID is the
first column in the worksheet (See appendix: worksheet), recorder can either number the
worksheet in sequence before or right after the measurement as long as he can guaranteed that
every tree is measured and numbered.
V2: Location
Tree location is identifying information about the physics location of the tree. Generally, tree
location information can be recorded in various format—residential address (street number and
name) in front the planted tree, GPS, direction of the tree from an intersection, etc. As discussed
above, the best way to record HRM newly planted trees is using residential address and then
mark the location on the printed map as exactly as possible (As discussed in the previous section,
GPS won’t tell the differences of closely-planted trees within 8 meters).
10
In the HRM recording worksheet, location is divided into four columns: neighborhood, street,
site and side. Specifically, column Site has four options when you enter the data: FRONT (if the
tree was planted in front of the house), SIDE (if tree was planted on one side of the house), Back
(if the tree was planted in the back yard of the house) and MIDDLE (if the tree was planted in
the boulevard). The column Side, on the other hand, usually represented in continuously
increasing numbers so that the trees planted in front of the same house can be distinguished.
Moreover, the principle of recording the number is usually starts with 1 (when trees are planted
in front of the same house) and increase one each time follow the direction of the driving way in
front of the house.
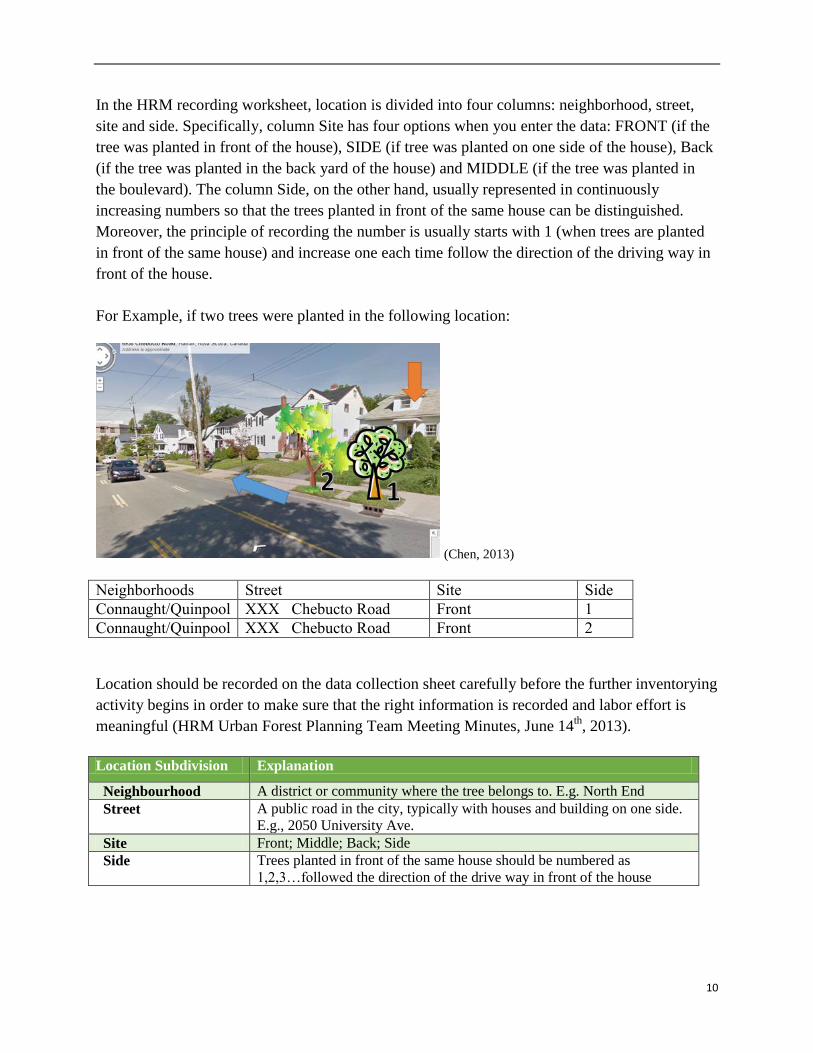
For Example, if two trees were planted in the following location:
(Chen, 2013)
Neighborhoods Street Site Side
Connaught/Quinpool XXX Chebucto Road Front 1
Connaught/Quinpool XXX Chebucto Road Front 2
Location should be recorded on the data collection sheet carefully before the further inventorying
activity begins in order to make sure that the right information is recorded and labor effort is
meaningful (HRM Urban Forest Planning Team Meeting Minutes, June 14th
, 2013).
Location Subdivision Explanation
Neighbourhood A district or community where the tree belongs to. E.g. North End
Street A public road in the city, typically with houses and building on one side.
E.g., 2050 University Ave.
Site Front; Middle; Back; Side
Side Trees planted in front of the same house should be numbered as
1,2,3…followed the direction of the drive way in front of the house
11
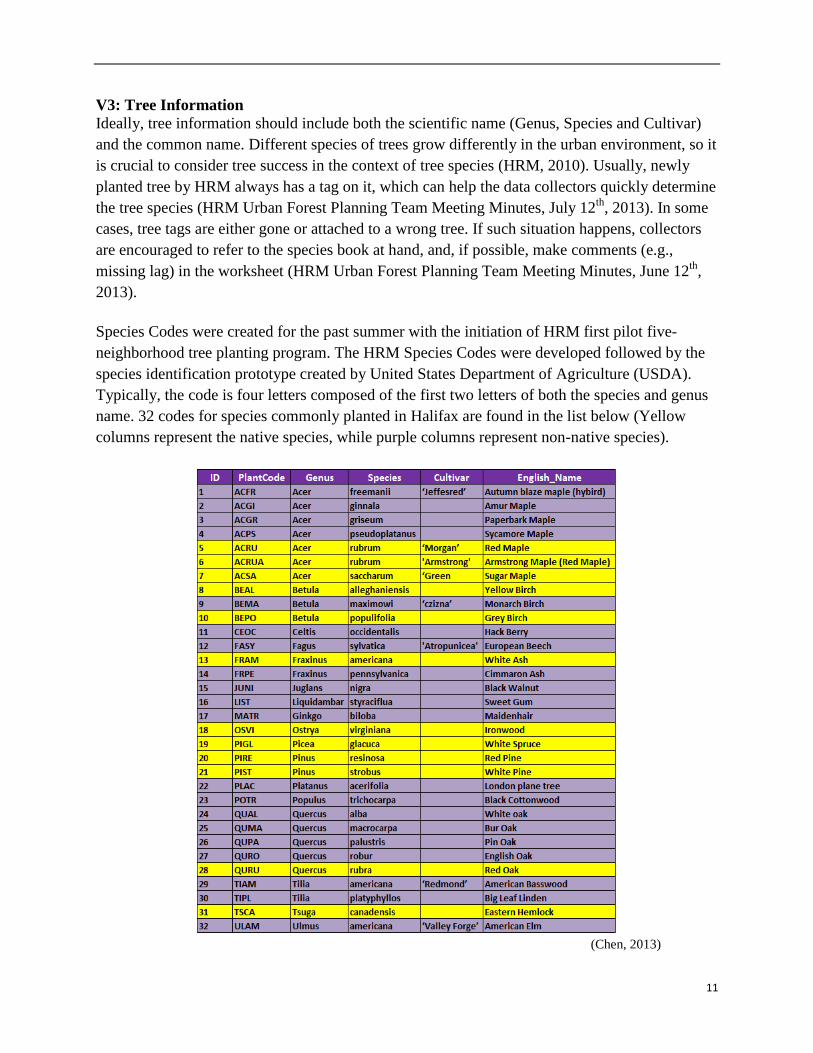
V3: Tree Information
Ideally, tree information should include both the scientific name (Genus, Species and Cultivar)
and the common name. Different species of trees grow differently in the urban environment, so it
is crucial to consider tree success in the context of tree species (HRM, 2010). Usually, newly
planted tree by HRM always has a tag on it, which can help the data collectors quickly determine
the tree species (HRM Urban Forest Planning Team Meeting Minutes, July 12th
, 2013). In some
cases, tree tags are either gone or attached to a wrong tree. If such situation happens, collectors
are encouraged to refer to the species book at hand, and, if possible, make comments (e.g.,
missing lag) in the worksheet (HRM Urban Forest Planning Team Meeting Minutes, June 12th
,
2013).
Species Codes were created for the past summer with the initiation of HRM first pilot five-
neighborhood tree planting program. The HRM Species Codes were developed followed by the
species identification prototype created by United States Department of Agriculture (USDA).
Typically, the code is four letters composed of the first two letters of both the species and genus
name. 32 codes for species commonly planted in Halifax are found in the list below (Yellow
columns represent the native species, while purple columns represent non-native species).
(Chen, 2013)
12
3.3 Planting Data
V4—V7 Date, Cost, Plant Organization and Project Name
Variable 4 to 7 can be filled either before or after the tree measurement. Variable 4 (Date)
represent the planting date of the tree. Such date can usually be found by the tree-planting
contract. If the specific planting date can’t be found, the planting year and month at least should
be covered. Variable 5 (Cost) represent the value of each tree when they left the nurseries. HRM
or other tree planting organizations should have the list of all the planting trees’ values. Variable
6 (Plant organization) usually refer to various contract groups, for instance HRM or Tree-
planting non-profit organizations. Generally, trees planted in the same project belong to the same
plant organization. Variable 7 (Project Name) can either be filled by the organizer before the tree
measurement or after. Trees planted in different area or various season usually have different
project names.
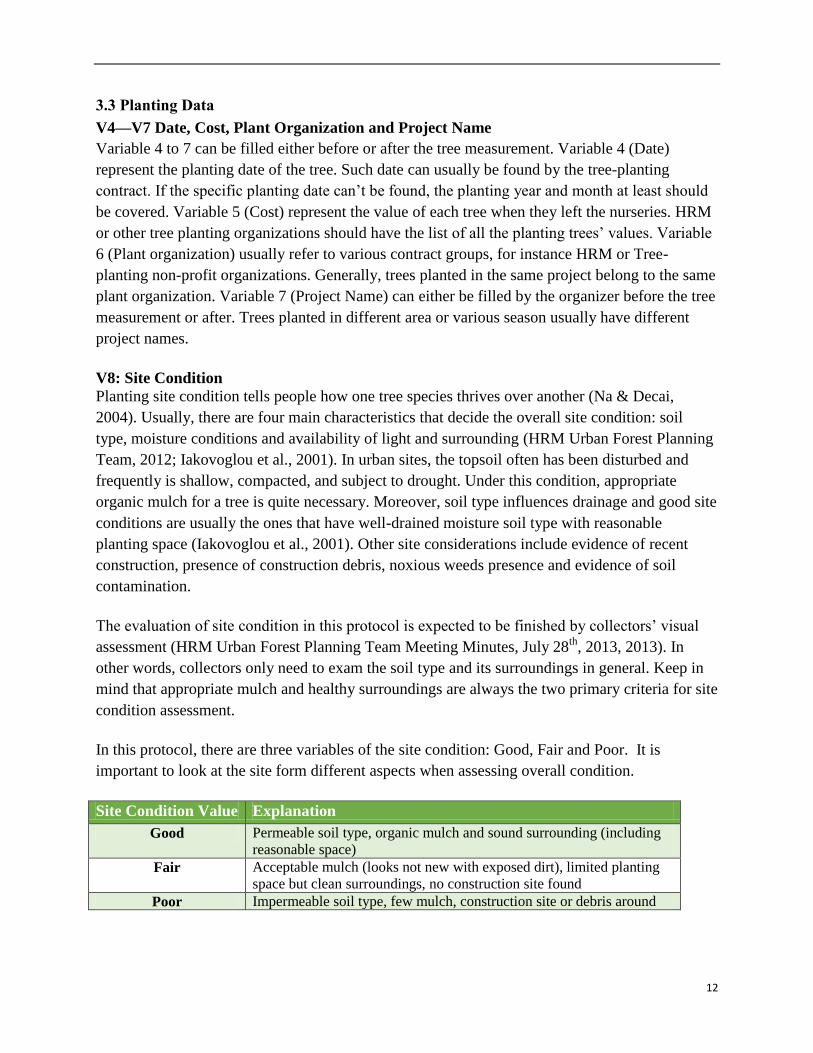
V8: Site Condition
Planting site condition tells people how one tree species thrives over another (Na & Decai,
2004). Usually, there are four main characteristics that decide the overall site condition: soil
type, moisture conditions and availability of light and surrounding (HRM Urban Forest Planning
Team, 2012; Iakovoglou et al., 2001). In urban sites, the topsoil often has been disturbed and
frequently is shallow, compacted, and subject to drought. Under this condition, appropriate
organic mulch for a tree is quite necessary. Moreover, soil type influences drainage and good site
conditions are usually the ones that have well-drained moisture soil type with reasonable
planting space (Iakovoglou et al., 2001). Other site considerations include evidence of recent
construction, presence of construction debris, noxious weeds presence and evidence of soil
contamination.
The evaluation of site condition in this protocol is expected to be finished by collectors’ visual
assessment (HRM Urban Forest Planning Team Meeting Minutes, July 28th
, 2013, 2013). In
other words, collectors only need to exam the soil type and its surroundings in general. Keep in
mind that appropriate mulch and healthy surroundings are always the two primary criteria for site
condition assessment.
In this protocol, there are three variables of the site condition: Good, Fair and Poor. It is
important to look at the site form different aspects when assessing overall condition.
Site Condition Value Explanation
Good Permeable soil type, organic mulch and sound surrounding (including
reasonable space)
Fair Acceptable mulch (looks not new with exposed dirt), limited planting
space but clean surroundings, no construction site found
Poor Impermeable soil type, few mulch, construction site or debris around
13
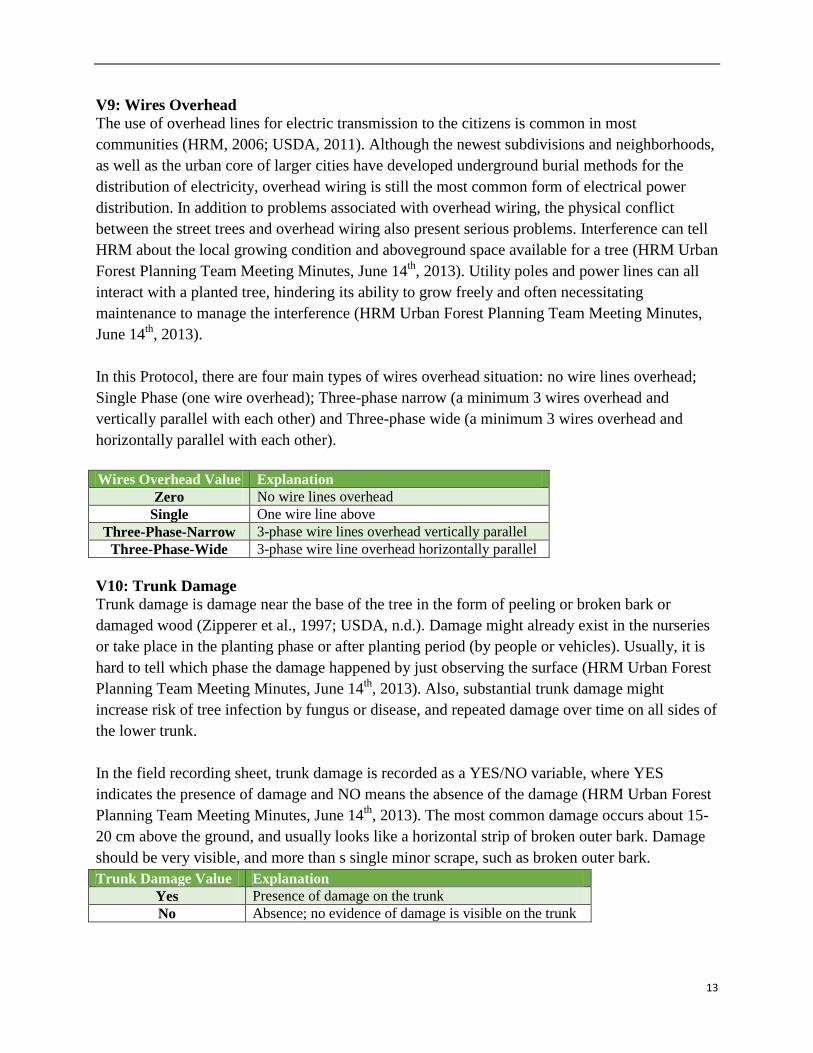
V9: Wires Overhead
The use of overhead lines for electric transmission to the citizens is common in most
communities (HRM, 2006; USDA, 2011). Although the newest subdivisions and neighborhoods,
as well as the urban core of larger cities have developed underground burial methods for the
distribution of electricity, overhead wiring is still the most common form of electrical power
distribution. In addition to problems associated with overhead wiring, the physical conflict
between the street trees and overhead wiring also present serious problems. Interference can tell
HRM about the local growing condition and aboveground space available for a tree (HRM Urban
Forest Planning Team Meeting Minutes, June 14th
, 2013). Utility poles and power lines can all
interact with a planted tree, hindering its ability to grow freely and often necessitating
maintenance to manage the interference (HRM Urban Forest Planning Team Meeting Minutes,
June 14th
, 2013).
In this Protocol, there are four main types of wires overhead situation: no wire lines overhead;
Single Phase (one wire overhead); Three-phase narrow (a minimum 3 wires overhead and
vertically parallel with each other) and Three-phase wide (a minimum 3 wires overhead and
horizontally parallel with each other).
Wires Overhead Value Explanation
Zero No wire lines overhead
Single One wire line above
Three-Phase-Narrow 3-phase wire lines overhead vertically parallel
Three-Phase-Wide 3-phase wire line overhead horizontally parallel
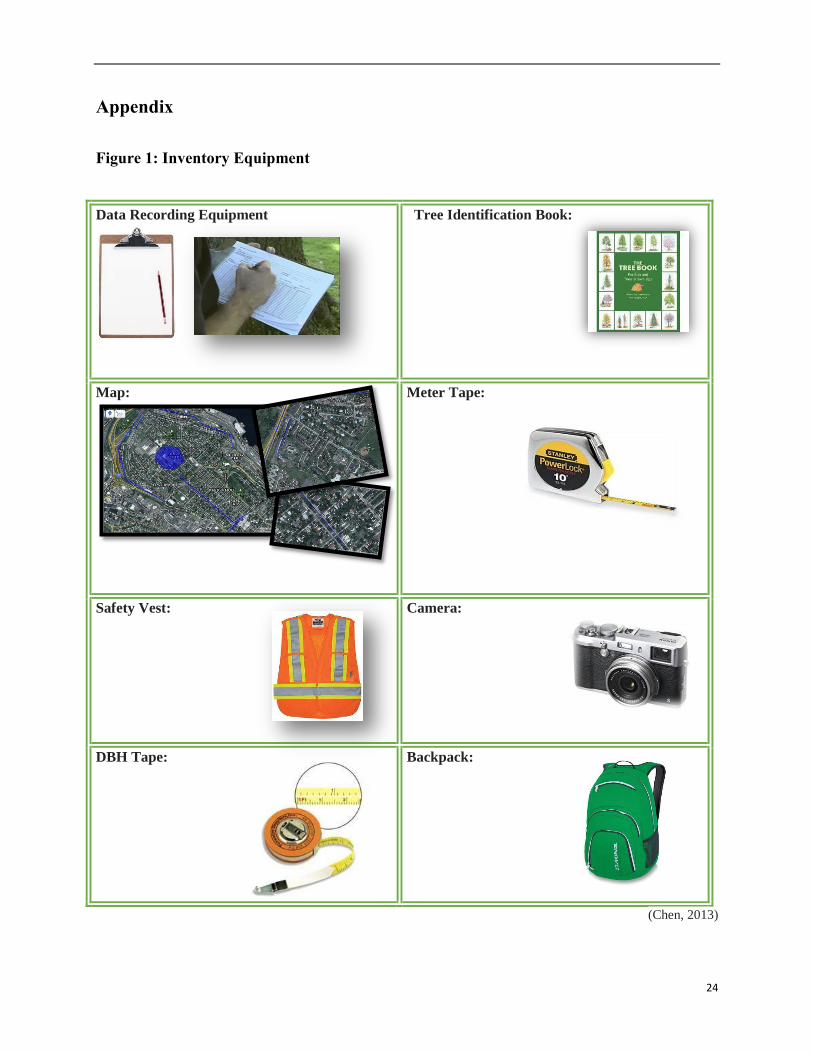
V10: Trunk Damage
Trunk damage is damage near the base of the tree in the form of peeling or broken bark or
damaged wood (Zipperer et al., 1997; USDA, n.d.). Damage might already exist in the nurseries
or take place in the planting phase or after planting period (by people or vehicles). Usually, it is
hard to tell which phase the damage happened by just observing the surface (HRM Urban Forest
Planning Team Meeting Minutes, June 14th
, 2013). Also, substantial trunk damage might
increase risk of tree infection by fungus or disease, and repeated damage over time on all sides of
the lower trunk.
In the field recording sheet, trunk damage is recorded as a YES/NO variable, where YES
indicates the presence of damage and NO means the absence of the damage (HRM Urban Forest
Planning Team Meeting Minutes, June 14th
, 2013). The most common damage occurs about 15-
20 cm above the ground, and usually looks like a horizontal strip of broken outer bark. Damage
should be very visible, and more than s single minor scrape, such as broken outer bark.
Trunk Damage Value Explanation
Yes Presence of damage on the trunk
No Absence; no evidence of damage is visible on the trunk
14
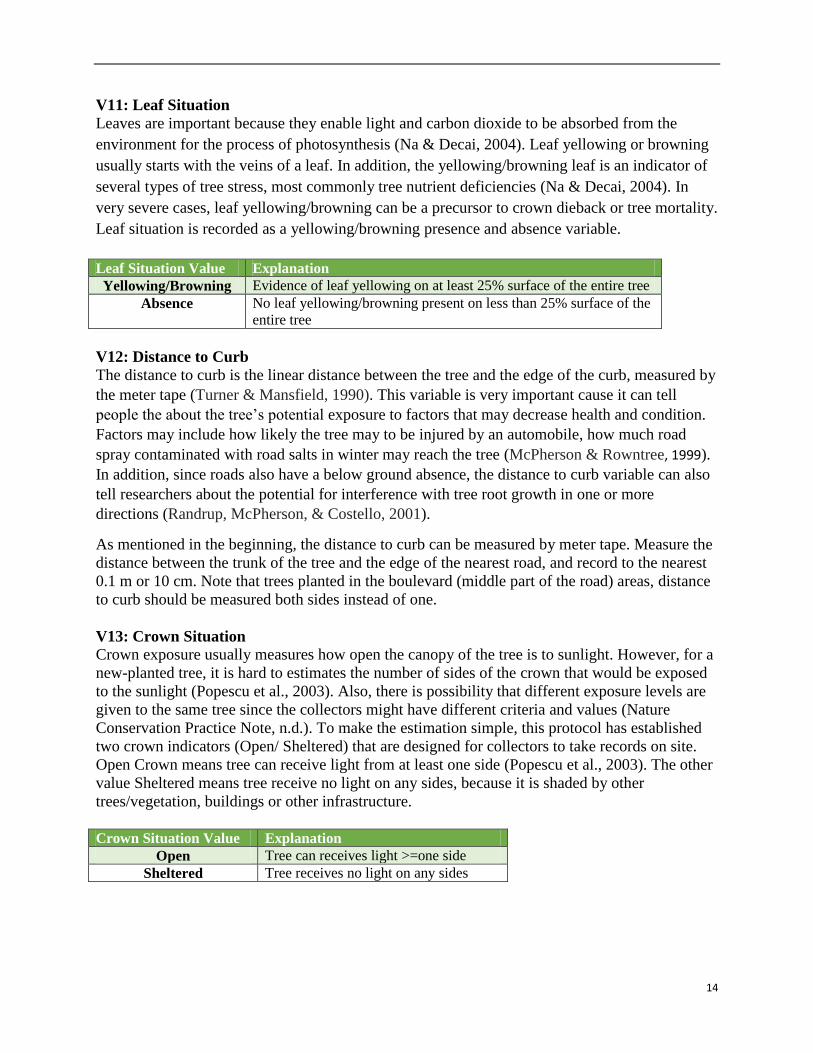
V11: Leaf Situation
Leaves are important because they enable light and carbon dioxide to be absorbed from the
environment for the process of photosynthesis (Na & Decai, 2004). Leaf yellowing or browning
usually starts with the veins of a leaf. In addition, the yellowing/browning leaf is an indicator of
several types of tree stress, most commonly tree nutrient deficiencies (Na & Decai, 2004). In
very severe cases, leaf yellowing/browning can be a precursor to crown dieback or tree mortality.
Leaf situation is recorded as a yellowing/browning presence and absence variable.
Leaf Situation Value Explanation
Yellowing/Browning Evidence of leaf yellowing on at least 25% surface of the entire tree
Absence No leaf yellowing/browning present on less than 25% surface of the
entire tree
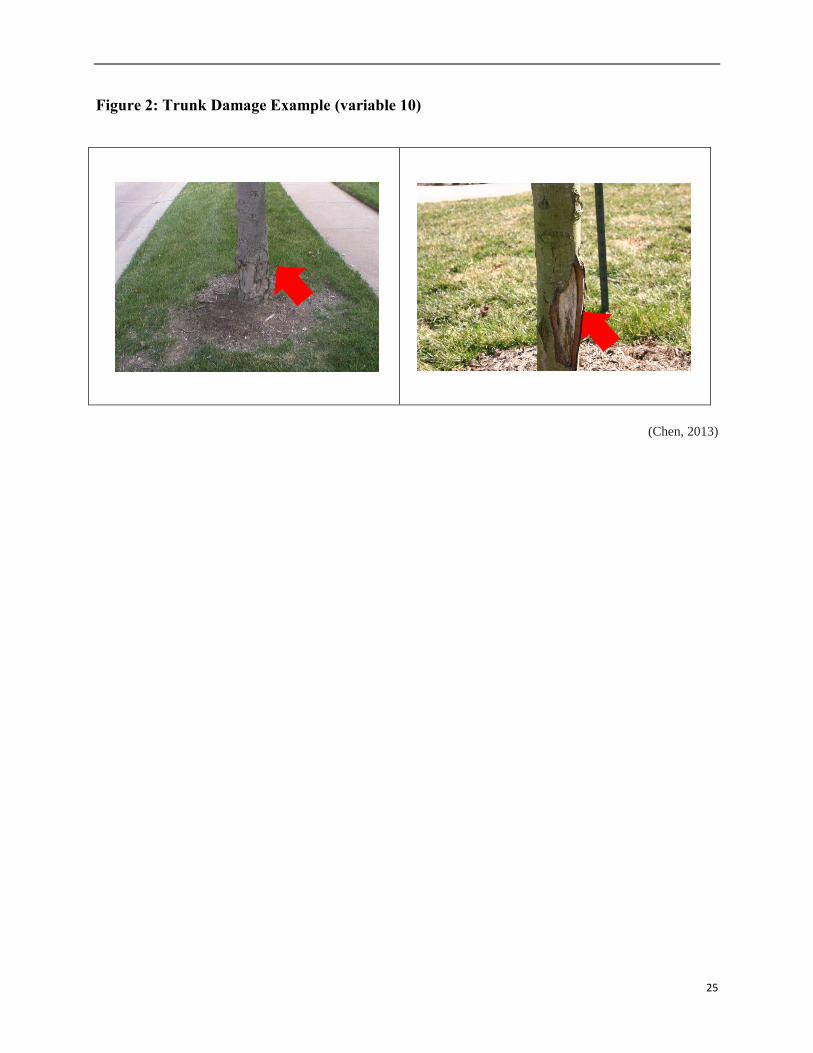
V12: Distance to Curb
The distance to curb is the linear distance between the tree and the edge of the curb, measured by
the meter tape (Turner & Mansfield, 1990). This variable is very important cause it can tell
people the about the tree’s potential exposure to factors that may decrease health and condition.
Factors may include how likely the tree may to be injured by an automobile, how much road
spray contaminated with road salts in winter may reach the tree (McPherson & Rowntree, 1999).
In addition, since roads also have a below ground absence, the distance to curb variable can also
tell researchers about the potential for interference with tree root growth in one or more
directions (Randrup, McPherson, & Costello, 2001).
As mentioned in the beginning, the distance to curb can be measured by meter tape. Measure the
distance between the trunk of the tree and the edge of the nearest road, and record to the nearest
0.1 m or 10 cm. Note that trees planted in the boulevard (middle part of the road) areas, distance
to curb should be measured both sides instead of one.
V13: Crown Situation
Crown exposure usually measures how open the canopy of the tree is to sunlight. However, for a
new-planted tree, it is hard to estimates the number of sides of the crown that would be exposed
to the sunlight (Popescu et al., 2003). Also, there is possibility that different exposure levels are
given to the same tree since the collectors might have different criteria and values (Nature
Conservation Practice Note, n.d.). To make the estimation simple, this protocol has established
two crown indicators (Open/ Sheltered) that are designed for collectors to take records on site.
Open Crown means tree can receive light from at least one side (Popescu et al., 2003). The other
value Sheltered means tree receive no light on any sides, because it is shaded by other
trees/vegetation, buildings or other infrastructure.
Crown Situation Value Explanation
Open Tree can receives light >=one side
Sheltered Tree receives no light on any sides
15
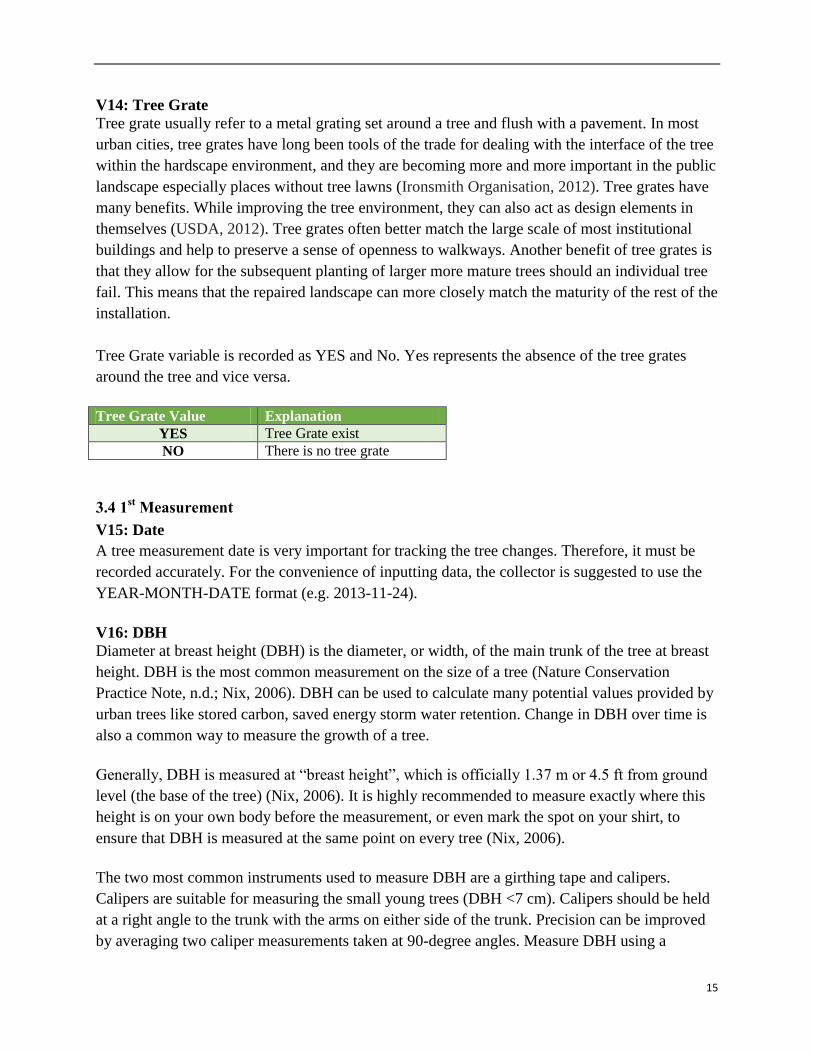
V14: Tree Grate
Tree grate usually refer to a metal grating set around a tree and flush with a pavement. In most
urban cities, tree grates have long been tools of the trade for dealing with the interface of the tree
within the hardscape environment, and they are becoming more and more important in the public
landscape especially places without tree lawns (Ironsmith Organisation, 2012). Tree grates have
many benefits. While improving the tree environment, they can also act as design elements in
themselves (USDA, 2012). Tree grates often better match the large scale of most institutional
buildings and help to preserve a sense of openness to walkways. Another benefit of tree grates is
that they allow for the subsequent planting of larger more mature trees should an individual tree
fail. This means that the repaired landscape can more closely match the maturity of the rest of the
installation.
Tree Grate variable is recorded as YES and No. Yes represents the absence of the tree grates
around the tree and vice versa.
Tree Grate Value Explanation
YES Tree Grate exist
NO There is no tree grate
3.4 1st Measurement
V15: Date
A tree measurement date is very important for tracking the tree changes. Therefore, it must be
recorded accurately. For the convenience of inputting data, the collector is suggested to use the
YEAR-MONTH-DATE format (e.g. 2013-11-24).
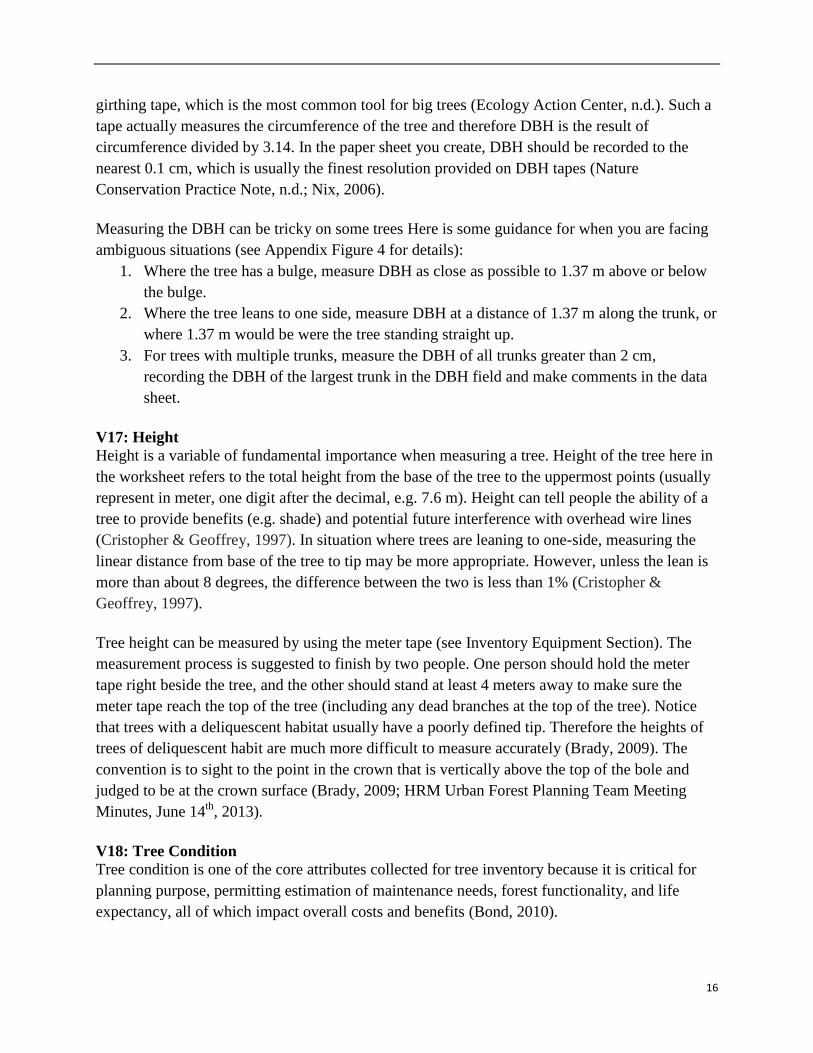
V16: DBH
Diameter at breast height (DBH) is the diameter, or width, of the main trunk of the tree at breast
height. DBH is the most common measurement on the size of a tree (Nature Conservation
Practice Note, n.d.; Nix, 2006). DBH can be used to calculate many potential values provided by
urban trees like stored carbon, saved energy storm water retention. Change in DBH over time is
also a common way to measure the growth of a tree.
Generally, DBH is measured at “breast height”, which is officially 1.37 m or 4.5 ft from ground
level (the base of the tree) (Nix, 2006). It is highly recommended to measure exactly where this
height is on your own body before the measurement, or even mark the spot on your shirt, to
ensure that DBH is measured at the same point on every tree (Nix, 2006).
The two most common instruments used to measure DBH are a girthing tape and calipers.
Calipers are suitable for measuring the small young trees (DBH <7 cm). Calipers should be held
at a right angle to the trunk with the arms on either side of the trunk. Precision can be improved
by averaging two caliper measurements taken at 90-degree angles. Measure DBH using a
16
girthing tape, which is the most common tool for big trees (Ecology Action Center, n.d.). Such a
tape actually measures the circumference of the tree and therefore DBH is the result of
circumference divided by 3.14. In the paper sheet you create, DBH should be recorded to the
nearest 0.1 cm, which is usually the finest resolution provided on DBH tapes (Nature
Conservation Practice Note, n.d.; Nix, 2006).
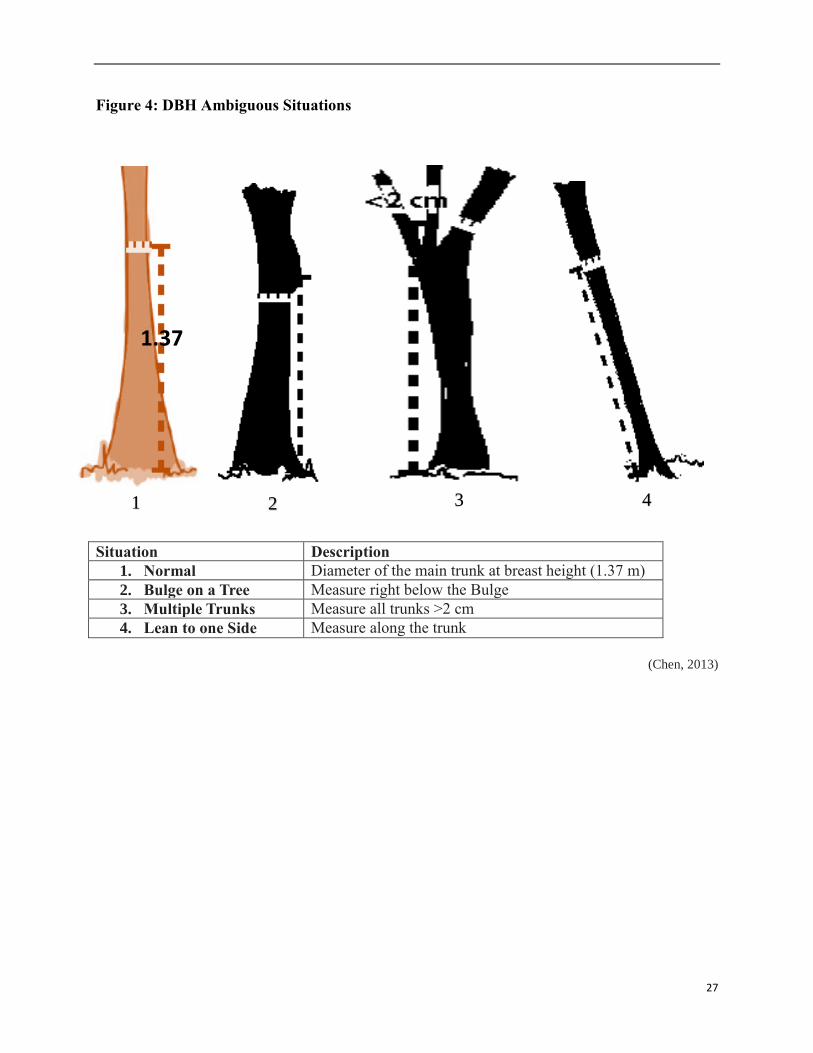
Measuring the DBH can be tricky on some trees Here is some guidance for when you are facing
ambiguous situations (see Appendix Figure 4 for details):
1. Where the tree has a bulge, measure DBH as close as possible to 1.37 m above or below
the bulge.
2. Where the tree leans to one side, measure DBH at a distance of 1.37 m along the trunk, or
where 1.37 m would be were the tree standing straight up.
3. For trees with multiple trunks, measure the DBH of all trunks greater than 2 cm,
recording the DBH of the largest trunk in the DBH field and make comments in the data
sheet.
V17: Height
Height is a variable of fundamental importance when measuring a tree. Height of the tree here in
the worksheet refers to the total height from the base of the tree to the uppermost points (usually
represent in meter, one digit after the decimal, e.g. 7.6 m). Height can tell people the ability of a
tree to provide benefits (e.g. shade) and potential future interference with overhead wire lines
(Cristopher & Geoffrey, 1997). In situation where trees are leaning to one-side, measuring the
linear distance from base of the tree to tip may be more appropriate. However, unless the lean is
more than about 8 degrees, the difference between the two is less than 1% (Cristopher &
Geoffrey, 1997).
Tree height can be measured by using the meter tape (see Inventory Equipment Section). The
measurement process is suggested to finish by two people. One person should hold the meter
tape right beside the tree, and the other should stand at least 4 meters away to make sure the
meter tape reach the top of the tree (including any dead branches at the top of the tree). Notice
that trees with a deliquescent habitat usually have a poorly defined tip. Therefore the heights of
trees of deliquescent habit are much more difficult to measure accurately (Brady, 2009). The
convention is to sight to the point in the crown that is vertically above the top of the bole and
judged to be at the crown surface (Brady, 2009; HRM Urban Forest Planning Team Meeting
Minutes, June 14th
, 2013).
V18: Tree Condition
Tree condition is one of the core attributes collected for tree inventory because it is critical for
planning purpose, permitting estimation of maintenance needs, forest functionality, and life
expectancy, all of which impact overall costs and benefits (Bond, 2010).
17
A healthy, vigorous tree usually has a full canopy of dark green leaves that are not undersized
and no dieback. Leaves in the summer should be dark green and should not turn to fall colors
early (Zipperer et al., 1997). Another criteria of measuring the tree condition is the growth form
of a tree. Trees in good condition exhibit proper form for the species and don’t have dead
branches (Bond, 2010). Tree condition influences how well a tree is growing, and poor condition
can be an indicator of a tree’s impending mortality. Trees in poor condition might have less
canopy volume and leaf area to photosynthesize and sequester carbon and offer shade (Bond,
2010; Zipperer et al., 1997). Poor condition trees also provide fewer aesthetic benefits and may
even lead to the overall negative impression from the citizens to the cities.
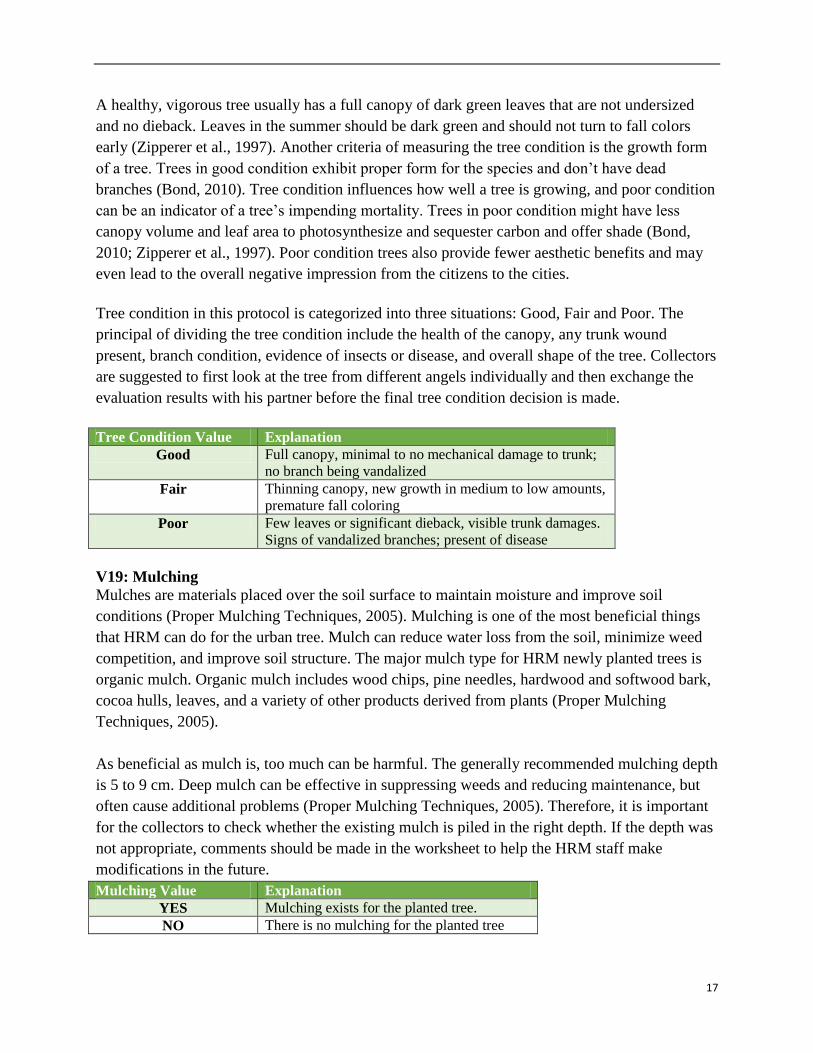
Tree condition in this protocol is categorized into three situations: Good, Fair and Poor. The
principal of dividing the tree condition include the health of the canopy, any trunk wound
present, branch condition, evidence of insects or disease, and overall shape of the tree. Collectors
are suggested to first look at the tree from different angels individually and then exchange the
evaluation results with his partner before the final tree condition decision is made.
Tree Condition Value Explanation
Good Full canopy, minimal to no mechanical damage to trunk;
no branch being vandalized
Fair Thinning canopy, new growth in medium to low amounts,
premature fall coloring
Poor Few leaves or significant dieback, visible trunk damages.
Signs of vandalized branches; present of disease
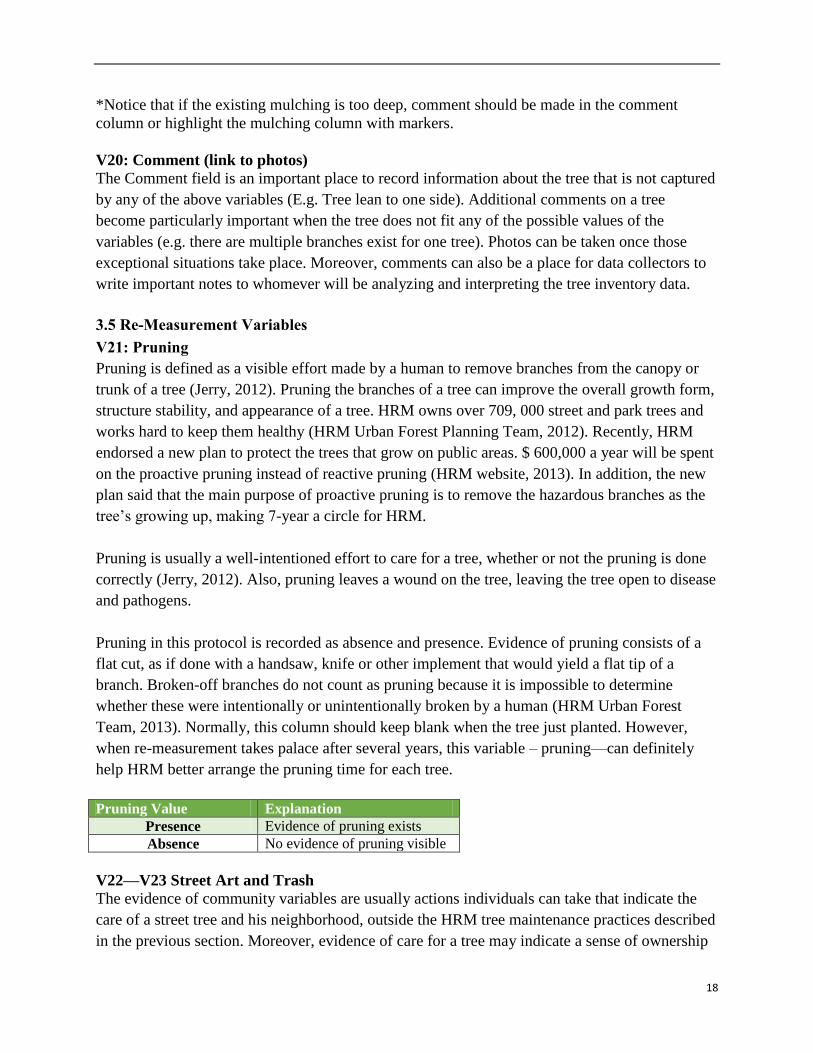
V19: Mulching
Mulches are materials placed over the soil surface to maintain moisture and improve soil
conditions (Proper Mulching Techniques, 2005). Mulching is one of the most beneficial things
that HRM can do for the urban tree. Mulch can reduce water loss from the soil, minimize weed
competition, and improve soil structure. The major mulch type for HRM newly planted trees is
organic mulch. Organic mulch includes wood chips, pine needles, hardwood and softwood bark,
cocoa hulls, leaves, and a variety of other products derived from plants (Proper Mulching
Techniques, 2005).
As beneficial as mulch is, too much can be harmful. The generally recommended mulching depth
is 5 to 9 cm. Deep mulch can be effective in suppressing weeds and reducing maintenance, but
often cause additional problems (Proper Mulching Techniques, 2005). Therefore, it is important
for the collectors to check whether the existing mulch is piled in the right depth. If the depth was
not appropriate, comments should be made in the worksheet to help the HRM staff make
modifications in the future.
Mulching Value Explanation
YES Mulching exists for the planted tree.
NO There is no mulching for the planted tree
18
*Notice that if the existing mulching is too deep, comment should be made in the comment
column or highlight the mulching column with markers.
V20: Comment (link to photos)
The Comment field is an important place to record information about the tree that is not captured
by any of the above variables (E.g. Tree lean to one side). Additional comments on a tree
become particularly important when the tree does not fit any of the possible values of the
variables (e.g. there are multiple branches exist for one tree). Photos can be taken once those
exceptional situations take place. Moreover, comments can also be a place for data collectors to
write important notes to whomever will be analyzing and interpreting the tree inventory data.
3.5 Re-Measurement Variables
V21: Pruning
Pruning is defined as a visible effort made by a human to remove branches from the canopy or
trunk of a tree (Jerry, 2012). Pruning the branches of a tree can improve the overall growth form,
structure stability, and appearance of a tree. HRM owns over 709, 000 street and park trees and
works hard to keep them healthy (HRM Urban Forest Planning Team, 2012). Recently, HRM
endorsed a new plan to protect the trees that grow on public areas. $ 600,000 a year will be spent
on the proactive pruning instead of reactive pruning (HRM website, 2013). In addition, the new
plan said that the main purpose of proactive pruning is to remove the hazardous branches as the
tree’s growing up, making 7-year a circle for HRM.
Pruning is usually a well-intentioned effort to care for a tree, whether or not the pruning is done
correctly (Jerry, 2012). Also, pruning leaves a wound on the tree, leaving the tree open to disease
and pathogens.
Pruning in this protocol is recorded as absence and presence. Evidence of pruning consists of a
flat cut, as if done with a handsaw, knife or other implement that would yield a flat tip of a
branch. Broken-off branches do not count as pruning because it is impossible to determine
whether these were intentionally or unintentionally broken by a human (HRM Urban Forest
Team, 2013). Normally, this column should keep blank when the tree just planted. However,
when re-measurement takes palace after several years, this variable – pruning—can definitely
help HRM better arrange the pruning time for each tree.
Pruning Value Explanation
Presence Evidence of pruning exists
Absence No evidence of pruning visible
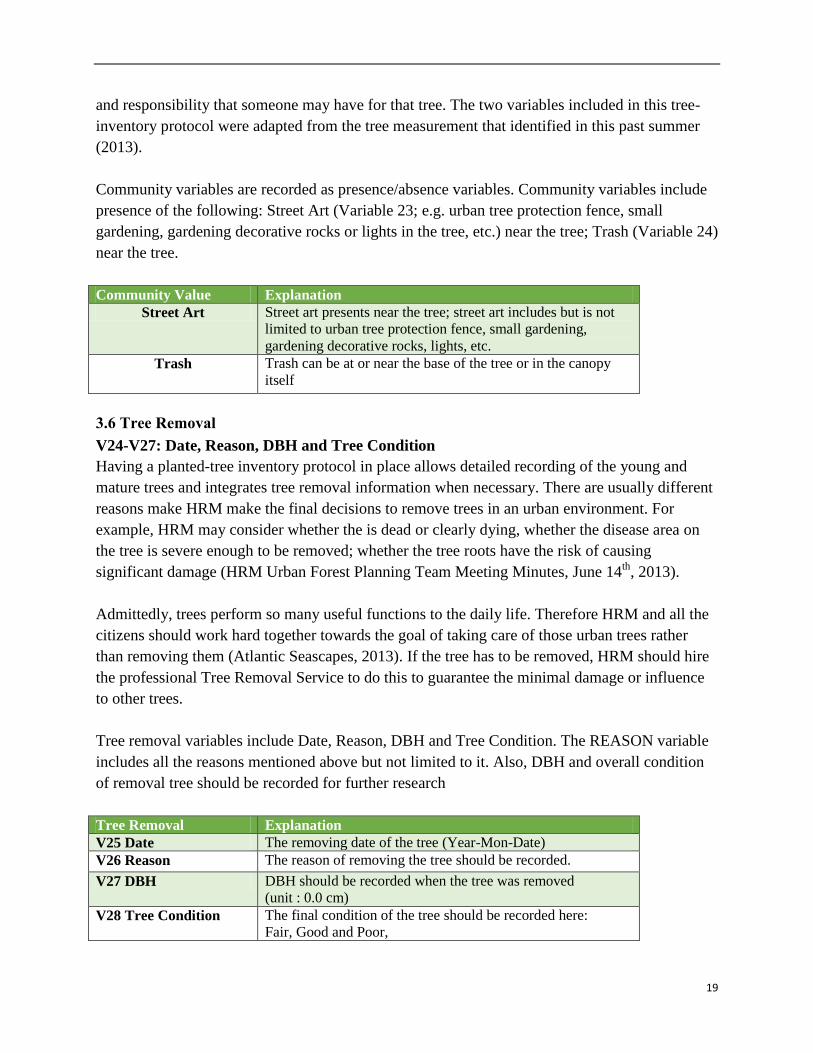
V22—V23 Street Art and Trash
The evidence of community variables are usually actions individuals can take that indicate the
care of a street tree and his neighborhood, outside the HRM tree maintenance practices described
in the previous section. Moreover, evidence of care for a tree may indicate a sense of ownership
19
and responsibility that someone may have for that tree. The two variables included in this tree-
inventory protocol were adapted from the tree measurement that identified in this past summer
(2013).
Community variables are recorded as presence/absence variables. Community variables include
presence of the following: Street Art (Variable 23; e.g. urban tree protection fence, small
gardening, gardening decorative rocks or lights in the tree, etc.) near the tree; Trash (Variable 24)
near the tree.
Community Value Explanation
Street Art Street art presents near the tree; street art includes but is not
limited to urban tree protection fence, small gardening,
gardening decorative rocks, lights, etc.
Trash Trash can be at or near the base of the tree or in the canopy
itself
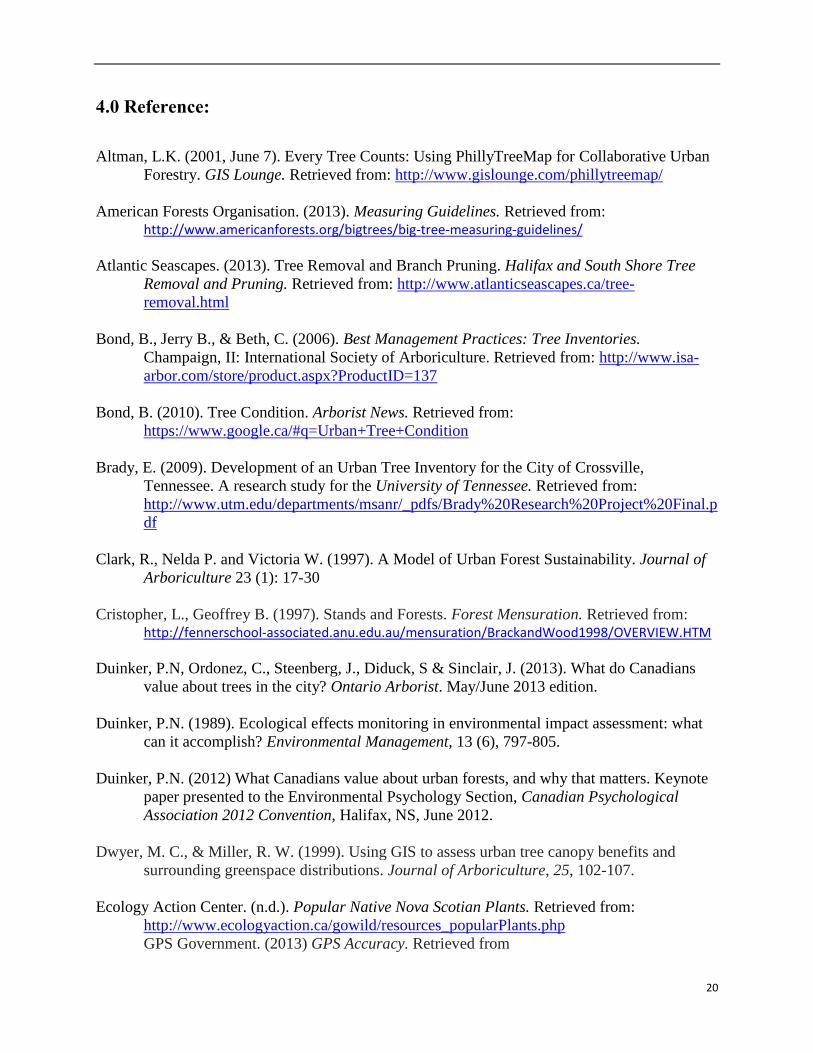
3.6 Tree Removal
V24-V27: Date, Reason, DBH and Tree Condition
Having a planted-tree inventory protocol in place allows detailed recording of the young and
mature trees and integrates tree removal information when necessary. There are usually different
reasons make HRM make the final decisions to remove trees in an urban environment. For
example, HRM may consider whether the is dead or clearly dying, whether the disease area on
the tree is severe enough to be removed; whether the tree roots have the risk of causing
significant damage (HRM Urban Forest Planning Team Meeting Minutes, June 14th
, 2013).
Admittedly, trees perform so many useful functions to the daily life. Therefore HRM and all the
citizens should work hard together towards the goal of taking care of those urban trees rather
than removing them (Atlantic Seascapes, 2013). If the tree has to be removed, HRM should hire
the professional Tree Removal Service to do this to guarantee the minimal damage or influence
to other trees.
Tree removal variables include Date, Reason, DBH and Tree Condition. The REASON variable
includes all the reasons mentioned above but not limited to it. Also, DBH and overall condition
of removal tree should be recorded for further research
Tree Removal Explanation
V25 Date The removing date of the tree (Year-Mon-Date)
V26 Reason The reason of removing the tree should be recorded.
V27 DBH DBH should be recorded when the tree was removed
(unit : 0.0 cm)
V28 Tree Condition The final condition of the tree should be recorded here:
Fair, Good and Poor,
20
4.0 Reference:
Altman, L.K. (2001, June 7). Every Tree Counts: Using PhillyTreeMap for Collaborative Urban
Forestry. GIS Lounge. Retrieved from: http://www.gislounge.com/phillytreemap/
American Forests Organisation. (2013). Measuring Guidelines. Retrieved from: http://www.americanforests.org/bigtrees/big-tree-measuring-guidelines/
Atlantic Seascapes. (2013). Tree Removal and Branch Pruning. Halifax and South Shore Tree
Removal and Pruning. Retrieved from: http://www.atlanticseascapes.ca/tree-
removal.html
Bond, B., Jerry B., & Beth, C. (2006). Best Management Practices: Tree Inventories.
Champaign, II: International Society of Arboriculture. Retrieved from: http://www.isa-
arbor.com/store/product.aspx?ProductID=137
Bond, B. (2010). Tree Condition. Arborist News. Retrieved from:
https://www.google.ca/#q=Urban+Tree+Condition
Brady, E. (2009). Development of an Urban Tree Inventory for the City of Crossville,
Tennessee. A research study for the University of Tennessee. Retrieved from:
http://www.utm.edu/departments/msanr/_pdfs/Brady%20Research%20Project%20Final.p
df
Clark, R., Nelda P. and Victoria W. (1997). A Model of Urban Forest Sustainability. Journal of
Arboriculture 23 (1): 17-30
Cristopher, L., Geoffrey B. (1997). Stands and Forests. Forest Mensuration. Retrieved from: http://fennerschool-associated.anu.edu.au/mensuration/BrackandWood1998/OVERVIEW.HTM
Duinker, P.N, Ordonez, C., Steenberg, J., Diduck, S & Sinclair, J. (2013). What do Canadians
value about trees in the city? Ontario Arborist. May/June 2013 edition.
Duinker, P.N. (1989). Ecological effects monitoring in environmental impact assessment: what
can it accomplish? Environmental Management, 13 (6), 797-805.
Duinker, P.N. (2012) What Canadians value about urban forests, and why that matters. Keynote
paper presented to the Environmental Psychology Section, Canadian Psychological
Association 2012 Convention, Halifax, NS, June 2012.
Dwyer, M. C., & Miller, R. W. (1999). Using GIS to assess urban tree canopy benefits and
surrounding greenspace distributions. Journal of Arboriculture, 25, 102-107.
Ecology Action Center. (n.d.). Popular Native Nova Scotian Plants. Retrieved from:
http://www.ecologyaction.ca/gowild/resources_popularPlants.php
GPS Government. (2013) GPS Accuracy. Retrieved from
21
http://www.gps.gov/systems/gps/performance/accuracy/
Grosenbaugh, L. R. (1954). New tree-measurement concepts: height accumulation, giant tree,
taper and shape. Retrieved from: http://treesearch.fs.fed.us/pubs/21263
Halifax Regional Municipality. (2006). Municipal Planning Strategy. Retrieved from: http://www.halifax.ca/planning/documents/PlanningDistricts8and9_MPS.pdf.
Halifax Regional Municipality. (2010). Invasive Species. Retrieved from: http://www.halifax.ca/environment/InvasiveSpecies.html
Halifax Regional Municipality. (2013). UFMP Frequently Asked Questions. Retrieved from: http://www.halifax.ca/RealPropertyPlanning/UFMP/UFMP_FAQ.html
HRM Urban Forest Planning Team. (2012). Halifax Regional Municipality Urban Forest Master
Plan: Draft of August 2012. Halifax Regional Municipality, Halifax, NS.
HRM Urban Forest Planning Team. (2013). Meeting Minutes (June 14th
). Halifax Regional
Municipality, Halifax, NS.
HRM Urban Forest Planning Team. (2013). Meeting Minutes (July 12th
). Halifax Regional
Municipality, Halifax, NS.
HRM Urban Forest Planning Team. (2013). Meeting Minutes (July 28th
). Halifax Regional
Municipality, Halifax, NS.
Iakovoglou, V., Thomposon. J., Burras, L. & Kipper R. (2001). Factors related to tree growth
across urban-rural gradients in the Midwest, USA. Urban Ecosystem 5:71-85.
Ironsmith Organisation. (2012). Tree Grate Uplights. Retrieved from:
http://www.ironsmith.cc/TREE-GRATES-ABOUT.htm
Jerry, H. (2012, March 6). In Halifax, Tree Pruning and Dead Tree Removal Raises Home
Values. Keller William Realty. Retrieved from: http://www.gojerry.ca/in-halifax-tree-
pruning-and-dead-tree-removal-raises-home-values/
McPherson, E. G., & Rowntree, R. A. (1993). Energy conservation potential of urban tree
planting. Journal of Arboriculture, 19, 321-321.
Na, W. L. L. H. L., & Decai, C. (2004). Establishment of Leaf Regeneration System in Platanus
acerifolia [J]. Scientia Silvae Sinicae, 1, 010.
Nature Conservation Practice Note. (n.d.). Measurement of Diameter at Breast Height (DBH).
Retrieved from:
http:www.afcd.gov.hk/English/conservation/con_tech/files/common/NCPN.pdf
Nicholas, A., Author, H, Gary, H., & Edward, F. (2011). A 100% Tree Inventory Using i-Tree
22
Eco Protocol: a case study at Auburn University, Alabama, U.S. Arboriculture and
Urban Forestry. doi: 2011.37(5): 207-212.
Nix, S. (2006). Diameter at Breast Height. Forestry Education US. Retrieved from:
http://forestry.about.com/cs/glossary/g/dbh.htm
Ostrom, E. (2007). A Diagnostic Approach for Going beyond Panaceas. Proceedings of the
National Academy of Sciences of the United States of America 104 (39): 15181-7, doi:
10.1073/pnas.0702288104.
Ostrom, E. (2009). A General Framework for Analyzing Sustainability of Social-ecological
System. Science 325 (5939): 419-422. doi: 10.1126/science.1172133.
Phillip, J.P, Richard, G.O., Randolph, H.W. (1999). Tree Inventories and GIS in Urban Forestry.
University of Virginia. Retrieved from:
http://www.gis.smumn.edu/GradProjects/StarkK.pdf.
Popescu, S. C., Wynne, R. H., & Nelson, R. F. (2003). Measuring individual tree crown diameter
with lidar and assessing its influence on estimating forest volume and biomass. Canadian
journal of remote sensing, 29(5), 564-577.
Randrup, T. B., McPherson, E. G., & Costello, L. R. (2001). A review of tree root conflicts with
sidewalks, curbs, and roads. Urban Ecosystems, 5(3), 209-225.
Steenberg, J.W.N., Duinker, P.N., & Charles, J.G. (2013). The neighborhood approach to urban
forest management: the case of Halifax, Canada. Landscape and Urban Planning: in
press. Retrieved from: http://dx.doi.org/10.1016/j.landurbplan.2013.04.003
Street Tree Inventory. (n.d.). Street Tree Inventory using GPS coordinates. Retrieved from:
http://www.streettreeinventory.com/STI-GpsStreetTreeInventory.asp#STI-Gps-
Measurements
TREES ARE GOOD. (2005). Proper Mulching Techniques. Retrieved from:
http://www.treesaregood.com/treecare/mulching.aspx
Turner, D. S., & Mansfield, E. R. (1990). Urban trees and roadside safety.Journal of
Transportation Engineering, 116(1), 90-104.
Turner, K., Lefler, L., & Freedman, B. (2005). Planted communities of selected urbanized areas
of Halifax, Nova Scotia, Canada. Landscape and Urban Planning, 71(2), 191-206.
United States Department of Agriculture. (2002). Community Tree Inventory: Data Collection.
Retrieved from: http://www.umass.edu/urbantree/inventorywhitepaper.pdf
United States Department of Agriculture. (2009). Urban Forest Effects Model—UFORE.
Retrieved from: http://www.nrs.fs.fed.us/tools/ufore/
23
United States Department of Agriculture. (2011). Tree Care and Management. Retrieved from:
http://www.nrcs.usda.gov/Internet/FSE_DOCUMENTS/nrcs141p2_001563.pdf
United States Department of Agriculture. (n.d.). Values of Urban Trees. Retrieved
from: http://www.na.fs.fed.us/spfo/pubs/uf/techguide/values.htm.
Zipperer, W. C., Sisinni, S. M., Pouyat, R. V., & Foresman, T. W. (1997). Urban tree cover: an
ecological perspective. Urban Ecosystems, 1(4), 229-246.
24
Appendix
Figure 1: Inventory Equipment
Data Recording Equipment
Tree Identification Book:
Map:
Meter Tape:
Safety Vest:
Camera:
DBH Tape:
Backpack:
(Chen, 2013)
25
Figure 2: Trunk Damage Example (variable 10)
(Chen, 2013)
26
Figure 3: Distance to Curb Measurement Example
(Chen, 2013)
27
Figure 4: DBH Ambiguous Situations
Situation Description
1. Normal Diameter of the main trunk at breast height (1.37 m)
2. Bulge on a Tree Measure right below the Bulge
3. Multiple Trunks Measure all trunks >2 cm
4. Lean to one Side Measure along the trunk
(Chen, 2013)
1.37m
1 2 3 4
28
Table 1: Worksheet
Neighbourhood: ______________________________ Date: ______________________________ Recorder: _________________
(Source: HRM Urban Forest Planning Team, 2013)
ID Address/ Site/Side
English Name Site Condition 1 G 2 F 3 P
Wires (1/3-N,W)
Basal Dam
(y/n)
DBH (0.0cm)
Height (0.0m)
Condition 1 G 2 F 3 P
Distance to Curb (0.0 cm)
Comments
29
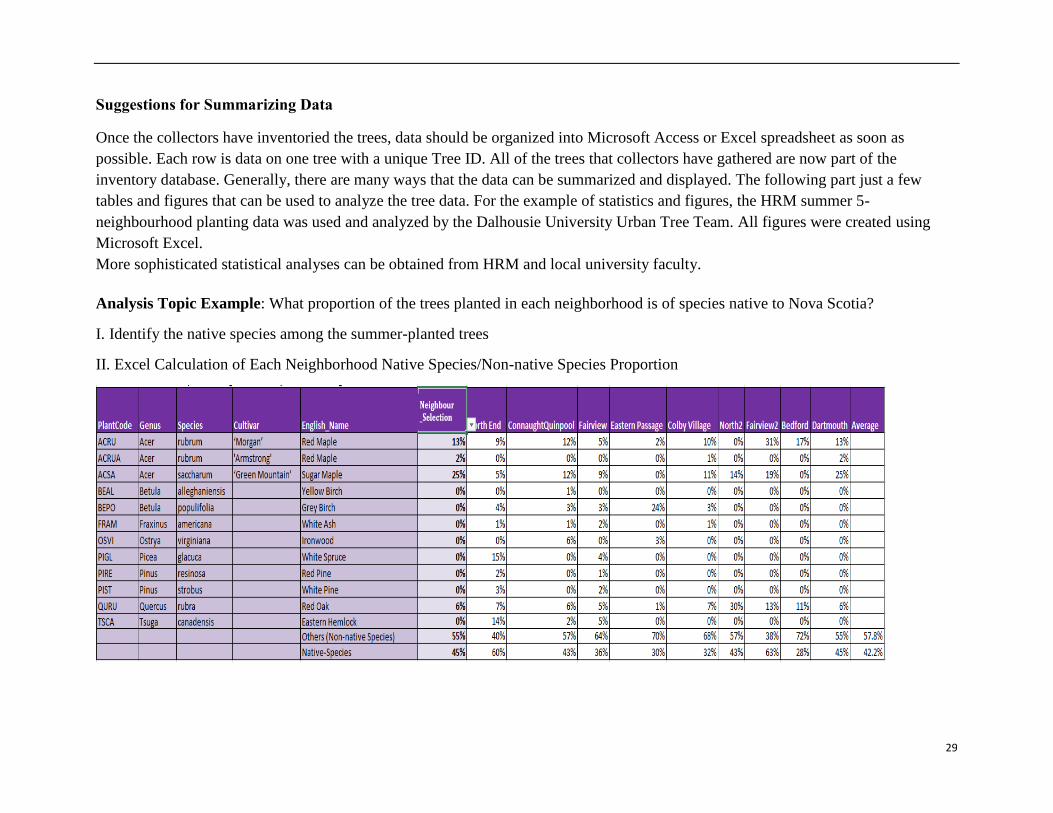
Suggestions for Summarizing Data
Once the collectors have inventoried the trees, data should be organized into Microsoft Access or Excel spreadsheet as soon as
possible. Each row is data on one tree with a unique Tree ID. All of the trees that collectors have gathered are now part of the
inventory database. Generally, there are many ways that the data can be summarized and displayed. The following part just a few
tables and figures that can be used to analyze the tree data. For the example of statistics and figures, the HRM summer 5-
neighbourhood planting data was used and analyzed by the Dalhousie University Urban Tree Team. All figures were created using
Microsoft Excel.
More sophisticated statistical analyses can be obtained from HRM and local university faculty.
Analysis Topic Example: What proportion of the trees planted in each neighborhood is of species native to Nova Scotia?
I. Identify the native species among the summer-planted trees
II. Excel Calculation of Each Neighborhood Native Species/Non-native Species Proportion

30
(Chen, 2013)
III. Comparison of Nine Neighborhood’ Native/Non-native Species Results in one Chart
(Chen, 2013)