Embed Size (px)
Citation preview
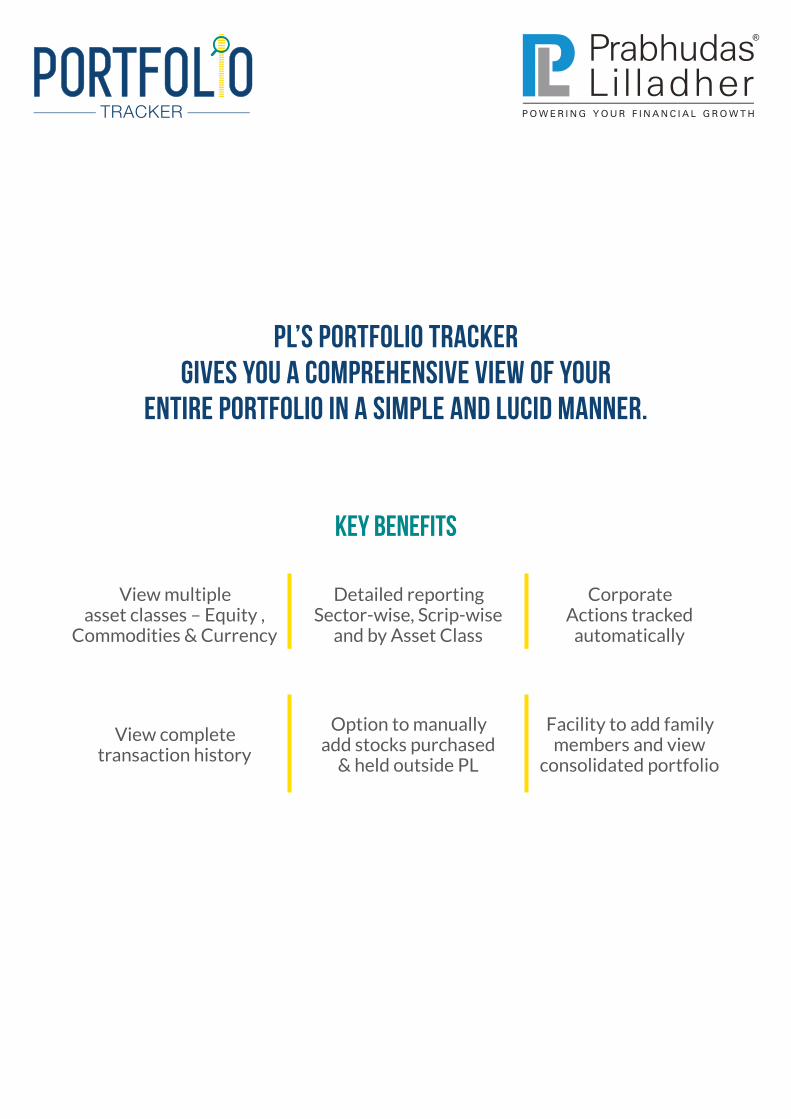
PL’s Portfolio Tracker gives you a comprehensive view of your
entire portfolio in a simple and lucid manner.
Key benefits
View multiple asset classes – Equity ,
Commodities & Currency
Detailed reporting Sector-wise, Scrip-wise
and by Asset Class
Corporate Actions tracked
automatically
View complete transaction history
Option to manually add stocks purchased
& held outside PL
Facility to add family members and view
consolidated portfolio
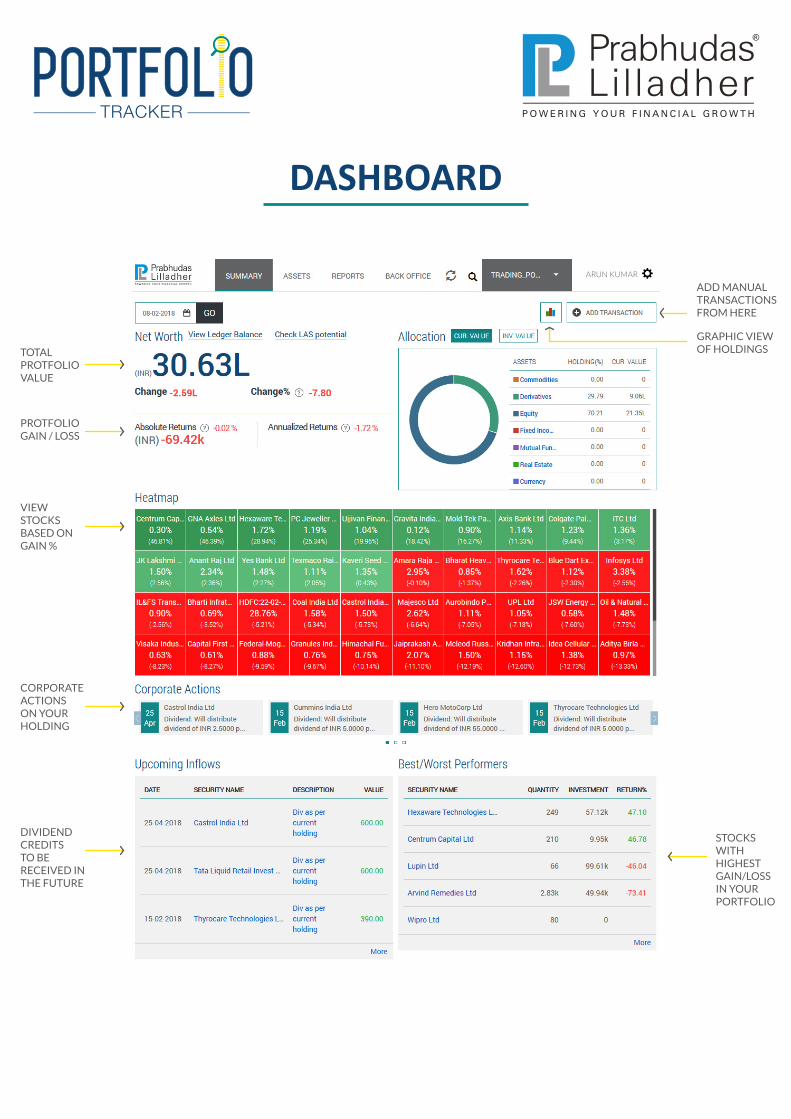
TOTAL PROTFOLIO VALUE
ADD MANUAL TRANSACTIONS FROM HERE
GRAPHIC VIEW OF HOLDINGS
PROTFOLIO GAIN / LOSS
VIEW STOCKS BASED ON GAIN %
CORPORATE ACTIONS ON YOUR HOLDING
DIVIDEND CREDITS TO BE RECEIVED IN THE FUTURE
STOCKS WITH HIGHEST GAIN/LOSS IN YOUR PORTFOLIO
ARUN KUMAR
DASHBOARD
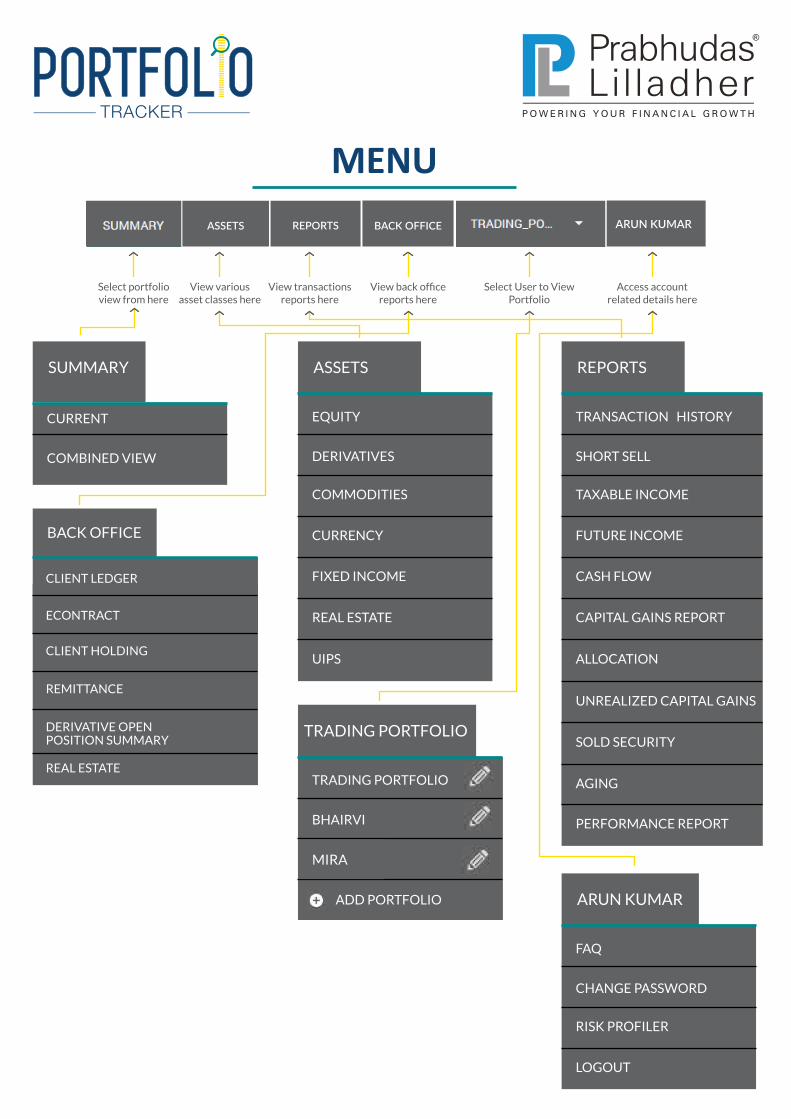
SUMMARY
CURRENT
COMBINED VIEW
ASSETS
EQUITY
DERIVATIVES
COMMODITIES
CURRENCY
FIXED INCOME
REAL ESTATE
UIPS
ARUN KUMAR
FAQ
CHANGE PASSWORD
RISK PROFILER
LOGOUT
FIXED INCOME
BACK OFFICE
CLIENT LEDGER
ECONTRACT
CLIENT HOLDING
REMITTANCE
DERIVATIVE OPEN POSITION SUMMARY
REAL ESTATE
REPORTS
TRANSACTION HISTORY
SHORT SELL
TAXABLE INCOME
FUTURE INCOME
CASH FLOW
UNREALIZED CAPITAL GAINS
CAPITAL GAINS REPORT
SOLD SECURITY
ALLOCATION
AGING
PERFORMANCE REPORT
TRADING PORTFOLIO
TRADING PORTFOLIO
BHAIRVI
RASHMI
ADD PORTFOLIO
MIRA
MENU
Select portfolio view from here
View various asset classes here
View transactions reports here
View back office reports here
Select User to View Portfolio
Access account related details here
ASSETS REPORTS BACK OFFICE ARUN KUMAR
1.) What is Portfolio tracker?
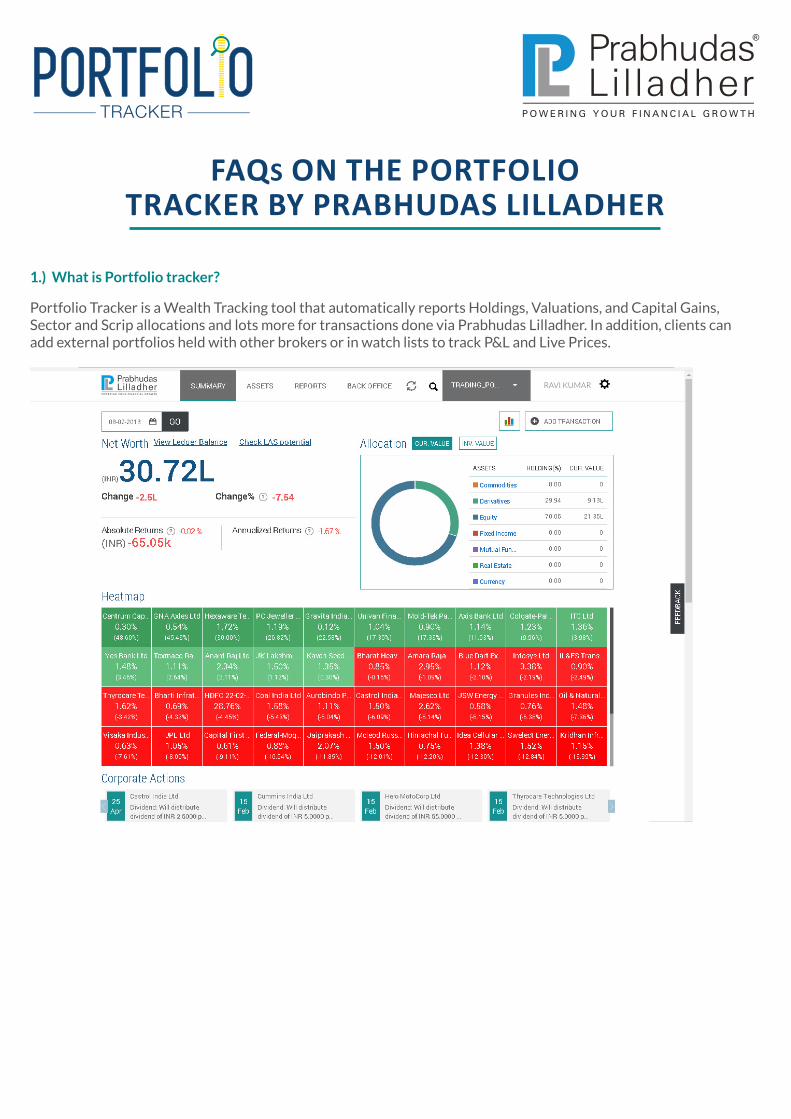
Portfolio Tracker is a Wealth Tracking tool that automatically reports Holdings, Valuations, and Capital Gains, Sector and Scrip allocations and lots more for transactions done via Prabhudas Lilladher. In addition, clients can add external portfolios held with other brokers or in watch lists to track P&L and Live Prices.
RAVI KUMAR
FAQS ON THE PORTFOLIO TRACKER BY PRABHUDAS LILLADHER
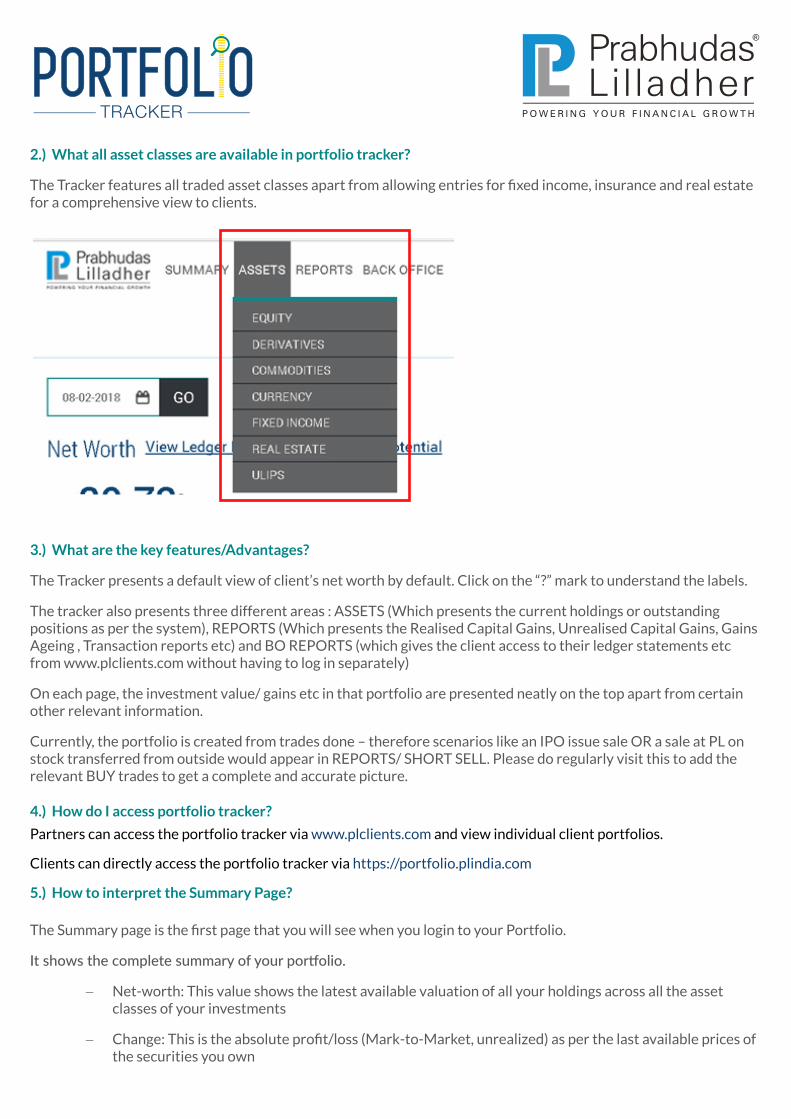
2.) What all asset classes are available in portfolio tracker?
The Tracker features all traded asset classes apart from allowing entries for fixed income, insurance and real estate for a comprehensive view to clients.
3.) What are the key features/Advantages?
The Tracker presents a default view of client’s net worth by default. Click on the “?” mark to understand the labels.
The tracker also presents three different areas : ASSETS (Which presents the current holdings or outstanding positions as per the system), REPORTS (Which presents the Realised Capital Gains, Unrealised Capital Gains, Gains Ageing , Transaction reports etc) and BO REPORTS (which gives the client access to their ledger statements etc from www.plclients.com without having to log in separately)
On each page, the investment value/ gains etc in that portfolio are presented neatly on the top apart from certain other relevant information.
Currently, the portfolio is created from trades done – therefore scenarios like an IPO issue sale OR a sale at PL on stock transferred from outside would appear in REPORTS/ SHORT SELL. Please do regularly visit this to add the relevant BUY trades to get a complete and accurate picture.
4.) How do I access portfolio tracker?
Partners can access the portfolio tracker via www.plclients.com and view individual client portfolios.
Clients can directly access the portfolio tracker via https://portfolio.plindia.com
5.) How to interpret the Summary Page?
The Summary page is the first page that you will see when you login to your Portfolio.
It shows the complete summary of your portfolio.
- Net-worth: This value shows the latest available valuation of all your holdings across all the asset classes of your investments
- Change: This is the absolute profit/loss (Mark-to-Market, unrealized) as per the last available prices of the securities you own
- Change%: The absolute profit/loss in percentage terms
- Allocation (Pie Chart): This pie chart shows the asset wise holdings and their investment values in a table alongside it.
- HEATMAP: This shows the performance of all the securities in your portfolio. The share of red of green indicates the return percentage and the width of the bar indicates the weight of the security in your portfolio.
- CORPORATE ACTIONS: This lists all the upcoming corporate actions for all the securities that are there in the portfolio.
- UPCOMING PAYMENTS: This table is the place where all the upcoming payments are listed. This list can include the rent from Real-Estate, interest payments from Fixed-Income securities, Dividend from equity and Distributions from Mutual Funds which have been declared but not yet paid.
- Best/Worst Performers: This table lists the parcels of stocks which would become eligible for Long Term Capital Gains (meaning complete one year of holding).
- As on Date: The date entry at the top allows you to select any previous date. The summary page will be calculated for the date that you enter and all the parameters will be as on the selected date.
- Chart Button: Clicking this button will expand/collapse the chart widget. The chart widget displays the comparative performance of the different asset classes held by you.
6.) How do transactions get updated in portfolio tracker?
Prabhudas Lilladher back office servers automatically update the day’s transactions records as per pre set schedules at the Portfolio Tracker site. The updations are done for trades in Equity, Commodities, and Currencies.
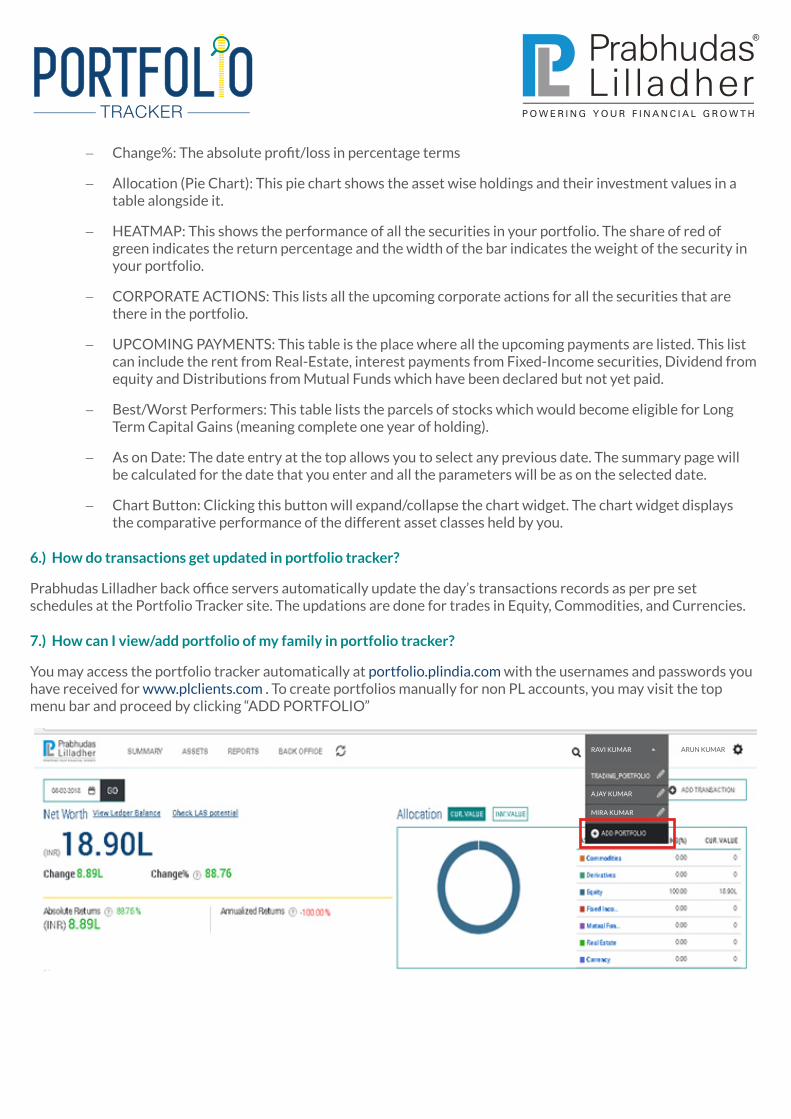
7.) How can I view/add portfolio of my family in portfolio tracker?
You may access the portfolio tracker automatically at portfolio.plindia.com with the usernames and passwords you have received for www.plclients.com . To create portfolios manually for non PL accounts, you may visit the top menu bar and proceed by clicking “ADD PORTFOLIO”
MIRA KUMAR
AJAY KUMAR
RAVI KUMAR ARUN KUMAR
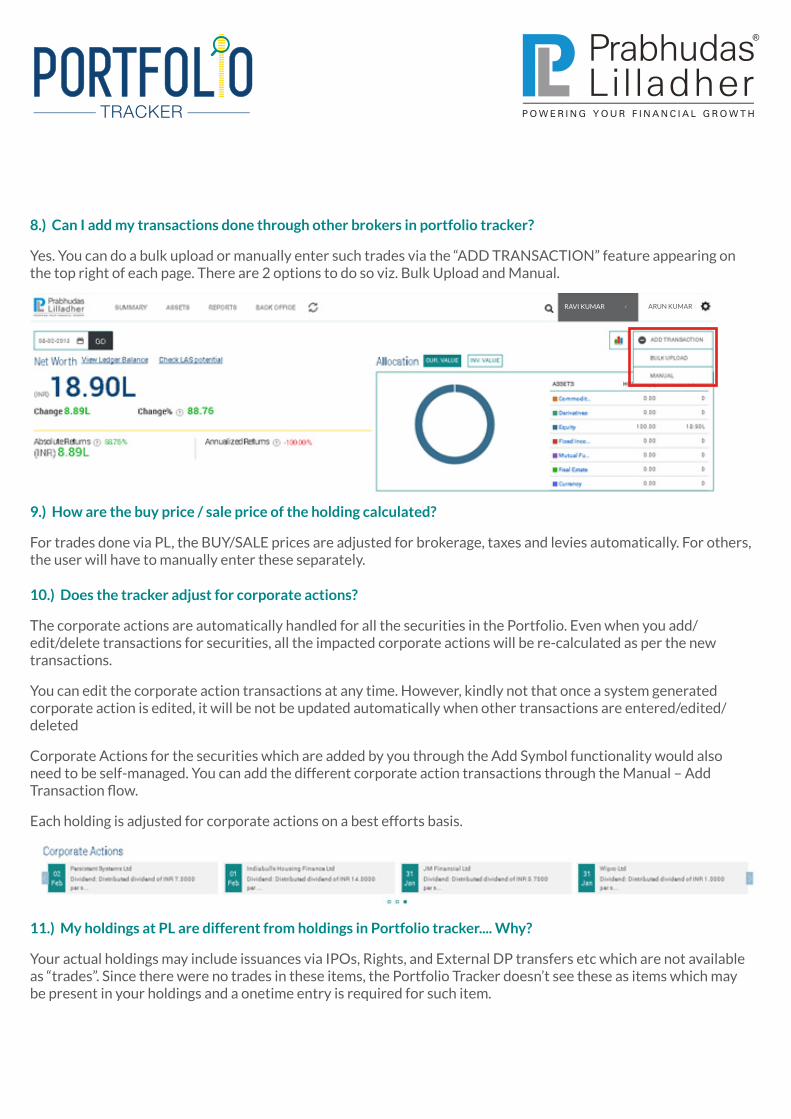
8.) Can I add my transactions done through other brokers in portfolio tracker?
Yes. You can do a bulk upload or manually enter such trades via the “ADD TRANSACTION” feature appearing on the top right of each page. There are 2 options to do so viz. Bulk Upload and Manual.
9.) How are the buy price / sale price of the holding calculated?
For trades done via PL, the BUY/SALE prices are adjusted for brokerage, taxes and levies automatically. For others, the user will have to manually enter these separately.
10.) Does the tracker adjust for corporate actions?
The corporate actions are automatically handled for all the securities in the Portfolio. Even when you add/edit/delete transactions for securities, all the impacted corporate actions will be re-calculated as per the new transactions.
You can edit the corporate action transactions at any time. However, kindly not that once a system generated corporate action is edited, it will be not be updated automatically when other transactions are entered/edited/deleted
Corporate Actions for the securities which are added by you through the Add Symbol functionality would also need to be self-managed. You can add the different corporate action transactions through the Manual – Add Transaction flow.
Each holding is adjusted for corporate actions on a best efforts basis.
11.) My holdings at PL are different from holdings in Portfolio tracker.... Why?
Your actual holdings may include issuances via IPOs, Rights, and External DP transfers etc which are not available as “trades”. Since there were no trades in these items, the Portfolio Tracker doesn’t see these as items which may be present in your holdings and a onetime entry is required for such item.
RAVI KUMAR ARUN KUMAR
12.) What happens to my stock transferred from another DP (Off market transfer) to PL?
You can add this manually using the “ADD TRANSACTION” feature.
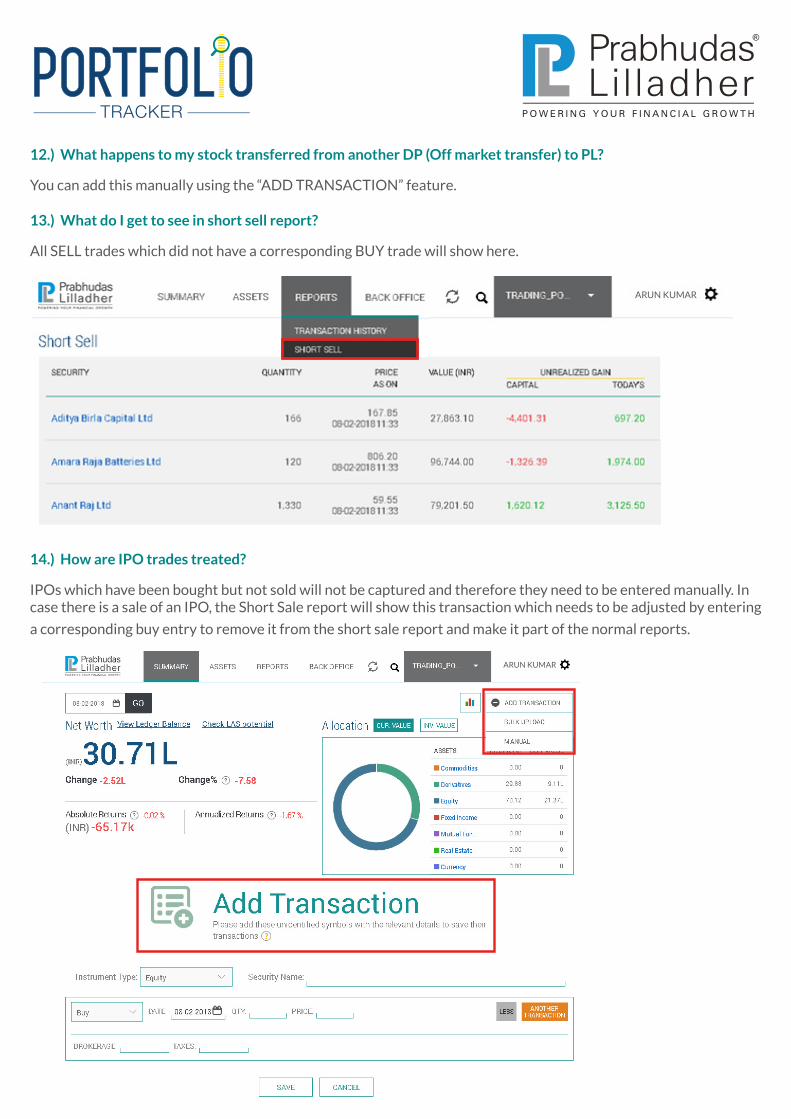
13.) What do I get to see in short sell report?
All SELL trades which did not have a corresponding BUY trade will show here.
14.) How are IPO trades treated?
IPOs which have been bought but not sold will not be captured and therefore they need to be entered manually. In case there is a sale of an IPO, the Short Sale report will show this transaction which needs to be adjusted by entering
a corresponding buy entry to remove it from the short sale report and make it part of the normal reports.
ARUN KUMAR
ARUN KUMAR
15.) What does Net worth mean?
Net Worth means the latest valuation available at portfolio.plindia.com for all the asset classes entered in the tracker. For untraded asset classes the client will have to enter market values manually. Also this is the latest valuation of holdings and doesn’t adjust for amounts owed to a broker or NBFC or a bank.
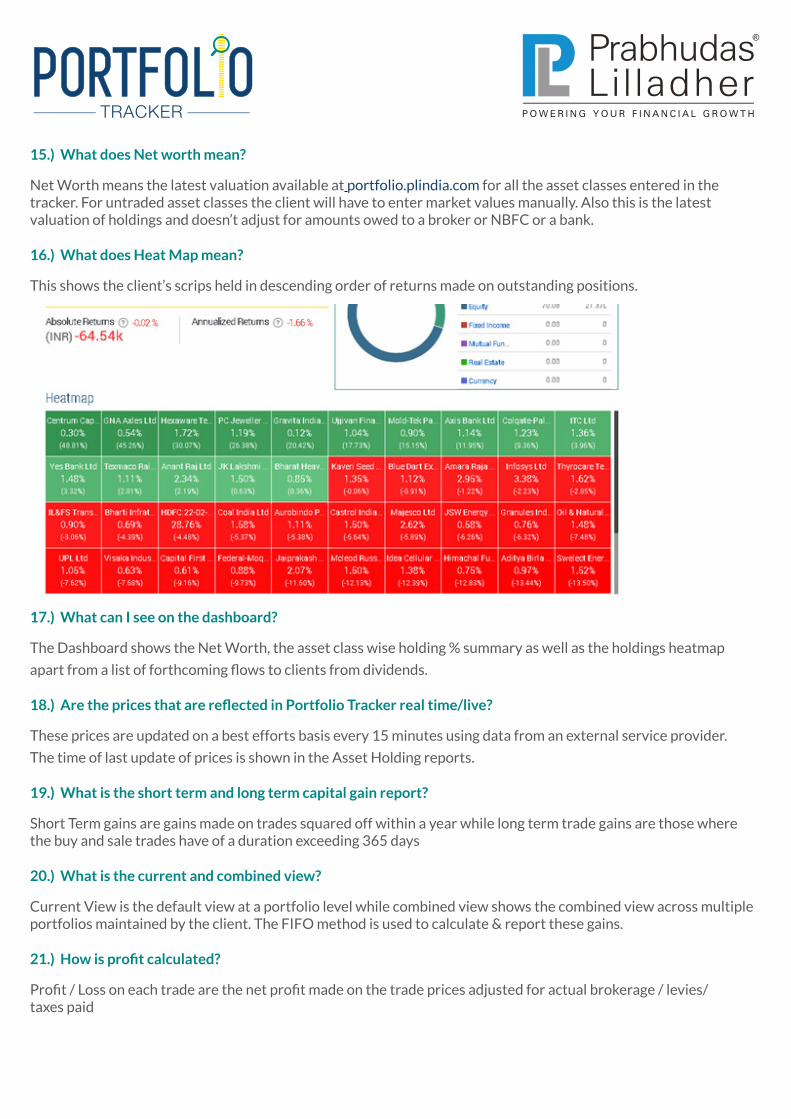
16.) What does Heat Map mean?
This shows the client’s scrips held in descending order of returns made on outstanding positions.
17.) What can I see on the dashboard?
The Dashboard shows the Net Worth, the asset class wise holding % summary as well as the holdings heatmap
apart from a list of forthcoming flows to clients from dividends.
18.) Are the prices that are reflected in Portfolio Tracker real time/live?
These prices are updated on a best efforts basis every 15 minutes using data from an external service provider.
The time of last update of prices is shown in the Asset Holding reports.
19.) What is the short term and long term capital gain report?
Short Term gains are gains made on trades squared off within a year while long term trade gains are those where the buy and sale trades have of a duration exceeding 365 days
20.) What is the current and combined view?
Current View is the default view at a portfolio level while combined view shows the combined view across multiple portfolios maintained by the client. The FIFO method is used to calculate & report these gains.
21.) How is profit calculated?
Profit / Loss on each trade are the net profit made on the trade prices adjusted for actual brokerage / levies/ taxes paid
22.) How are InvestActive trades treated?
The Portfolio Tracker will show trades consolidated across sub account types as a “combined report”. Clients can separate trades in the tracker by selecting “Product Type” from Capital Gains or Transactions reports.
23.) Can I see the valuation of my portfolio as of any previous dates?
Yes. Please visit the Asset View and then select the valuation as of any specific date.
24.) What do I do to change my incorrect transaction?
- At my end? : Please visit Short Sale report and check if there is any open sell transaction. If found, please add the respective buy transaction to correct the report.
- If still not solved, then what happens at PL’s end? : If still not resolved, please mail us at [email protected] for support.
25.) As a client, how can I get access to Portfolio Tracker?
All PL Clients automatically get access to the portfolio tracker one day after the first trade. They can visit portfolio.plindia.com and log in with their plclients.com credentials.
26.) What are speculative gains?
Intraday gains and losses are classified as “speculative”
27.) From which date can I see this data?
All trades done post April 1, 2008 are updated in the portfolio tracker and adjusted for corporate actions on a best efforts basis.
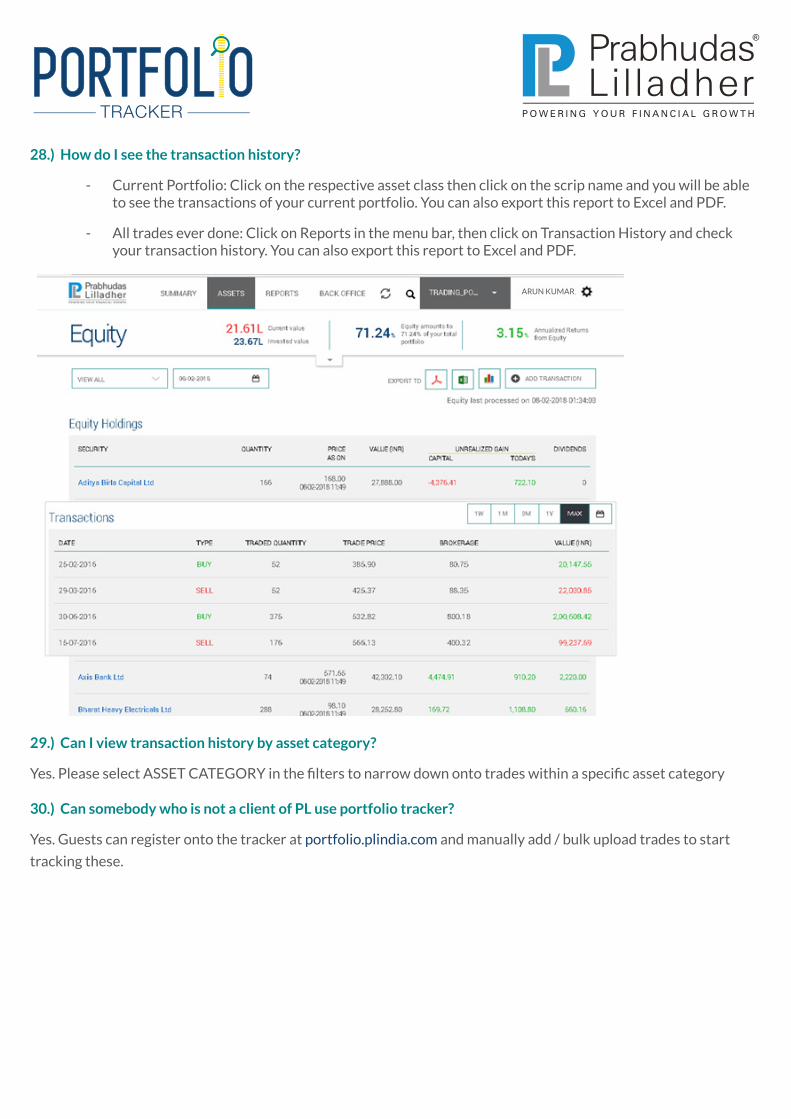
28.) How do I see the transaction history?
- Current Portfolio: Click on the respective asset class then click on the scrip name and you will be able to see the transactions of your current portfolio. You can also export this report to Excel and PDF.
- All trades ever done: Click on Reports in the menu bar, then click on Transaction History and check your transaction history. You can also export this report to Excel and PDF.
29.) Can I view transaction history by asset category?
Yes. Please select ASSET CATEGORY in the filters to narrow down onto trades within a specific asset category
30.) Can somebody who is not a client of PL use portfolio tracker?
Yes. Guests can register onto the tracker at portfolio.plindia.com and manually add / bulk upload trades to start
tracking these.
ARUN KUMAR
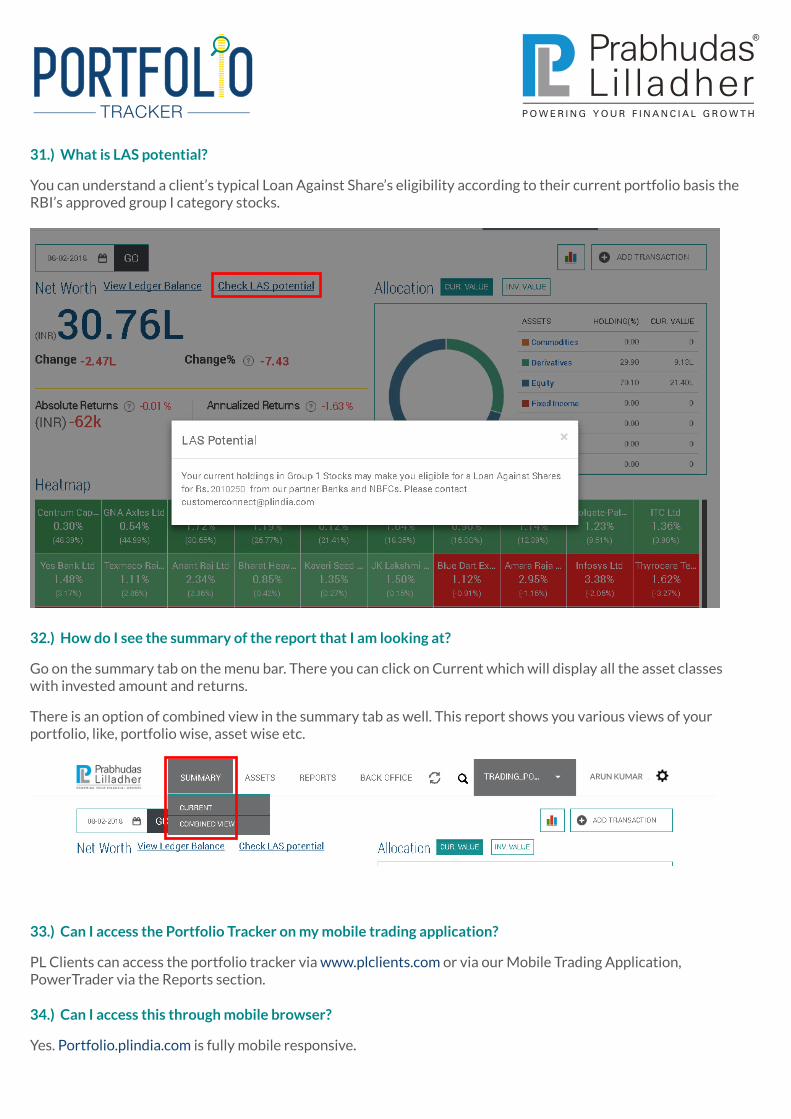
31.) What is LAS potential?
You can understand a client’s typical Loan Against Share’s eligibility according to their current portfolio basis the RBI’s approved group I category stocks.
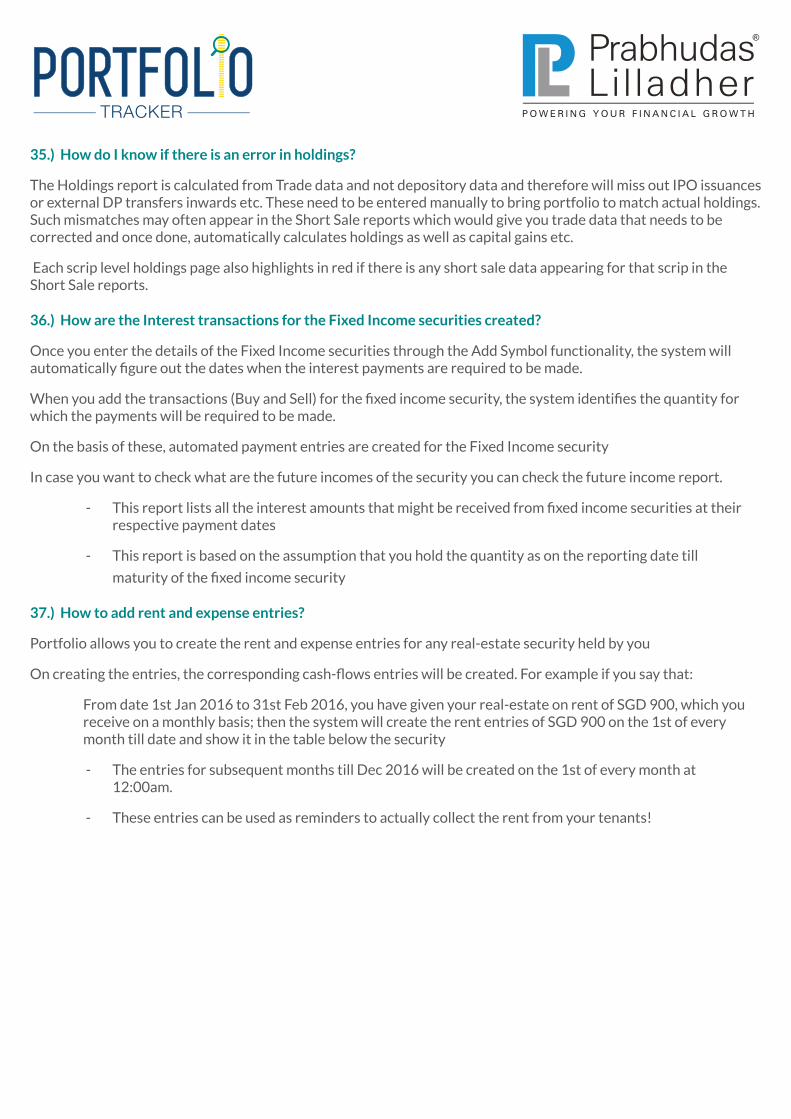
32.) How do I see the summary of the report that I am looking at?
Go on the summary tab on the menu bar. There you can click on Current which will display all the asset classes with invested amount and returns.
There is an option of combined view in the summary tab as well. This report shows you various views of your portfolio, like, portfolio wise, asset wise etc.
33.) Can I access the Portfolio Tracker on my mobile trading application?
PL Clients can access the portfolio tracker via www.plclients.com or via our Mobile Trading Application, PowerTrader via the Reports section.
34.) Can I access this through mobile browser?
Yes. Portfolio.plindia.com is fully mobile responsive.
ARUN KUMAR
35.) How do I know if there is an error in holdings?
The Holdings report is calculated from Trade data and not depository data and therefore will miss out IPO issuances or external DP transfers inwards etc. These need to be entered manually to bring portfolio to match actual holdings. Such mismatches may often appear in the Short Sale reports which would give you trade data that needs to be corrected and once done, automatically calculates holdings as well as capital gains etc.
Each scrip level holdings page also highlights in red if there is any short sale data appearing for that scrip in the Short Sale reports.
36.) How are the Interest transactions for the Fixed Income securities created?
Once you enter the details of the Fixed Income securities through the Add Symbol functionality, the system will automatically figure out the dates when the interest payments are required to be made.
When you add the transactions (Buy and Sell) for the fixed income security, the system identifies the quantity for which the payments will be required to be made.
On the basis of these, automated payment entries are created for the Fixed Income security
In case you want to check what are the future incomes of the security you can check the future income report.
- This report lists all the interest amounts that might be received from fixed income securities at their respective payment dates
- This report is based on the assumption that you hold the quantity as on the reporting date till
maturity of the fixed income security
37.) How to add rent and expense entries?
Portfolio allows you to create the rent and expense entries for any real-estate security held by you
On creating the entries, the corresponding cash-flows entries will be created. For example if you say that:
From date 1st Jan 2016 to 31st Feb 2016, you have given your real-estate on rent of SGD 900, which you receive on a monthly basis; then the system will create the rent entries of SGD 900 on the 1st of every month till date and show it in the table below the security
- The entries for subsequent months till Dec 2016 will be created on the 1st of every month at 12:00am.
- These entries can be used as reminders to actually collect the rent from your tenants!