Embed Size (px)
Citation preview
Plasma cell differentiation is coupled todivision-dependent DNA hypomethylation andgene regulationBenjamin G. Barwick, Emory UniversityChristopher Scharer, Emory UniversityAlexander P.R. Bally, Emory UniversityJeremy Boss, Emory University
Journal Title: Nature ImmunologyVolume: Volume 17, Number 10Publisher: Nature Publishing Group | 2016-10-01, Pages 1216-+Type of Work: Article | Post-print: After Peer ReviewPublisher DOI: 10.1038/ni.3519Permanent URL: https://pid.emory.edu/ark:/25593/rwwdw
Final published version: http://dx.doi.org/10.1038/ni.3519
Copyright information:© 2016 Nature America, Inc. All rights reserved.
Accessed April 2, 2022 9:49 AM EDT
Plasma cell differentiation is coupled to division-dependent DNA hypomethylation and gene regulation
Benjamin G. Barwick#1, Christopher D. Scharer#1, Alexander P.R. Bally1, and Jeremy M. Boss1,3
1Department of Microbiology & Immunology Emory University School of Medicine Atlanta, GA, USA
# These authors contributed equally to this work.
Abstract
The epigenetic processes that regulate antibody secreting plasma cells are not well understood.
Here, analysis of plasma cell differentiation revealed DNA hypomethylation of 10% of CpG loci
that were overrepresented at enhancers. Inhibition of DNA methylation enhanced plasma cell
commitment in a cell division-dependent manner. Examination of in vivo differentiating B cells
stratified by cell division revealed a 5-fold increase in mRNA transcription coupled to DNA
hypomethylation. Demethylation occurred first at binding motifs of NF-κB and AP-1 and later at
those for IRF and Oct-2, and were coincident with activation and differentiation gene expression
programs. These data provide mechanistic insight into the cell-division coupled transcriptional and
epigenetic reprogramming and suggest DNA hypomethylation reflects the cis-regulatory history of
plasma cell differentiation.
Resting naïve B cells rarely undergo mitosis1, do not secrete immunoglobulins (Ig) and
express only basal levels of transcripts2. Upon activation through the B cell receptor or Toll-
like receptors, B cells rapidly divide3 and differentiate into mitotically cycling plasmablasts,
post-mitotic terminally differentiated plasma cells or memory B cells4,5. Plasmablasts and
plasma cells actively secrete Ig whereas memory B cells do not, but have the potential to
rapidly differentiate upon subsequent antigen exposure. Despite the extensive study of B cell
and plasma cell transcriptional programming3,6, many mechanisms that govern
differentiation remain unknown. While B cell differentiation requires cell division4,5, the
number of divisions does not solely determine plasma cell fate5,7. This has led to a
Users may view, print, copy, and download text and data-mine the content in such documents, for the purposes of academic research, subject always to the full Conditions of use:http://www.nature.com/authors/editorial_policies/license.html#terms3Address Correspondence to: Jeremy M. Boss, Ph.D., [email protected], 404-727-5973 phone .
Accession codes.Gene expression and RRBS data are available in the Gene Expression Omnibus under accession GSE70294.
Author ContributionsBGB contributed to experiment conception and design, performed the DNA methylation analyses, mouse experiments, RNA-seq analysis, bioinformatic analyses, and wrote the paper. CDS contributed to experiment conception and design and performed the RNA microarray analysis. APRB provided technical expertise with mouse experiments. JMB contributed to experiment conception and design and wrote the paper. All authors provided editorial input.
Competing Financial InterestsAll authors declare no competing financial interests.
HHS Public AccessAuthor manuscriptNat Immunol. Author manuscript; available in PMC 2017 February 08.
Published in final edited form as:Nat Immunol. 2016 October ; 17(10): 1216–1225. doi:10.1038/ni.3519.
Author M
anuscriptA
uthor Manuscript
Author M
anuscriptA
uthor Manuscript
stochastic model of differentiation that is highly variable for individual B cells but leads to
balanced progeny fates at a population level5,7,8. One mechanism that could contribute to
such cellular heterogeneity is epigenetic variability. Epigenetic marks, such as DNA
methylation or histone modification, can enhance or repress gene transcription and are
mitotically heritable9,10. DNA methylation is necessary for hematopoietic stem cell renewal,
restricts myeloid differentiation and allows for B cell commitment11. During a B cell
immune response, DNA methylation was remodeled in germinal center and memory B cells
and plasma cells12–14. However, the breadth, timing and function of these epigenetic
changes in response to an in vivo stimulus are incompletely understood.
To gain insight into the epigenetic mechanisms that govern B cell differentiation, we used in vivo models to determine the direct relationships between DNA methylation, gene
expression and cell division. We found that B cell differentiation was associated with
targeted DNA hypomethylation and increased gene expression. Cell division was
accompanied by a hierarchy of DNA hypomethylation events at cis-regulatory elements that
corresponded with division-specific expression. Our results define a step-wise process of
division-coupled epigenomic remodeling that allows B cells to adopt a new transcriptional
program and cell fate.
Results
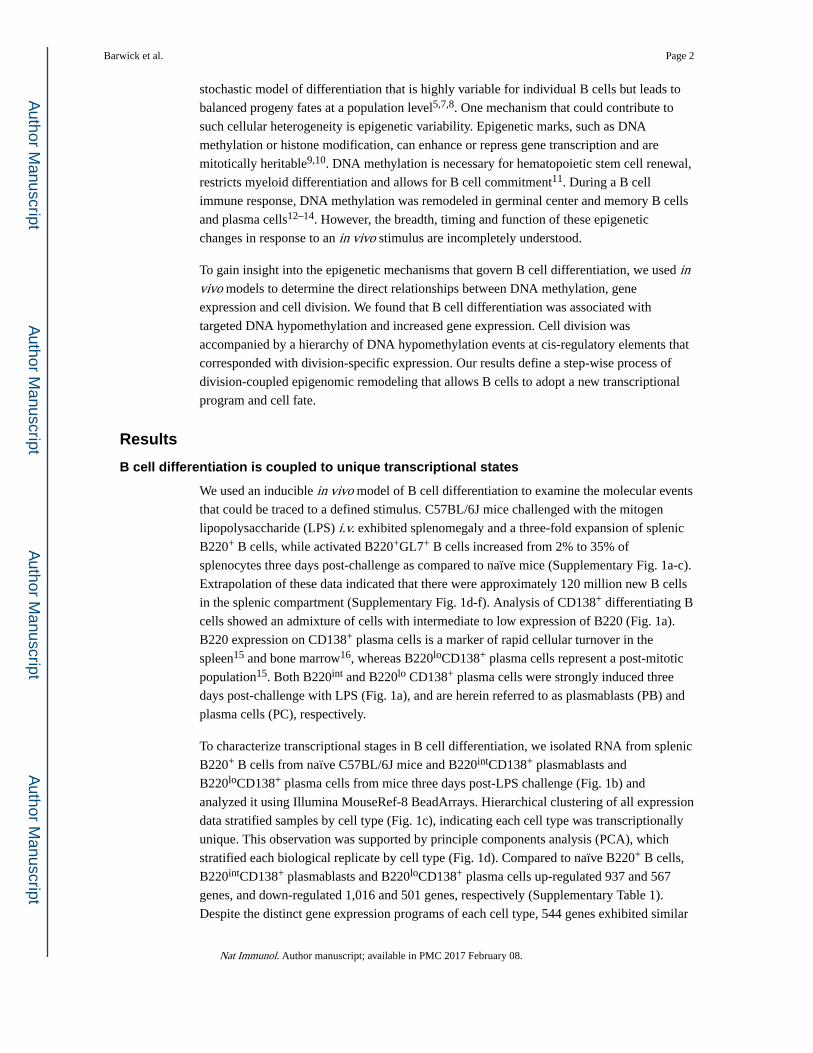
B cell differentiation is coupled to unique transcriptional states
We used an inducible in vivo model of B cell differentiation to examine the molecular events
that could be traced to a defined stimulus. C57BL/6J mice challenged with the mitogen
lipopolysaccharide (LPS) i.v. exhibited splenomegaly and a three-fold expansion of splenic
B220+ B cells, while activated B220+GL7+ B cells increased from 2% to 35% of
splenocytes three days post-challenge as compared to naïve mice (Supplementary Fig. 1a-c).
Extrapolation of these data indicated that there were approximately 120 million new B cells
in the splenic compartment (Supplementary Fig. 1d-f). Analysis of CD138+ differentiating B
cells showed an admixture of cells with intermediate to low expression of B220 (Fig. 1a).
B220 expression on CD138+ plasma cells is a marker of rapid cellular turnover in the
spleen15 and bone marrow16, whereas B220loCD138+ plasma cells represent a post-mitotic
population15. Both B220int and B220lo CD138+ plasma cells were strongly induced three
days post-challenge with LPS (Fig. 1a), and are herein referred to as plasmablasts (PB) and
plasma cells (PC), respectively.
To characterize transcriptional stages in B cell differentiation, we isolated RNA from splenic
B220+ B cells from naïve C57BL/6J mice and B220intCD138+ plasmablasts and
B220loCD138+ plasma cells from mice three days post-LPS challenge (Fig. 1b) and
analyzed it using Illumina MouseRef-8 BeadArrays. Hierarchical clustering of all expression
data stratified samples by cell type (Fig. 1c), indicating each cell type was transcriptionally
unique. This observation was supported by principle components analysis (PCA), which
stratified each biological replicate by cell type (Fig. 1d). Compared to naïve B220+ B cells,
B220intCD138+ plasmablasts and B220loCD138+ plasma cells up-regulated 937 and 567
genes, and down-regulated 1,016 and 501 genes, respectively (Supplementary Table 1).
Despite the distinct gene expression programs of each cell type, 544 genes exhibited similar
Barwick et al. Page 2
Nat Immunol. Author manuscript; available in PMC 2017 February 08.
Author M
anuscriptA
uthor Manuscript
Author M
anuscriptA
uthor Manuscript
regulation in plasmablasts and plasma cells as compared to naïve B220+ B cells (Fig. 1e).
Gene ontology annotation of genes commonly downregulated in both B220intCD138+
plasmablasts and B220loCD138+ plasma cells encoded products involved in hematopoiesis
(e.g. Hhex), immune system development (Bcl2, Irf8) and antigen presentation (Ciita, H2-
Aa, H2-Ab1, H2-Eb1). Genes upregulated uniquely in B220intCD138+ plasmablasts were
associated with mitosis and cellular division (Supplementary Table 2). These observations
were supported by gene set enrichment analysis (GSEA), which indicated B220intCD138+
plasmablast and B220loCD138+ plasma cell gene expression changes were similar to those
previously reported in humans17 and identified mitotic pathways as selectively enriched in
B220intCD138+ plasmablasts (Fig. 1f, Supplementary Table 3). These data show LPS
induces a robust B cell differentiation characterized by transcriptionally distinct
B220intCD138+ plasmablasts and B220loCD138+ plasma cells.
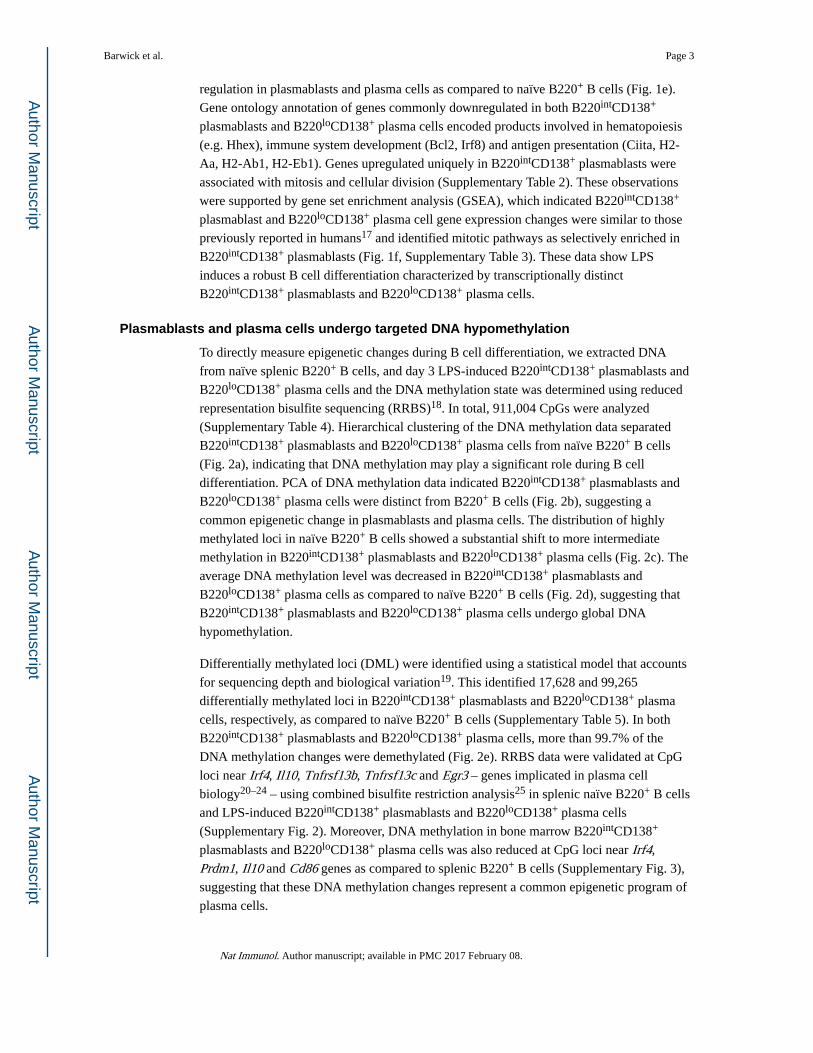
Plasmablasts and plasma cells undergo targeted DNA hypomethylation
To directly measure epigenetic changes during B cell differentiation, we extracted DNA
from naïve splenic B220+ B cells, and day 3 LPS-induced B220intCD138+ plasmablasts and
B220loCD138+ plasma cells and the DNA methylation state was determined using reduced
representation bisulfite sequencing (RRBS)18. In total, 911,004 CpGs were analyzed
(Supplementary Table 4). Hierarchical clustering of the DNA methylation data separated
B220intCD138+ plasmablasts and B220loCD138+ plasma cells from naïve B220+ B cells
(Fig. 2a), indicating that DNA methylation may play a significant role during B cell
differentiation. PCA of DNA methylation data indicated B220intCD138+ plasmablasts and
B220loCD138+ plasma cells were distinct from B220+ B cells (Fig. 2b), suggesting a
common epigenetic change in plasmablasts and plasma cells. The distribution of highly
methylated loci in naïve B220+ B cells showed a substantial shift to more intermediate
methylation in B220intCD138+ plasmablasts and B220loCD138+ plasma cells (Fig. 2c). The
average DNA methylation level was decreased in B220intCD138+ plasmablasts and
B220loCD138+ plasma cells as compared to naïve B220+ B cells (Fig. 2d), suggesting that
B220intCD138+ plasmablasts and B220loCD138+ plasma cells undergo global DNA
hypomethylation.
Differentially methylated loci (DML) were identified using a statistical model that accounts
for sequencing depth and biological variation19. This identified 17,628 and 99,265
differentially methylated loci in B220intCD138+ plasmablasts and B220loCD138+ plasma
cells, respectively, as compared to naïve B220+ B cells (Supplementary Table 5). In both
B220intCD138+ plasmablasts and B220loCD138+ plasma cells, more than 99.7% of the
DNA methylation changes were demethylated (Fig. 2e). RRBS data were validated at CpG
loci near Irf4, Il10, Tnfrsf13b, Tnfrsf13c and Egr3 – genes implicated in plasma cell
biology20–24 – using combined bisulfite restriction analysis25 in splenic naïve B220+ B cells
and LPS-induced B220intCD138+ plasmablasts and B220loCD138+ plasma cells
(Supplementary Fig. 2). Moreover, DNA methylation in bone marrow B220intCD138+
plasmablasts and B220loCD138+ plasma cells was also reduced at CpG loci near Irf4,
Prdm1, Il10 and Cd86 genes as compared to splenic B220+ B cells (Supplementary Fig. 3),
suggesting that these DNA methylation changes represent a common epigenetic program of
plasma cells.
Barwick et al. Page 3
Nat Immunol. Author manuscript; available in PMC 2017 February 08.
Author M
anuscriptA
uthor Manuscript
Author M
anuscriptA
uthor Manuscript
Although a large number of CpGs coordinately lost DNA methylation in both LPS-induced
splenic B220intCD138+ plasmablasts and B220loCD138+ plasma cells as compared to naïve
splenic B220+ B cells, 90% of the CpGs interrogated did not significantly change their
methylation state (Fig 2f), suggesting these changes were specific. In addition, there was a
substantial overlap of differentially methylated loci between B220intCD138+ plasmablasts
and B220loCD138+ plasma cells (Fig. 2g). Among these, demethylated loci included CpGs
around key genes expressed in plasma cells, such as Irf4, Prdm1 and Xbp1, while
methylated loci included important regulators of B cell differentiation such as Irf8 and Egr3 (Fig. 2g). Finally, differentially methylated loci were clustered into contiguous regions; that
is, more than 30% of plasmablast and 50% of plasma cell demethylated loci were adjacent to
at least one other demethylated loci relative to assay coverage (Fig. 2h). Examples of such
contiguous regions occurred at Irf4, a transcription factor necessary for B cell
differentiation26,27, and Arid3a, a gene known to regulate Ig heavy chain transcription28
(Fig. 2i). Other examples included regions around Prdm1, which encodes Blimp-1, a master
regulator of plasma cell fate29, and Cflar, a gene involved in the regulation of caspase-
induced apoptosis (data not shown). Together, these data identified a targeted DNA
hypomethylation that occurs during B cell differentiation, impacting ~10% of CpG loci
assayed.
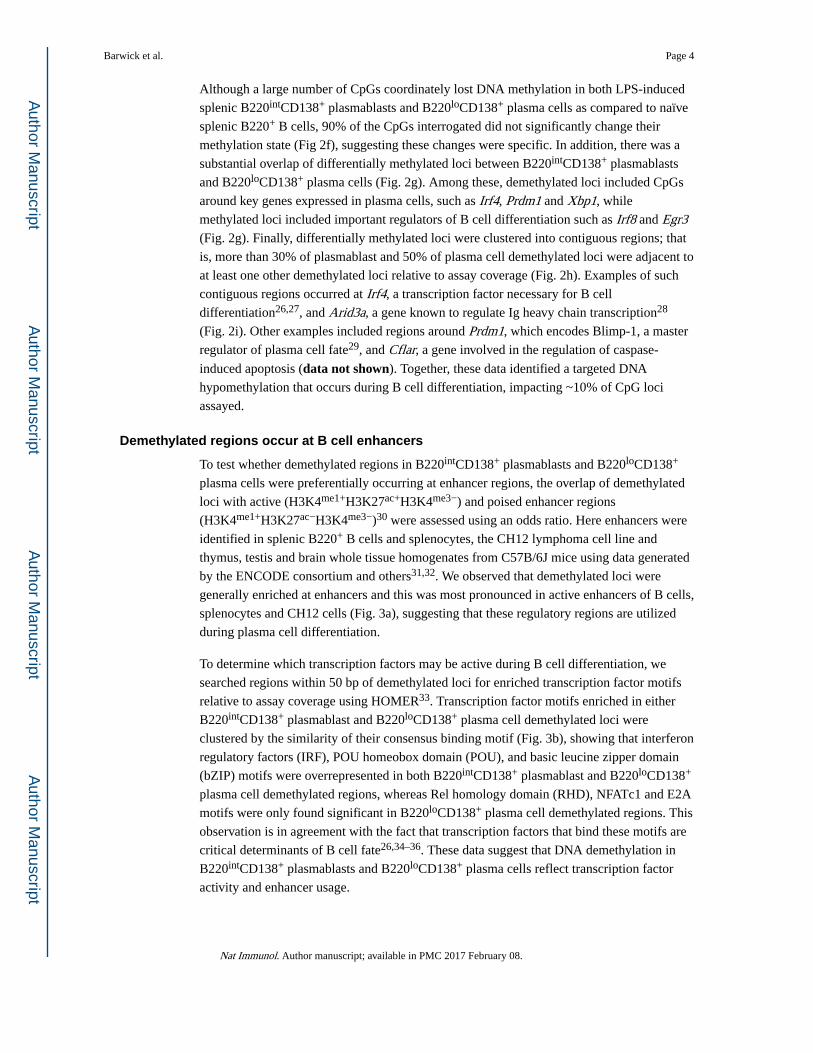
Demethylated regions occur at B cell enhancers
To test whether demethylated regions in B220intCD138+ plasmablasts and B220loCD138+
plasma cells were preferentially occurring at enhancer regions, the overlap of demethylated
loci with active (H3K4me1+H3K27ac+H3K4me3−) and poised enhancer regions
(H3K4me1+H3K27ac−H3K4me3−)30 were assessed using an odds ratio. Here enhancers were
identified in splenic B220+ B cells and splenocytes, the CH12 lymphoma cell line and
thymus, testis and brain whole tissue homogenates from C57B/6J mice using data generated
by the ENCODE consortium and others31,32. We observed that demethylated loci were
generally enriched at enhancers and this was most pronounced in active enhancers of B cells,
splenocytes and CH12 cells (Fig. 3a), suggesting that these regulatory regions are utilized
during plasma cell differentiation.
To determine which transcription factors may be active during B cell differentiation, we
searched regions within 50 bp of demethylated loci for enriched transcription factor motifs
relative to assay coverage using HOMER33. Transcription factor motifs enriched in either
B220intCD138+ plasmablast and B220loCD138+ plasma cell demethylated loci were
clustered by the similarity of their consensus binding motif (Fig. 3b), showing that interferon
regulatory factors (IRF), POU homeobox domain (POU), and basic leucine zipper domain
(bZIP) motifs were overrepresented in both B220intCD138+ plasmablast and B220loCD138+
plasma cell demethylated regions, whereas Rel homology domain (RHD), NFATc1 and E2A
motifs were only found significant in B220loCD138+ plasma cell demethylated regions. This
observation is in agreement with the fact that transcription factors that bind these motifs are
critical determinants of B cell fate26,34–36. These data suggest that DNA demethylation in
B220intCD138+ plasmablasts and B220loCD138+ plasma cells reflect transcription factor
activity and enhancer usage.
Barwick et al. Page 4
Nat Immunol. Author manuscript; available in PMC 2017 February 08.
Author M
anuscriptA
uthor Manuscript
Author M
anuscriptA
uthor Manuscript
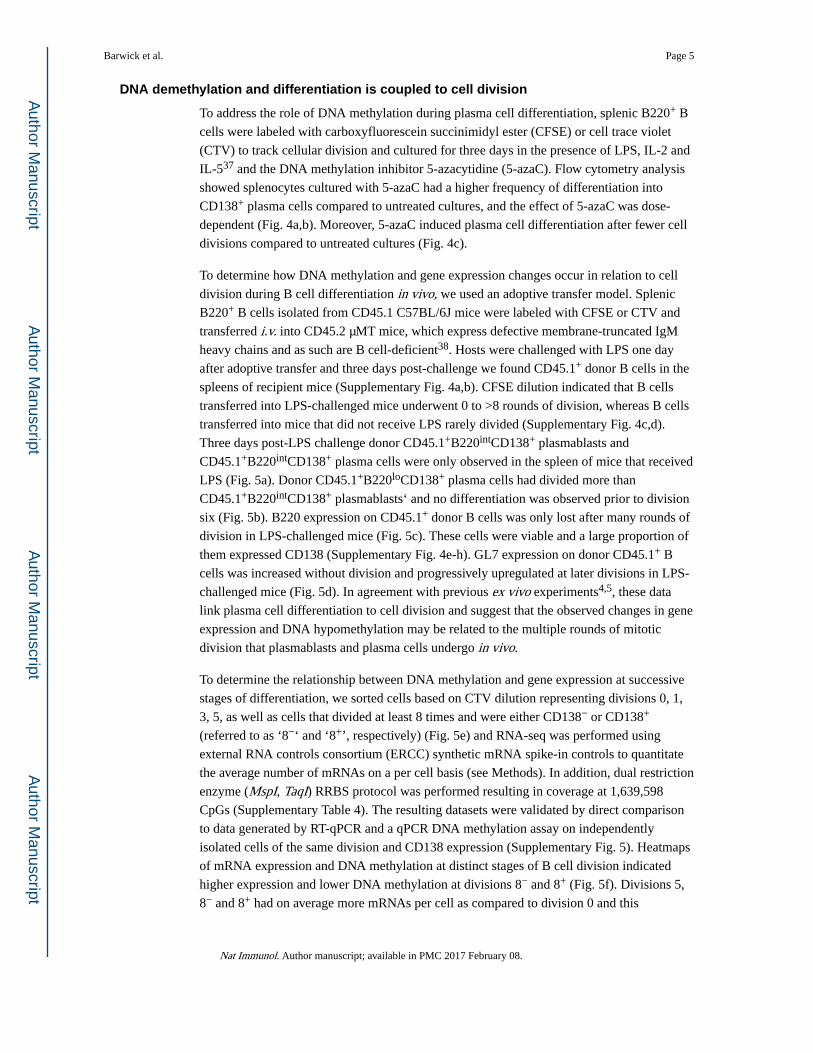
DNA demethylation and differentiation is coupled to cell division
To address the role of DNA methylation during plasma cell differentiation, splenic B220+ B
cells were labeled with carboxyfluorescein succinimidyl ester (CFSE) or cell trace violet
(CTV) to track cellular division and cultured for three days in the presence of LPS, IL-2 and
IL-537 and the DNA methylation inhibitor 5-azacytidine (5-azaC). Flow cytometry analysis
showed splenocytes cultured with 5-azaC had a higher frequency of differentiation into
CD138+ plasma cells compared to untreated cultures, and the effect of 5-azaC was dose-
dependent (Fig. 4a,b). Moreover, 5-azaC induced plasma cell differentiation after fewer cell
divisions compared to untreated cultures (Fig. 4c).
To determine how DNA methylation and gene expression changes occur in relation to cell
division during B cell differentiation in vivo, we used an adoptive transfer model. Splenic
B220+ B cells isolated from CD45.1 C57BL/6J mice were labeled with CFSE or CTV and
transferred i.v. into CD45.2 μMT mice, which express defective membrane-truncated IgM
heavy chains and as such are B cell-deficient38. Hosts were challenged with LPS one day
after adoptive transfer and three days post-challenge we found CD45.1+ donor B cells in the
spleens of recipient mice (Supplementary Fig. 4a,b). CFSE dilution indicated that B cells
transferred into LPS-challenged mice underwent 0 to >8 rounds of division, whereas B cells
transferred into mice that did not receive LPS rarely divided (Supplementary Fig. 4c,d).
Three days post-LPS challenge donor CD45.1+B220intCD138+ plasmablasts and
CD45.1+B220intCD138+ plasma cells were only observed in the spleen of mice that received
LPS (Fig. 5a). Donor CD45.1+B220loCD138+ plasma cells had divided more than
CD45.1+B220intCD138+ plasmablasts‘ and no differentiation was observed prior to division
six (Fig. 5b). B220 expression on CD45.1+ donor B cells was only lost after many rounds of
division in LPS-challenged mice (Fig. 5c). These cells were viable and a large proportion of
them expressed CD138 (Supplementary Fig. 4e-h). GL7 expression on donor CD45.1+ B
cells was increased without division and progressively upregulated at later divisions in LPS-
challenged mice (Fig. 5d). In agreement with previous ex vivo experiments4,5, these data
link plasma cell differentiation to cell division and suggest that the observed changes in gene
expression and DNA hypomethylation may be related to the multiple rounds of mitotic
division that plasmablasts and plasma cells undergo in vivo.
To determine the relationship between DNA methylation and gene expression at successive
stages of differentiation, we sorted cells based on CTV dilution representing divisions 0, 1,
3, 5, as well as cells that divided at least 8 times and were either CD138− or CD138+
(referred to as ‘8−‘ and ‘8+’, respectively) (Fig. 5e) and RNA-seq was performed using
external RNA controls consortium (ERCC) synthetic mRNA spike-in controls to quantitate
the average number of mRNAs on a per cell basis (see Methods). In addition, dual restriction
enzyme (MspI, TaqI) RRBS protocol was performed resulting in coverage at 1,639,598
CpGs (Supplementary Table 4). The resulting datasets were validated by direct comparison
to data generated by RT-qPCR and a qPCR DNA methylation assay on independently
isolated cells of the same division and CD138 expression (Supplementary Fig. 5). Heatmaps
of mRNA expression and DNA methylation at distinct stages of B cell division indicated
higher expression and lower DNA methylation at divisions 8− and 8+ (Fig. 5f). Divisions 5,
8− and 8+ had on average more mRNAs per cell as compared to division 0 and this
Barwick et al. Page 5
Nat Immunol. Author manuscript; available in PMC 2017 February 08.
Author M
anuscriptA
uthor Manuscript
Author M
anuscriptA
uthor Manuscript
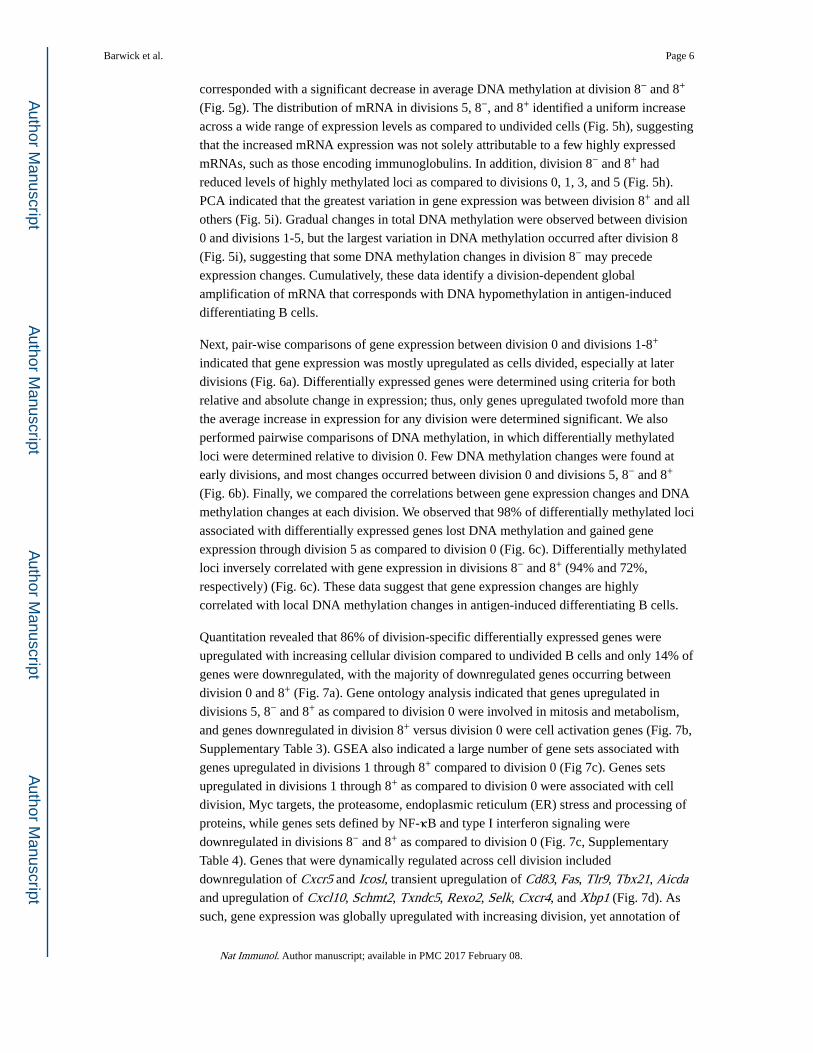
corresponded with a significant decrease in average DNA methylation at division 8− and 8+
(Fig. 5g). The distribution of mRNA in divisions 5, 8−, and 8+ identified a uniform increase
across a wide range of expression levels as compared to undivided cells (Fig. 5h), suggesting
that the increased mRNA expression was not solely attributable to a few highly expressed
mRNAs, such as those encoding immunoglobulins. In addition, division 8− and 8+ had
reduced levels of highly methylated loci as compared to divisions 0, 1, 3, and 5 (Fig. 5h).
PCA indicated that the greatest variation in gene expression was between division 8+ and all
others (Fig. 5i). Gradual changes in total DNA methylation were observed between division
0 and divisions 1-5, but the largest variation in DNA methylation occurred after division 8
(Fig. 5i), suggesting that some DNA methylation changes in division 8− may precede
expression changes. Cumulatively, these data identify a division-dependent global
amplification of mRNA that corresponds with DNA hypomethylation in antigen-induced
differentiating B cells.
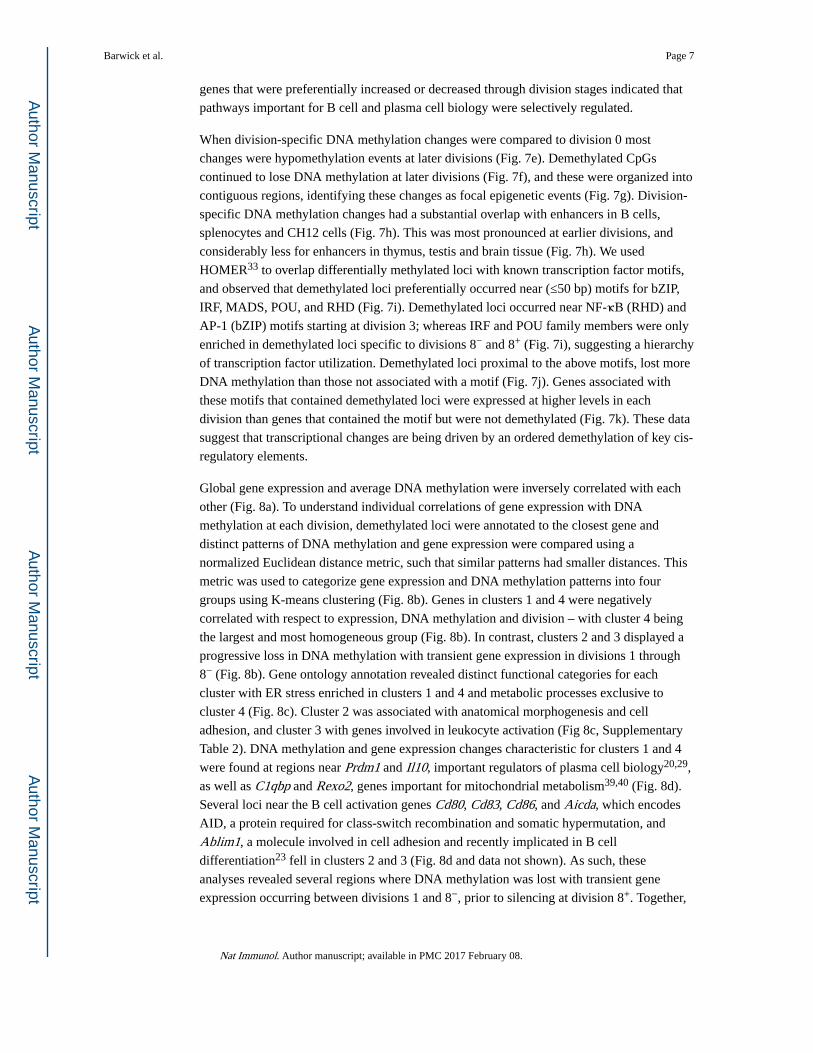
Next, pair-wise comparisons of gene expression between division 0 and divisions 1-8+
indicated that gene expression was mostly upregulated as cells divided, especially at later
divisions (Fig. 6a). Differentially expressed genes were determined using criteria for both
relative and absolute change in expression; thus, only genes upregulated twofold more than
the average increase in expression for any division were determined significant. We also
performed pairwise comparisons of DNA methylation, in which differentially methylated
loci were determined relative to division 0. Few DNA methylation changes were found at
early divisions, and most changes occurred between division 0 and divisions 5, 8− and 8+
(Fig. 6b). Finally, we compared the correlations between gene expression changes and DNA
methylation changes at each division. We observed that 98% of differentially methylated loci
associated with differentially expressed genes lost DNA methylation and gained gene
expression through division 5 as compared to division 0 (Fig. 6c). Differentially methylated
loci inversely correlated with gene expression in divisions 8− and 8+ (94% and 72%,
respectively) (Fig. 6c). These data suggest that gene expression changes are highly
correlated with local DNA methylation changes in antigen-induced differentiating B cells.
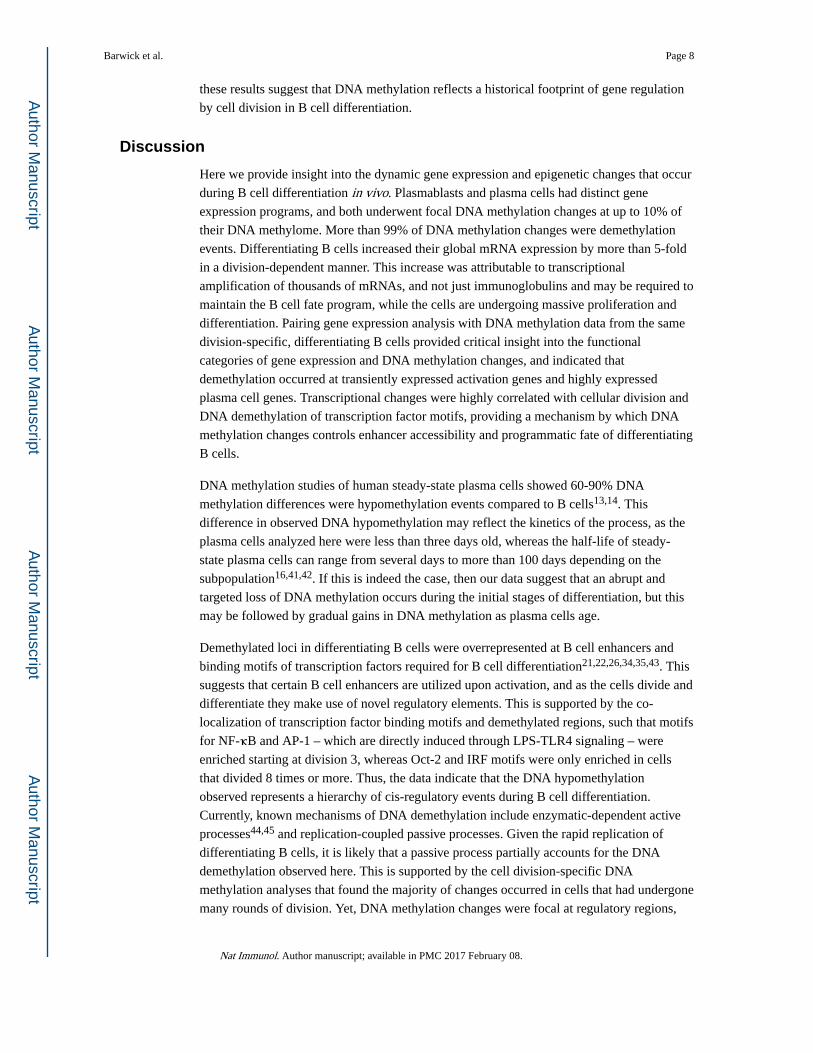
Quantitation revealed that 86% of division-specific differentially expressed genes were
upregulated with increasing cellular division compared to undivided B cells and only 14% of
genes were downregulated, with the majority of downregulated genes occurring between
division 0 and 8+ (Fig. 7a). Gene ontology analysis indicated that genes upregulated in
divisions 5, 8− and 8+ as compared to division 0 were involved in mitosis and metabolism,
and genes downregulated in division 8+ versus division 0 were cell activation genes (Fig. 7b,
Supplementary Table 3). GSEA also indicated a large number of gene sets associated with
genes upregulated in divisions 1 through 8+ compared to division 0 (Fig 7c). Genes sets
upregulated in divisions 1 through 8+ as compared to division 0 were associated with cell
division, Myc targets, the proteasome, endoplasmic reticulum (ER) stress and processing of
proteins, while genes sets defined by NF-κB and type I interferon signaling were
downregulated in divisions 8− and 8+ as compared to division 0 (Fig. 7c, Supplementary
Table 4). Genes that were dynamically regulated across cell division included
downregulation of Cxcr5 and Icosl, transient upregulation of Cd83, Fas, Tlr9, Tbx21, Aicda and upregulation of Cxcl10, Schmt2, Txndc5, Rexo2, Selk, Cxcr4, and Xbp1 (Fig. 7d). As
such, gene expression was globally upregulated with increasing division, yet annotation of
Barwick et al. Page 6
Nat Immunol. Author manuscript; available in PMC 2017 February 08.
Author M
anuscriptA
uthor Manuscript
Author M
anuscriptA
uthor Manuscript
genes that were preferentially increased or decreased through division stages indicated that
pathways important for B cell and plasma cell biology were selectively regulated.
When division-specific DNA methylation changes were compared to division 0 most
changes were hypomethylation events at later divisions (Fig. 7e). Demethylated CpGs
continued to lose DNA methylation at later divisions (Fig. 7f), and these were organized into
contiguous regions, identifying these changes as focal epigenetic events (Fig. 7g). Division-
specific DNA methylation changes had a substantial overlap with enhancers in B cells,
splenocytes and CH12 cells (Fig. 7h). This was most pronounced at earlier divisions, and
considerably less for enhancers in thymus, testis and brain tissue (Fig. 7h). We used
HOMER33 to overlap differentially methylated loci with known transcription factor motifs,
and observed that demethylated loci preferentially occurred near (≤50 bp) motifs for bZIP,
IRF, MADS, POU, and RHD (Fig. 7i). Demethylated loci occurred near NF-κB (RHD) and
AP-1 (bZIP) motifs starting at division 3; whereas IRF and POU family members were only
enriched in demethylated loci specific to divisions 8− and 8+ (Fig. 7i), suggesting a hierarchy
of transcription factor utilization. Demethylated loci proximal to the above motifs, lost more
DNA methylation than those not associated with a motif (Fig. 7j). Genes associated with
these motifs that contained demethylated loci were expressed at higher levels in each
division than genes that contained the motif but were not demethylated (Fig. 7k). These data
suggest that transcriptional changes are being driven by an ordered demethylation of key cis-
regulatory elements.
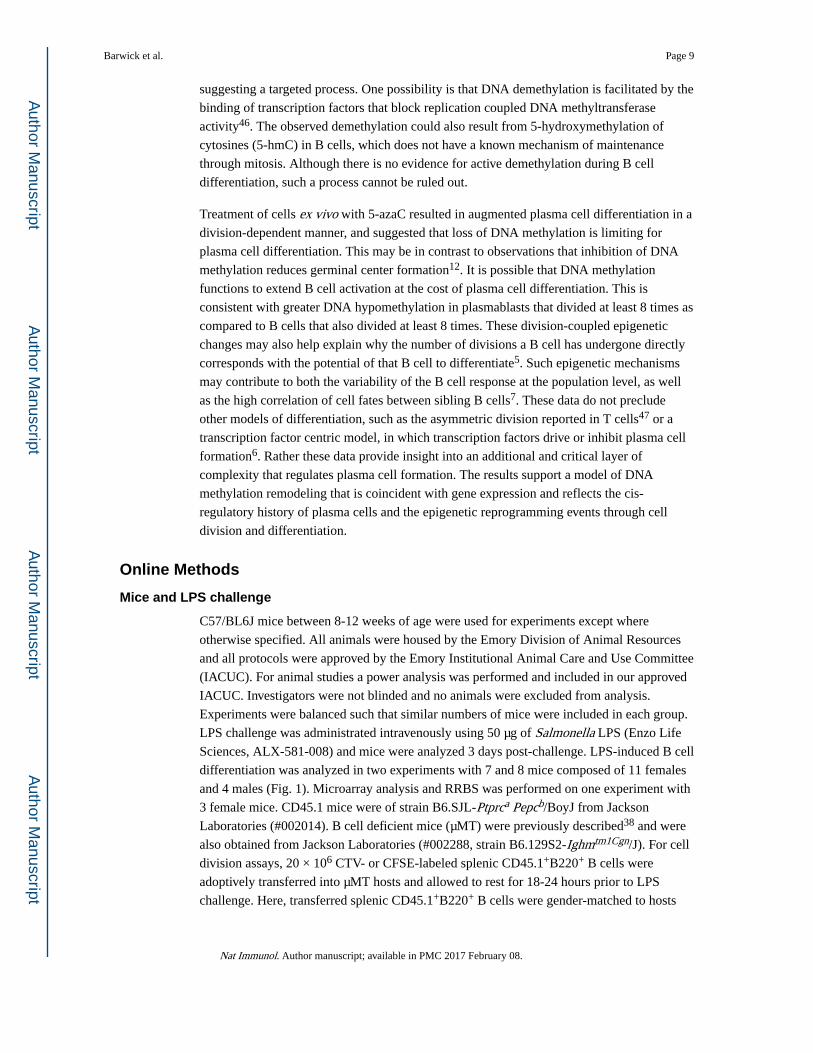
Global gene expression and average DNA methylation were inversely correlated with each
other (Fig. 8a). To understand individual correlations of gene expression with DNA
methylation at each division, demethylated loci were annotated to the closest gene and
distinct patterns of DNA methylation and gene expression were compared using a
normalized Euclidean distance metric, such that similar patterns had smaller distances. This
metric was used to categorize gene expression and DNA methylation patterns into four
groups using K-means clustering (Fig. 8b). Genes in clusters 1 and 4 were negatively
correlated with respect to expression, DNA methylation and division – with cluster 4 being
the largest and most homogeneous group (Fig. 8b). In contrast, clusters 2 and 3 displayed a
progressive loss in DNA methylation with transient gene expression in divisions 1 through
8− (Fig. 8b). Gene ontology annotation revealed distinct functional categories for each
cluster with ER stress enriched in clusters 1 and 4 and metabolic processes exclusive to
cluster 4 (Fig. 8c). Cluster 2 was associated with anatomical morphogenesis and cell
adhesion, and cluster 3 with genes involved in leukocyte activation (Fig 8c, Supplementary
Table 2). DNA methylation and gene expression changes characteristic for clusters 1 and 4
were found at regions near Prdm1 and Il10, important regulators of plasma cell biology20,29,
as well as C1qbp and Rexo2, genes important for mitochondrial metabolism39,40 (Fig. 8d).
Several loci near the B cell activation genes Cd80, Cd83, Cd86, and Aicda, which encodes
AID, a protein required for class-switch recombination and somatic hypermutation, and
Ablim1, a molecule involved in cell adhesion and recently implicated in B cell
differentiation23 fell in clusters 2 and 3 (Fig. 8d and data not shown). As such, these
analyses revealed several regions where DNA methylation was lost with transient gene
expression occurring between divisions 1 and 8−, prior to silencing at division 8+. Together,
Barwick et al. Page 7
Nat Immunol. Author manuscript; available in PMC 2017 February 08.
Author M
anuscriptA
uthor Manuscript
Author M
anuscriptA
uthor Manuscript
these results suggest that DNA methylation reflects a historical footprint of gene regulation
by cell division in B cell differentiation.
Discussion
Here we provide insight into the dynamic gene expression and epigenetic changes that occur
during B cell differentiation in vivo. Plasmablasts and plasma cells had distinct gene
expression programs, and both underwent focal DNA methylation changes at up to 10% of
their DNA methylome. More than 99% of DNA methylation changes were demethylation
events. Differentiating B cells increased their global mRNA expression by more than 5-fold
in a division-dependent manner. This increase was attributable to transcriptional
amplification of thousands of mRNAs, and not just immunoglobulins and may be required to
maintain the B cell fate program, while the cells are undergoing massive proliferation and
differentiation. Pairing gene expression analysis with DNA methylation data from the same
division-specific, differentiating B cells provided critical insight into the functional
categories of gene expression and DNA methylation changes, and indicated that
demethylation occurred at transiently expressed activation genes and highly expressed
plasma cell genes. Transcriptional changes were highly correlated with cellular division and
DNA demethylation of transcription factor motifs, providing a mechanism by which DNA
methylation changes controls enhancer accessibility and programmatic fate of differentiating
B cells.
DNA methylation studies of human steady-state plasma cells showed 60-90% DNA
methylation differences were hypomethylation events compared to B cells13,14. This
difference in observed DNA hypomethylation may reflect the kinetics of the process, as the
plasma cells analyzed here were less than three days old, whereas the half-life of steady-
state plasma cells can range from several days to more than 100 days depending on the
subpopulation16,41,42. If this is indeed the case, then our data suggest that an abrupt and
targeted loss of DNA methylation occurs during the initial stages of differentiation, but this
may be followed by gradual gains in DNA methylation as plasma cells age.
Demethylated loci in differentiating B cells were overrepresented at B cell enhancers and
binding motifs of transcription factors required for B cell differentiation21,22,26,34,35,43. This
suggests that certain B cell enhancers are utilized upon activation, and as the cells divide and
differentiate they make use of novel regulatory elements. This is supported by the co-
localization of transcription factor binding motifs and demethylated regions, such that motifs
for NF-κB and AP-1 – which are directly induced through LPS-TLR4 signaling – were
enriched starting at division 3, whereas Oct-2 and IRF motifs were only enriched in cells
that divided 8 times or more. Thus, the data indicate that the DNA hypomethylation
observed represents a hierarchy of cis-regulatory events during B cell differentiation.
Currently, known mechanisms of DNA demethylation include enzymatic-dependent active
processes44,45 and replication-coupled passive processes. Given the rapid replication of
differentiating B cells, it is likely that a passive process partially accounts for the DNA
demethylation observed here. This is supported by the cell division-specific DNA
methylation analyses that found the majority of changes occurred in cells that had undergone
many rounds of division. Yet, DNA methylation changes were focal at regulatory regions,
Barwick et al. Page 8
Nat Immunol. Author manuscript; available in PMC 2017 February 08.
Author M
anuscriptA
uthor Manuscript
Author M
anuscriptA
uthor Manuscript
suggesting a targeted process. One possibility is that DNA demethylation is facilitated by the
binding of transcription factors that block replication coupled DNA methyltransferase
activity46. The observed demethylation could also result from 5-hydroxymethylation of
cytosines (5-hmC) in B cells, which does not have a known mechanism of maintenance
through mitosis. Although there is no evidence for active demethylation during B cell
differentiation, such a process cannot be ruled out.
Treatment of cells ex vivo with 5-azaC resulted in augmented plasma cell differentiation in a
division-dependent manner, and suggested that loss of DNA methylation is limiting for
plasma cell differentiation. This may be in contrast to observations that inhibition of DNA
methylation reduces germinal center formation12. It is possible that DNA methylation
functions to extend B cell activation at the cost of plasma cell differentiation. This is
consistent with greater DNA hypomethylation in plasmablasts that divided at least 8 times as
compared to B cells that also divided at least 8 times. These division-coupled epigenetic
changes may also help explain why the number of divisions a B cell has undergone directly
corresponds with the potential of that B cell to differentiate5. Such epigenetic mechanisms
may contribute to both the variability of the B cell response at the population level, as well
as the high correlation of cell fates between sibling B cells7. These data do not preclude
other models of differentiation, such as the asymmetric division reported in T cells47 or a
transcription factor centric model, in which transcription factors drive or inhibit plasma cell
formation6. Rather these data provide insight into an additional and critical layer of
complexity that regulates plasma cell formation. The results support a model of DNA
methylation remodeling that is coincident with gene expression and reflects the cis-
regulatory history of plasma cells and the epigenetic reprogramming events through cell
division and differentiation.
Online Methods
Mice and LPS challenge
C57/BL6J mice between 8-12 weeks of age were used for experiments except where
otherwise specified. All animals were housed by the Emory Division of Animal Resources
and all protocols were approved by the Emory Institutional Animal Care and Use Committee
(IACUC). For animal studies a power analysis was performed and included in our approved
IACUC. Investigators were not blinded and no animals were excluded from analysis.
Experiments were balanced such that similar numbers of mice were included in each group.
LPS challenge was administrated intravenously using 50 μg of Salmonella LPS (Enzo Life
Sciences, ALX-581-008) and mice were analyzed 3 days post-challenge. LPS-induced B cell
differentiation was analyzed in two experiments with 7 and 8 mice composed of 11 females
and 4 males (Fig. 1). Microarray analysis and RRBS was performed on one experiment with
3 female mice. CD45.1 mice were of strain B6.SJL-Ptprca Pepcb/BoyJ from Jackson
Laboratories (#002014). B cell deficient mice (μMT) were previously described38 and were
also obtained from Jackson Laboratories (#002288, strain B6.129S2-Ighmtm1Cgn/J). For cell
division assays, 20 × 106 CTV- or CFSE-labeled splenic CD45.1+B220+ B cells were
adoptively transferred into μMT hosts and allowed to rest for 18-24 hours prior to LPS
challenge. Here, transferred splenic CD45.1+B220+ B cells were gender-matched to hosts
Barwick et al. Page 9
Nat Immunol. Author manuscript; available in PMC 2017 February 08.
Author M
anuscriptA
uthor Manuscript
Author M
anuscriptA
uthor Manuscript
and this was performed in three experiments that included 3, 6 (Fig. 5a-d) and 4 mice (Fig.
5e-i) composed of 3 males and 10 females.
Cell Isolation and flow cytometric analysis
Splenic cell suspensions were made by mechanically forcing spleens through a 40 μm filter
and lysing red blood cells with ACK lysis buffer (0.15 M NH4Cl, 10 mM KHCO3, 0.1 mM
EDTA) for 30 seconds prior to quenching the reaction with 4 volumes RPMI 1640 media
(Corning Cellgro) supplemented with 10% heat-inactivated fetal bovine serum (Sigma-
Aldrich), 1% MEM - non essential amino acids, 100 μM Na pyruvate (Sigma), 10 mM
HEPES pH 7.3 (Sigma), 0.0035% β-mercaptoethanol (Sigma-Aldrich). Cells were washed
and resuspended at 107 cells / ml in PBS with 1% BSA and 2 mM EDTA. Validation data for
all antibodies used are available on the manufacturer’s website. Prior to staining, cells were
blocked with anti-Fc (anti-CD16/CD32) (Tonbo Biosciences, 2.4G2) at a final concentration
of 0.25 μg / 106 cells for 15 minutes on ice. Staining panels included anti-CD11b (Tonbo
Biosciences M1/70) and anti-CD11c (Tonbo Biosciences N418) conjugated to FITC or
PerCP-Cy5.5 each at a concentration of 0.25 μg / 106 cells to remove autofluorescent
macrophages. The following stains, antibodies-fluorophore combinations were used to
assess cellular phenotype: anti-B220-PerCP-Cy5.5 or -PE-Cy7 (Tonbo Biosciences,
RA3-6B2) at 0.05 μg / 106 cells; anti-CD43-FITC (BD #553270) at 0.125 μg / 106 cells;
anti-CD138-PE, -BV421, or -BV711 (BD, 281-2) at 0.025 μg / 106 cells; anti-GL7-
eFluor660 (eBioscience GL-7) at 0.025 μg / 106 cells; anti-CD45.1-APC-Cy7 (Tonbo
Biosciences A20); Viability Violet Stain (Life Technologies L34955), CFSE (Tonbo
#13-0850) and CTV (Life Technologies #C34557) both at 10 μM / 107 cells / ml. Cells were
stained for 30 minutes and fixed using 1% paraformaldehyde prior to analysis. Staining
panels included fluorescence minus one (FMO) controls to ensure that correct compensation
was applied, as well as isotype controls to assess non-specific staining. Flow cytometric
analysis was collected on a Becton Dickinson (BD) LSRII and FCS files were exported
using FACSDiva (v6.2). Analysis of flow cytometric data was conducted in R/Bioconductor
(v.3.2.2) using the ‘flowCore’ (v.1.36.9) package48 or FlowJo software (v9.7.6). Code is
available upon request.
Naïve B cells were isolated using immunomagnetic negative selection for CD43, CD4, and
Ter-119 (Miltenyi #130-090-862) following the manufacturer’s protocol. Purity was
confirmed by flow cytometric analysis. Plasmablasts and plasma cells were isolated by first
enriching the CD138 positive fraction of splenocytes and/or bone marrow using a positive
immunomagnetic enrichment on CD138 (Miltenyi #130-098-257) and then FACS using a
BD FACS Aria II at the Emory Flow Cytometry Core Laboratory. Adoptively transferred
cells were isolated by labeling CD45.1+ cells with CD45.1-APC-Cy7 (Tonbo Biosciences
A20) and immunomagnetic enrichment using anti-APC beads (Miltenyi # 130-090-855)
followed by FACS using a BD FACS Aria II at the Emory Flow Cytometry Core Laboratory.
Ex Vivo differentiation and 5-aza-cytidine treatment
B cells were differentiated ex vivo as previously described37, but with the incorporation of
division tracking dye. B cells were isolated using immunomagnetic separation as above, and
stained with CTV or CFSE at a concentration of 206 cells / mL in PBS. Cells were
Barwick et al. Page 10
Nat Immunol. Author manuscript; available in PMC 2017 February 08.
Author M
anuscriptA
uthor Manuscript
Author M
anuscriptA
uthor Manuscript
differentiated at an initial concentration of 0.5 × 10⁶ cells per ml with LPS (20 μg / ml;
Sigma #L2630), IL-2 (20 ng / ml; eBioscience #14-8021), and IL-5 (5 ng / ml; eBioscience
#14-8051). Half doses of LPS and cytokines were given on subsequent days. 5-azacytidine
(Sigma Aldrich #A2385) was added to cultures every day at concentrations ranging from 50
nM to 500 nM as indicated.
Quantitative real-time PCR (qRT-PCR) analysis
Gene expression was validated using 20,000 cells sorted into RLT lysis buffer and total RNA
was purified using the Quick-RNA MicroPrep Kit (Zymo Research). The entire RNA yield
was reverse transcribed using SuperScript II reverse transcriptase (Invitrogen), diluted prior
to quantitative real-time PCR (qRT-PCR) on a CFX96 instrument (BioRad) using SYBR
Green incorporation. Expression levels were expressed relative to 18S ribosomal RNA levels
for each gene analyzed. A full list of qRT-PCR primers can be found in Supplementary
Table 7.
Code availability
All code is available upon request.
Microarray analysis
Total RNA from each cell type was extracted using the RNeasy mini prep kit (Qiagen) and
used for microarray analysis on the MouseRef-8v2 BeadChip (Illumina). Gene expression
data were quantile normalized using GenomeStudio v.2011.1 (Illumina) and exported for
analysis. Quality control (QC) steps included mapping all probes to the mouse reference
genome (mm9) using Bowtie49 (v.1.0.0) and removing probes that had multiple alignments,
or did not align to a UCSC Known Gene exon50. The UCSC known gene database was
obtained via the R/Bioconductor package ‘TxDb.Mmusculus.UCSC.mm9.knownGene’51 (v.
3.2.2). This resulted in 22,907 of 25,697 probes passing quality control and coverage of
16,181 genes. Differential expression was identified using linear regression implemented in
R/Bioconductor (v3.1.3)51. Multiple hypothesis testing was applied to probes with signal
that was detected in at least one sample (N=10,322) and with a 2-fold change in expression
or greater using a Benjamini-Hochburg false discovery rate (FDR)52. Those genes with a
FDR less than 0.01 were considered significant (Supplementary Table 1).
RNA-seq analysis
For RNA-seq analysis, 40,000 cells were sorted into RLT buffer (Qiagen) with 1% 2-
mercaptoethanol (Sigma), vortexed and snap frozen. Prior to extraction 5 μl of 1:2000
dilution of ERCC synthetic RNAs (ThermoFisher) were added to each sample. RNA was
extract using RNeasy Mini Kit (Qiagen) following the manufacturer’s protocol. DNA was
removed with RQ1 DNase (Promega) at 37°C for 30 minutes and RNA was purified using
3x AMPPure XP clean up (Beckman Coulter). Stranded mRNA-seq libraries were
constructed using KAPA Biosystems Stranded mRNA-Seq Kit following the manufacturer’s
protocol (KAPA Biosystems). Equal molar amounts of mRNA-seq libraries were amplified
for 11 PCR cycles and purified using a 1.5x ratio of AMPPure XP beads (Beckman Coulter).
Barwick et al. Page 11
Nat Immunol. Author manuscript; available in PMC 2017 February 08.
Author M
anuscriptA
uthor Manuscript
Author M
anuscriptA
uthor Manuscript
Libraries were pooled in equal molar ratios based on the KAPA Library Quantification Kit
(Kapa Biosystems) and sequenced on an Illumina HiSeq2500 with 50 bp paired-end reads.
Mapping and quantification of RNA-seq data
RNA-seq data was mapped back to the UCSC mouse genome mm9 using Tophat253 (v.
2.0.13) with the following parameters “–p 8 –N2 –max-multihits 1 –read-gap-length 1” and
the UCSC Known Genes50 mm9 transcript file as a guide. The 92 ERCC sequences were
added to the mm9 genome as artificial chromosomes. PCR duplicates were determined using
Picard (http://broadinstitute.github.io/picard/) and removed from subsequent analyses. Reads
that uniquely overlapped mm9 exons were determined in R (v.3.2.2) using the
‘summarizeOverlaps’ function in mode ‘IntersectionNotEmpty’ of the
‘GenomicAlignments’ package54 (v.1.6.3). Reads per million (RPM) were calculated for
each gene based on the number reads in all potential exons for a given gene and the total
number of uniquely mappable reads per sample. Fragments per kilobase per million (FPKM)
were calculated based on RPM and the total size of non-overlapping exons for a gene. The
number of mRNA molecules per cell were calculated with the following equation:
Differential analysis of RNA-seq data
Differentially expressed genes (DEGs) were determined using EdgeR55 (v.3.12.0) based on
both relative and absolute changes in expression. Gene counts were calculated using all
reads mapping to exons of unique UCSC mm9 Known Genes50, determined as described
above. For relative differences, normalization factors were determined using the EdgeR
function “calcNormFactors”. For absolute differences, the normalization factors were
determined as the sum of ERCC FPKM divided by the average ERCC FPKM across all
samples. A minimum 2-fold change was imposed upon criteria for both relative and absolute
differences. P-values calculated by EdgeR were corrected for multiple hypothesis testing
using Benjamini-Hochberg FDR correction52. In total, DEGs had an FDR ≤0.01 with a fold-
change ≥2 using both relative and absolute criteria to be considered significant.
Bioinformatic analyses of expression data
Heatmaps and hierarchical clustering of gene expression data used an ‘average’ or
unweighted pair group method with arithmetic mean agglomeration method applied to the
Z-score normalized probe signal (microarray) or average number of mRNAs / cell (RNA-
seq) using the R/Bioconductor functions ’hclust’ and ‘image’ in a method very similar to
that employed by the ‘heatmap’ function51 (R code available upon request). Principle
components analysis was done using the R/Bioconductor function ‘prcomp’ also applied to
Z-score normalized expression data.
Gene ontology analysis was conducted on differentially expressed genes (DEGs) using the
R/Bioconductor package GOstats (v2.32.0)56. For microarray data, all genes with probes
that passed QC were used as background. For RNA-seq data, all UCSC mm9 Known
Barwick et al. Page 12
Nat Immunol. Author manuscript; available in PMC 2017 February 08.
Author M
anuscriptA
uthor Manuscript
Author M
anuscriptA
uthor Manuscript
Genes50 were used as background. Gene Set Enrichment Analysis (GSEA v2.1.0) was
performed using the pre-ranked list option. For microarray data the rank was determined by
the average t-statistic for all probes mapping to a given gene. Only probes that were detected
in at least one sample were used. For RNA-seq data the rank was determined by the
−log10(FDR) x sign(fold-change). Here, the FDR is the average FDR determined using both
absolute and criteria described above.
DNA methylation assays
DNA isolation was obtained from cells digested overnight with Proteinase K and RNase at
67°C and extracted using phenol-chloroform-isoamylalcohol and ethanol precipitation.
RRBS libraries were made from 10 to 500 ng of DNA and were digested overnight with 20
U MspI (New England Biolabs) following the manufacturer’s protocol. RRBS libraries for B
cell divisions were also digested with TaqI in separate reactions (New England Biolabs).
Digested DNA was purified using a 1.8X Solid Phase Reversible Immobilization (SPRI)
clean-up with Agencourt AMPure XP beads (Beckman Coulter). Illumina compatible
sequencing adaptors were used and contained fully methylated cytosine residues and were
either NEXTflex Bisulfite-Seq Barcodes (BIOO Scientific) or were designed similar to those
previously described57 and synthesized by Integrated DNA Technologies. DNA was end-
repaired and A-tailed and sequencing adaptors were ligated using the Hyper Prep Kit (KAPA
Biosystems) following the manufacturer’s protocol. Adaptor-ligated DNA was bisulfite
treated using the EpiTect Bisulfite Kit (Qiagen), modifying the manufacturer’s protocol by
extending the denaturation thermocycler step from 5 to 10 minutes at 99°C. Adaptor-ligated
bisulfite treated libraries were amplified 10-15 times using HiFi Uracil+ Polymerase (KAPA
Biosystems) and library concentration was estimated using the KAPA quantification kit
(KAPA Biosystems). Size was estimated using a high sensitivity DNA chip (Agilent
Technologies). Libraries were sequenced using 50 bp single-end or paired-end reads on a
HiSeq2500 by the Genome Technology Center at New York University (NYU).
Combined Bisulfite Restriction Analysis (COBRA) was performed similar to that previously
described25. Briefly, high molecular weight DNA was bisulfite treated (see above) and 1 ng
of bisulfite converted DNA was amplified 35-40 times using JumpStart Taq polymerase
(Sigma) and bisulfite primers (Supplementary Table 6). Half of the amplified product was
digested with TaqI (NEB) or BstUI (NEB) and the other half was mock digested as a
control, prior to visualization on 1.5-2% agarose gels. DNA methylation was also
quantitated by a qPCR approach where genomic DNA was aliquoted into three equal
portions where one was mock digested to quantitate the total amount of DNA, one was
digested with the methyl-sensitive restriction enzyme HpaII to quantitate unmethylated
DNA, and the final aliquot was digested with the methyl-insensitive isoschizomer MspI as a
negative control. Equal portions of each aliquot were subjected to qPCR and DNA
methylation levels were quantitated as the ratio of HpaII-digested material to mock-digested
material. Quantitation was based upon a standard curve of genomic DNA and all primers
(Supplementary Table 7) were between 90% and 100% efficient.
Barwick et al. Page 13
Nat Immunol. Author manuscript; available in PMC 2017 February 08.
Author M
anuscriptA
uthor Manuscript
Author M
anuscriptA
uthor Manuscript
DNA methylation bioinformatic analyses
RRBS data were aligned to the in silico bisulfite converted genome (mm9) using Bismark58
(v.0.13.1) with the Bowtie259 option. Binary alignment map (BAM) files were parsed to
derive DNA methylation calls that were collapsed to the CpG level using custom R scripts
that made use of the ‘Rsamtools’ (v.1.22.0) and ‘data.table’ (v.1.9.6) packages (code
available upon request). Data were compiled into datasets that included a sample specific
coverage (minimum 10X coverage per sample) and a group specific coverage (minimum
10X coverage per group). Hierarchical clustering and principle component analyses were
performed on sample specific data sets in a manner analogous to that described for the gene
expression analysis except no normalization was performed and heatmaps were ordered by
increasing DNA methylation from top to bottom. The distribution of DNA methylation
values were assessed using the ‘density’ function in R/Bioconductor and represents the
probability density function across sample specific coverage. Average methylation was
determined based on sample coverage and differences were determined by Welch’s t-test. B
cell, plasmablast and plasma cell differentially methylated CpG loci (DML) were identified
using Dispersion Shrinkage for Sequencing (DSS)19 and division specific DML were
determined using the general experimental design version of DSS60. DSS was applied to
group level data and CpG loci that had an FDR ≤0.01 with a minimum change of 20% in
DNA methylation were considered significant. Contiguous DML were defined as two or
more DML that were located adjacent to each other on the genome relative to assay group
coverage. Significance of DML contiguity was assessed by permutation analysis. This
involved randomly permuting DML 1,000 times and calculating the percent of permuted
DML that occurred in contiguous regions for each permutation. The P-value was determined
by the number of times that the permuted value was equal to or greater than the actual value.
Overlap of DML with enhancer elements (methods described in Meta-analysis) was assessed
using Fisher’s exact test61 implemented in R/Bioconductor. Transcription factor motifs
enriched within 50 bp of DML were determined with HOMER software33 (v.4.7.2) relative
to RRBS assay coverage. Results with an FDR ≤ 0.05 were considered significant. Motif
position weight matrices were clustered using the “PWMSimilarity” function of the
“TFBSTools” package62 (v.1.8.2) with a minimum overlap of 6 nucleotides. Data were
clustered using hierarchical clustering as described above. Code is available upon request.
Correlation of gene expression and DNA methylation
To analyze DNA methylation and gene expression correlation, CpG loci were annotated to
the closest UCSC mm9 Known Gene50 transcript using custom R / Bioconductor code
(available upon request). CpG loci that were within 100 kb of a transcript were assigned to
the closest gene. Subsequently, the expression fold-change for each gene was plotted by the
change in absolute DNA methylation. Significance of inverse correlation was assessed using
Fisher’s exact test61 (implemented in R) to determine if more DML-DEG correlations were
negatively associated than expected by chance.
Meta-analysis
Analysis of histone modifications utilized previously described chromatin
immunoprecipitation sequencing (ChIP-seq) experiments performed on primary B
Barwick et al. Page 14
Nat Immunol. Author manuscript; available in PMC 2017 February 08.
Author M
anuscriptA
uthor Manuscript
Author M
anuscriptA
uthor Manuscript
cells31–33,63,64. ChIP-seq data were obtained from Gene Expression Omnibus experiments
GSE3085933, GSE3804664, GSE5133631, GSE4270663, and GSE5101132; specific data sets
are listed in Supplementary Table 4. Data were uniformly aligned and processed to the
mouse genome (mm9) using Bowtie259 (v.2.1.0). ChIP-seq fragment size for each data set
was calculated using the “chip-seq” (v.1.20.0) package in R/Bioconductor based on the
SISSER method previously described65Enriched regions for those published by the
ENCODE project31 were downloaded from the UCSC genome browser (http://
genome.ucsc.edu/cgi-bin/hgFileSearch?db=mm9). Enriched regions for other studies were
determined using MACS software (v1.4)66. Enhancers were determined for spleen, CH12
cells, thymus, and whole brain H3K4me1, H3K27ac, and H3K4me3 data by taking
overlapping H3K4me1 and H3K27ac regions that did not overlap a region enriched for
H3K4me3. Odds ratio and significance of overlap with DML were determined using
Fisher’s exact test.
Supplementary Material
Refer to Web version on PubMed Central for supplementary material.
Acknowledgements
We acknowledge R Martinez for flow cytometry expertise and R Butler for mouse care. We thank PM Vertino, PA Wade, LH Boise, HD Kondilis-Mangum for helpful comments and critique in reading the manuscript. We also thank KN Conneely, and H Wu for statistical advice. We thank the Genome Technology Center at NYU for expertise in Illumina sequencing, the Emory Flow Cytometry Core for expertise in FACS, and the Emory Integrated Genomics Core for running high-sensitivity DNA Bioanalyzer analysis. This work was supported by Emory University School of Medicine institutional funds to JMB and National Institutes of Health grants RO1 GM47310 (JMB), RO1 AI123733 (JMB), U19 AI110483 (JMB), F31 AI112261 (BGB), T32 GM008490 (JMB, BGB) and T32 AI007610 (APRB).
References
1. Macallan DC, et al. B-cell kinetics in humans: rapid turnover of peripheral blood memory cells. Blood. 2005; 105:3633–3640. [PubMed: 15644412]
2. Kouzine F, et al. Global Regulation of Promoter Melting in Naive Lymphocytes. Cell. 2013; 153:988–999. [PubMed: 23706737]
3. Nutt, SL.; Taubenheim, N.; Hasbold, J.; Corcoran, LM.; Hodgkin, PD. The genetic network controlling plasma cell differentiation. 2011.
4. Hodgkin PD, Lee JH, Lyons AB. B cell differentiation and isotype switching is related to division cycle number. J Exp Med. 1996; 184:277–281. [PubMed: 8691143]
5. Hasbold J, Corcoran LM, Tarlinton DM, Tangye SG, Hodgkin PD. Evidence from the generation of immunoglobulin G–secreting cells that stochastic mechanisms regulate lymphocyte differentiation. Nat Immunol. 2004; 5:55–63. [PubMed: 14647274]
6. Nutt SL, Hodgkin PD, Tarlinton DM, Corcoran LM. The generation of antibody-secreting plasma cells. Nat Rev Immunol. 2015; 15:160–171. [PubMed: 25698678]
7. Duffy KR, et al. Activation-Induced B Cell Fates Are Selected by Intracellular Stochastic Competition. Science. 2012; 335:338–341. [PubMed: 22223740]
8. Taylor JJ, Pape KA, Steach HR, Jenkins MK. Apoptosis and antigen affinity limit effector cell differentiation of a single naïve B cell. Science. 2015; 347:784–787. [PubMed: 25636798]
9. Jones PA, Takai D. The Role of DNA Methylation in Mammalian Epigenetics. Science. 2001; 293:1068–1070. [PubMed: 11498573]
10. Egger G, Liang G, Aparicio A, Jones PA. Epigenetics in human disease and prospects for epigenetic therapy. Nature. 2004; 429:457–463. [PubMed: 15164071]
Barwick et al. Page 15
Nat Immunol. Author manuscript; available in PMC 2017 February 08.
Author M
anuscriptA
uthor Manuscript
Author M
anuscriptA
uthor Manuscript
11. Bröske A-M, et al. DNA methylation protects hematopoietic stem cell multipotency from myeloerythroid restriction. Nat Genet. 2009; 41:1207–1215. [PubMed: 19801979]
12. Shaknovich R, et al. DNA methyltransferase 1 and DNA methylation patterning contribute to germinal center B-cell differentiation. Blood. 2011; 118:3559–3569. [PubMed: 21828137]
13. Lai AY, et al. DNA methylation profiling in human B cells reveals immune regulatory elements and epigenetic plasticity at Alu elements during B-cell activation. Genome Res. 2013; 23:2030–2041. [PubMed: 24013550]
14. Kulis M, et al. Whole-genome fingerprint of the DNA methylome during human B cell differentiation. Nat Genet. 2015 advance online publication.
15. Kallies A, et al. Plasma Cell Ontogeny Defined by Quantitative Changes in Blimp-1 Expression. J Exp Med. 2004; 200:967–977. [PubMed: 15492122]
16. Chernova I, et al. Lasting Antibody Responses Are Mediated by a Combination of Newly Formed and Established Bone Marrow Plasma Cells Drawn from Clonally Distinct Precursors. J Immunol. 2014; 193:4971–4979. [PubMed: 25326027]
17. Tarte K, Zhan F, Vos JD, Klein B, Shaughnessy J. Gene expression profiling of plasma cells and plasmablasts: toward a better understanding of the late stages of B-cell differentiation. Blood. 2003; 102:592–600. [PubMed: 12663452]
18. Meissner A, et al. Reduced representation bisulfite sequencing for comparative high-resolution DNA methylation analysis. Nucl. Acids Res. 2005; 33:5868–5877. [PubMed: 16224102]
19. Feng H, Conneely KN, Wu H. A Bayesian hierarchical model to detect differentially methylated loci from single nucleotide resolution sequencing data. Nucl. Acids Res. 2014; 42:e69–e69. [PubMed: 24561809]
20. Matsumoto M, et al. Interleukin-10-Producing Plasmablasts Exert Regulatory Function in Autoimmune Inflammation. Immunity. 0.
21. Klein U, et al. Transcription factor IRF4 controls plasma cell differentiation and class-switch recombination. Nat Immunol. 2006; 7:773–782. [PubMed: 16767092]
22. Ochiai K, et al. Transcriptional Regulation of Germinal Center B and Plasma Cell Fates by Dynamical Control of IRF4. Immunity.
23. Shi W, et al. Transcriptional profiling of mouse B cell terminal differentiation defines a signature for antibody-secreting plasma cells. Nat Immunol. 2015 advance online publication.
24. Salzer U, et al. Mutations in TNFRSF13B encoding TACI are associated with common variable immunodeficiency in humans. Nat Genet. 2005; 37:820–828. [PubMed: 16007087]
25. Xiong Z, Laird PW. COBRA: a sensitive and quantitative DNA methylation assay. Nucl. Acids Res. 1997; 25:2532–2534. [PubMed: 9171110]
26. Sciammas R, et al. Graded Expression of Interferon Regulatory Factor-4 Coordinates Isotype Switching with Plasma Cell Differentiation. Immunity. 2006; 25:225–236. [PubMed: 16919487]
27. Mittrücker H-W, et al. Requirement for the Transcription Factor LSIRF/IRF4 for Mature B and T Lymphocyte Function. Science. 1997; 275:540–543. [PubMed: 8999800]
28. Herrscher RF, et al. The immunoglobulin heavy-chain matrix-associating regions are bound by Bright: a B cell-specific trans-activator that describes a new DNA-binding protein family. Genes Dev. 1995; 9:3067–3082. [PubMed: 8543152]
29. Turner CA Jr. Mack DH, Davis MM. Blimp-1, a novel zinc finger-containing protein that can drive the maturation of B lymphocytes into immunoglobulin-secreting cells. Cell. 1994; 77:297–306. [PubMed: 8168136]
30. Creyghton MP, et al. From the Cover: Histone H3K27ac separates active from poised enhancers and predicts developmental state. Proceedings of the National Academy of Sciences. 2010; 107:21931–21936.
31. Yue F, et al. A comparative encyclopedia of DNA elements in the mouse genome. Nature. 2014; 515:355–364. [PubMed: 25409824]
32. Sabò A, et al. Selective transcriptional regulation by Myc in cellular growth control and lymphomagenesis. Nature. 2014; 511:488–492. [PubMed: 25043028]
Barwick et al. Page 16
Nat Immunol. Author manuscript; available in PMC 2017 February 08.
Author M
anuscriptA
uthor Manuscript
Author M
anuscriptA
uthor Manuscript
33. Heinz S, et al. Simple Combinations of Lineage-Determining Transcription Factors Prime cis-Regulatory Elements Required for Macrophage and B Cell Identities. Molecular Cell. 2010; 38:576–589. [PubMed: 20513432]
34. Schubart K, et al. B cell development and immunoglobulin gene transcription in the absence of Oct-2 and OBF-1. Nat Immunol. 2001; 2:69–74. [PubMed: 11135581]
35. Grötsch B, et al. The AP-1 transcription factor Fra1 inhibits follicular B cell differentiation into plasma cells. J Exp Med. 2014; jem.20130795. doi: 10.1084/jem.20130795
36. Sasaki Y, et al. Canonical NF-κB Activity, Dispensable for B Cell Development, Replaces BAFF-Receptor Signals and Promotes B Cell Proliferation upon Activation. Immunity. 2006; 24:729–739. [PubMed: 16782029]
37. Yoon HS, et al. ZBTB32 Is an Early Repressor of the CIITA and MHC Class II Gene Expression during B Cell Differentiation to Plasma Cells. J Immunol. 2012; 189:2393–2403. [PubMed: 22851713]
38. Kitamura D, Roes J, Kühn R, Rajewsky K. A B cell-deficient mouse by targeted disruption of the membrane exon of the immunoglobulin μ chain gene. Nature. 1991; 350:423–426. [PubMed: 1901381]
39. Hu M, et al. p32 protein levels are integral to mitochondrial and endoplasmic reticulum morphology, cell metabolism and survival. Biochemical Journal. 2013; 453:381–391. [PubMed: 23692256]
40. Bruni F, Gramegna P, Oliveira JMA, Lightowlers RN, Chrzanowska-Lightowlers ZMA. REXO2 Is an Oligoribonuclease Active in Human Mitochondria. PLoS ONE. 2013; 8:e64670. [PubMed: 23741365]
41. Slifka MK, Antia R, Whitmire JK, Ahmed R. Humoral immunity due to long-lived plasma cells. Immunity. 1998; 8:363–372. [PubMed: 9529153]
42. Manz RA, Thiel A, Radbruch A. Lifetime of plasma cells in the bone marrow. Nature. 1997; 388:133–134. [PubMed: 9217150]
43. Emslie D, et al. Oct2 enhances antibody-secreting cell differentiation through regulation of IL-5 receptor α chain expression on activated B cells. J Exp Med. 2008; 205:409–421. [PubMed: 18250192]
44. Tahiliani M, et al. Conversion of 5-Methylcytosine to 5-Hydroxymethylcytosine in Mammalian DNA by MLL Partner TET1. Science. 2009; 324:930–935. [PubMed: 19372391]
45. Cortellino S, et al. Thymine DNA Glycosylase Is Essential for Active DNA Demethylation by Linked Deamination-Base Excision Repair. Cell. 2011; 146:67–79. [PubMed: 21722948]
46. Stadler MB, et al. DNA-binding factors shape the mouse methylome at distal regulatory regions. Nature. 2011; 480:490–495. [PubMed: 22170606]
47. Chang JT, et al. Asymmetric T Lymphocyte Division in the Initiation of Adaptive Immune Responses. Science. 2007; 315:1687–1691. [PubMed: 17332376]
Methods references
48. Hahne F, et al. flowCore: a Bioconductor package for high throughput flow cytometry. BMC Bioinformatics. 2009; 10:106. [PubMed: 19358741]
49. Langmead B, Trapnell C, Pop M, Salzberg SL. Ultrafast and memory-efficient alignment of short DNA sequences to the human genome. Genome Biol. 2009; 10:R25. others. [PubMed: 19261174]
50. Hsu F, et al. The UCSC Known Genes. Bioinformatics. 2006; 22:1036–1046. [PubMed: 16500937]
51. Gentleman RC, et al. Bioconductor: open software development for computational biology and bioinformatics. Genome biology. 2004; 5:R80. [PubMed: 15461798]
52. Benjamini Y, Hochberg Y. Controlling the False Discovery Rate: A Practical and Powerful Approach to Multiple Testing. Journal of the Royal Statistical Society. Series B (Methodological). 1995; 57:289–300.
53. Kim D, et al. TopHat2: accurate alignment of transcriptomes in the presence of insertions, deletions and gene fusions. Genome Biol. 2013; 14:R36. [PubMed: 23618408]
Barwick et al. Page 17
Nat Immunol. Author manuscript; available in PMC 2017 February 08.
Author M
anuscriptA
uthor Manuscript
Author M
anuscriptA
uthor Manuscript
54. Lawrence M, et al. Software for Computing and Annotating Genomic Ranges. PLoS Comput Biol. 2013; 9:e1003118. [PubMed: 23950696]
55. Robinson, MD.; McCarthy, DJ.; Smyth, GK. edgeR: a Bioconductor package for differential expression analysis of digital gene expression data; 2009. p. 139-140.
56. Falcon S, Gentleman R. Using GOstats to test gene lists for GO term association. Bioinformatics. 2007; 23:257–258. [PubMed: 17098774]
57. Bowman SK, et al. Multiplexed Illumina sequencing libraries from picogram quantities of DNA. BMC Genomics. 2013; 14:466. [PubMed: 23837789]
58. Krueger F, Andrews SR. Bismark: a flexible aligner and methylation caller for Bisulfite-Seq applications. Bioinformatics. 2011; 27:1571–1572. [PubMed: 21493656]
59. Langmead B, Salzberg SL. Fast gapped-read alignment with Bowtie 2. Nat Meth. 2012; 9:357–359.
60. Park Y, Wu H. Differential methylation analysis for BS-seq data under general experimental design. Bioinformatics. 2016 btw026.
61. Fisher RA. On the interpretation of x(2) from contingency tables, and the calculation of P. J. R. Stat. Soc. 1922; 85:87–94.
62. Tan G, Lenhard B. TFBSTools: an R/Bioconductor package for transcription factor binding site analysis. Bioinformatics. 2016 btw024.
63. Frangini A, et al. The Aurora B Kinase and the Polycomb Protein Ring1B Combine to Regulate Active Promoters in Quiescent Lymphocytes. Molecular Cell. 2013; 51:647–661. [PubMed: 24034696]
64. Revilla-i-Domingo R, et al. The B-cell identity factor Pax5 regulates distinct transcriptional programmes in early and late B lymphopoiesis. The EMBO Journal. 2012; 31:3130–3146. [PubMed: 22669466]
65. Jothi R, Cuddapah S, Barski A, Cui K, Zhao K. Genome-wide identification of in vivo protein– DNA binding sites from ChIP-Seq data. Nucl. Acids Res. 2008; 36:5221–5231. [PubMed: 18684996]
66. Zhang Y, et al. Model-based analysis of ChIP-Seq (MACS). Genome Biol. 2008; 9:R137. [PubMed: 18798982]
Barwick et al. Page 18
Nat Immunol. Author manuscript; available in PMC 2017 February 08.
Author M
anuscriptA
uthor Manuscript
Author M
anuscriptA
uthor Manuscript
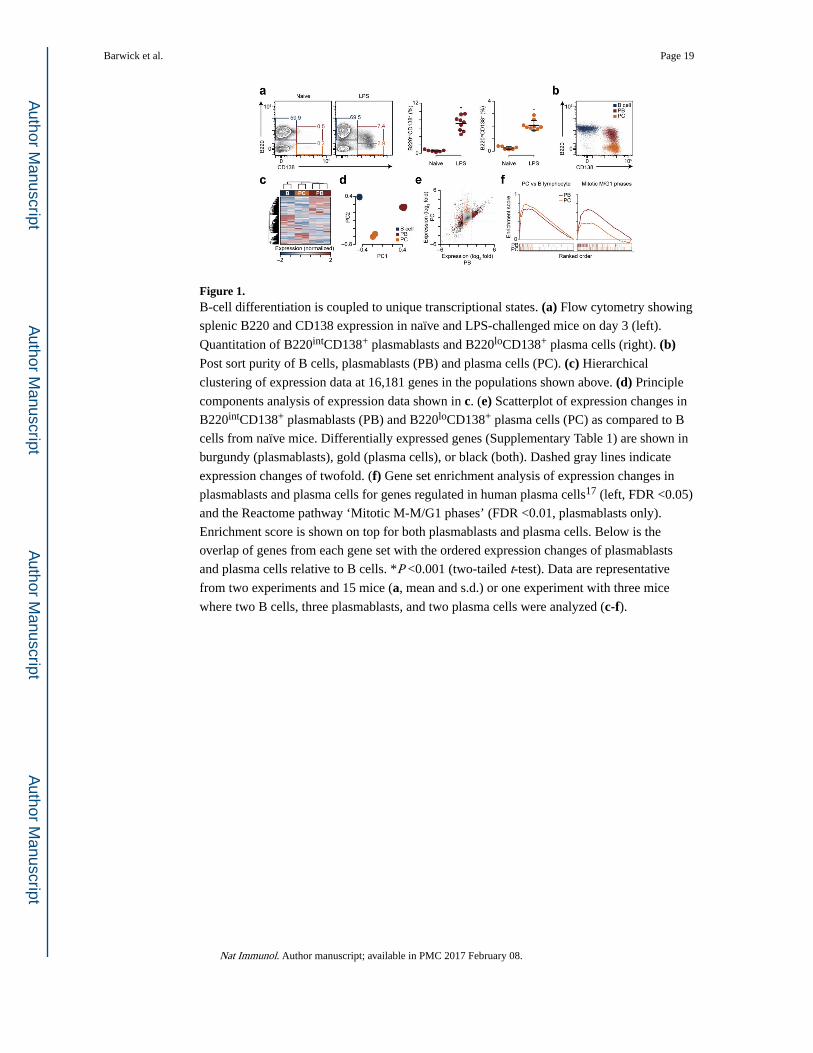
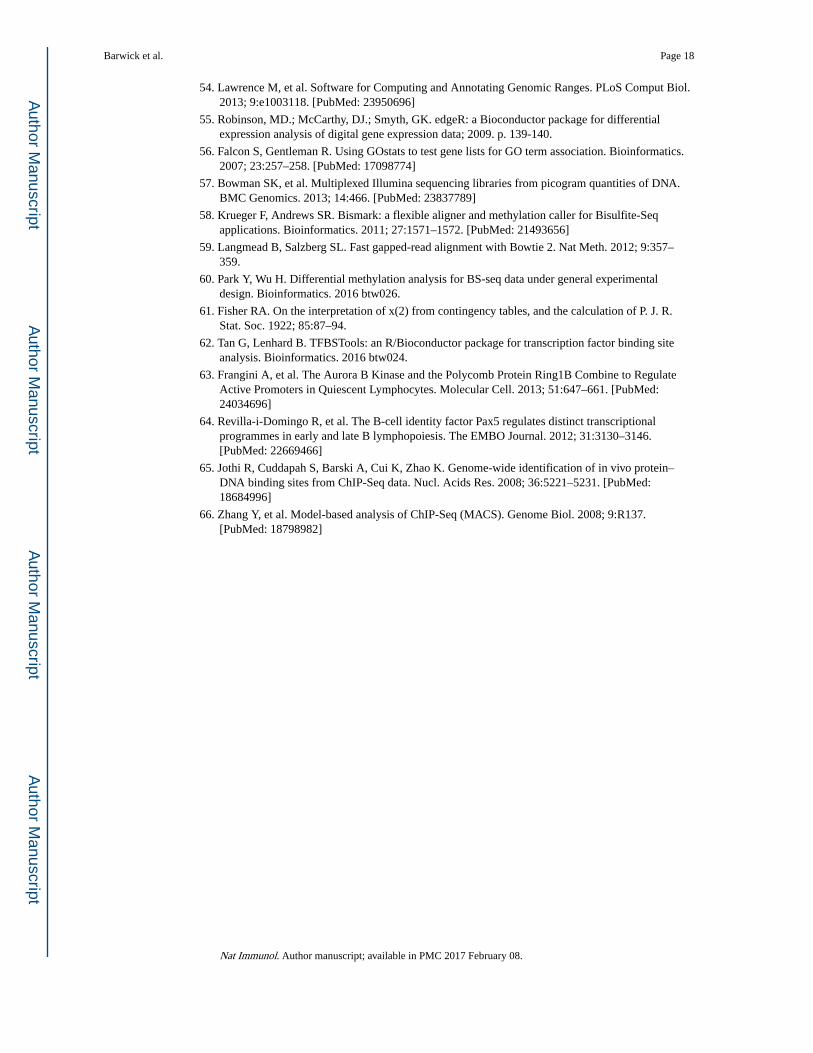
Figure 1. B-cell differentiation is coupled to unique transcriptional states. (a) Flow cytometry showing
splenic B220 and CD138 expression in naïve and LPS-challenged mice on day 3 (left).
Quantitation of B220intCD138+ plasmablasts and B220loCD138+ plasma cells (right). (b) Post sort purity of B cells, plasmablasts (PB) and plasma cells (PC). (c) Hierarchical
clustering of expression data at 16,181 genes in the populations shown above. (d) Principle
components analysis of expression data shown in c. (e) Scatterplot of expression changes in
B220intCD138+ plasmablasts (PB) and B220loCD138+ plasma cells (PC) as compared to B
cells from naïve mice. Differentially expressed genes (Supplementary Table 1) are shown in
burgundy (plasmablasts), gold (plasma cells), or black (both). Dashed gray lines indicate
expression changes of twofold. (f) Gene set enrichment analysis of expression changes in
plasmablasts and plasma cells for genes regulated in human plasma cells17 (left, FDR <0.05)
and the Reactome pathway ‘Mitotic M-M/G1 phases’ (FDR <0.01, plasmablasts only).
Enrichment score is shown on top for both plasmablasts and plasma cells. Below is the
overlap of genes from each gene set with the ordered expression changes of plasmablasts
and plasma cells relative to B cells. *P <0.001 (two-tailed t-test). Data are representative
from two experiments and 15 mice (a, mean and s.d.) or one experiment with three mice
where two B cells, three plasmablasts, and two plasma cells were analyzed (c-f).
Barwick et al. Page 19
Nat Immunol. Author manuscript; available in PMC 2017 February 08.
Author M
anuscriptA
uthor Manuscript
Author M
anuscriptA
uthor Manuscript
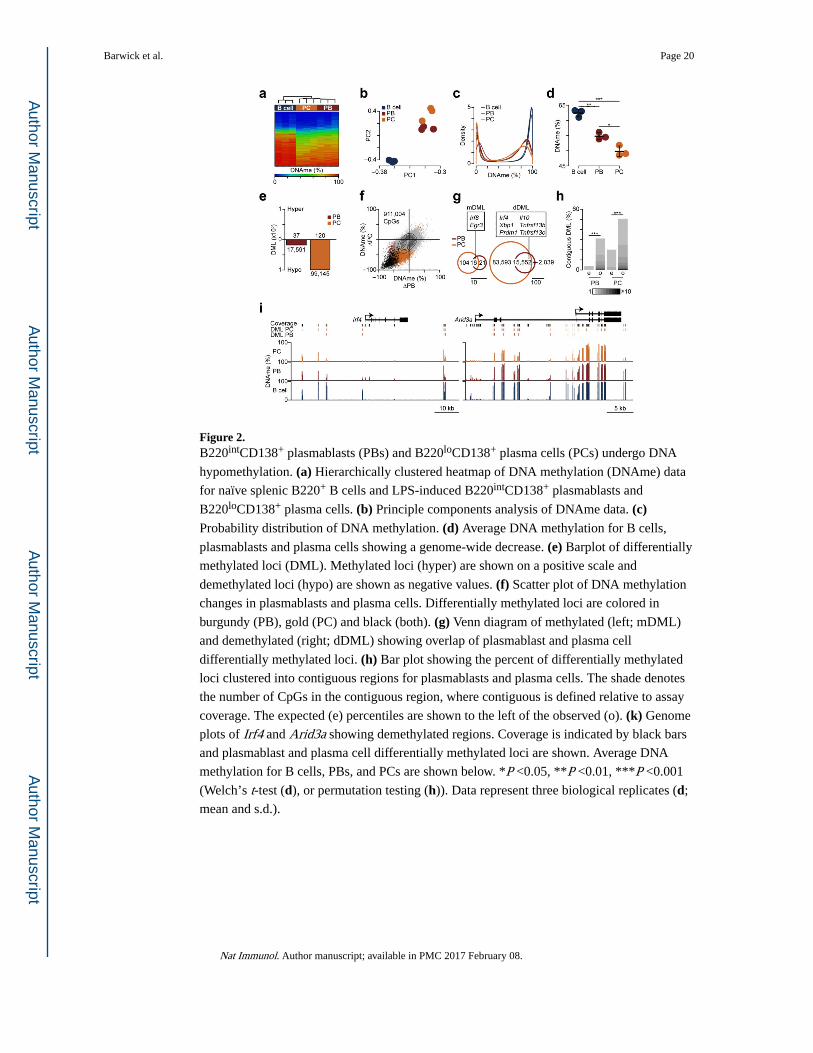
Figure 2. B220intCD138+ plasmablasts (PBs) and B220loCD138+ plasma cells (PCs) undergo DNA
hypomethylation. (a) Hierarchically clustered heatmap of DNA methylation (DNAme) data
for naïve splenic B220+ B cells and LPS-induced B220intCD138+ plasmablasts and
B220loCD138+ plasma cells. (b) Principle components analysis of DNAme data. (c) Probability distribution of DNA methylation. (d) Average DNA methylation for B cells,
plasmablasts and plasma cells showing a genome-wide decrease. (e) Barplot of differentially
methylated loci (DML). Methylated loci (hyper) are shown on a positive scale and
demethylated loci (hypo) are shown as negative values. (f) Scatter plot of DNA methylation
changes in plasmablasts and plasma cells. Differentially methylated loci are colored in
burgundy (PB), gold (PC) and black (both). (g) Venn diagram of methylated (left; mDML)
and demethylated (right; dDML) showing overlap of plasmablast and plasma cell
differentially methylated loci. (h) Bar plot showing the percent of differentially methylated
loci clustered into contiguous regions for plasmablasts and plasma cells. The shade denotes
the number of CpGs in the contiguous region, where contiguous is defined relative to assay
coverage. The expected (e) percentiles are shown to the left of the observed (o). (k) Genome
plots of Irf4 and Arid3a showing demethylated regions. Coverage is indicated by black bars
and plasmablast and plasma cell differentially methylated loci are shown. Average DNA
methylation for B cells, PBs, and PCs are shown below. *P <0.05, **P <0.01, ***P <0.001
(Welch’s t-test (d), or permutation testing (h)). Data represent three biological replicates (d;
mean and s.d.).
Barwick et al. Page 20
Nat Immunol. Author manuscript; available in PMC 2017 February 08.
Author M
anuscriptA
uthor Manuscript
Author M
anuscriptA
uthor Manuscript
Figure 3. Differentially methylated loci (DML) preferentially occur at B cell enhancers and near
motifs of transcription factors required for B cell differentiation. (a) Overlap of
B220intCD138+ plasmablast (PB) and B220loCD138+ plasma cell (PC) differentially
methylated loci with active and poised enhancers. (b) Clustering of transcription factor
motifs enriched near (≤50 bp) differentially methylated loci in plasmablasts and plasma
cells. Motifs are clustered on the similarity of their consensus binding motif. Transcription
factor families are denoted in black boxes (IRF: Inteferon Regulatory Factor; RHD: Rel
Homology Domain; NFAT: Nuclear Factor of Activated T-cells; POU: Pituitary Octamer
Unc-86 transcription factor; bZIP: basic Leucine Zipper Domain; bHLH: basic Helix-Loop-
Helix). The HOMER33 motif name is labelled on the right. Significance (FDR ≤0.05) was
determined from HOMER33 software. Enhancers were determined from publically available
data31,32 where active enhancers were defined as H3K4me1+H3K27ac+H3K4me3− and poised
enhacers as H3K4me1+H3K27ac−H3K4me3-30. Data represent three biological replicates.
Barwick et al. Page 21
Nat Immunol. Author manuscript; available in PMC 2017 February 08.
Author M
anuscriptA
uthor Manuscript
Author M
anuscriptA
uthor Manuscript
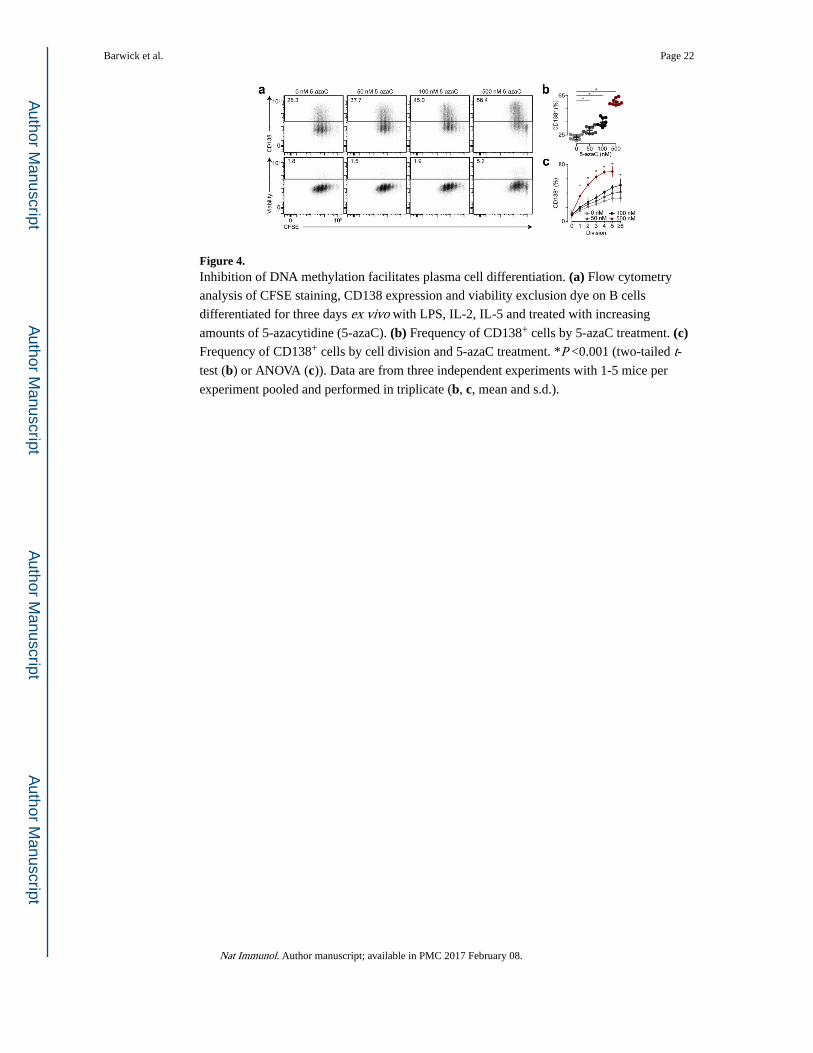
Figure 4. Inhibition of DNA methylation facilitates plasma cell differentiation. (a) Flow cytometry
analysis of CFSE staining, CD138 expression and viability exclusion dye on B cells
differentiated for three days ex vivo with LPS, IL-2, IL-5 and treated with increasing
amounts of 5-azacytidine (5-azaC). (b) Frequency of CD138+ cells by 5-azaC treatment. (c) Frequency of CD138+ cells by cell division and 5-azaC treatment. *P <0.001 (two-tailed t-test (b) or ANOVA (c)). Data are from three independent experiments with 1-5 mice per
experiment pooled and performed in triplicate (b, c, mean and s.d.).
Barwick et al. Page 22
Nat Immunol. Author manuscript; available in PMC 2017 February 08.
Author M
anuscriptA
uthor Manuscript
Author M
anuscriptA
uthor Manuscript
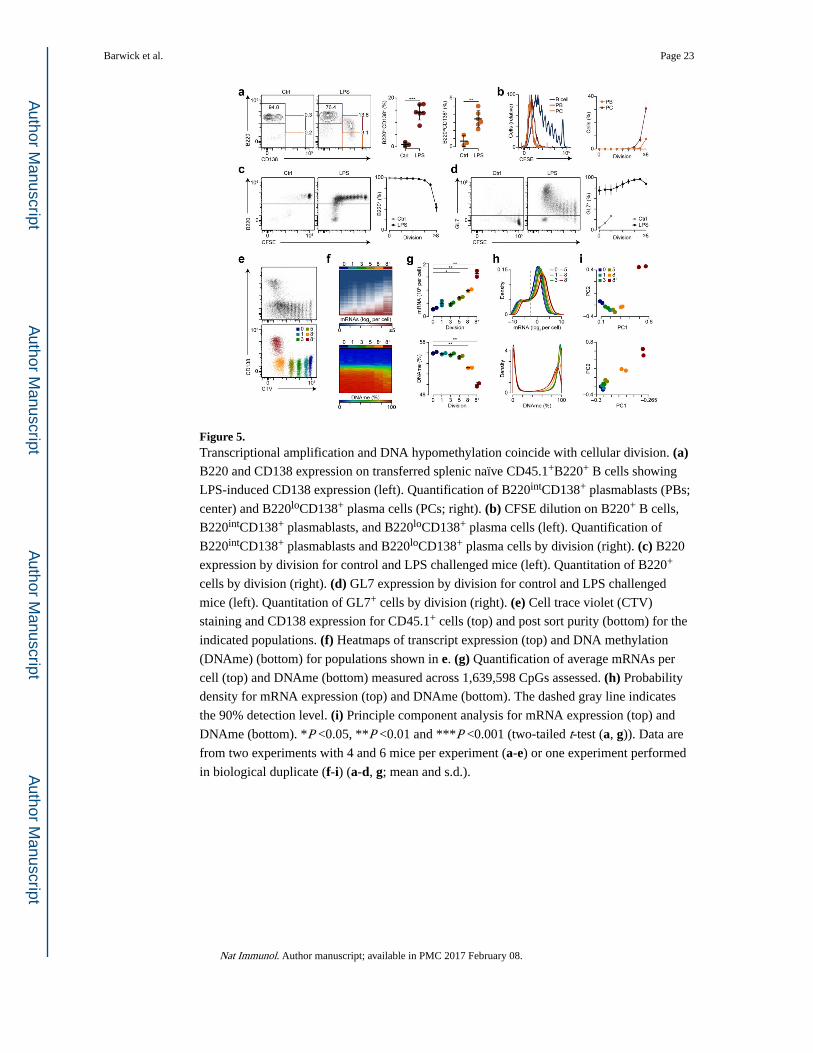
Figure 5. Transcriptional amplification and DNA hypomethylation coincide with cellular division. (a) B220 and CD138 expression on transferred splenic naïve CD45.1+B220+ B cells showing
LPS-induced CD138 expression (left). Quantification of B220intCD138+ plasmablasts (PBs;
center) and B220loCD138+ plasma cells (PCs; right). (b) CFSE dilution on B220+ B cells,
B220intCD138+ plasmablasts, and B220loCD138+ plasma cells (left). Quantification of
B220intCD138+ plasmablasts and B220loCD138+ plasma cells by division (right). (c) B220
expression by division for control and LPS challenged mice (left). Quantitation of B220+
cells by division (right). (d) GL7 expression by division for control and LPS challenged
mice (left). Quantitation of GL7+ cells by division (right). (e) Cell trace violet (CTV)
staining and CD138 expression for CD45.1+ cells (top) and post sort purity (bottom) for the
indicated populations. (f) Heatmaps of transcript expression (top) and DNA methylation
(DNAme) (bottom) for populations shown in e. (g) Quantification of average mRNAs per
cell (top) and DNAme (bottom) measured across 1,639,598 CpGs assessed. (h) Probability
density for mRNA expression (top) and DNAme (bottom). The dashed gray line indicates
the 90% detection level. (i) Principle component analysis for mRNA expression (top) and
DNAme (bottom). *P <0.05, **P <0.01 and ***P <0.001 (two-tailed t-test (a, g)). Data are
from two experiments with 4 and 6 mice per experiment (a-e) or one experiment performed
in biological duplicate (f-i) (a-d, g; mean and s.d.).
Barwick et al. Page 23
Nat Immunol. Author manuscript; available in PMC 2017 February 08.
Author M
anuscriptA
uthor Manuscript
Author M
anuscriptA
uthor Manuscript
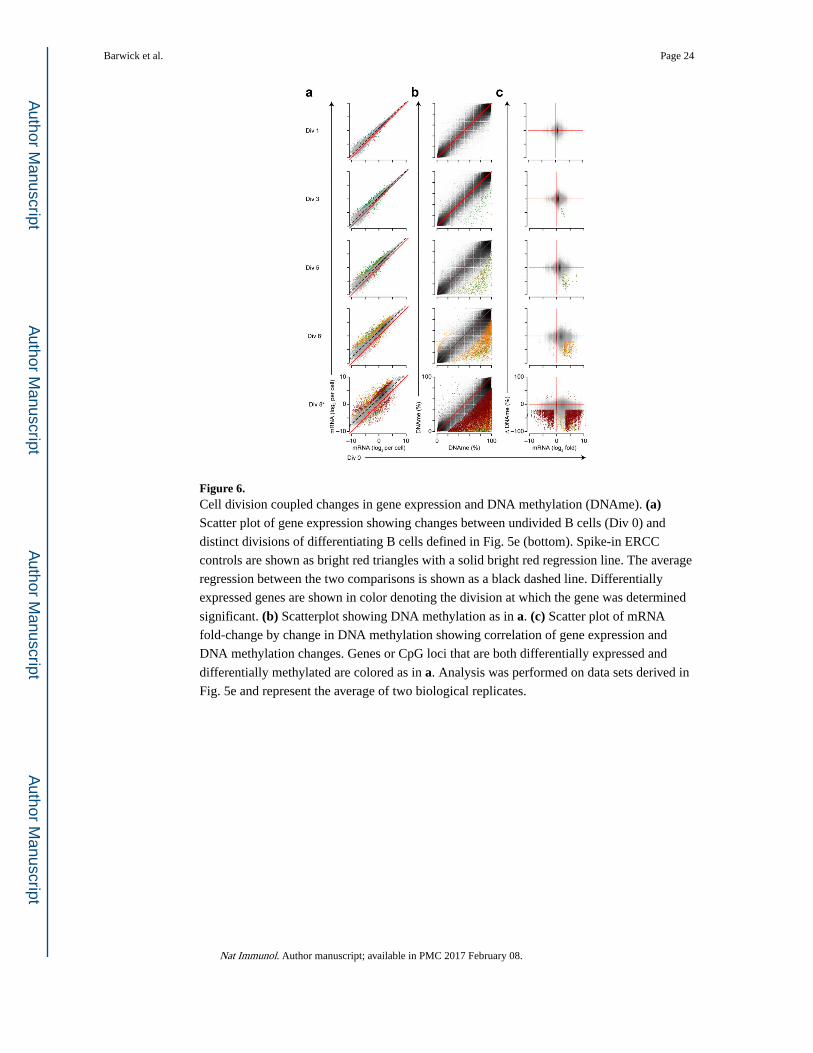
Figure 6. Cell division coupled changes in gene expression and DNA methylation (DNAme). (a) Scatter plot of gene expression showing changes between undivided B cells (Div 0) and
distinct divisions of differentiating B cells defined in Fig. 5e (bottom). Spike-in ERCC
controls are shown as bright red triangles with a solid bright red regression line. The average
regression between the two comparisons is shown as a black dashed line. Differentially
expressed genes are shown in color denoting the division at which the gene was determined
significant. (b) Scatterplot showing DNA methylation as in a. (c) Scatter plot of mRNA
fold-change by change in DNA methylation showing correlation of gene expression and
DNA methylation changes. Genes or CpG loci that are both differentially expressed and
differentially methylated are colored as in a. Analysis was performed on data sets derived in
Fig. 5e and represent the average of two biological replicates.
Barwick et al. Page 24
Nat Immunol. Author manuscript; available in PMC 2017 February 08.
Author M
anuscriptA
uthor Manuscript
Author M
anuscriptA
uthor Manuscript
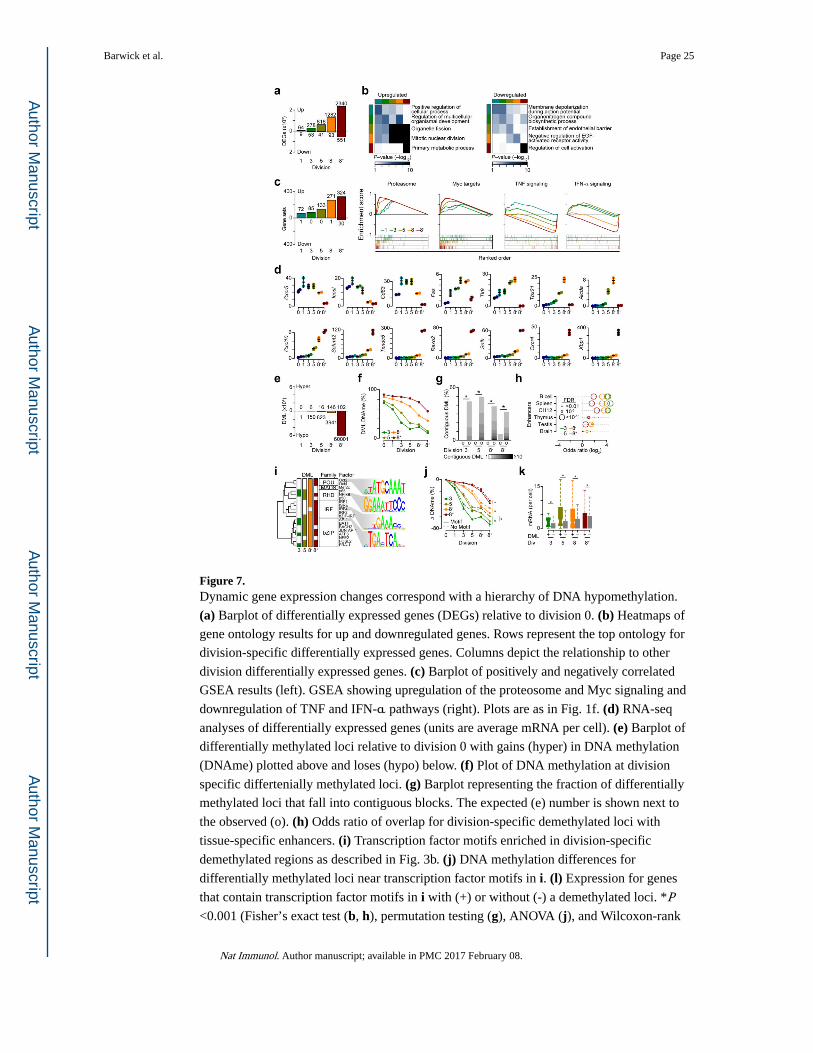
Figure 7. Dynamic gene expression changes correspond with a hierarchy of DNA hypomethylation.
(a) Barplot of differentially expressed genes (DEGs) relative to division 0. (b) Heatmaps of
gene ontology results for up and downregulated genes. Rows represent the top ontology for
division-specific differentially expressed genes. Columns depict the relationship to other
division differentially expressed genes. (c) Barplot of positively and negatively correlated
GSEA results (left). GSEA showing upregulation of the proteosome and Myc signaling and
downregulation of TNF and IFN-α pathways (right). Plots are as in Fig. 1f. (d) RNA-seq
analyses of differentially expressed genes (units are average mRNA per cell). (e) Barplot of
differentially methylated loci relative to division 0 with gains (hyper) in DNA methylation
(DNAme) plotted above and loses (hypo) below. (f) Plot of DNA methylation at division
specific differtenially methylated loci. (g) Barplot representing the fraction of differentially
methylated loci that fall into contiguous blocks. The expected (e) number is shown next to
the observed (o). (h) Odds ratio of overlap for division-specific demethylated loci with
tissue-specific enhancers. (i) Transcription factor motifs enriched in division-specific
demethylated regions as described in Fig. 3b. (j) DNA methylation differences for
differentially methylated loci near transcription factor motifs in i. (l) Expression for genes
that contain transcription factor motifs in i with (+) or without (-) a demethylated loci. *P <0.001 (Fisher’s exact test (b, h), permutation testing (g), ANOVA (j), and Wilcoxon-rank
Barwick et al. Page 25
Nat Immunol. Author manuscript; available in PMC 2017 February 08.
Author M
anuscriptA
uthor Manuscript
Author M
anuscriptA
uthor Manuscript
sum test (k)). Analysis was performed on data sets derived in Fig. 5e and represent the
average of two biological replicates.
Barwick et al. Page 26
Nat Immunol. Author manuscript; available in PMC 2017 February 08.
Author M
anuscriptA
uthor Manuscript
Author M
anuscriptA
uthor Manuscript
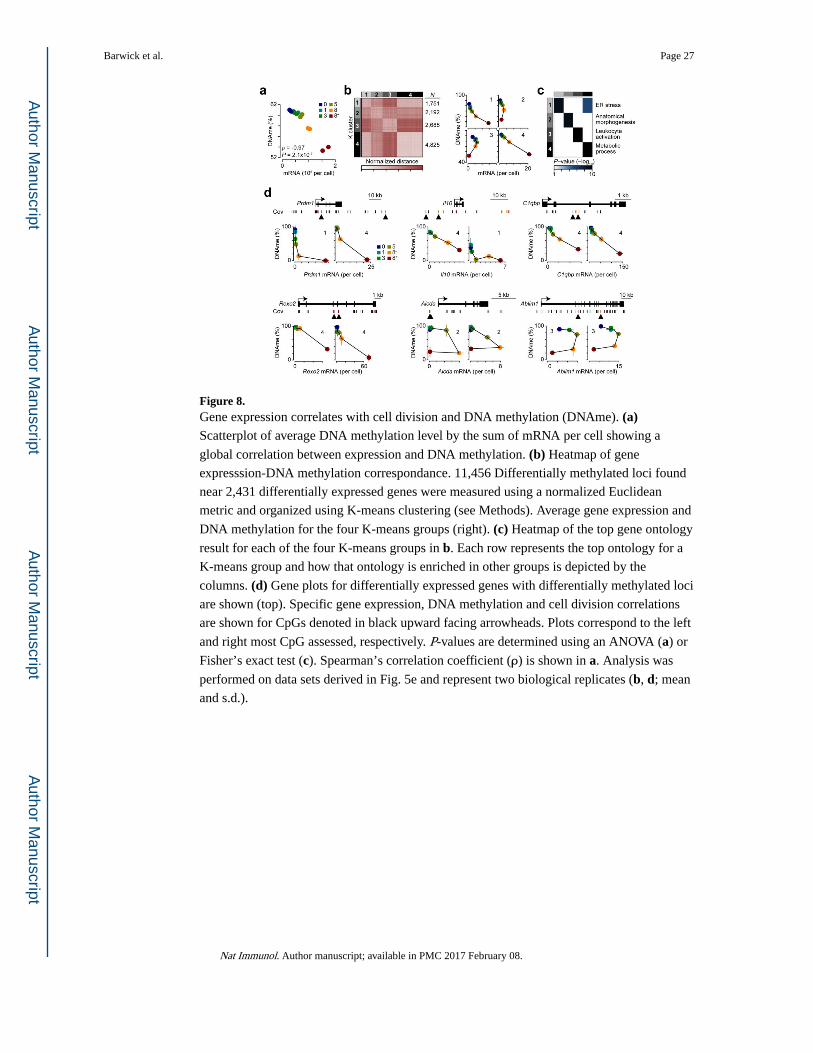
Figure 8. Gene expression correlates with cell division and DNA methylation (DNAme). (a) Scatterplot of average DNA methylation level by the sum of mRNA per cell showing a
global correlation between expression and DNA methylation. (b) Heatmap of gene
expresssion-DNA methylation correspondance. 11,456 Differentially methylated loci found
near 2,431 differentially expressed genes were measured using a normalized Euclidean
metric and organized using K-means clustering (see Methods). Average gene expression and
DNA methylation for the four K-means groups (right). (c) Heatmap of the top gene ontology
result for each of the four K-means groups in b. Each row represents the top ontology for a
K-means group and how that ontology is enriched in other groups is depicted by the
columns. (d) Gene plots for differentially expressed genes with differentially methylated loci
are shown (top). Specific gene expression, DNA methylation and cell division correlations
are shown for CpGs denoted in black upward facing arrowheads. Plots correspond to the left
and right most CpG assessed, respectively. P-values are determined using an ANOVA (a) or
Fisher’s exact test (c). Spearman’s correlation coefficient (ρ) is shown in a. Analysis was
performed on data sets derived in Fig. 5e and represent two biological replicates (b, d; mean
and s.d.).
Barwick et al. Page 27
Nat Immunol. Author manuscript; available in PMC 2017 February 08.
Author M
anuscriptA
uthor Manuscript
Author M
anuscriptA
uthor Manuscript