Embed Size (px)
Citation preview

Research Article 1
Plasma expansion dynamics in ultra-high-pure 2
hydrogen gas 3
Ghaneshwar Gautam 1, and Christian G. Parigger 2,* 4 1 Fort Peck Community College, 605 Indian Avenue, Poplar, MT - 59255; [email protected] 5 2 Department of Physics and Astronomy, University of Tennessee/University of Tennessee Space Institute, 6
411 B. H. Goethert Parkway, Tullahoma, TN - 37388; [email protected] 7 * Correspondence: [email protected]; Tel.: +1-931-841-5690 8
9
Abstract: Micro-plasma is generated in ultra-high-pure hydrogen gas filled inside a cell at a pressure 10 of (1.08 ± 0.033) × 105 Pa (810 ± 25 Torr) by using a Q-switched Nd:YAG laser device operated at 11 1064 nm wavelength and 14 ns pulse duration. Micro-plasma emission spectra of the hydrogen 12 Balmer alpha line, Hα, are recorded with a Czerny-Turner type spectrometer and an intensified 13 charge-coupled device. The spectra are calibrated for wavelength and corrected for detector 14 sensitivity. During the first few tens of nanoseconds after initiating optical breakdown, significantly 15 Stark-broadened and Stark-shifted Hα lines mark the well-above hypersonic outward expansion. 16 The vertical diameters of the spectrally resolved plasma images are measured for time delays of 17 10 ns to 35 ns to determine expansion speeds of the order of 100 km/s to 10 km/s. For time delays of 18 the order of 0.5 µs to 1 µs, the expansion decreases to the speed of sound of 1.3 km/s in the near 19 ambient temperature and pressure hydrogen gas. 20
Keywords: Laser-plasma interactions; Plasma dynamics and flow; Hypersonic flows; Emission 21 Spectra 22
1. Introduction 23
In laser-induced plasma, the ambient gas can foster or diminish the plasma expansion. Pressure and 24 types of gases also influence post-breakdown phenomena. For example, at low pressure, the losses 25 and uniformity of the plasma energy distribution increases [1]. Plasma size, propagation speed, and 26 emission property are also related to the ambient gas into which the plasma expands. Here, we focus 27 on the determination of the expansion speed of the micro-plasma generated in the ultra-high-pure 28 (UHP) hydrogen gas inside a cell. Experimental result shows high plasma expansion speeds of 100 29 km/s to 10 km/s at early time delays of 10 ns to 35 ns. The physical cause of this high speed is the 30 large pressure difference between the plasma and its surrounding environment. The high expansion 31 speed decreases continuously as the time delays increase. Study of the plasma expansion is applicable 32 for astrophysical, engineering, scientific research as well as other various applications [2, 3, 4]. 33
During the plasma expansion, spatial and temporal variations of density, temperature and pressure 34 are observed. Investigation of these spatial and temporal profiles allow us to infer the expansion 35 speeds. Plasma at elevated temperature and pressure expands with high velocity and drives the 36 shock wave into outward direction to release the high pressure. Figures 1 to 3 display the recorded 37 Hα plasma spectra at early time delays of 10 ns to 35 ns in 5 ns steps. The 2-dimensional spectra of 38 slit-height versus wavelength are significantly Stark-broadened and Stark-shifted at early time 39 delays. The measured intensity is increasing for successive time delays. However, the area under the 40 spectral profiles decreases continuously due to the decrease of the line widths, consistent with 41 decreasing electron density. If the incident laser beam is focused to above breakdown threshold 42 irradiance, breakdown occurs at a location before the pulse reaches its focal point, as indicated in 43
Preprints (www.preprints.org) | NOT PEER-REVIEWED | Posted: 13 July 2018 doi:10.20944/preprints201807.0229.v1
© 2018 by the author(s). Distributed under a Creative Commons CC BY license.
Peer-reviewed version available at Atoms 2018, 6, 46; doi:10.3390/atoms6030046
2 of 6
Figure 5 of Reference [5]. This type of behavior is also observed in the hydrogen experiments reported 44 in this work. 45
The interaction between the laser beam and material is a complex process, and depends on many 46 characteristics such as laser parameters or target material. Various factors affect the interaction 47 including the properties such as the pulse width, spatial and temporal fluctuation of the pulse as well 48 as the peak irradiance variations. For example, effects of pulse width on nascent laser-induced 49 bubbles for underwater laser-induced breakdown spectroscopy (LIBS) show that a long pulse causes 50 well-defined, clear line spectra. In turn, a short pulse usually causes considerably asymmetric or 51 deformed spectra. However, this effect is more significant for solid target material than for gases [6]. 52
2. Results 53
From the recorded Hα plasma spectra at early time delay as displayed in Figures 1 – 3, plasma 54 expansion speeds are determined. The diameter of the plasma in the lateral or slit-height direction is 55 measured as a function of time, and hence plasma expansion speed can be determined. For example, 56 the red arrows on the spectra images at 10 ns and 15 ns in Figure 1 indicates the spatial plasma ranges 57 used for the determination of the expansion speeds. 58 59
60 61
Figure 1. Hydrogen alpha plasma spectra images at 10 ns (left) and 15 ns (right) time delays. The 62 red arrow indicates the measured plasma width. 63
64
65 66
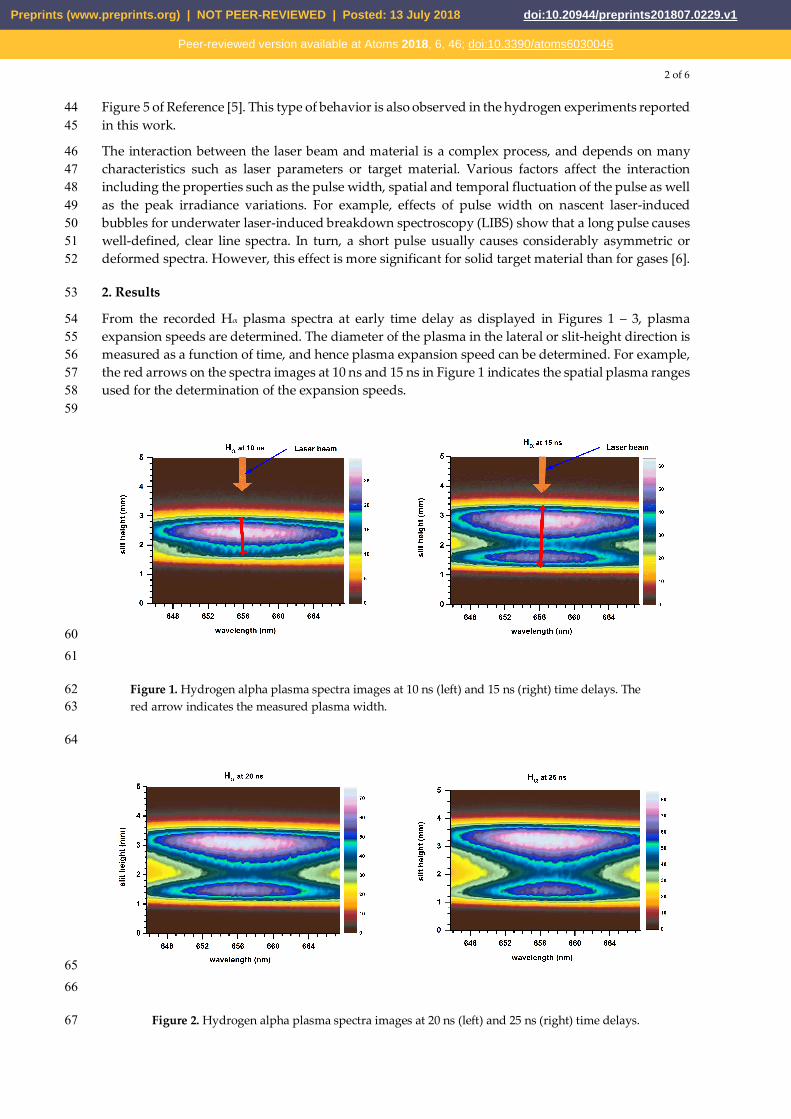
Figure 2. Hydrogen alpha plasma spectra images at 20 ns (left) and 25 ns (right) time delays. 67
Preprints (www.preprints.org) | NOT PEER-REVIEWED | Posted: 13 July 2018 doi:10.20944/preprints201807.0229.v1
Peer-reviewed version available at Atoms 2018, 6, 46; doi:10.3390/atoms6030046

3 of 6
68 69
Figure 3. Hydrogen alpha plasma spectra images at 30 ns (left) and 35 ns (right) time delays. 70
The recorded images of the laser-induced plasma with 14 ns pulses depict higher intensity 71 towards the laser at early time delay of 10 ns to 35 ns. On the other hand, previous 72 experiment performed in hydrogen gas at 1.08 × 10⁵ Pa (810 Torr) pressure with 6 ns pulse 73 duration show higher intensity away from the laser propagation direction, for time delays 74 of 12 ns and 30 ns. Opposite behavior occurs for a time delay of 300 ns [7]. This opposite 75 behavior at later time delay is also observed in the experimental records as displayed in 76 Figure 4. 77
78
79 80
Figure 4. Hydrogen alpha plasma spectra images at 400 ns (left) and 900 ns (right) time delays. 81
82 In comparison, the experimental results in air, using Nd:YAG laser at the wavelength of 532 nm and 83 pulse width of 6.5 ns, show two distinct regions with higher intensity towards the laser propagation 84 direction for time delays of 25 ns to 10 µs, see Figure 8 in Reference [8]. Schlieren images of the laser-85 induced plasma generated in air at standard ambient temperature and pressure also show the jet 86 propagation towards the laser for time delays of 1 µs to 20 µs [9]. However, the jet propagation 87 direction depends on the type of gas and its pressure as displayed in Figure 3 in Reference [9]. 88 Furthermore, the jet propagation depends on the ratio of energy absorbed in the plasma and 89 threshold irradiance for optical breakdown [9]. 90 91
Preprints (www.preprints.org) | NOT PEER-REVIEWED | Posted: 13 July 2018 doi:10.20944/preprints201807.0229.v1
Peer-reviewed version available at Atoms 2018, 6, 46; doi:10.3390/atoms6030046

4 of 6
From the images in Figures 1 to 3, the diameter of the plasma in lateral or slit height direction is 92 measured as a function of time, and hence plasma expansion speeds can be diagnosed. The measured 93 diameters of the plasma and corresponding speeds at various time delays are displayed in Table 1. 94
Table 1. Plasma expansion speed at various time delay using lateral direction expansion from the 95 contour plots exhibited in Figures (1 – 4). 96
Time (ns)
Diameter (mm)
Distance in 5 ns (mm)
Speed (km/s)
10 1.32 -- -- 15 2.03 0.71 142 20 2.42 0.39 78 25 2.71 0.29 58 30 2.86 0.15 30 35 2.92 0.06 12 400 0.96 -- -- 900 1.81 0.85* 1.70
*Distance is for 500 ns. 97 98 99 The predicted plasma expansion speeds are of the order of 100 to 10 km/s at the indicated time delays. 100 The determined expansion speeds are well-above hypersonic speed (Mach number ≥ 5) or above re-101 entry speeds (Mach number ≤ 25) at these time delays, as displayed in Figure 5. 102 103
104
Figure 5. Plasma expansion speeds in log scale (see Table 1). The indicated time-delay error bars are 105 due to the gate width of 5 ns. 106
The speed decreases to typically hypersonic speed for larger time delays than indicated in Figure 5. 107 The predicted expansion speeds agree with results from previous experiments [9, 10]. Computer 108 simulations show a shock wave expansion speed of 60 km/s at a time delay of 20 ns in air and at 109 atmosphere pressure [11], thereby indicating that the determined speeds are in agreement with other 110 experiments as well. The notable point here is that speed of sound in hydrogen gas is 1.3 km/s, a 111 factor of 3.5 higher than in air. For later time delays of about 1 µs, the images in Figure 4 are utilized 112 for the diagnostics of the plasma expansion speed. The determined speed is 1.7 ± 0.5 km/s at 900 ns. 113 This result appears reasonable when comparing to the results of the recent hydrogen experiments 114 [12]. The estimated error bars for these speeds are ± 30%. 115
Preprints (www.preprints.org) | NOT PEER-REVIEWED | Posted: 13 July 2018 doi:10.20944/preprints201807.0229.v1
Peer-reviewed version available at Atoms 2018, 6, 46; doi:10.3390/atoms6030046

5 of 6
116 3. Discussion 117 The laser-induced plasma expands with well-above hypersonic speed depending upon the ambient 118 conditions and time delays. The spectra recorded during the evolution of the plasma are significantly 119 Stark-broadened and Stark-shifted, therefore, a larger percentage error occurs for the predicted 120 speeds for earlier time delays. For later time delays, plasma expansion speeds decrease considerably, 121 therefore, larger differences occur for the speed measurement due to the increased temporal interval. 122 To improve the graphically inferred expansion speeds, Abel inversion methods can be applied so that 123 radial information will be extracted from the recorded line-of-sight measurements [13]. The predicted 124 expansion speeds may be useful for the NASA hypersonic technology (HT) project. Hydrogen 125 redshifts of hydrogen alpha and hydrogen beta lines are applicable in the study of white dwarfs [14]. 126 Details of the focal volume irradiance distribution [15] for the study of laser-induced optical 127 breakdown may augment the analysis. 128 129
4. Materials and Methods 130
In the experimental arrangement, ultra-high-pure (UHP) hydrogen gas is filled inside a cell at 131 pressure of (1.08 ± 0.033) × 105 Pa (810 ± 25 Torr). To study time-resolved and space-resolved emission 132 spectroscopy, a Q-switched Nd:YAG laser device is used at its fundamental wavelength of 1064 nm 133 with 10 Hz repetition rate and 14 ns full-width-half-maximum pulses. The measured energy per 134 pulse is 120 mJ. The laser beam was passed through a dichroic beam splitter to remove the residual 135 532 nm component. A silicon photodiode detector was used to record a portion of the laser radiation 136 reflected off of the beam splitter at the exit of the laser source. The photodiode is connected to the 137 oscilloscope to monitor the optical pulse. Three mirrors (NB1-K13; Thorlabs) are used to align the 138 beam parallel to the spectrometer slit. A holographic grating of 1200 grooves/mm is selected to 139 disperse the radiation from the plasma. For the recording of temporally and spatially resolved plasma 140 emission spectra images along the slit height, the following instrumentation is employed: Czerny-141 Turner type spectrometer (0.64 m - HR640; Jobin-Yvon) and 2-dimensional integrated charged 142 coupled device (ICCD) (Andor technology model iStar). The spectral resolution amounted to 0.11 143 nm. The data were recorded with a 5 ns gate width and an average of 100 consecutive laser-plasma 144 events were accumulated. For later time delays of 400 ns and 900 ns, 20 ns gate width and 50 145 consecutive laser-plasma events were accumulated. The recorded spectra are wavelength calibrated 146 and corrected for detector sensitivity. 147
5. Conclusions 148
Optical breakdown is induced by using pulsed laser radiation. Emission spectra are collected by 149 employing a spectrometer equipped with an intensified charge-coupled device. Laser-induced micro-150 plasma dynamics are investigated in ultra-high-pure hydrogen gas focusing on atomic spectroscopy 151 of hydrogen in the visible region. Line-of-sight measurements are analyzed to obtain the plasma 152 dynamics that occur initially well-above re-entry speeds, diminish to hypersonic, and then 153 supersonic expansions. Expansion velocities are measured that are above three hundred times the 154 speed of sound in standard atmosphere. The recorded spectra can also be utilized to explore the 155 spatial distributions of electron densities and excitation temperatures. 156
Author Contributions: Christian G. Parigger and Ghaneshwar Gautam designed and performed the 157 experiments. Ghaneshwar Gautam analyzed the result and wrote the paper with suggestions from Christian G. 158 Parigger. 159
Acknowledgments: This work is in part supported by the Center of excellence for Laser Applications at The 160 University of Tennessee Space Institute. 161
Conflicts of Interest: The authors declare no conflict of interest. 162
Preprints (www.preprints.org) | NOT PEER-REVIEWED | Posted: 13 July 2018 doi:10.20944/preprints201807.0229.v1
Peer-reviewed version available at Atoms 2018, 6, 46; doi:10.3390/atoms6030046

6 of 6
References 163
1. Anabitarte, F., Cobo, A., and Lopez-Higuera, J.M. Laser-induced breakdown spectroscopy: 164 fundamentals, applications, and challenges. International Scholarly Research Notes: Spectroscopy 2012, 165 doi: doi:10.5402/2012/285240. 166
2. Falcon, R.E., Rochau G.A., Bailey, J.E., Ellis, J.L., Carlson, A.L., Gomez, T.A., Montgomery, M.H., 167 Winget, D.E., Chen, E.Y., Gomez, M.R., Nash, T.J. An experimental platform for creating white dwarf 168 photospheres in the laboratory. High Energy Density Physics 2013 9, pp. 82-90, 169 doi: https://doi.org/10.1016/j.hedp.2012.10.005. 170
3. Falcon, R.E, Rochau, G.A., Bailey, J.E., Gomez, T.A., Montgomery, M.H., Winget, D.E., and T. 171 Nagayama, T. Laboratory measurements of white dwarf photospheric spectral lines: Hβ. Astrophy. J. 172 2015, 806:214, 11 pp., doi: https://doi.org/10.1088/0004-637X/806/2/214. 173
4. Engeln, R., Mazouffre, S., Vankan, P., Bakker, I., Schram, D.C. Plasma expansion: fundamentals and 174 applications. Plasma Sources Science Technology 2002, 11, pp. A100, doi: https://doi.org/10.1088/0963-175 0252/11/3A/315. 176
5. Chen, Y.L., Lewis, J.W.L., and Parigger, C.G. Spatial and temporal profiles of pulsed laser-induced air 177 plasma emissions. J. Quant. Spectrosc. Radiat. Transfer 2000, 67, pp. 91-103, doi: 178 https://doi.org/10.1016/S0022-4073(99)00196-X. 179
6. Sakka, T., Tamura, A., Matsumoto, A., Fukami, K., Nishi, N., and Thornton, B. Effects of pulse width 180 on nascent width on nascent laser-induced bubbles for underwater laser-induced breakdown 181 spectroscopy. Spectrochim. Acta Part B: At. Spectrosc. 2014, 97, pp. 94-98, 182 doi: https://doi.org/10.1016/j.sab.2014.05.009. 183
7. Glumac, N., Elliott, G. and Boguszko, M. Temporal and spatial evolution of a laser spark in air. AIAA 184 Journal 2005, 34, pp. 1984-1994, https://doi.org/10.2514/1.14886. 185
8. Brieschenk, S., O’Byrne, S. and Kleine, H. Visualization of jet development in laser-induced plasmas, 186 Opt. Lett. 2013, 38, pp. 664-666, doi: https://doi.org/10.1364/OL.38.000664. 187
9. Parigger, C.G., Plemmons, D. H., and Lewis, J.W.L. Spatially and temporally resolved electron number 188 density measurements in a decaying laser-induced plasma using hydrogen-alpha line profiles. 189 Appl. Opt. 1995, 34, pp. 3325-3330, doi: https://doi.org/10.1364/AO.34.003325. 190
10. Parigger, C.G. Atomic and molecular emissions in laser-induced breakdown spectroscopy. Spectrochim. 191 Acta Part B: At. Spectrosc. 2013, 79, pp. 4-16, doi: https://doi.org/10.1016/j.sab.2012.11.012. 192
11. Sobral, H., Villagrán-Muniz, M., Navarro-González, R., and Raga, A. C. Temporal evolution of the 193 shock wave and hot core air in laser induced plasma. Appl. Phys. Lett. 2000, 77, pp. 3158-3160, 194 doi: https://doi.org/10.1063/1.1324986. 195
12. Parigger, C. G., Surmick, D. M., and Gautam, G. Self-absorption characteristics of measured laser-196 induced plasma line shapes. J. Phys.: Conf. Ser. 2017 810, pp. 012012, doi: https://doi.org/10.1088/1742-197 6596/810/1/012012. 198
13. Parigger, C. G., Gautam, G., and Surmick, D. M. Radial electron density measurements in laser-induced 199 plasma from Abel inverted hydrogen Balmer beta line profiles. Int. Rev. At. Mol. Phys. 2015, 6, pp. 43-200 55. 201
14. Parigger, C.G., Drake, K.A., Helstern, C.M., Gautam, G. Laboratory Hydrogen-Beta Emission 202 Spectroscopy for Analysis of Astrophysical White Dwarf Spectra. Atoms 2018, 6, pp. 33–49. 203 doi: https://doi.org/10.3390/atoms6030036. 204
15. Parigger, C.G. Laser-induced breakdown in gases: Experiments and simulation. In Laser-induced 205 breakdown spectroscopy. Miziolek, A. W., Palleschi, V., and Schechter, I., Eds. Cambridge University 206 Press, 2006. 207
Preprints (www.preprints.org) | NOT PEER-REVIEWED | Posted: 13 July 2018 doi:10.20944/preprints201807.0229.v1
Peer-reviewed version available at Atoms 2018, 6, 46; doi:10.3390/atoms6030046