Embed Size (px)
Citation preview
0270-91 39/X4/0~04-0577~02.00/0 HEPATOLOGY Copyright 0 1984 h y the American Association for the Study of Liver Diseases
Vol. 4 , No. 4. JJP. 577-585, 1984 Printed in L1.S.A.
Original Articles Plasma Lipoprotein and Apolipoprotein Profile in Alcoholic Patients with and without Liver Disease: On the Relative Roles of Alcohol and
Liver Injury GILLES DUHAMEL, BERTRAND NALPAS, SONIA GOLDSTEIN, P. MICHEL LAPLAUD,
PIERRE BERTHELOT AND M. JOHN CHAPMAN
Unit6 39 INSERM, H6pital de la Pitie, 75651 Paris, France; Unite d’Hkpatologie, INSERM U 99, H6pital Laennec, 75007 Paris, France; and Laboratoire de Biochimie Medicale, Faculte de
Medecine et Pharmacie, 87042 Limoges Cedex, France
In the present study, we report on alterations in plasma lipid, lipoprotein and apolipoprotein patterns in three separate populations of alcoholic patients, one without liver damage (Group I), a second presenting steatosis or mild alcoholic hepatitis or both (Group 11) and a third with alcoholic cirrhosis (Group 111), using a healthy, normolipidemic, nonalcoholic group as controls (Group C). Total plasma cholesterol levels were elevated in Groups I1 and I11 when compared with Groups I and C, while the ratio of esterified to free cholesterol was considerably lower in Group I11 than in the other groups. Plasma apo-A1 levels were higher in Groups I and I1 than in Group C, but varied over a wide range in Group 111. Apo-AIL was present at higher concentrations in Groups I and I1 than in both Groups 111 and C. In contrast, no significant differences were detected in total apo-B levels, irrespective of the group. Modifications in the chemical composition of plasma lipoproteins primarily concerned a reduction in the cholesteryl ester content of low-density lipoproteins (LDL) and high-density lipoprotein (HDL) in Group 111, this being compensated by a reciprocal increase in triglyceride. In addition, Group 111 lipoproteins, with the exception of HDLs (density 1.100 to 1.140 gm per ml), exhibited a greater content of phospholipids than those of corresponding density from patients in Groups I and IT. No significant differences were found in very low-density lipoprotein concentrations, while LDL levels increased in parallel with the severity of liver injury. In Groups I and 11, HDLz concentrations were elevated relative to Group C, while HDL3 decreased in parallel with the degree of impairment of liver function and thus from Group C to Group 111. Such opposing tendencies led to an HDL2:HDL3 ratio which was more than &fold higher than normal in Group 111.
The distribution of apoprotein B in the ultracentrifugal subfractions revealed no significant modification between the different groups. By contrast, in Groups I and 11, apo-A1 and apo-A11 levels increased consequent to higher concentrations of HDL2. Our data suggest that abnormal HDL particles preferentially enriched in apo- A11 and possibly apo-A1 were present in Group I, while the lowest levels of both apo-A1 and apo-A11 were seen in Group 111.
No simple association is evident between a well-defined plasma lipid, lipoprotein and/or apoli- poprotein profile and chronic alcoholism in the presence or absence of liver injury. Nonetheless, our findings suggest that measurement of the absolute concentrations and ratio of HDL2 and HDL3, as well as of the levels and ratio of apo-A1 and apo-A11 in these subclasses, may permit differentia- tion of certain of the subpopulations of chronic alcoholics described herein.
Heavy alcohol consumption for prolonged periods re- sults in marked perturbation of the lipid transport sys- tern in man, reflecting both the effects O f ethanol On lipid metabolism in hepatic and extrahepatic tissues, as well
hansson B. G. and Nilsson-Ehle, P., N . Engl. J. Med.
In an attempt to shed more light on the basic biochem-
Received dune 16, 1983; accepted January 17, 1984. Drs. Berthelot, Chapman and Laplaud gratefully acknowledge the
award Grant HCEIA 1980.02 from the Haut Cornit& d’Etude et #Information sur 1’Alcoolisme in support of this work. Dr. Duhamel
Recherche Scientifique et Technique”.
1 3 , France.
was supported by a fellowship from the “Delegation Genkrale de la
Address reprint requests to: M. dohn Chapman, Ph.D., INSERM U- 9, H6pital de la Piti6, 83, Boulevard de I’Hdpital, 7.5651 Paris Cedex
as its marked toxic effects on liver function (1-7, Jo-
Ig7@ 298:633-6347 Correspondence)*
577
578 DUHAMEL ET AL. HEPATOLOGY
ical mechanisms of these abnormalities, and in particular to define more precisely the respective roles of alcohol and of liver injury, we have determined the plasma lipoprotein and apolipoprotein profile in three separate populations of alcoholic patients, one without liver dam- age, a second presenting steatosis or mild alcoholic hep- atitis, or both, and a third with alcoholic cirrhosis. The characteristics of these three groups were compared with those of a healthy normolipidemic, nonalcoholic control group. In this study, we have utilized a density gradient ultracentrifugal procedure (8) whose resolution and pre- cision facilitate essentially quantitative isolation of very low-density lipoproteins (VLDL), low-density lipopro- teins (LDL), high-density lipoproteins-2 (HDLZ, a sub- class of HDL of density 1.066 to 1.100 gm per ml, unless otherwise defined) and high-density lipoproteins-3 (HDL3, a subclass of HDL of density 1.100 to 1.140 gm per ml, unless otherwise defined) and intermediate subfractions in a single spin. Our data suggest that certain lipoprotein and apolipoprotein abnormalities, and especially those concerning the absolute concentra- tions and ratios of HDL2 and HDL3, and of apo-A1 and apo-A11 in these subclasses, may be correlated with the progression of hepatic disease.
PATIENTS AND METHODS Thirty male patients were included in the study, all of
whose alcohol consumption had exceeded 100 gm of ethanol per day for the last 5 years at least; such amounts were consumed up to the day of admission. None were obese, all having had an irregular diet during the few days prior to hospitalization; none had received any drug known to affect lipoprotein metablism in the immediate period preceding their study at admission. The HBs antigen was not detected in the serum of any of the patients. Ten patients, aged 22 to 55 years, were included in the first group: on the basis of clinical examination and standard biological parameters of hepatic function (SGOT, SGPT, alkaline phosphatase, bilirubin, bromo- sulfonephthalein clearance, prothrombin time, serum protein electrophoresis), they were considered as having normal liver function. Group I1 was comprised of 10 patients, aged 29 to 55 years, with histological features of alcoholic liver injury other than cirrhosis; four patients displayed only a fatty liver, while six had mild alcoholic hepatitis associated with steatosis, i.e., Grade I according to an International Group (9). Group I11 consisted of 10 patients, aged 28 to 60 years, with alcoholic cirrhosis; of these, seven exhibited histological features typical of moderate to severe alcoholic hepatitis, in addition to those of cirrhosis i.e., Grades I to I11 (9). Nine healthy, nonalcoholic, normolipidemic males, aged 28 to 52 years, were studied as controls for the above groups.
BLOOD SAMPLES Subjects were bled after an overnight fast, typically on
the first or second day of admission, that is no longer than 48 hr after cessation of alcohol abuse. Plasma was isolated from freshly drawn, venous blood collected on EDTA (1 mg per ml). Sodium azide (0.01% w/v) and sodium merthiolate (0.001% w/v) were added to all sam- ples prior to lipoprotein separation.
ISOLATION OF SERUM LIPOPROTEINS A density gradient ultracentrifugal procedure was used
for the preparative fractionation of plasma lipoproteins, as previously described (8). Five-step discontinuous den- sity gradients containing 3 ml of the plasma sample (adjusted to a density of 1.21 gm per ml with solid KBr) and different volumes of a series of NaC1-KBr solutions of density 1.240, 1.063, 1.019 and 1.006 gm per ml, respectively, were constructed at ambient temperature in cellulose nitrate tubes (9/16” diameter x 3%” length) of the Beckman SW 41-Ti swinging bucket rotor. Gra- dients were centrifuged at 40,000 rpm (210,000 g average) for 48 hr a t 15°C in a Sorvall OTD-50 ultracentrifuge in the Reograd/ARC slow mode. Gradients were subse- quently subfractionated by successive downward aspira- tion of fractions of 1 to 2 ml with a narrow-bore Pasteur pipette; in each case, the volume removed was adjusted to correspond as far as possible to either visible bands of lipoproteins or to lipoprotein-poor zones. The density interval to which each fraction corresponded was deter- mined by reference to the density profile obtained from control gradients in which serum had been replaced by 3 ml of a density 1.21 gm per ml NaCl/KBr solution [for a representative density profile, see Figure 2 in Ref. (a)].
Typically, the major fractions obtained by this proce- dure are: Band 1, containing VLDL of density < 1.016 gm per ml; IFa, intermediate fraction a of density 1.016 to 1.028 gm per ml; Band 11, containing LDL of density 1.028 to 1.050 gm per ml; IFb, intermediate fraction b of density 1.050 to 1.066 gm per ml; Band 111, containing HDL2 of density 1.066 to 1.100 gm per ml; Band IV, containing HDL3 of density 1.100 to 1.140 gm per ml; IFc, intermediate fraction c of density 1.140 to 1.154 gm per ml and containing HDL3-like particles (a), and finally the ultracentrifugal residue (density > 1.154 gm per ml) containing only trace amounts of lipid. All fractions were dialyzed in “Spectrapor” membrane tubing (molecular weight cutoff 3,500; Spectrum Medical Industries, Los Angeles, Calif.) at 4°C against a solution containing sodium azide (0.02% w/v), merthiolate (0.001%), EDTA (0.04%), Tris (5 mM) and NaCl (50 mM) at pH 7.4. The purity of these lipoprotein fractions and their lack of contamination with serum proteins has previously been determined (8).
ANALYTICAL ULTRACENTRIFUGATION This type of analysis was performed as described by
Laplaud et al. (10). Briefly, serum lipoproteins with hydrated density less than 1.21 gm per ml were first isolated by preparative ultracentrifugation in a NaC1- NaBr medium for 36 hr at 100,000 gaveand 17”C, in order to recover HDL entirely. Analytical runs were carried out in an MSE Centriscan 75 analytical ultracentrifuge operating in the refractometric (Schlieren) mode at 550 nm, scans being taken after 60 min. Determination of serum lipoprotein concentrations from analytical scans required calibration of the ultracentrifuge with various known concentrations of bovine serum albumin solutions subjected to the same conditions as the samples of human lipoproteins.
Vol. 4, No. 4, 1984 LIPOPROTEIN AND APOPROTEIN PROFILES IN CHRONIC ALCOHOLICS 579
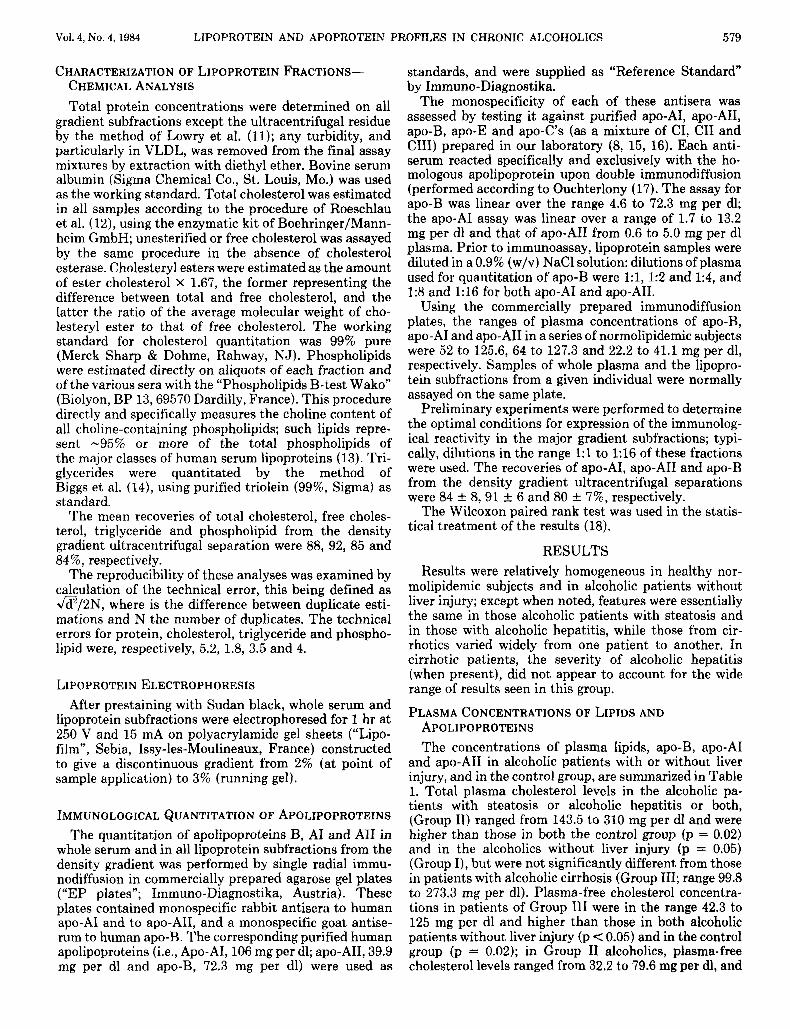
CHARACTERIZATION OF LIPOPROTEIN FRACTIONS- CHEMICAL ANALYSIS Total protein concentrations were determined on all
gradient subfractions except the ultracentrifugal residue by the method of Lowry et al. (11); any turbidity, and particularly in VLDL, was removed from the final assay mixtures by extraction with diethyl ether. Bovine serum albumin (Sigma Chemical Co., St. Louis, Mo.) was used as the working standard. Total cholesterol was estimated in all samples according to the procedure of Roeschlau et al. (12), using the enzymatic kit of Boehringer/Mann- heim GmbH; unesterified or free cholesterol was assayed by the same procedure in the absence of cholesterol esterase. Cholesteryl esters were estimated as the amount of ester cholesterol X 1.67, the former representing the difference between total and free cholesterol, and the latter the ratio of the average molecular weight of cho- lesteryl ester to that of free cholesterol. The working standard for cholesterol quantitation was 99% pure (Merck Sharp & Dohme, Rahway, NJ). Phospholipids were estimated directly on aliquots of each fraction and of the various sera with the “Phospholipids B-test Wako” (Biolyon, BP 13,69570 Dardilly, France). This procedure directly and specifically measures the choline content of all choline-containing phospholipids; such lipids repre- sent -95% or more of the total phospholipids of the major classes of human serum lipoproteins (13). Tri- glycerides were quantitated by the method of Biggs et al. (14), using purified triolein (99%, Sigma) as standard.
The mean recoveries of total cholesterol, free choles- terol, triglyceride and phospholipid from the density gradient ultracentrifugal separation were 88, 92, 85 and 8496, respectively.
The reproducibility of these analyses was examined by calculation of the technical error, this being defined as @/2N, where is the difference between duplicate esti- mations and N the number of duplicates. The technical errors for protein, cholesterol, triglyceride and phospho- lipid were, respectively, 5.2, 1.8, 3.5 and 4.
LIPOPROTEIN ELECTROPHORESIS After prestaining with Sudan black, whole serum and
lipoprotein subfractions were electrophoresed for 1 hr at 250 V and 15 mA on polyacrylamide gel sheets (“Lipo- film”, Sebia, Issy-les-Moulineaux, France) constructed to give a discontinuous gradient from 2% (at point of sample application) to 3% (running gel).
IMMUNOLOGICAL QUANTITATION OF APOLIPOPROTEINS The quantitation of apolipoproteins B, A1 and A11 in
whole serum and in all lipoprotein subfractions from the density gradient was performed by single radial immu- nodiffusion in commercially prepared agarose gel plates (“EP plates”; Immuno-Diagnostika, Austria). These plates contained monospecific rabbit antisera to human apo-AX and to apo-AII, and a monospecific goat antise- rum to human apo-B. The corresponding purified human apolipoproteins (i.e., Apo-AI, 106 mg per dl; apo-AII, 39.9 mg per dl and apo-B, 72.3 mg per dl) were used as
standards, and were supplied as “Reference Standard” by Immuno-Diagnostika.
The monospecificity of each of these antisera was assessed by testing it against purified apo-AI, apo-AII, apo-B, apo-E and apo-C’s (as a mixture of CI, CII and CIII) prepared in our laboratory (8, 15, 16). Each anti- serum reacted specifically and exclusively with the ho- mologous apolipoprotein upon double immunodiffusion (performed according to Ouchterlony (17). The assay for apo-B was linear aver the range 4.6 to 72.3 mg per dl; the apo-A1 assay was linear over a range of 1.7 to 13.2 mg per dl and that of apo-A11 from 0.6 to 5.0 mg per dl plasma. Prior to immunoassay, lipoprotein samples were diluted in a 0.9% (w/v) NaCl solution: dilutions of plasma used for quantitation of apo-B were 1:1, 1:2 and 1:4, and 1:8 and 1:16 for both apo-A1 and apo-AII.
Using the commercially prepared immunodiffusion plates, the ranges of plasma concentrations of apo-B, apo-A1 and apo-A11 in a series of normolipidemic subjects were 52 to 125.6, 64 to 127.3 and 22.2 to 41.1 mg per dl, respectively. Samples of whole plasma and the lipopro- tein subfractions from a given individual were normally assayed on the same plate.
Preliminary experiments were performed to determine the optimal conditions for expression of the immunolog- ical reactivity in the major gradient subfractions; typi- cally, dilutions in the range 1:l to 1:16 of these fractions were used. The recoveries of apo-AI, apo-A11 and apo-B from the density gradient ultracentrifugal separations were 84 & 8,91 k 6 and 80 +- 7%, respectively.
The Wilcoxon paired rank test was used in the statis- tical treatment of the results (18).
RESULTS Results were relatively homogeneous in healthy nor-
molipidemic subjects and in alcoholic patients without liver injury; except when noted, features were essentially the same in those alcoholic patients with steatosis and in those with alcoholic hepatitis, while those from cir- rhotics varied widely from one patient to another. In cirrhotic patients, the severity of alcoholic hepatitis (when present), did not appear to account for the wide range of results seen in this group.
PLASMA CONCENTRATIONS OF LIPIDS AND APOLIPOPROTEINS The concentrations of plasma lipids, apo-B, apo-A1
and apo-A11 in alcoholic patients with or without liver injury, and in the control group, are summarized in Table 1. Total plasma cholesterol levels in the alcoholic pa- tients with steatosis or alcoholic hepatitis or both, (Group 11) ranged from 143.5 to 310 mg per dl and were higher than those in both the control group (p = 0.02) and in the alcoholics without liver injury (p = 0.05) (Group I), but were not significantly different from those in patients with alcoholic cirrhosis (Group 111; range 99.8 to 273.3 mg per dl). Plasma-free cholesterol concentra- tions in patients of Group 111 were in the range 42.3 to 125 mg per dl and higher than those in both alcoholic patients without liver injury (p < 0.05) and in the control group (p = 0.02); in Group I1 alcoholics, plasma-free cholesterol levels ranged from 32.2 to 79.6 mg per dl, and
580 DUHAMEL ET AL. HEPATOLOGY
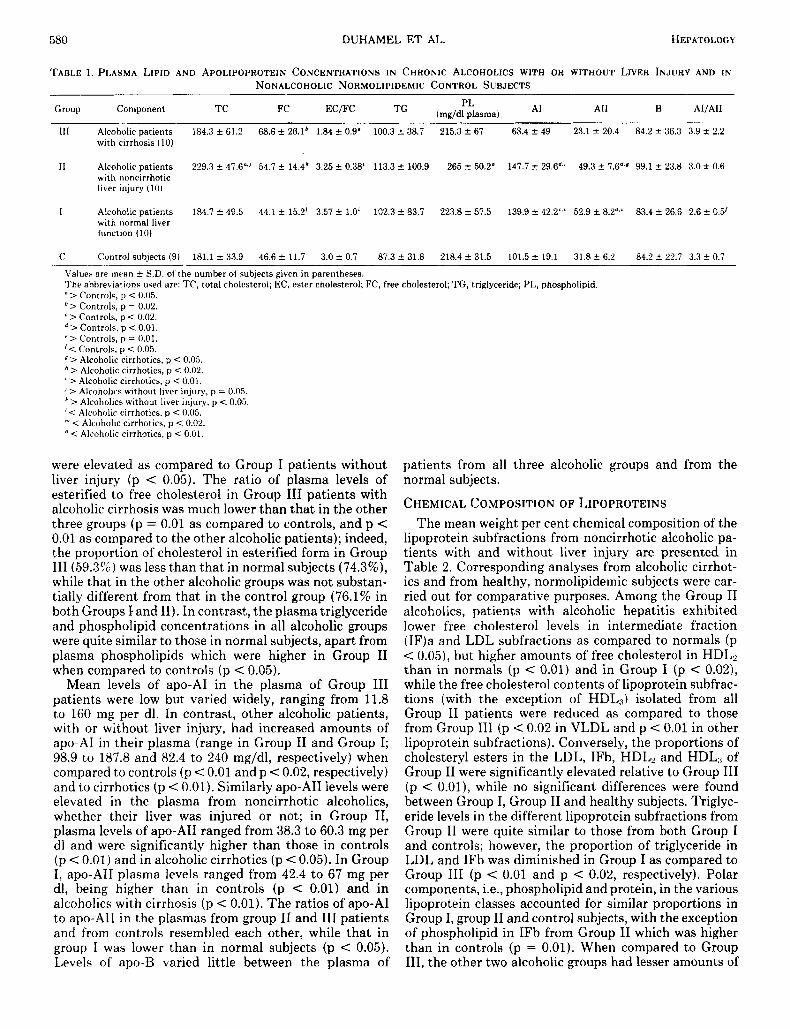
TABLE 1. P L A S M A LIPID AND APOLIPOPROTEIN CONCENTRATIONS I N CHRONIC ALCOHOLICS WITH OR WITHOUT LIVER I N J U R Y AND IN NONALCOHOLIC NORMOLIPIDEMIC CONTROL SUBJECTS
C; roup Component TC A1 PL TG (mg/dl plasma) FC ECfFC A11 B AljAII
111 Alcoholic patients 184.3 f 61.2 68.6 f 26.1b 1.84 f 0.9' 100.3 & 38.7 215.3 f 67 63.4 f 49 23.1 f 20.4 84.2 ? 36.3 3.9 t 2.2 with cirrhosis (10)
11 Alcoholic patients 229.3 ? 47.6O.J 54.7 2 14.4* 3.25 f 0.38' 113.3 2 100.9 265 f 50.2" 147.7 f 29.6d.' 49.3 f 7.6d,s 99.1 f 23.8 3.0 f 0.6 with iioncirrhotic liver injury (10)
I Alcoholic patients 184.7 f 49.5 44.1 ? 15.2' 3.57 t 1.0' 102.3 2 83.7 223.8 C 57.5 139.9 f 42.2'.' 52.9 f 8.!Ld.' 83.4 f 26.6 2.6 f 0.5' with normal liver function (10)
c Control subjects (9) 181.1 f 33.9 46.6 f 11.7 3.0? 0.7 87.3 2 31.8 218.4 f 31.5 101.5 f 19.1 31.8 f 6.2 84.2 2 22.7 3.3 f 0.7
Values are inran ? S.D. of the number ot subjects given in parentheses. The ahtireviarions used are: TC, total cholesterol; EC, ester cholesterol; FC, free cholesterol; TG, triglyceride; PL, phospholipid. > Controls. p < 0.05. > Controls, p = 0.02.
' > Controls, p < 0.02. '>Controls. p < 0.01. ' > Controls, p = 0.01. /< Controls, p < 0.05. > Alcoholic cirrhotics, p < 0.05. > Alcoholic cirrhotics, p < 0.02.
' > Alcoholic cirrhotics, p < 0.01. ' > Alcoholics without liver injury, p = 0.05. ' > Alcoholics without liver injury, p < 0.05 '< Alcoholic cirrhotics, p < 0.05. * < Alcoholic cirrhotics, p < 0.02. < Alcoholic cirrhotics, p < 0.01.
were elevated as compared to Group I patients without liver injury (p < 0.05). The ratio of plasma levels of esterified to free cholesterol in Group 111 patients with alcoholic cirrhosis was much lower than that in the other three groups (p = 0.01 as compared to controls, and p < 0.01 as compared to the other alcoholic patients); indeed, the proportion of cholesterol in esterified form in Group I11 (59.3%) was less than that in normal subjects (74.3%), while that in the other alcoholic groups was not substan- tially different from that in the control group (76.1% in both Groups l a n d 11). In contrast, the plasma triglyceride and phospholipid concentrations in all alcoholic groups were quite similar to those in normal subjects, apart from plasma phospholipids which were higher in Group I1 when compared to controls (p < 0.05).
Mean levels of apo-A1 in the plasma of Group 111 patients were low but varied widely, ranging from 11.8 to 160 mg per dl. In contrast, other alcoholic patients, with or without liver injury, had increased amounts of apo-A1 in their plasma (range in Group I1 and Group I; 98.9 to 187.8 and 82.4 to 240 mg/dl, respectively) when compared to controls (p < 0.01 a n d p < 0.02, respectively) and to cirrhotics (p < 0.01). Similarly apo-A11 levels were elevated in the plasma from noncirrhotic alcoholics, whether their liver was injured or not; in Group 11, plasma levels of apo-A11 ranged from 38.3 to 60.3 mg per dl and were significantly higher than those in controls (p < 0.01) and in alcoholic cirrhotics (p < 0.05). In Group I, apo-A11 plasma levels ranged from 42.4 to 67 mg per dl, being higher than in controls (p < 0.01) and in alcoholics with cirrhosis (p < 0.01). The ratios of apo-A1 to apo-A11 in the plasmas from group I1 and I11 patients and from controls resembled each other, while that in group I was lower than in normal subjects (p < 0.05). Levels of' apo-B varied little between the plasma of
patients from all three alcoholic groups and from the normal subjects.
CHEMICAL COMPOSITION OF LIPOPROTEINS The mean weight per cent chemical composition of the
lipoprotein subfractions from noncirrhotic alcoholic pa- tients with and without liver injury are presented in Table 2. Corresponding analyses from alcoholic cirrhot- ics and from healthy, normolipidemic subjects were car- ried out for comparative purposes. Among the Group I1 alcoholics, patients with alcoholic hepatitis exhibited lower free cholesterol levels in intermediate fraction (1F)a and LDL subfractions as compared to normals (p < 0.05), but higher amounts of free cholesterol in HDL? than in normals (p < 0.01) and in Group I (p < 0.02), while the free cholesterol contents of lipoprotein subfrac- tions (with the exception of HDLs) isolated from all Group I1 patients were reduced as compared to those from Group 111 (p < 0.02 in VLDL and p < 0.01 in other lipoprotein subfractions). Conversely, the proportions of cholesteryl esters in the LDL, IFb, HDLz and HDL:{ of Group I1 were significantly elevated relative to Group I11 (p < 0.01), while no significant differences were found between Group I, Group I1 and healthy subjects. Triglyc- eride levels in the different lipoprotein subfractions from Group I1 were quite similar to those from both Group I and controls; however, the proportion of triglyceride in LDL and IFb was diminished in Group I as compared to Group I11 (p < 0.01 and p < 0.02, respectively). Polar components, i.e., phospholipid and protein, in the various lipoprotein classes accounted for similar proportions in Group I, group I1 and control subjects, with the exception of phospholipid in IFb from Group I1 which was higher than in controls (p = 0.01). When compared to Group 111, the other two alcoholic groups had lesser amounts of
Vol. 4, No. 4, 1984 LIPOPROTEIN AND APOPROTEIN PROFILES IN CHRONIC ALCOHOLICS 581
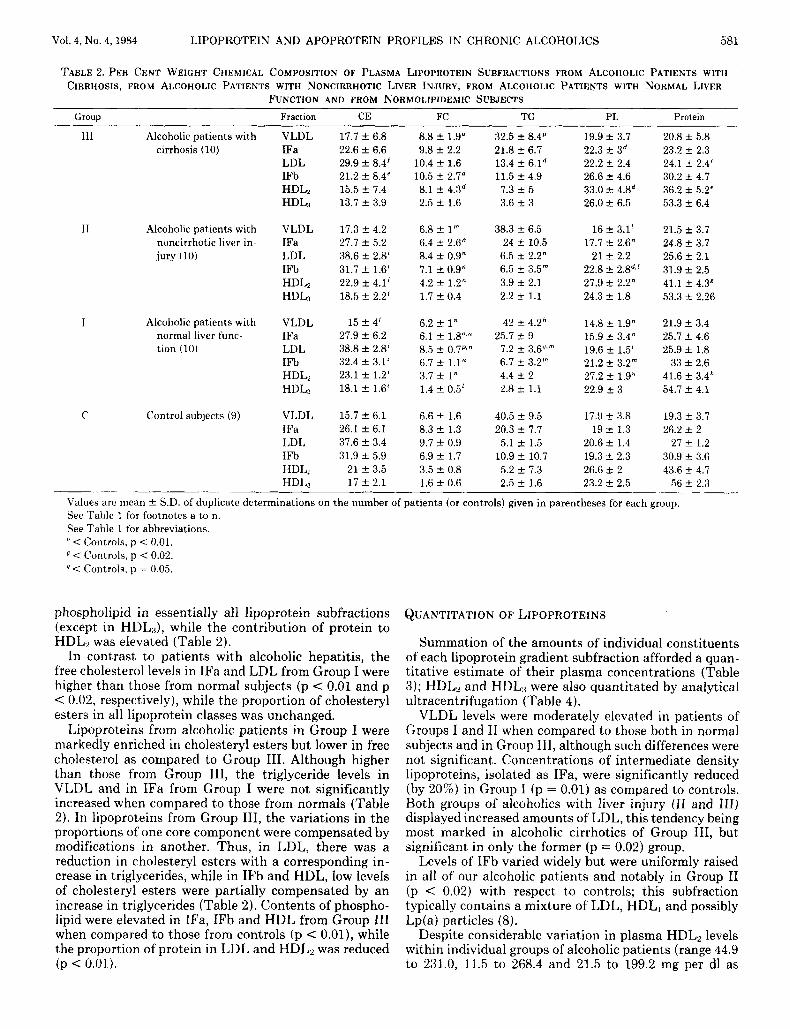
TABLE 2. P E R CENT WEIGHT CHEMICAL COMPOSITION OF PLASMA LIPOPROTEIN SUBFRACTIONS FROM ALCOHOLIC PATIENTS WITH CIRRHOSIS, FROM ALCOHOLIC PATIENTS WITH NONCIRRHOTIC LIVER INJURY, FROM ALCOHOLIC PATIENTS WITH NORMAL LIVER
FUNCTION AND FROM NORMOLIPIDEMIC SUBJECTS
Group Fraction CE FC TG PL Protein
111 Alcoholic patients with cirrhosis (10)
I1 Alcoholic patients with noncirrhotic liver in- jury (10)
I Alcoholic patients with normal liver func- tion (10)
C Control subjects (9)
VLDL IFa LDL IFb HDL, HDL,
VLDL IFa LDL IFb HDLZ HDL3
VLDL IFa LDL IFb
HDLs
VLDL IFa LDL IFb
HDL,
HDL2 HDL,
17.7 f 6.8 22.6 f 6.6 29.9 f 8.4' 21.2 f 8.4' 15.5 f 7.4 13.7 f 3.9
17.3 f 4.2 27.7 2 5.2 38.6 f 2.8' 31.7 f 1.6' 22.9 rt 4.1' 18.5 f 2.2'
15 f 4' 27.9 2 6.2 38.8 t 2.8' 32.4 t 3.1' 23.1 f 1.2' 18.1 f 1.6'
15.7 f 6.1 26.1 ? 6.1 37.6 t 3.4 31.9 f 5.9
21 f 3.5 17 -+ 2.1
8.8 f 1.9" 9.8 f 2.2
10.4 f 1.6 10.5 f 2.7d
2.5 f 1.6
6.8 k 1" 6.4 f 2.6" 8.4 f 0.9" 7.1 ? 0.9" 4.2 f 1.2" 1.7 f 0.4
6.2 f 1" 6.1 t 1.8"." 8.5 f 0.7pz" 6.7 f 1.1" 3.7 f 1" 1.4 f 0.5'
6.6 f 1.6 8.3 2 1.3 9.7 f 0.9 6.9 f 1.7 3.5 f 0.8 1.6 -I 0.6
8.1 f 4.3d
32.5 f 8.4p 21.8 ? 6.7 13.4 f 6.1d 11.5 f 4.9
7.3 f 5 3.6 f 3
38.3 k 6.5 24 f 10.5
6.5 f 2.2" 6.5 f 3.5" 3.9 f 2.1 2.2 ? 1.1
42 t 4.2h
7.2 f 3.6"," 6.7 f 3.2" 4.4 f 2 1.8 k 1.1
40.5 f 9.5 20.3 t 7.7
5.1 2 1.5 10.9 f 10.7 5.2 f 7.3 2.5 f 1.6
25.7 5 9
19.9 k 3.7 22.3 k 3d 22.2 -C 2.4 26.6 -C 4.6 33.0 -t 4Bd 26.0 2 6.5
16 C 3.1' 17.7 t 2.6"
21 t 2.2 22.8 2 2.8"' 27.9 2 2.2" 24.3 2 1.8
14.8 f 1.9" 15.9 f 3.4" 19.6 f 1.5' 21.2 f 3.2" 27.2 & 1.9" 22.9 -C 3
17.9 f 3.8 19 * 1.3
20.6 f 1.4 19.3 -t 2.3 26.6 2 2 23.2 f 2.5
20.8 t 5.8 23.2 f 2.3 24.1 k 2.4' 30.2 f 4.7 36.2 f 5.2' 53.3 f 6.4
21.5 f 3.7 24.8 f 3.7 25.6 2 2.1 31.9 f 2.5 41.1 f 4.3R 53.3 f 2.26
21.9 f 3.4 25.7 f 4.6 25.9 rt 1.8
33 f 2.6 41.6 f 3.4h 54.7 2 4.1
19.3 t 3.7 26.2 f 2
27 t 1.2 30.9 2 3.6 43.6 ? 4.7
56 f 2.3
Values are mean f S.D. of duplicate determinations on the number of patients (or controls) given in parentheses for each group. See Table 1 for footnotes a to n. See Table 1 for abbreviations. " < Controls, 11 < 0.01. < Controls, p < 0.02. < Controls, p = 0.05.
phospholipid in essentially all lipoprotein subfractions (except in HDL,3), while the contribution of protein to HDL, was elevated (Table 2).
In contrast to patients with alcoholic hepatitis, the free cholesterol levels in IFa and LDL from Group I were higher than those from normal subjects (p < 0.01 and p < 0.02, respectively), while the proportion of cholesteryl esters in all lipoprotein classes was unchanged.
Lipoproteins from alcoholic patients in Group I were markedly enriched in cholesteryl esters but lower in free cholesterol as compared to Group 111. Although higher than those from Group 111, the triglyceride levels in VLDL and in IFa from Group I were not significantly increased when compared to those from normals (Table 2). In lipoproteins from Group 111, the variations in the proportions of one core component were compensated by modifications in another. Thus, in LDL, there was a reduction in cholesteryl esters with a corresponding in- crease in triglycerides, while in IFb and HDL, low levels of cholesteryl esters were partially compensated by an increase in triglycerides (Table 2). Contents of phospho- lipid were elevated in IFa, IFb and HDL from Group 111 when compared to those from controls (p < 0.01), while the proportion of protein in LDL and HDL, was reduced (p < 0.01).
QUANTITATION OF LIPOPROTEINS
Summation of the amounts of individual constituents of each lipoprotein gradient subfraction afforded a quan- titative estimate of their plasma concentrations (Table 3); HDL, and HDL,< were also quantitated by analytical ultracentrifugation (Table 4).
VLDL levels were moderately elevated in patients of Groups I and I1 when compared to those both in normal subjects and in Group 111, although such differences were not significant. Concentrations of intermediate density lipoproteins, isolated as IFa, were significantly reduced (by 20%) in Group I (p = 0.01) as compared to controls. Both groups of alcoholics with liver injury (I1 and 111) displayed increased amounts of LDL, this tendency being most marked in alcoholic cirrhotics of Group 111, but significant in only t,he former (p = 0.02) group.
Levels of IFb varied widely but were uniformly raised in all of our alcoholic patients and notably in Group I1 (p < 0.02) with respect to controls; this subfraction typically contains a mixture of LDL, HDL, and possibly Lp(a) particles (8).
Despite considerable variation in plasma HDL2 levels within individual groups of alcoholic patients (range 44.9 to 231.0, 11.5 to 268.4 and 21.5 to 199.2 mg per dl as
HEPATOLOGY 582 DUHAMEL ET AL.
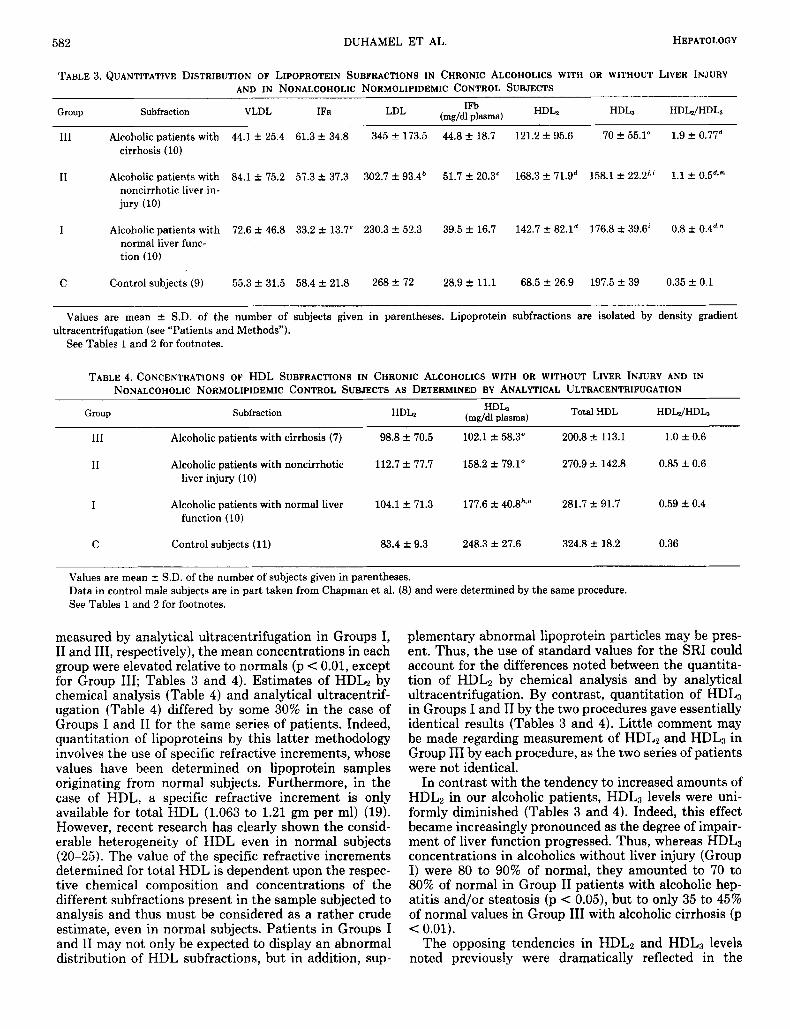
TABLE 3. QUANTITATIVE DISTRIBUTION OF LIPOPROTEIN SUBFRACTIONS IN CHRONIC ALCOHOLICS WITH OR WITHOUT LIVER INJURY AND IN NONALCOHOLIC NORMOLIPIDEMIC CONTROL SUBJECTS
HDL, HDL2/HDL3 HDL2 IFb LDL (mg/dl plasma) Group Subfraction VLDL IFa
111 Alcoholic patients with 44.1 f 25.4 61.3 f 34.8 345 f 173.5 44.8 +. 18.7 121.2 f 95.6 70 f 55.1" 1.9 f 0.77d cirrhosis (10)
I1 Alcoholic patients with 84.1 f 75.2 57.3 f 37.3 302.7 f 93.4' 51.7 +. 20.3' 168.3 * 71.gd 158.1 t- 22.2'.' 1.1 f 0.5d," noncirrhotic liver in- jury (10)
I Alcoholic patients with 72.6 f 46.8 33.2 f 13.7' 230.3 f 52.3 39.5 f 16.7 142.7 f 82.1d 176.8 f 39.6' 0.8 f 0.4d.n normal liver func- tion (10)
C Control subjects (9) 55.3 f 31.5 58.4 k 21.8 268 f 72 28.9 f 11.1 68.5 f 26.9 197.5 f 39 0.35 f 0.1
Values are mean f S.D. of the number of subjects given in parentheses. Lipoprotein subfractions are isolated by density gradient
See Tables 1 and 2 for footnotes. ultracentrifugation (see "Patients and Methods").
TABLE 4. CONCENTRATIONS OF HDL SUBFRACTIONS IN CHRONIC ALCOHOLICS WITH OR WITHOUT LIVER INJURY AND IN NONALCOHOLIC NORMOLIPIDEMIC CONTROL SUBJECTS AS DETERMINED BY ANALYTICAL ULTRACENTRIFUGATION
Group Subfraction HDh (mg/dl plasma) Total HDL HDLJHDL, HDL, ~~~
111 Alcoholic patients with cirrhosis (7) 98.8 f 70.5 102.1 f 58.3" 200.8 * 113.1 1.0 k 0.6
I1 Alcoholic patients with noncirrhotic 112.7 f 77.7 158.2 f 79.1" 270.9 k 142.8 0.85 f 0.6 liver injury (10)
I Alcoholic patients with normal liver 104.1 k 71.3 177.6 f 40.8**" 281.7 k 91.7 0.59 A 0.4 function (10)
C Control subjects (11) 83.4 f 9.3 248.3 f 27.6 324.8 1- 18.2 0.36
Values are mean f S.D. of the number of subjects given in parentheses. Data in control male subjects are in part taken from Chapman et al. (8) and were determined by the same procedure. See Tables 1 and 2 for footnotes.
measured by analytical ultracentrifugation in Groups I, I1 and 111, respectively), the mean concentrations in each group were elevated relative to normals (p < 0.01, except for Group 111; Tables 3 and 4). Estimates of HDL, by chemical analysis (Table 4) and analytical ultracentrif- ugation (Table 4) differed by some 30% in the case of Groups I and I1 for the same series of patients. Indeed, quantitation of lipoproteins by this latter methodology involves the use of specific refractive increments, whose values have been determined on lipoprotein samples originating from normal subjects. Furthermore, in the case of HDL, a specific refractive increment is only available for total HDL (1.063 to 1.21 gm per ml) (19). However, recent research has clearly shown the consid- erable heterogeneity of HDL even in normal subjects (20-25). The value of the specific refractive increments determined for total HDL is dependent upon the respec- tive chemical composition and concentrations of the different subfractions present in the sample subjected to analysis and thus must be considered as a rather crude estimate, even in normal subjects. Patients in Groups I and I1 may not only be expected to display an abnormal distribution of HDL subfractions, but in addition, sup-
plementary abnormal lipoprotein particles may be pres- ent. Thus, the use of standard values for the SRI could account for the differences noted between the quantita- tion of HDLz by chemical analysis and by analytical ultracentrifugation. By contrast, quantitation of HDL3 in Groups I and I1 by the two procedures gave essentially identical results (Tables 3 and 4). Little comment may be made regarding measurement of HDLz and HDLB in Group I11 by each procedure, as the two series of patients were not identical.
In contrast with the tendency to increased amounts of HDL, in our alcoholic patients, HDL, levels were uni- formly diminished (Tables 3 and 4). Indeed, this effect became increasingly pronounced as the degree of impair- ment of liver function progressed. Thus, whereas HDL3 concentrations in alcoholics without liver injury (Group I) were 80 to 90% of normal, they amounted to 70 to 80% of normal in Group I1 patients with alcoholic hep- atitis and/or steatosis (p < 0.05), but to only 35 to 45% of normal values in Group I11 with alcoholic cirrhosis (p < 0.01).
The opposing tendencies in HDL, and HDL3 levels noted previously were dramatically reflected in the
Vol. 4, No. 4, 1984 L I P O P R O T E I N AND A P O P R O T E I N PROFILES I N C H R O N I C ALCOHOLICS 583
HDL2:HDL3 ratio (Tables 3 and 4), which became ele- vated in parallel with progressive liver injury. Such in- creases were statistically significant (p < 0.01) in each patient group with respect to controls, and in addition, with respect to the alcoholic cirrhotic group (111). Indeed, the HDLz:HDL3 ratio in the latter group was typically more than 5-fold higher than normal.
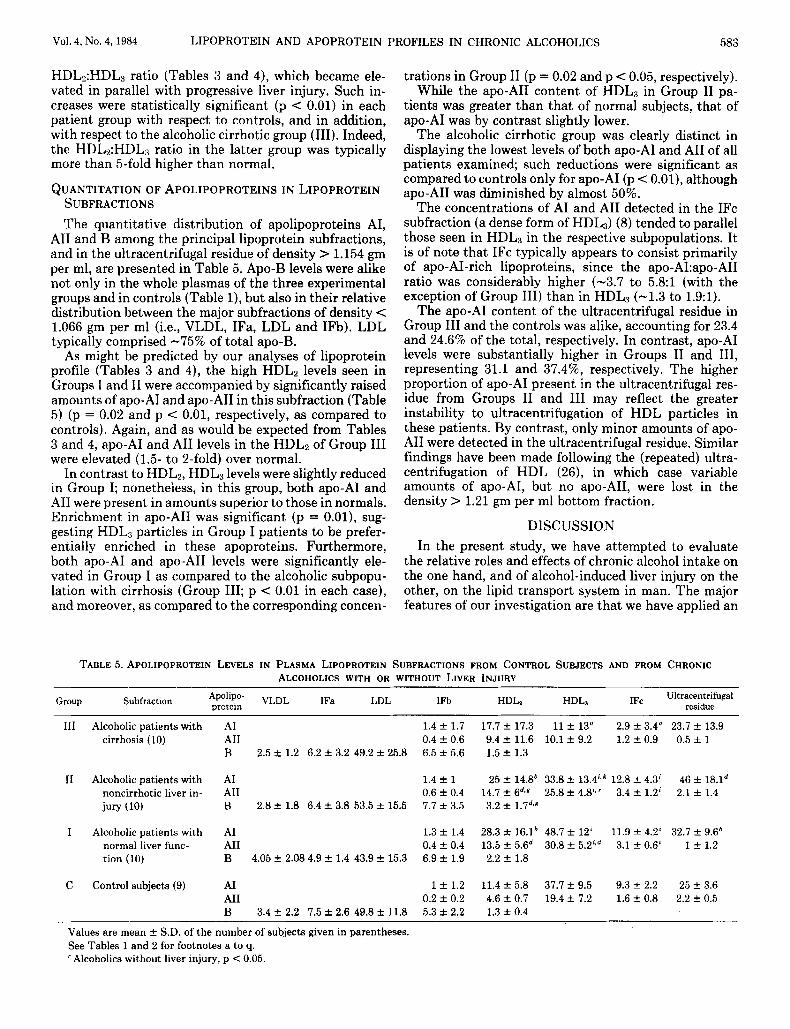
QUANTITATION OF APOLIPOPROTEINS I N LIPOPROTEIN SUBFRACTIONS The quantitative distribution of apolipoproteins AI,
A11 and B among the principal lipoprotein subfractions, and in the ultracentrifugal residue of density > 1.154 gm per ml, are presented in Table 5. Apo-B levels were alike not only in the whole plasmas of the three experimental groups and in controls (Table l), but also in their relative distribution between the major subfractions of density < 1.066 gm per ml (i.e., VLDL, IFa, LDL and IFb). LDL typically comprised -75% of total apo-B.
As might be predicted by our analyses of lipoprotein profile (Tables 3 and 4), the high HDL2 levels seen in Groups I and I1 were accompanied by significantly raised amounts of apo-A1 and apo-A11 in this subfraction (Table 5) (p = 0.02 and p < 0.01, respectively, as compared to controls). Again, and as would be expected from Tables 3 and 4, apo-A1 and A11 levels in the HDLz of Group I11 were elevated (1.5- to 2-fold) over normal.
In contrast to HDL2, HDL3 levels were slightly reduced in Group I; nonetheless, in this group, both apo-A1 and A11 were present in amounts superior to those in normals. Enrichment in apo-A11 was significant (p = 0.01), sug- gesting HDL3 particles in Group I patients to be prefer- entially enriched in these apoproteins. Furthermore, both apo- A1 and apo-A11 levels were significantly ele- vated in Group I as compared to the alcoholic subpopu- lation with cirrhosis (Group 111; p < 0.01 in each case), and moreover, as compared to the corresponding concen-
trations in Group I1 (p = 0.02 and p < 0.05, respectively). While the apo-A11 content of HDL3 in Group I1 pa-
tients was greater than that of normal subjects, that of apo-A1 was by contrast slightly lower.
The alcoholic cirrhotic group was clearly distinct in displaying the lowest levels of both apo-A1 and A11 of all patients examined; such reductions were significant as compared to controls only for apo-A1 (p < 0.01), although apo-A11 was diminished by almost 50%.
The concentrations of A1 and A11 detected in the IFc subfraction (a dense form of HDL3) (8) tended to parallel those seen in HDL3 in the respective subpopulations. It is of note that IFc typically appears to consist primarily of apo-AI-rich lipoproteins, since the apo-A1:apo-A11 ratio was considerably higher (-3.7 to 5.8:l (with the exception of Group 111) than in HDL3 (-1.3 to 1.9:l).
The apo-A1 content of the ultracentrifugal residue in Group I11 and the controls was alike, accounting for 23.4 and 24.6% of the total, respectively. In contrast, apo-A1 levels were substantially higher in Groups I1 and 111, representing 31.1 and 37.4%, respectively. The higher proportion of apo-A1 present in the ultracentrifugal res- idue from Groups I1 and 111 may reflect the greater instability to ultracentrifugation of HDL particles in these patients. By contrast, only minor amounts of apo- A11 were detected in the ultracentrifugal residue. Similar findings have been made following the (repeated) ultra- centrifugation of HDL (26), in which case variable amounts of apo- AI, but no apo- AII, were lost in the density > 1.21 gm per ml bottom fraction.
DISCUSSION In the present study, we have attempted to evaluate
the relative roles and effects of chronic alcohol intake on the one hand, and of alcohol-induced liver injury on the other, on the lipid transport system in man. The major features of our investigation are that we have applied an
TABLE 5. APOLIPOPROTEIN LEVELS IN PLASMA LIPOPROTEIN SUBFRACTIONS FROM CONTROL SUBJECTS AND FROM CHRONIC ALCOHOLICS WITH OR WITHOUT LIVER INJURY
Subfraction VLDL IFa LDL protein Group IFb IFc Ultracentrifugal residue HDL, HDLa
111 Alcoholic patients with cirrhosis (10)
I1 Alcoholic patients with noncirrhotic liver in- jury (10)
I Alcoholic patients with normal liver func- tion (10)
C Control subjects (9)
A1 1.4 f 1.7 17.7 f 17.3 11 f 13" 2.9 If: 3.4" 23.7 f 13.9 A11 0.4 f 0.6 9.4 f 11.6 10.1 f 9.2 1.2 f 0.9 0.5 f 1 B 2.5 f 1.2 6.2 f 3.2 49.2 f 25.8 6.5 f 5.6 1.5 f 1.3
A1 1.4 f 1 25 f 14.8' 33.8 f 13.4'.k 12.8 -+ 4.3' 46 f 18.1d A11 0.6 f 0.4 14.7 f 6d.g 25.8 f 4.8'.' 3.4 f 1.2' 2.1 f 1.4 B 2.8 2 1.8 6.4 f 3.8 53.5 & 15.5 7.7 f 3.5 3.2 & 1.7d,Y
A1 1.3 f 1.4 28.3 -+ 16.1* 48.7 f 12' 11.9 f 4.2' 32.7 f 9.6' A11 0.4 f 0.4 13.5 f 5.6d 30.8 k 5.2'*d 3.1 f 0.6' 1 ? 1.2 B 4.05 + 2.08 4.9 f 1.4 43.9 k 15.3 6.9 f 1.9 2.2 f 1.8
A 1 1 f 1.2 11.4 k 5.8 37.7 f 9.5 9.3 f 2.2 25 f 3.6 A11 0.2 f 0.2 4.6 f 0.7 19.4 f 7.2 1.6 f 0.8 2.2 k 0.5 B 3 . 4 f 2.2 7.5 f 2.6 49.8 f 11.8 5.3 f 2.2 1.3 f 0.4
Values are mean f S.D. of the number of subjects given in parentheses. See Tables 1 and 2 for footnotes a to q. ' Alcoholics without liver injury, p < 0.05.
584 DUHAMEL ET AL. HEPATOLOGY
advanced methodology, i.e., density gradient ultracen- trifugation, to permit subfractionation and subsequent characterization of the polydisperse plasma lipoproteins in three groups of clinically defined patients, Group I consisting of chronic alcoholics lacking any clinical or biological symptoms of liver disease, Group I1 consisting of alcoholic patients with liver injury but lacking cirrho- sis and a third group (111) comprised of alcoholics with cirrhosis. In this way, we have been able to identify perturbations of lipoprotein and apolipoprotein profile which appear to be associated either with chronic alco- holism alone or with liver disease of reversible or irre- versible nature.
Elevated apo-A1 and apo-A11 concentrations were found in alcoholic patients free of liver damage, as well as in those with noncirrhotic liver injury, while alcoholic cirrhotics had reduced plasma apo-A1 and apo-A11 con- centrations. High plasma apo-A1 and apo-A11 concentra- tions, although most likely linked to chronic alcohol consumption, cannot however be considered as charac- teristic of chronic alcoholism in noncirrhotic patients, since the reliability and specificity of plasma apo-A1 and apo-A11 levels as markers of chronic alcoholism, alone and together with other biological parameters, require further assessment.
The abnormalities seen in lipid and apolipoprotein profile in total plasma suggested alterations in the dis- tribution, concentration and chemical composition of the various lipoproteins. Elevated plasma levels of both IFb and HDL2 were remarkable in all three alcoholic popu- lations, irrespective of whether their liver was injured or not. Conversely, all alcoholic patients had diminished amounts of HDL,; the reduction in HDL3 levels was minor in alcoholics with normal liver function and be- came more marked with progressive liver injury. Thus, the ratio of the concentrations of HDL, and HDL:, in- creased in parallel with the severity of alcoholic liver alterations. Studies of a larger number of patients appear necessary in order to evaluate a potential use of this ratio as an index of liver injury during alcoholism. However information on this ratio in other types of chronic liver disease is lacking, and indeed technical considerations may limit the practical utility of such a quantitation. In the general context of HDL2 and HDL, levels, it is of note that the observed tendency of these two HDL subclasses to vary in opposite directions limits the inter- pretation of data on total HDL-cholesterol in alcoholic patients.
High concentrations of apo-A1 and apo-A11 in HDL2 were remarkable in all alcoholic subpopulations; in con- trast, the contents of apo-A1 and apo-A11 in HDL3 were elevated in alcoholics free of liver damage, but gradually decreased with alcohol-associated liver injury. Interpre- tation of the respective roles of alcohol and liver disease in affecting the relative distribution of the various apo- lipoproteins, and particularly apo-A1 and apo-AII, among the two HDL subclasses, remains indeterminate, al- though one may speculate on the potential of alcohol to act as an inducer of apo-AI. and apo-A11 biosynthesis (27).
Our findings concerning the loss of apo-A1 from HDL particles during ultracentrifugal isolation are in agree-
ment with those of others (26) and are compatible with the suggestion that apo-A1 may exist either in more than one type of environment, or in more than one form in HDL (25). One cannot however exclude the possibility that certain structural changes may have occurred during ultracentrifugation, predominantly affecting the apo-A1 content of' HDL particles.
We and others (28) have noted reductions in plasma LDL concentrations in alcoholics lacking liver disease. By contrast, circulating LDL levels increased as alcohol- induced liver injury progressed, although this augmen- tation could not account for the elevated amounts of plasma free cholesterol seen in these patients. Quanti- tative or qualitative modifications in the binding capacity of hepatic LDL receptors may result in diminished LDL degradation, thereby contributing to the high plasma LDL concentrations typical of alcoholic patients with liver injury (29). Equally, the binding affinity of LDL for hepatic receptors may be affected by its structural het- erogeneity (30).
The high plasma HDLz levels found in all our alcoholic patients, with or without liver injury, may result from an increased production of nascent discoidal HDL by the liver, subsequent to alcoholic microsomal induction (27, 28). Such a phenomenon has been suggested to account for the increased HDL levels occurring in patients using phenytoin (31). An increased turnover of VLDL may also contribute to the high plasma HDL, levels found in our alcoholic patients, since HDL is partly derived from the surface components of chylomicrons and VLDL during their degradation by lipolytic enzymes (32). Such a mech- anism is suggested by the initial increase in plasma lipoprotein lipase activities found in chronic alcoholics with high HDL2 levels (4, 28). The elevated concentra- tions of apo-A1 and apo-A11 in HDL2 may affect the metabolism of the parent lipoprotein: recent in uitro studies from Shinomiya and coworkers (33) showed that the addition of lipid-free apolipoproteins, such as apo-A1 and apo-AII, to HDL, inhibits the hepatic lipase-cata- lyzed hydrolysis of HDL-triacylglycerols. The increased flux of apolipoproteins into HDL2 would diminish both HDL-phospholipid hydrolysis and the transfer of unes- terified cholesterol to the liver. Indeed high free choles- terol levels were found in HDL2 from our patients with alcoholic hepatitis or cirrhosis.
The observed diminution in plasma HDL3 levels may reflect either a reduced production of nascent HDL by the liver or intestine (34), or a rapid degradation of HDL of abnormal composition and structure (35), or alterna- tively, an impaired conversion of HDL, to HDL3 as a consequence of reduced hepatic lipase activity.
It is noteworthy that hypertriglyceridemia, although well documented as occurring in alcoholics in the absence of liver injury, as well as in alcoholic fatty liver or alcoholic hepatitis (7, 30), did not reach the level of significance in our corresponding alcoholic groups, in spite of a tendency to increased VLDL concentrations. Plasma triglyceride levels varied widely from one patient to another, possibly because of a wide range in alcohol consumption together with a variable genetic suscepti- bility to alcohol toxicity. Nevertheless, it appears that plasma triglyceride concentration cannot be taken as a
Vol. 4, No. 4. 1!%4 1,IPOPROTEIN AND APOPROTEIN PROFILES IN CHRONIC ALCOHOLICS 585
simple and reliable index of chronic alcoholism, nor of alcoholic liver injury.
In conclusion, the present findings prompt us to sug- gest that there appears t o tie no simple, definitive asso- ciat ion between plasma lipoprotein and apolipoprotein profile on the one hand, and chronic alcoholism in either the absence or presence of liver injury of variable severity on the other. Nonetheless, our data clearly indicate that the levels and ratios of apo-A1 and apo-A11 levels in HDL, and HDL1, as well as the absolute concentrations and ratio of HDL, and HDL:l, may help to differentiate certain of the subpopulations of chronic alcoholics de- scribed herein. There would, therefore, appear to be a considerable amount of useful information to be gained from studies of apolipoprotein levels in specific lipopro- tein subfractions from patients with liver disease, espe- cially of apo-A1 and apo-A11 (36), and possibly of apo-E ( 3 7, 38 1,
Acknowledgments: We are most grateful to Dr. P. K. Weech for provision of purified human apo- AII, apo-E and apo-C's. P. Forgez and D. Lagrange gave excellent technical assistance. M. Tassier kindly prepared the manuscript.
1.
2 .
3.
1.
5 .
fi.
- ,, 8.
9.
10.
11.
12.
13.
14
REFERENCES
Bellrage I', Berg B, Hagerstrand 1, et al. Alterations of lipid metabolism in healthy volunteers during long term ethanol intake. Eur , J (:lin Invest 1977: 7:127-131. Danielsson B, Ekman H, Fex G, et al. Changes in plasma high- density lipoproteins in chronic male alcoholics during and after ahuse. Scand ,I Clin Lab Invest 1978 38:113-119. Haraona E. Lieher C. Ellect of'ethanol on lipid metabolism. J Lipid Res 1979; 20:2X9-315. Ekman K. Fex C,. Johansson B(;, et al. Changes in plasma high- densit! lipoprotein and lipolytic enzymes after long-term, heavy et hanul consumption. Scand .J Clin Lah Invest 1981; 41:709-715. Marth E, Cazzolato C , Bittolo-Bon C,, et al. Serum concentrations o f l+(a) and other lipoprotein parameters in heavy alcohol con- sumers. Ann Nutr Metah 1982: 26:X-62. Sahehin Shl. Lipid and lipoprotein ahnormalities in alcoholic liver disease. Circulation 1981; C,4:III-72-III-84. Ikvenyi 1'. Hobinson GM, Kapur RM, et al. High density lipopro- tein cholesterol in male alcoholics with and without severe liver disease. Am .I Med 1981; 71:589-594. Chapman MJ, Goldstein S, Lagrange D, et al. A density gradient ultracent rifugal procedure for isolation of t.he major lipoprotein classes from human serum. d Lipid Res 1981; 22:339-358. Review kiy an International Croup. Alcoholic liver disease: mor- phological manifestions. Lancet, 1981; 1:707-711. Laplaud PM, Beaubatie L, Maurel D. A spontaneously seasonal hypercholesterolemic animal: plasma lipids and lipoproteins in the European hadger (M&s rides L. ). J Lipid Res 1980; 21:724-738. Lowry OH, Rosehrough NJ , Farr AL, et al. Protein measurements with the Folin phenol reagent. d Biol Chem 1951; 193:265-275. Roeschlau P, Bernt E, Gruher W. Enzymatische Bestimmung des gesamt Choiesteryls in Serum. Z Klin Chem Klin Biochem 1974; 12:226. Skipski VP. Lipid composition of lipoproteins in normal and dis- eased states. In: Nelson CJ , ed. Blood lipids and lipoproteins: quantitation, composition and metabolism. New York: Wiley-In- tersciences, 1972: 471-583. Biggs HC, Erickson JM, Moorehead R. A manual colorimetric assav of trielvcerides in serum. Clin Chem 1975: 21:437-450.
15. ForGz P, ?hapman MJ. A simplified and efficient procedure for the purification of apolipoprotein A1 from human serum high- density lipoprotein-3 by preparative isoelectric focussing on poly- acrylamide gel beads. ,J Riocliem Biophys Meth 1982; 6:283-296.
16. Chapman MJ, Goldstein S. Comparison of the serum low densky lipoprotein and of' its apoprotein in the pig, rhesus monkey, and hahoon, with that in man. Atherosclerosis 1976; 25:267-291.
17. Ouchterlony 0. Gel diffusion techniques. In: Ackroyd JF, ed. Jm- munological Methods. London: Blackwell, 1964: 55 pp.
18. Snedecor GW, Cochran WG. Statistical methods. Ames, Iowa: Iowa State University Press, 1971: 128.
19. De Lalla OF, Gofman JW. Ultracentrifugal analysis of serum lipproteins. In: Glick D, ed. Methods of biochemical analysis. New York: Wiley, 1954: 459-478.
20. Anderson DW, Nichols AV, Pan SS, et al. High density lipoprotein distribution: resolution and determination of three major compo- nents in a normal population sample. Atherosclerosis 1978; 29:161- 179.
21. Cheung MC, Albers Jd. Distribution of cholesterol and apolipopro- tein A-I and A-I1 in human high density lipoprotein subfractions separated by CsCl equilibrium gradient centrifugation: evidence for HDL subpopulations with differing A-I/A-I1 molar ratios. J Lipid Res 1979; 20:200-207.
22. Suenram A. McConathy WJ, Alaupovic P. Evidence for the lipo- protein heterogeneity of human plasma high density lipoproteins isolated by three different procedures. Lipids 1979; 14:505-510.
23. Marcel YL, Vezina C, Emond I), et al. Heterogeneity of human high density lipoproteins: presence of lipoproteins with and without apo-E and their roles as substrates for lecithin cholesterol acyl- transferase reaction. Proc Natl Acad Sci USA 1980; 772969-2973,
24. Weisgraher KH, Mahley RW. Subfractionation of human high density lipoproteins by heparin-Sepharose affinity chromatogra- phy. J Lipid Res 1980; 21:316-325.
25. Cheung MC, Albers JJ. Distribution of high density lipoprotein particles with different apoprotein composition: particles with A-l and A-I1 and particles with A-I but not A-11. J Lipid Res 1982; 23:747-753.
26. Kunitake ST. Kane JP. Factors alfecting the integrity of high density lipoproteins in the ultracentrifuge. J Lipid Res 198'2; 233936-910.
27. Luoma I'V. Sotaniemi EA. Pelkonen KO, et al. High-density lipo- proteins and hepatic microsomal enzyme induction in alcohol consumers. Kes Com Chem Path Pharm 1982; 379-96 .
28. Taskinen MR, Valimaki M, Nikkila EA, e t al. High density lipo- protein subfractions and postheparin plasma lipases in alcoholic men before and after ethanol withdrawal. Metabolism 1982;
29. Attie AD, Pittman RC, Steinberg D. Hepatic cataholisrn of low density lipoprotein: mechanisms and metabolic consequences. He- patology 1982; 2:269-281.
30. Sabesin SM, Ragland dB, Freeman MR. Lipoprotein disturhances in liver disease. In: Popper, H, Schaffner, E, eds. Progress in liver diseases, Vol VI. New York: Grune & Stratton, 1979: 243-261.
31. Nikkila EA, Kaste M. Ehnholm C, et al. Increase of serum high- density lipoprotein in phenytoin users. Br Med J 1978; 299.
32. Chajek T, Eisenberg S. Very low density lipoproteins. Metabolism of phospholipids, cholesterol and apolipoprotein C in the isolated perfused rat heart. J Clin Invest 1978; 62:1654-1665.
33. Shinomiya M, Sasaki N , Barnhart RL, et al. Effect of apolipopro- teins on the hepatic lipase-catalyzed hydrolysis of human plasma high density lipoprotein,-triacylglycerols. Biochim Biophys Acta
34. Okazaki M, Hara I , Tanaka A, et al. Decreased serum HDL3 cholesterol levels in cirrhosis of' the liver. N Engl d Med 1981; 304: 1608.
35. Nestel PJ , Tada N, Fidge NH. Increased catabolism of high density lipoprotein in alcoholic hepatitis. Metabolism 1980; 29:101-104.
36. Fujii S, Koga S, Shono T, et al. Serum apoprotein A-I and A-I1 levels in liver diseases and cholestasis. Clin Chim Acta 1981;
37. Weidman SW. Ragland JB, Sabesin SM. Plasma lipoprotein com- position in alcoholic hepatitis: accumulation of apolipoprotein E- rich high density lipoprotein and preferential reappearance of "light"-HDL during partial recovery. J Lipid Res 1982; 23556-569.
38. Tada N, Nestel Pd, Fidge N, et al. Abnormal apolipoprotein com- position in alcoholic hepatitis. Biochim Biophys Acta 1981:
32~1168-1174.
1982; 713:292-299.
115~321-331.
664:207-220.


![Lipoprotein(a) and Other Risk Factors for Cerebral Infarction · The serum concentration of lipoprotein(a) [Lp(a)], lipids, lipoproteins, apolipoprotein A-I, and apolipoprotein B](https://img.pdfslide.net/doc/110x75/5f0254ff7e708231d403bf4c/lipoproteina-and-other-risk-factors-for-cerebral-infarction-the-serum-concentration.jpg)


![REGULATION OF LIPOPROTEIN(a) BY INTERLEUKIN-6 IN … · Eines der atherogensten Lipoproteine ist Lipoprotein(a) [Lp(a)], das aus einem LDL-ähnlichem Partikel und dem Apolipoprotein(a)](https://img.pdfslide.net/doc/110x75/5e06a6fb956516721c0c39ab/regulation-of-lipoproteina-by-interleukin-6-in-eines-der-atherogensten-lipoproteine.jpg)