Embed Size (px)
Citation preview
Plasma phospholipids identify antecedent memory impairment in older adults
Mark Mapstone, Amrita K. Cheema, Massimo S. Fiandaca, Xiaogang Zhong, Timothy R. Mhyre, Linda H. MacArthur, William J. Hall, Susan G. Fisher, Derick R. Peterson, James M. Haley, Michael D. Nazar, Steven A. Rich, Dan J. Berlau, Carrie B. Peltz, Ming T. Tan, Claudia H. Kawas, and Howard J. Federoff
SUPPLEMENTARY INFORMATION
Nature Medicine: doi:10.1038/nm.3466
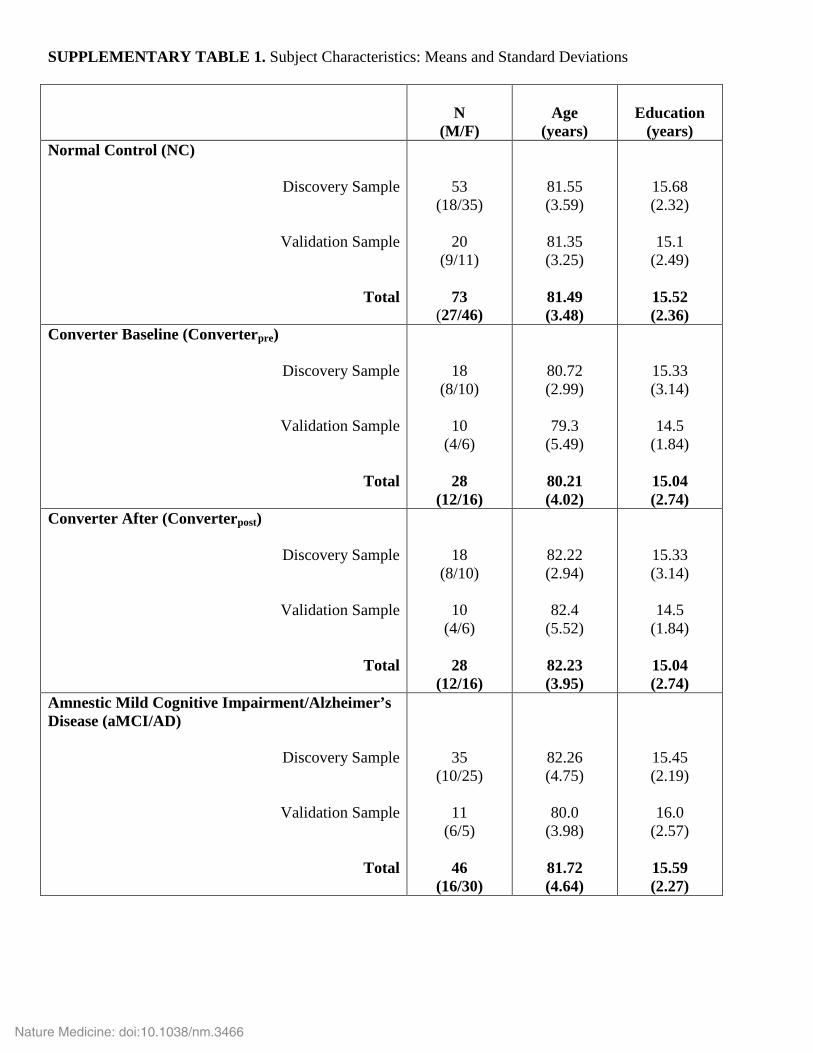
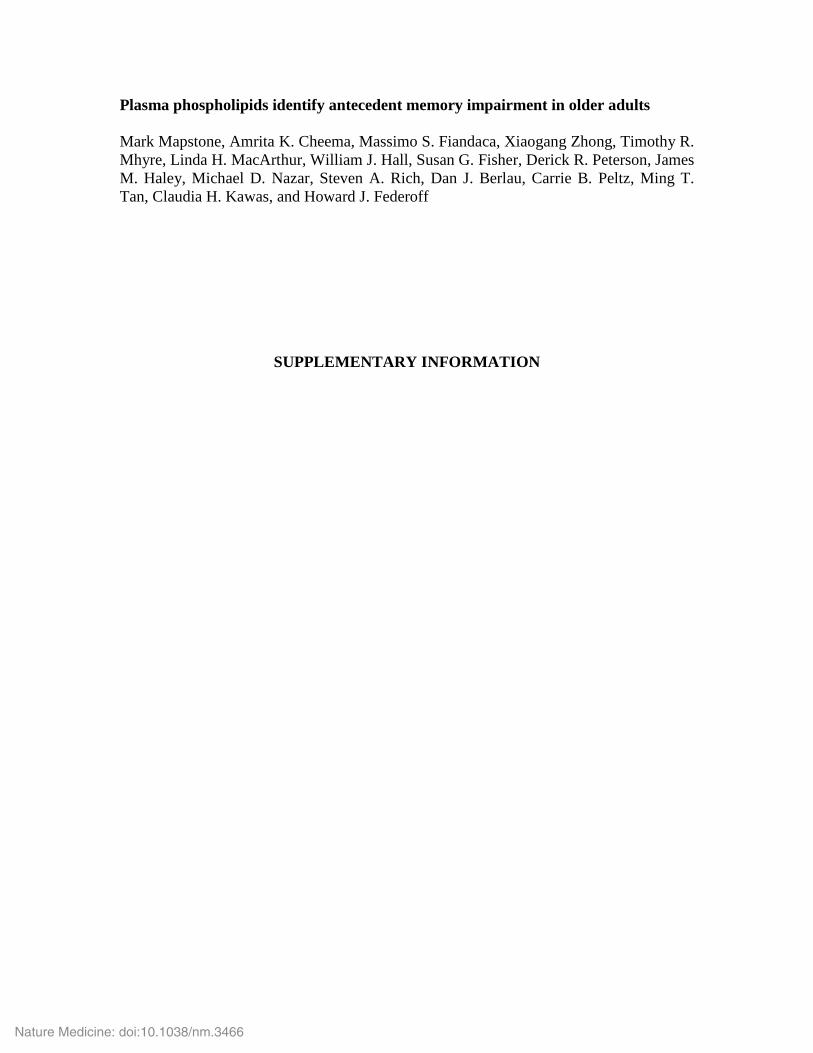
SUPPLEMENTARY TABLE 1. Subject Characteristics: Means and Standard Deviations
N
(M/F)
Age
(years)
Education
(years) Normal Control (NC)
Discovery Sample
Validation Sample
Total
53 (18/35)
20
(9/11)
73 (27/46)
81.55 (3.59)
81.35 (3.25)
81.49 (3.48)
15.68 (2.32)
15.1
(2.49)
15.52 (2.36)
Converter Baseline (Converterpre)
Discovery Sample
Validation Sample
Total
18 (8/10)
10
(4/6)
28 (12/16)
80.72 (2.99)
79.3
(5.49)
80.21 (4.02)
15.33 (3.14)
14.5
(1.84)
15.04 (2.74)
Converter After (Converterpost)
Discovery Sample
Validation Sample
Total
18 (8/10)
10
(4/6)
28 (12/16)
82.22 (2.94)
82.4
(5.52)
82.23 (3.95)
15.33 (3.14)
14.5
(1.84)
15.04 (2.74)
Amnestic Mild Cognitive Impairment/Alzheimer’s Disease (aMCI/AD)
Discovery Sample
Validation Sample
Total
35 (10/25)
11
(6/5)
46 (16/30)
82.26 (4.75)
80.0
(3.98)
81.72 (4.64)
15.45 (2.19)
16.0
(2.57)
15.59 (2.27)
Nature Medicine: doi:10.1038/nm.3466
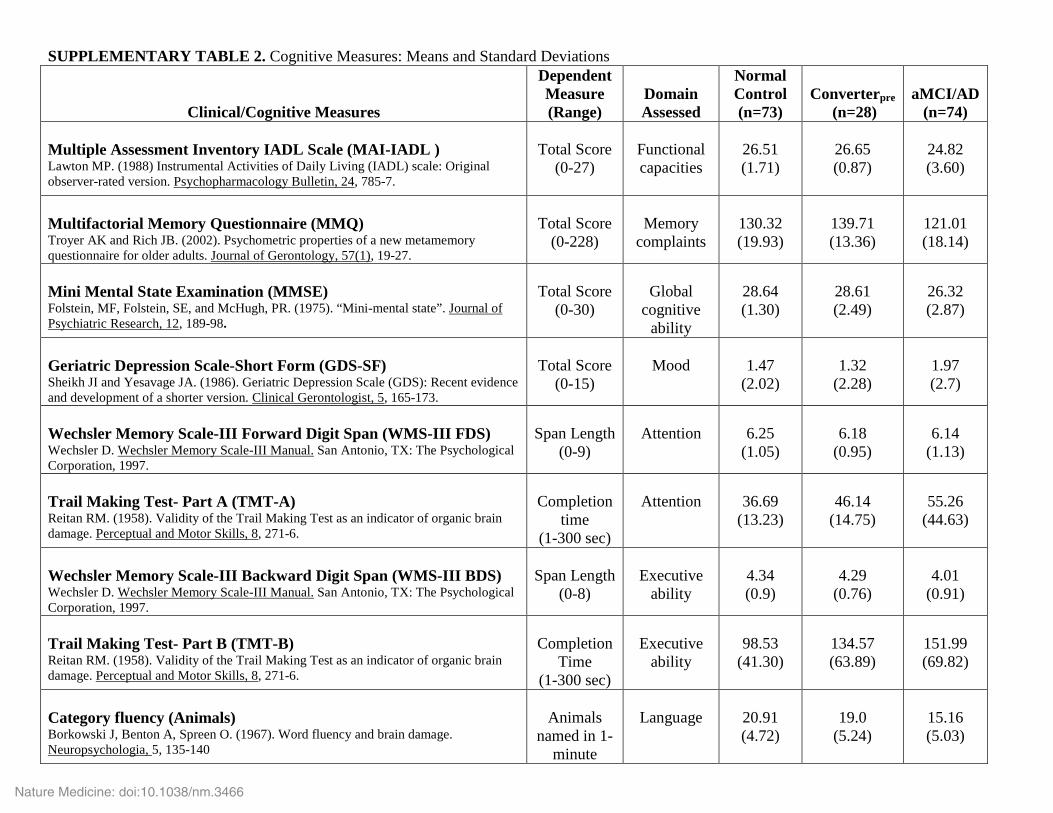
SUPPLEMENTARY TABLE 2. Cognitive Measures: Means and Standard Deviations
Clinical/Cognitive Measures
Dependent Measure (Range)
Domain Assessed
Normal Control (n=73)
Converterpre
(n=28)
aMCI/AD
(n=74) Multiple Assessment Inventory IADL Scale (MAI-IADL ) Lawton MP. (1988) Instrumental Activities of Daily Living (IADL) scale: Original observer-rated version. Psychopharmacology Bulletin, 24, 785-7.
Total Score
(0-27)
Functional capacities
26.51 (1.71)
26.65 (0.87)
24.82 (3.60)
Multifactorial Memory Questionnaire (MMQ) Troyer AK and Rich JB. (2002). Psychometric properties of a new metamemory questionnaire for older adults. Journal of Gerontology, 57(1), 19-27.
Total Score
(0-228)
Memory
complaints
130.32 (19.93)
139.71 (13.36)
121.01 (18.14)
Mini Mental State Examination (MMSE) Folstein, MF, Folstein, SE, and McHugh, PR. (1975). “Mini-mental state”. Journal of Psychiatric Research, 12, 189-98.
Total Score
(0-30)
Global
cognitive ability
28.64 (1.30)
28.61 (2.49)
26.32 (2.87)
Geriatric Depression Scale-Short Form (GDS-SF) Sheikh JI and Yesavage JA. (1986). Geriatric Depression Scale (GDS): Recent evidence and development of a shorter version. Clinical Gerontologist, 5, 165-173.
Total Score
(0-15)
Mood
1.47
(2.02)
1.32
(2.28)
1.97 (2.7)
Wechsler Memory Scale-III Forward Digit Span (WMS-III FDS) Wechsler D. Wechsler Memory Scale-III Manual. San Antonio, TX: The Psychological Corporation, 1997.
Span Length
(0-9)
Attention
6.25
(1.05)
6.18
(0.95)
6.14
(1.13)
Trail Making Test- Part A (TMT-A) Reitan RM. (1958). Validity of the Trail Making Test as an indicator of organic brain damage. Perceptual and Motor Skills, 8, 271-6.
Completion
time (1-300 sec)
Attention
36.69
(13.23)
46.14
(14.75)
55.26
(44.63)
Wechsler Memory Scale-III Backward Digit Span (WMS-III BDS) Wechsler D. Wechsler Memory Scale-III Manual. San Antonio, TX: The Psychological Corporation, 1997.
Span Length
(0-8)
Executive
ability
4.34 (0.9)
4.29
(0.76)
4.01
(0.91)
Trail Making Test- Part B (TMT-B) Reitan RM. (1958). Validity of the Trail Making Test as an indicator of organic brain damage. Perceptual and Motor Skills, 8, 271-6.
Completion
Time (1-300 sec)
Executive
ability
98.53
(41.30)
134.57 (63.89)
151.99 (69.82)
Category fluency (Animals) Borkowski J, Benton A, Spreen O. (1967). Word fluency and brain damage. Neuropsychologia, 5, 135-140
Animals
named in 1-minute
Language
20.91 (4.72)
19.0
(5.24)
15.16 (5.03)
Nature Medicine: doi:10.1038/nm.3466
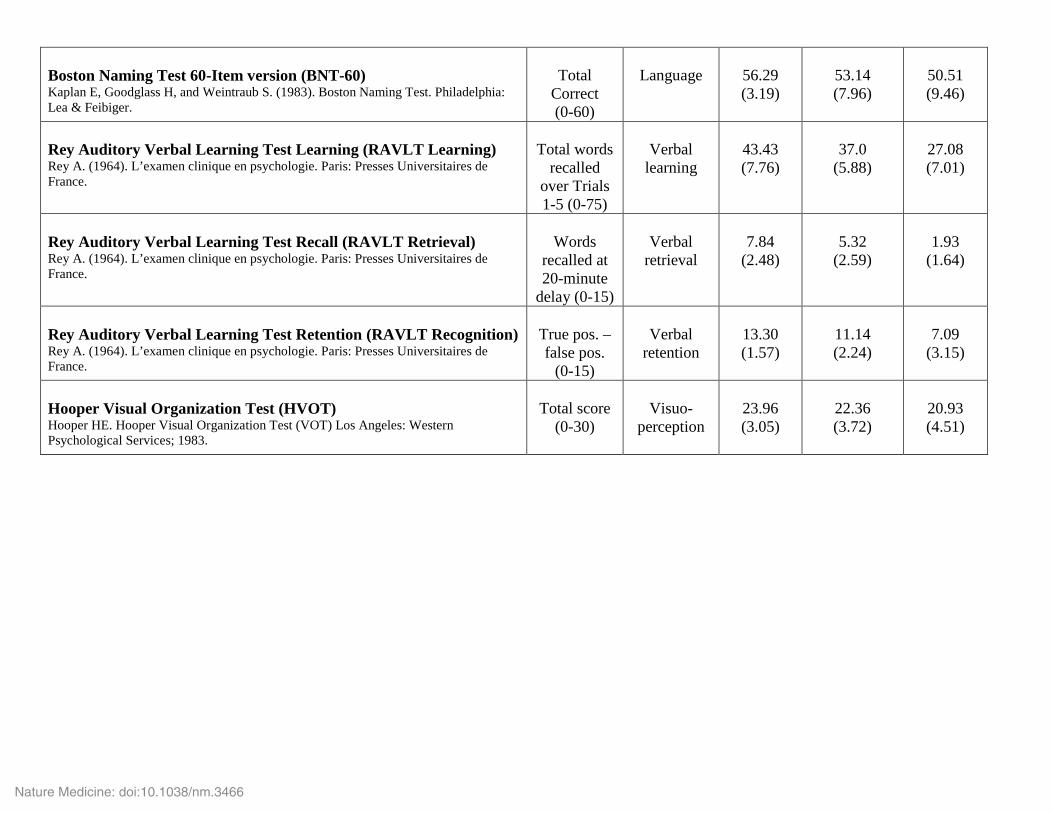
Boston Naming Test 60-Item version (BNT-60) Kaplan E, Goodglass H, and Weintraub S. (1983). Boston Naming Test. Philadelphia: Lea & Feibiger.
Total
Correct (0-60)
Language
56.29 (3.19)
53.14 (7.96)
50.51 (9.46)
Rey Auditory Verbal Learning Test Learning (RAVLT Learning) Rey A. (1964). L’examen clinique en psychologie. Paris: Presses Universitaires de France.
Total words
recalled over Trials 1-5 (0-75)
Verbal
learning
43.43 (7.76)
37.0
(5.88)
27.08 (7.01)
Rey Auditory Verbal Learning Test Recall (RAVLT Retrieval) Rey A. (1964). L’examen clinique en psychologie. Paris: Presses Universitaires de France.
Words
recalled at 20-minute
delay (0-15)
Verbal
retrieval
7.84
(2.48)
5.32
(2.59)
1.93
(1.64)
Rey Auditory Verbal Learning Test Retention (RAVLT Recognition) Rey A. (1964). L’examen clinique en psychologie. Paris: Presses Universitaires de France.
True pos. –false pos.
(0-15)
Verbal
retention
13.30 (1.57)
11.14 (2.24)
7.09
(3.15)
Hooper Visual Organization Test (HVOT) Hooper HE. Hooper Visual Organization Test (VOT) Los Angeles: Western Psychological Services; 1983.
Total score
(0-30)
Visuo-
perception
23.96 (3.05)
22.36 (3.72)
20.93 (4.51)
Nature Medicine: doi:10.1038/nm.3466

SUPPLEMENTARY TABLE 3. Composite Z-score Components
Attention (Zatt)
Executive (Zexe)
Language (Zlan)
Visuoperceptual (Zvis)
Memory (Zmem) Wechsler Memory Scale-III Forward Digit Span (WMS-III FDS)
Wechsler Memory Scale-III Backward Digit Span (WMS-III BDS)
1-min Category fluency (Animals)
Hooper Visual Organization Test (HVOT)
Rey Auditory Verbal Learning Test Learning (RAVLT Learning)
Trail Making Test- Part A (TMT-A)
Trail Making Test- Part B (TMT-B)
Boston Naming Test 60-Item version (BNT-60)
Rey Auditory Verbal Learning Test Retrieval (RAVLT Retrieval)
Rey Auditory Verbal Learning Test Retention (RAVLT Recognition)
Nature Medicine: doi:10.1038/nm.3466
Validation Subjects Profiled
CompletedParticipants
467
Completed Participants
394
Completed Participants
202
96 NC
53 aMCI/AD
18 Converters53 No Group
Discovery Subjects Identified
BaselineYear 1
Follow upYear 2
Follow upa.
Discovery Subjects Profiled
53 Matched NC
35 aMCI/AD
Participants Available
202
Completed Participants
525
Completed Participants
483
Completed Participants
426
Baseline
Completed Participants
335
Completed Participants
169
Completed Participants
26
b.
124 NC21 aMCI/AD
10 Converters150 No Group
Validation Subjects Identified
20 Matched NC
11 aMCI/AD
Year 1Follow up
Year 2Follow up
Year 3Follow up
Year 4Follow up
Year 5Follow up
Participants Available
295
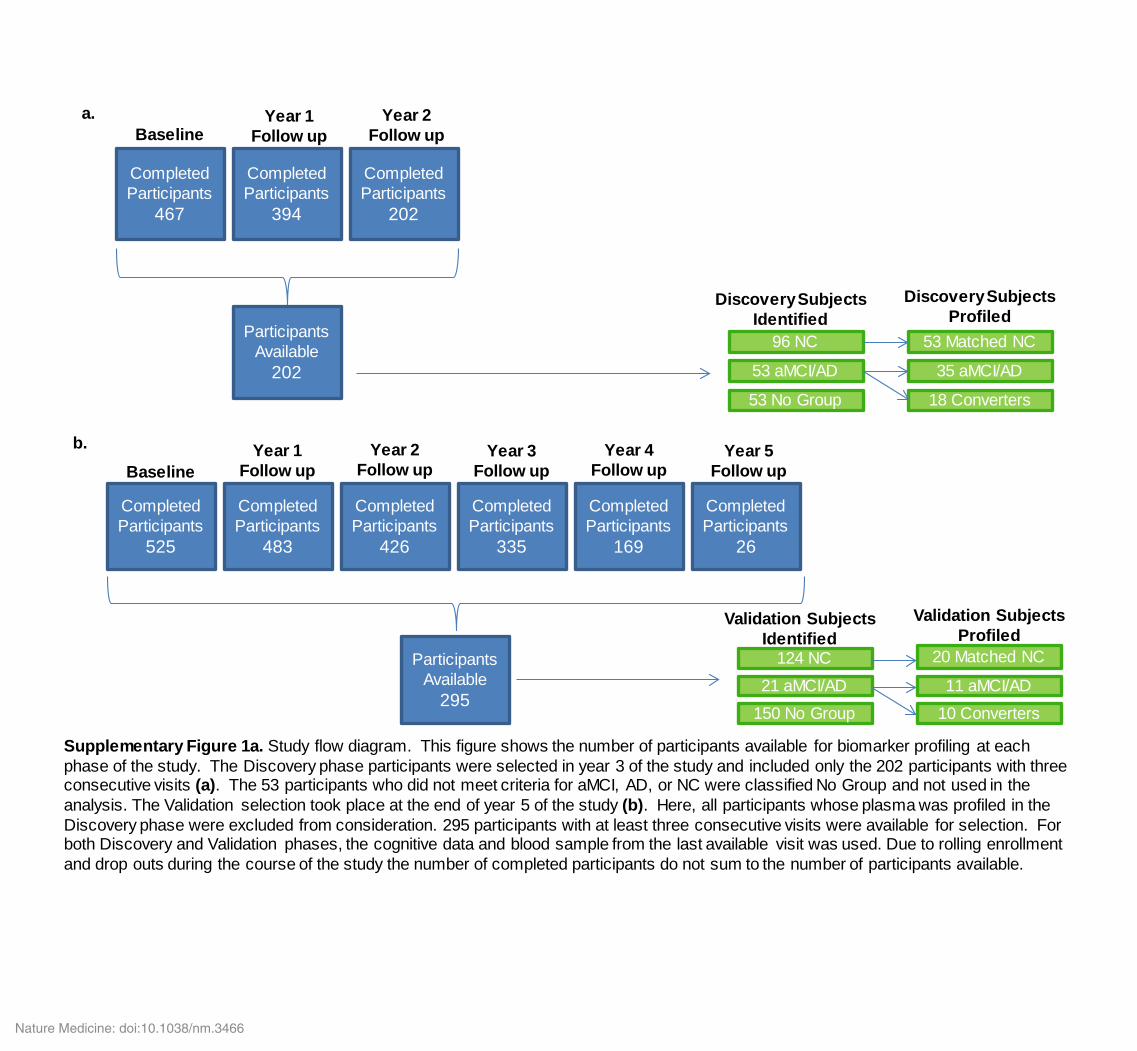
Supplementary Figure 1a. Study flow diagram. This figure shows the number of participants available for biomarker profiling at each phase of the study. The Discovery phase participants were selected in year 3 of the study and included only the 202 participants with three consecutive visits (a). The 53 participants who did not meet criteria for aMCI, AD, or NC were classified No Group and not used in the analysis. The Validation selection took place at the end of year 5 of the study (b). Here, all participants whose plasma was profiled in the Discovery phase were excluded from consideration. 295 participants with at least three consecutive visits were available for selection. For both Discovery and Validation phases, the cognitive data and blood sample from the last available visit was used. Due to rolling enrollment and drop outs during the course of the study the number of completed participants do not sum to the number of participants available.
Nature Medicine: doi:10.1038/nm.3466
IncidentaMCI/AD
N=35
Discovery Phase Validation Phase
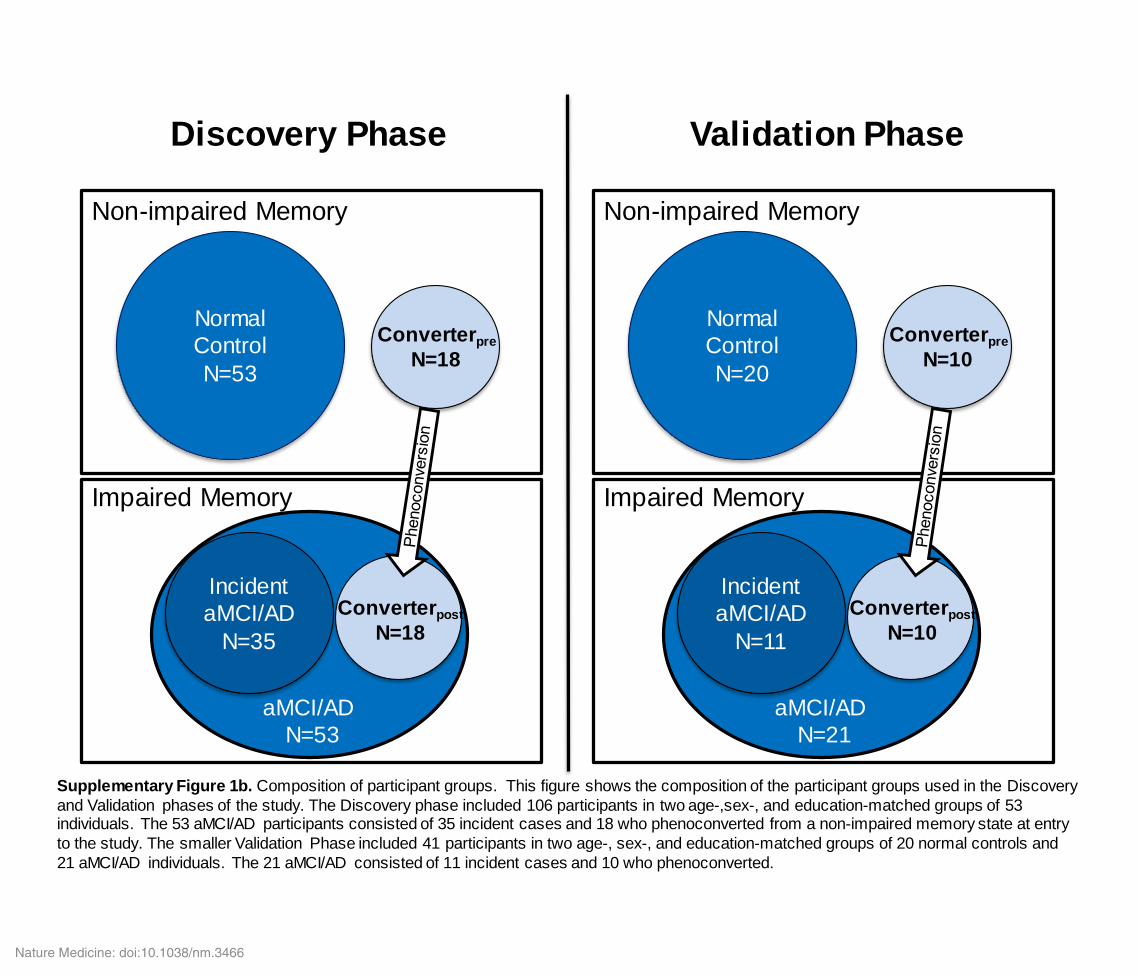
Supplementary Figure 1b. Composition of participant groups. This figure shows the composition of the participant groups used in the Discovery and Validation phases of the study. The Discovery phase included 106 participants in two age-,sex-, and education-matched groups of 53 individuals. The 53 aMCI/AD participants consisted of 35 incident cases and 18 who phenoconverted from a non-impaired memory state at entry to the study. The smaller Validation Phase included 41 participants in two age-, sex-, and education-matched groups of 20 normal controls and 21 aMCI/AD individuals. The 21 aMCI/AD consisted of 11 incident cases and 10 who phenoconverted.
Normal Control N=53
Non-impaired Memory
Impaired Memory
ConverterpreN=18
ConverterpostN=18
aMCI/AD N=53
IncidentaMCI/AD
N=11
Normal Control N=20
Non-impaired Memory
Impaired Memory
ConverterpreN=10
ConverterpostN=10
aMCI/AD N=21
Nature Medicine: doi:10.1038/nm.3466
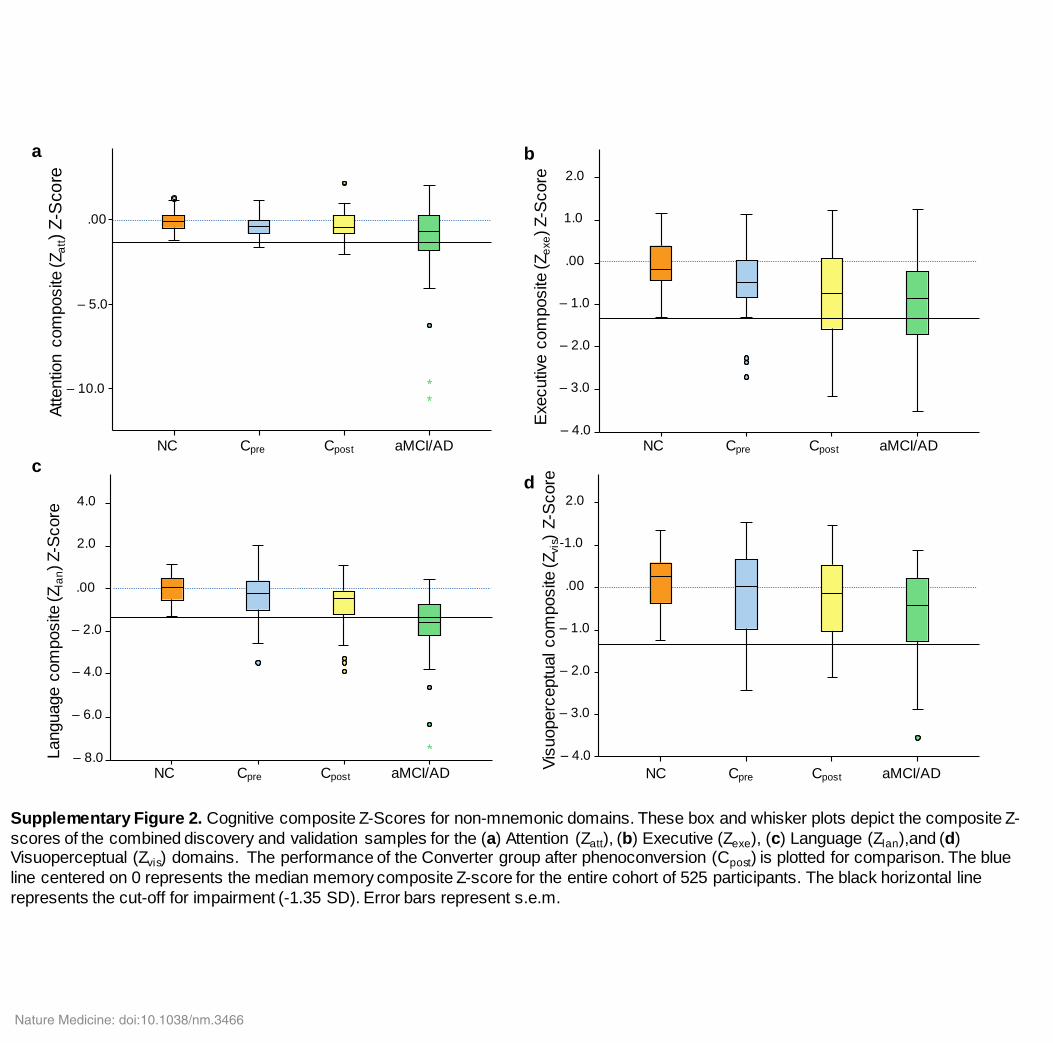
Supplementary Figure 2. Cognitive composite Z-Scores for non-mnemonic domains. These box and whisker plots depict the composite Z-scores of the combined discovery and validation samples for the (a) Attention (Zatt), (b) Executive (Zexe), (c) Language (Zlan),and (d) Visuoperceptual (Zvis) domains. The performance of the Converter group after phenoconversion (Cpost) is plotted for comparison. The blue line centered on 0 represents the median memory composite Z-score for the entire cohort of 525 participants. The black horizontal line represents the cut-off for impairment (-1.35 SD). Error bars represent s.e.m.
Atte
ntio
n co
mpo
site
(Zat
t) Z-
Sco
re
NC Cpre Cpost aMCI/AD
– 10.0
– 5.0
.00
Exe
cutiv
e co
mpo
site
(Zex
e) Z
-Sco
re
NC Cpre Cpost aMCI/AD– 4.0
– 3.0
– 2.0
– 1.0
.00
1.0
2.0
Visu
oper
cept
ualc
ompo
site
(Zvi
s) Z-
Sco
re
NC Cpre Cpost aMCI/AD– 4.0
– 3.0
– 2.0
– 1.0
.00
-1.0
2.0
a b
– 8.0
– 6.0
– 4.0
– 2.0
Lang
uage
com
posi
te (Z
lan)
Z-S
core
NC Cpre Cpost aMCI/AD
2.0
4.0
.00
cd
Nature Medicine: doi:10.1038/nm.3466
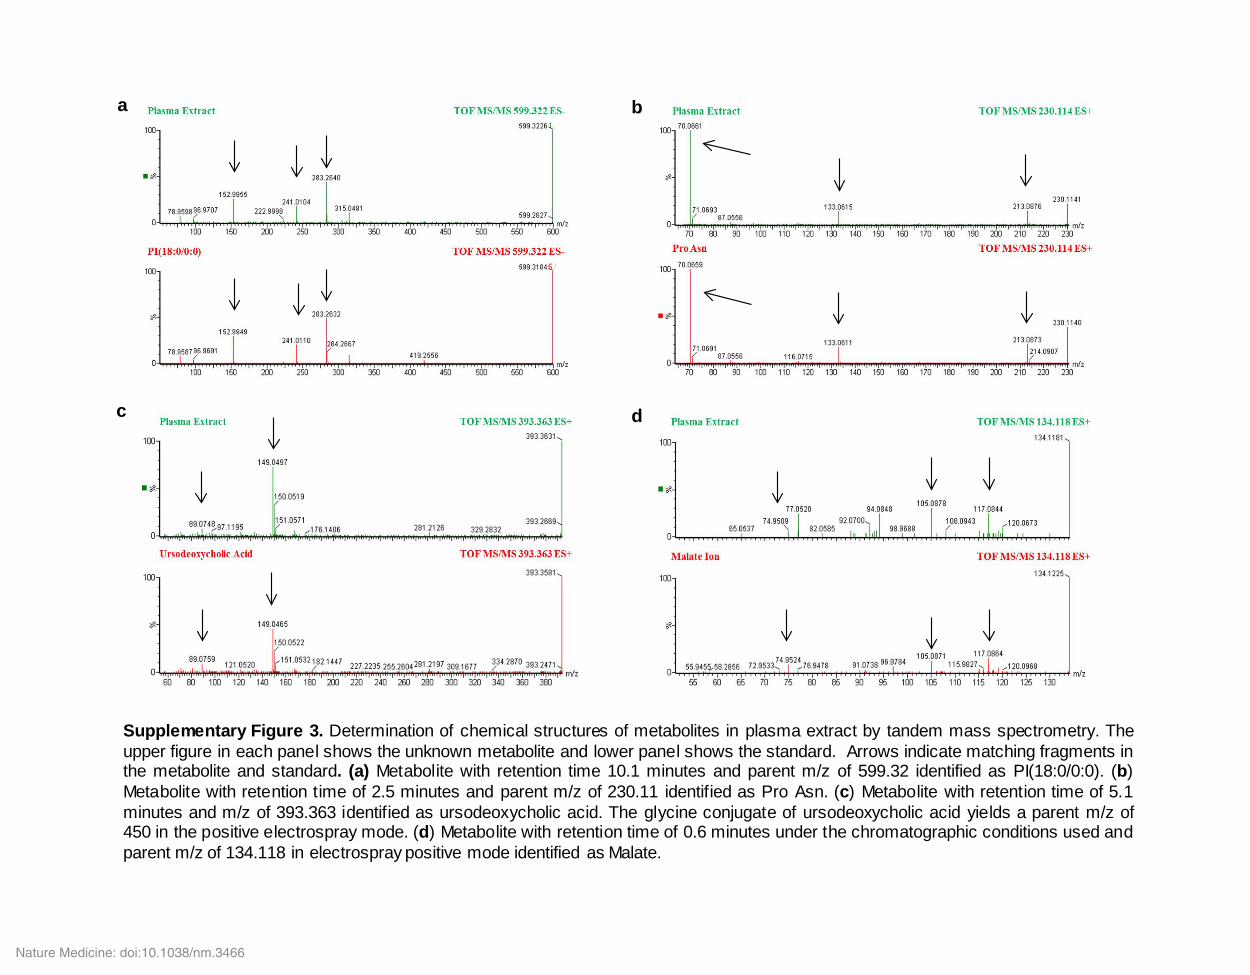
Supplementary Figure 3. Determination of chemical structures of metabolites in plasma extract by tandem mass spectrometry. Theupper figure in each panel shows the unknown metabolite and lower panel shows the standard. Arrows indicate matching fragments inthe metabolite and standard. (a) Metabolite with retention time 10.1 minutes and parent m/z of 599.32 identified as PI(18:0/0:0). (b)Metabolite with retention time of 2.5 minutes and parent m/z of 230.11 identified as Pro Asn. (c) Metabolite with retention time of 5.1minutes and m/z of 393.363 identified as ursodeoxycholic acid. The glycine conjugate of ursodeoxycholic acid yields a parent m/z of450 in the positive electrospray mode. (d) Metabolite with retention time of 0.6 minutes under the chromatographic conditions used andparent m/z of 134.118 in electrospray positive mode identified as Malate.
a b
c d
Nature Medicine: doi:10.1038/nm.3466
Nature Medicine: doi:10.1038/nm.3466
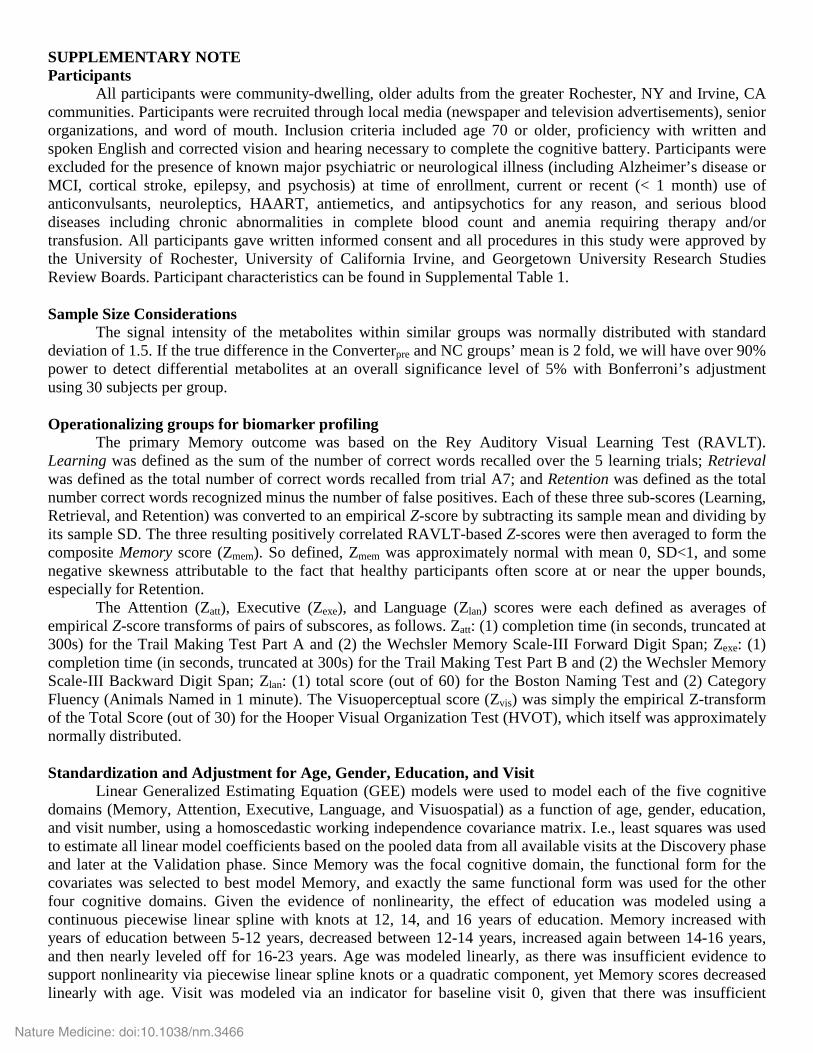
SUPPLEMENTARY NOTE Participants
All participants were community-dwelling, older adults from the greater Rochester, NY and Irvine, CA communities. Participants were recruited through local media (newspaper and television advertisements), senior organizations, and word of mouth. Inclusion criteria included age 70 or older, proficiency with written and spoken English and corrected vision and hearing necessary to complete the cognitive battery. Participants were excluded for the presence of known major psychiatric or neurological illness (including Alzheimer’s disease or MCI, cortical stroke, epilepsy, and psychosis) at time of enrollment, current or recent (< 1 month) use of anticonvulsants, neuroleptics, HAART, antiemetics, and antipsychotics for any reason, and serious blood diseases including chronic abnormalities in complete blood count and anemia requiring therapy and/or transfusion. All participants gave written informed consent and all procedures in this study were approved by the University of Rochester, University of California Irvine, and Georgetown University Research Studies Review Boards. Participant characteristics can be found in Supplemental Table 1. Sample Size Considerations The signal intensity of the metabolites within similar groups was normally distributed with standard deviation of 1.5. If the true difference in the Converterpre and NC groups’ mean is 2 fold, we will have over 90% power to detect differential metabolites at an overall significance level of 5% with Bonferroni’s adjustment using 30 subjects per group. Operationalizing groups for biomarker profiling
The primary Memory outcome was based on the Rey Auditory Visual Learning Test (RAVLT). Learning was defined as the sum of the number of correct words recalled over the 5 learning trials; Retrieval was defined as the total number of correct words recalled from trial A7; and Retention was defined as the total number correct words recognized minus the number of false positives. Each of these three sub-scores (Learning, Retrieval, and Retention) was converted to an empirical Z-score by subtracting its sample mean and dividing by its sample SD. The three resulting positively correlated RAVLT-based Z-scores were then averaged to form the composite Memory score (Zmem). So defined, Zmem was approximately normal with mean 0, SD<1, and some negative skewness attributable to the fact that healthy participants often score at or near the upper bounds, especially for Retention.
The Attention (Zatt), Executive (Zexe), and Language (Zlan) scores were each defined as averages of empirical Z-score transforms of pairs of subscores, as follows. Zatt: (1) completion time (in seconds, truncated at 300s) for the Trail Making Test Part A and (2) the Wechsler Memory Scale-III Forward Digit Span; Zexe: (1) completion time (in seconds, truncated at 300s) for the Trail Making Test Part B and (2) the Wechsler Memory Scale-III Backward Digit Span; Zlan: (1) total score (out of 60) for the Boston Naming Test and (2) Category Fluency (Animals Named in 1 minute). The Visuoperceptual score (Zvis) was simply the empirical Z-transform of the Total Score (out of 30) for the Hooper Visual Organization Test (HVOT), which itself was approximately normally distributed. Standardization and Adjustment for Age, Gender, Education, and Visit
Linear Generalized Estimating Equation (GEE) models were used to model each of the five cognitive domains (Memory, Attention, Executive, Language, and Visuospatial) as a function of age, gender, education, and visit number, using a homoscedastic working independence covariance matrix. I.e., least squares was used to estimate all linear model coefficients based on the pooled data from all available visits at the Discovery phase and later at the Validation phase. Since Memory was the focal cognitive domain, the functional form for the covariates was selected to best model Memory, and exactly the same functional form was used for the other four cognitive domains. Given the evidence of nonlinearity, the effect of education was modeled using a continuous piecewise linear spline with knots at 12, 14, and 16 years of education. Memory increased with years of education between 5-12 years, decreased between 12-14 years, increased again between 14-16 years, and then nearly leveled off for 16-23 years. Age was modeled linearly, as there was insufficient evidence to support nonlinearity via piecewise linear spline knots or a quadratic component, yet Memory scores decreased linearly with age. Visit was modeled via an indicator for baseline visit 0, given that there was insufficient
Nature Medicine: doi:10.1038/nm.3466
evidence that subsequent visits differed from each other, yet there was evidence that subsequent visits had higher Memory scores compared with baseline visit 0. Gender was modeled via an indicator for males, who had lower memory scores than females. There was insufficient evidence to support any interactions. Residuals from each model were then robustly standardized to have median 0 and robust SD=1, where the robust SD = IQR/1.35, as 1.35 is the IQR (Inter-Quartile Range) of a standard normal distribution. The choice to use robust measures of location (median) and dispersion (IQR) was made to reduce the influence that cognitively impaired participants might have on the mean and SD, and in recognition of the slight negative skewness of the residuals. The robustly standardized residuals were then viewed as age-gender-education-visit-adjusted robust Z-scores for each of the five cognitive domains. Defining aMCI/AD, Converters, and NC
For each subject, Zmem(last), Zatt(last), Zexe(last), Zlan(last), and Zvis(last) were defined as the age-gender-education-visit-adjusted robust Z-scores for the last available visit for each subject. We defined the aMCI/AD group to be those participants whose adjusted Zmem was 1 IQR below the median at their last available visit, i.e. Zmem(last) ≤ -1.35. Converters were defined as that subset of the MCI/AD group whose adjusted Zmem at baseline visit 0 was no more than 1 IQR below the median, i.e. Zmem(visit=0) > -1.35 and Zmem(last) ≤ -1.35. Participants were classified as NC if they had central scores on all domains at both the first and last visits, i.e. only if they met all of the following six conditions: (i) -1 < Zmem(last) < 1, (ii) -1 < Zmem(visit=0) < 1, (iii) Zmin(last) > -1.35, (iv) Zmin(visit=0) > -1.35, (v) Zmax(last) < 1.35, and (vi) Zmax(visit=0) < 1.35, where Zmax(last) and Zmax(visit=0) denote the maximum of the five adjusted Z-scores at the last and first visits, respectively. Zmem for normal participants had to be within 0.74 IQR (1 SD) of the median, rather than just 1 IQR (1.35 SD), in order to guarantee that they were > 0.25 IQR (0.35 SD) from aMCI/AD participants. Frequency matching aMCI/AD and NC on age, education, and sex
Comparing the distributions of age, education, and sex for participants classified as aMCI/AD and NC we observed that NC participants were younger. Given this, and given budget limitations for genetic profiling, we frequency matched NC participants to the aMCI/AD participants for each of the Discovery and Validation samples based on age, education, and sex. This was accomplished by stratifying the sample by four groups of age at the last visit (75-79, 80-85, 86-94, 95-100), three education groups (5-12, 13-18, 19-23), and two sexes (male, female), resulting in 24 age-education-sex strata. We randomly selected an equal number of NC participants to match the aMCI/AD participants per the strata for the Discovery sample and because one of the strata did not contain a sufficient number of NC participants, the Validation sample had one less NC subject than the aMCI/AD group. Blood Collection, Shipment, and Specimen Processing Protocols Collect Patient Vitals 1. Record date/time. 2. Collect and record height, weight, blood pressure, pulse and temperature. 3. Collect and record whether subject has had food/drink (except water) since midnight. 4. Record current medications/dosages.
Blood Draw 1. Draw 3 x 7 mL lavender top tubes and place on ice Transfer Samples to Laboratory 1. Lavender top tubes should be shipped/transferred on blue ice packs or wet ice, but not frozen. Upon
shipment arrival laboratory personnel will immediately process lavender top tube (see protocol below).
Nature Medicine: doi:10.1038/nm.3466
Shipment Protocol Supplies: paper tape for tube/bag sealing Styrofoam/sturdy outer box
absorbent material (paper towel) gel packs bubble wrap bag packing tape leakproof sealed bag “Exempt Human Specimen” labels 1. Keep lavender tubes after blood draw on ice (NOT FROZEN) prior to shipment. 2. Remove 2 small gel packs from freezer approximately 11/2 hours before shipping and thaw to refrigerator
temperature (~34 degrees) 3. Seal each tube at stopper with paper tape. Leave folded end tab on tape for easier removal 4. Wrap each tube individually with absorbent material and place in bubble wrap bag. Seal with tape. Place
all wrapped tubes in leakproof sealed plastic bag 5. Place cool/thawed gel packs in bottom of styrofoam box (with outer corrugated carton.) Lay wrapped
lavender tube bags on thawed gel packs. (Do not want lavender top tubes to freeze.) Fill all void space with paper to prevent product movement
6. Include a copy of collection form (in plastic) inside cooler. Tape styrofoam cooler box top closed with packing tape
7. Include copy of delivery information on top of styrofoam cooler. Close and securely seal outer box with pressure-sensitive plastic tape. Apply packing tape over all flaps and seams
8. Ship all samples on same day, via FedEx “Priority Overnight” for Next Day Morning Delivery Supplies - Blood Draw and Shipping Description VWR Catalog Number and Price VWR Koolit Gel 8oz CS72 33500-585 $10.57 VWR Gel 16 oz. 6x6x1 CS36 33500-587 $6.94 Container Molded 8x6x6.75 PK 12 33500-404 $75.14 (shipping box w/cooler) 6x8 inch 3/16in bubble pouch CS250 80082-635 $41.65 TC 6x9 ziploc bag pk 1000 80094-734 $23.17 Description Cardinal Catalog Number and Price 7-ml Lavender Tube B2991-52 $8.74 / 100 Sterile Gauze GZ2208-2 $4.00 / 50 21 g butterfly w/ adapter B3036-21 $38.39 / 50 23 g butterfly w/ adapter B3036-20 $38.39 / 50 Vacutainer Holder for tubes 364815 $5.49 / bag Latex Free Bandages BF3403 $4.77 / 100 Alcohol prep pad 40000-110 $1.39 / 200 Micropore tape 7246S $23.7 (12/box) Specimen bag (w/ pouch) 49-96 $32 / 1000 Plasma Specimen Processing Protocol 1) Remove paperwork and set of specimen tubes (3 lavender top tubes per patient) from package. Recycle
package and contents 2) Place lavender tubes in 15 ml centrifuge bucket and balance. Keep specimen sets together 3) Spin tubes at 2600 RPM (1500 x g) for 10 minutes at 20oC (Program 2) 4) Remove tubes from centrifuge and place in Bio Hood by decontaminating with 70% EtOH 5) Remove the 50 ml tube caps for a single specimen set and place face down on underpad 6) Carefully remove the paper tape from the set of specimen lavender tubes corresponding to step 6. Next,
remove purple caps by gently walking out the cap with Kimwipes. Place caps on stack of paper towels and save the Kimwipes
Nature Medicine: doi:10.1038/nm.3466
7) Collect plasma from each specimen tube with a 5 ml pipette (be careful not to disturb the buffy coat) and dispense into the 50 ml tube marked with a P. Recap P tube and place on ice.
8) Repeat steps 4 thru 7 as necessary for each specimen set 9) Remove P tube from ice and place in Bio Hood by decontaminating with 70% EtOH 10) Aliquot 25 µl of plasma onto a square of parafilm. Draw aliquot into a microcuvette by capillary action.
Measure and record hemoglobin level using the HemoCue Photometer 11) Aliquot 750 µl of plasma across the 2 ml pre-labeled plasma tubes until all of the collection is dispensed. 12) Place plasma aliquot 2 ml pre-labeled tubes into freezer rack. 13) Store the Plasma aliquots at -80oC.
Nature Medicine: doi:10.1038/nm.3466